


Trade costs matter for economic development (Anderson and Van Wincoop Reference Anderson and Van Wincoop2004). Economists and economic historians have studied the effects of political and cultural borders on trade costs, but rarely in the presence of changing political borders (Engel and Rogers Reference Engel and Rogers1996; Anderson and Van Wincoop Reference Anderson and Van Wincoop2003; Schulze and Wolf Reference Schulze and Wolf2009, Reference Schulze and Wolf2012; Fenske and Kala Reference Fenske and Kala2021). In this article, we use the creation of a paradigmatic multi-ethnic state, Yugoslavia, and a novel large dataset of grain prices to examine whether the effect of ethnic identity on trade costs persists when borders change.Footnote 1
Yugoslav unification removed the political and tariff borders dividing South-Slavs. After WWI, recently independent Serbia and Montenegro joined several former Austro-Hungarian territories to form Yugoslavia (see Figure 1).Footnote 2 The creation of Yugoslavia brought together multiple ethnic groups, including Orthodox Serbs, Catholic Croats and Slovenes, and a large Muslim population, under the umbrella of a shared South-Slavic identity.Footnote 3 This historical setting allows for gaining insights into the interaction between border changes, ethnic ties, and trade costs.
MAP OF INTERWAR YUGOSLAVIA, ILLUSTRATING SAMPLE CITIES AND THE PRE-WAR BORDER
Notes: A circle, rectangle, or triangle indicates whether a sample city is available in the pre-war, interwar, or in both periods, respectively.
Source: Authors’ illustration.

We compile a comprehensive new panel dataset to study market integration in the decades before (1889–1913) and after (1922–1928) Yugoslav unification (1918). We take non-random deviations from the Law of One Price as an indicator of market segmentation.Footnote 4 We analyze over 550,000 city-pair price gaps spanning the area. We code a border variable that indicates whether a city-pair was separated by the pre-unification border (treated sample) or not (control sample). We rely on religious affiliation to identify differences between the main ethno-religious groups within Yugoslavia. To control for other observable determinants of trade costs, we estimate transport costs and measure import tariffs.
Our empirical strategy proceeds in three steps. First, we estimate the border effect. Controlling for time-varying observable determinants of trade cost and fixed city characteristics, we regress city-pair price gaps on the border indicator variable. The inclusion of pre- and post-unification data make for a clean identification of the border effect and distinguishes this study from most of the literature on borders, which typically relies on cross-sectional estimation. We find that crossing the border between Serbia and Austria-Hungary significantly increased price gaps before WWI. The size of this border effect was somewhat larger than those found in other studies that use price gaps to estimate trade costs in the present day (Broda and Weinstein Reference Broda and Weinstein2008; Versailles Reference Versailles2012; Brenton, Portugal-Perez, and Régolo Reference Brenton, Portugal-Perez and Régolo2014).Footnote 5 After unification, however, this large border effect vanished.
In the second step, we examine whether the effect of ethno-religious ties on trade costs was persistent. We do so by introducing a measure of ethno-religious differences into the described border equation.Footnote 6 We find that ethno-religious differences initially significantly increased trade costs, but their influence vanished over time. We also track how accounting for ethno-religious differences impacts the estimated border coefficient. Controlling for ethno-religious ties accounts for a large share—about 30 percent—of the border effect in pre-unification Yugoslavia. These results are robust across grains, various samples, the inclusion of additional controls, and the use of alternative measures of ethnicity.
In the final step, we explore mechanisms behind the changing role of ethno-religious ties on trade. We observe that the effect of ethno-religious differences had virtually disappeared already 16 years before the unification of Yugoslavia. The decline is visible in city-pairs that were separated by the pre-unification border. On the one hand, these patterns support the hypothesis that the ethnic effect vanished in part because the establishment of Yugoslav courts and laws regulating trade weakened the incentive to rely on ethnic ties to mitigate the risk of opportunistic behavior (compare, Greif Reference Greif2000). Yet, that the transition took place so much earlier than unification demonstrates that this factor is not sufficient. Our complementary hypothesis is that Yugoslav unification nationalism, which, according to the historical literature, intensified on both sides of the border around the turn of the twentieth century, was a crucial unifying factor.Footnote 7 Indeed, a phase of mass mobilization typically precedes the formation of a new nation-state (Hroch Reference Hroch2000).
Our findings have implications for several debates in economics and economic history. First, we contribute to research on the cultural roots of border effects. The “border effect” is an old puzzle in economics: borders impede trade beyond observable trade costs (McCallum Reference McCallum1995; Engel and Rogers Reference Engel and Rogers1996). Recent studies have found that culture biases economic exchange (Guiso, Sapienza, and Zingales Reference Guiso, Sapienza and Zingales2006, Reference Guiso, Sapienza and Zingales2009), and that accounting for the impact of ethnic diversity on trade reduces the border effect (Schulze and Wolf Reference Schulze and Wolf2009, Reference Schulze and Wolf2012; Aker et al. Reference Aker, Klein, O’Connell and Yang2014; Robinson Reference Robinson2016). This is because, as also shown elsewhere, cultural differences undermine trust and increase transaction costs (Felbermayr and Toubal Reference Felbermayr and Toubal2010; Gokmen Reference Gokmen2017; Fenske and Kala Reference Fenske and Kala2021).Footnote 8 While we confirm these findings, we also highlight that the extent to which ethnic diversity impedes trade across political borders varies over time.
Second, our article investigates the mechanisms underlying changes in the commercial role of ethnic ties. Several works have noticed how the role of ethnic ties in trade can change across space and time.Footnote 9 To explain this pattern, nearly all scholars assume stable ethnic identities, and to explain their changing roles, argue that the utility of ethnic ties depends on context. For instance, for Richman (Reference Richman2017), international ties between Jewish diamond traders were particularly beneficial in the absence of public order institutions disincentivizing opportunistic behavior (see also Greif Reference Greif2000).Footnote 10 Our findings support the idea that ethno-religious ties lost significance because Yugoslav unification made it possible for grain traders to rely on national courts to enforce contracts. However, they suggest that a supplementary mechanism also played a crucial role: a political movement—Yugoslav unification nationalism—altered ethnic identities.Footnote 11
Third, there is broad consensus that the spatial distribution of ethnic groups in an economy is a key determinant of its development (Alesina and La Ferrara Reference Alesina and La Ferrara2005; Ottaviano and Peri Reference Ottaviano and Peri2006; Ezcurra and Rodríguez-Pose Reference Ezcurra and Rodríguez-Pose2017; Montalvo and Reynal-Querol Reference Montalvo and Reynal-Querol2021). However, the extent to which ethnic identity is stable remains contested. Two radically different perspectives on this question can be distinguished: cultural persistence and social identity. Guiso, Sapienza, and Zingales (Reference Guiso, Sapienza and Zingales2006), Alesina, Giuliano, and Nunn (Reference Alesina, Giuliano and Nunn2013), and Giuliano and Nunn (Reference Giuliano and Nunn2021), for example, emphasize how culture is remarkably persistent as individuals value tradition and learning is costly. In consequence, cultural traits, such as ethnic identities, acquired in the distant past still have a powerful impact on economic development today.Footnote 12 This view agrees with an emphasis in the trade literature on how ethnic or linguistic ties tend to be persistent or only slowly changing (Guiso, Sapienza, and Zingales Reference Guiso, Sapienza and Zingales2009; Schulze and Wolf Reference Schulze and Wolf2009, Reference Schulze and Wolf2012; Head, Mayer, and Ries Reference Head, Mayer and Ries2010; Aker et al. Reference Aker, Klein, O’Connell and Yang2014; Beestermöller and Rauch Reference Beestermöller and Rauch2018; Fenske and Kala Reference Fenske and Kala2021). The perspective of social identity, by contrast, stresses that group identity is not fixed (Sambanis and Shayo Reference Sambanis and Shayo2013; Shayo Reference Shayo2020; Atkin, Colson-Sihra, and Shayo Reference Atkin, Colson-Sihra and Shayo2021). In this view, individuals choose the group with which they mainly identify depending on potentially rapidly changing factors: perceived cultural distance and groups’ status. Our results are consistent with the social identity perspective that equilibria can change swiftly: ethnic boundaries initially segmented markets, but this effect vanished over time as individuals embraced a Yugoslav ethnic identity that trumped ethno-religious differences.
Fourth, our analysis is also relevant to the burgeoning literature on nation-building. Recently, scholars have examined how and why political elites seek to influence patterns of ethnic identity with policies of nation-building (Bandiera et al. Reference Bandiera, Mohnen, Rasul and Viarengo2019; Alesina, Reich, and Riboni Reference Alesina, Reich and Riboni2020; Alesina, Giuliano, and Reich Reference Alesina, Giuliano and Reich2021; Giuliano, Reich, and Riboni Reference Giuliano, Reich and Riboni2022). Econometric investigations have also looked at the effects, showing that nation-building policies can foster the formation of inclusive national identities, inter-ethnic marriage, and cooperation (Miguel Reference Miguel2004; Bazzi et al. Reference Bazzi, Gaduh, Rothenberg and Wong2019; Depetris-Chauvin, Durante, and Campante Reference Depetris-Chauvin, Durante and Campante2020; Kukić Reference Kukić2023; Rohner and Zhuravskaya Reference Rohner and Zhuravskaya2023; Kersting and Wolf Reference Kersting and Wolf2024). Economic variables, however, have received scant attention. We follow in the footsteps of Schulze and Wolf (Reference Schulze and Wolf2009, Reference Schulze and Wolf2012), who stress that nationalism can directly affect trade costs, even before nation-states are formed. We take this argument a step further by showing that economic integration along national lines progressed even for unification movements. Crucially, we map out the geography of integration also after the formation of the new nation-state. Our results suggest that the effects of Yugoslav nationalism stabilized after unification: we find an international border effect significantly larger than the internal border effect that Schulze and Wolf (Reference Schulze and Wolf2009, Reference Schulze and Wolf2012) estimate.
Lastly, we contribute to the literature on the economic consequences of the dissolution of the Habsburg Empire. Wolf, Schulze, and Heinemeyer (Reference Wolf, Schulze and Heinemeyer2011) and generations of historians before them studied the disintegration of the former Habsburg lands after 1918. However, while Austria-Hungary fell apart, most of its former constituent parts integrated with other territories into new national markets. Whereas others have examined the economic impact of new international borders, we are the first to systematically assess the extent of market integration within the newly created or enlarged nation-states both before and after WWI.Footnote 13 Our results suggest that, overall, this integration process was rapid and remarkably successful in Yugoslavia. In doing so, our results cast a new light on Yugoslav cooperation by telling the untold success story of early integration.Footnote 14
HISTORICAL BACKGROUND
Political Borders
For centuries, South Slavic peoples lived in Central and South-Eastern Europe under Habsburg or Ottoman imperial rule. Serbs and Montenegrins were the first to establish independent nation-states before the turn of the twentieth century. Croatia and current-day Slovenia remained part of the dual monarchy of Austria-Hungary, which first occupied (1878) then annexed Bosnia-Herzegovina (1908). At the end of WWI, Austria-Hungary collapsed. On 29 October 1918, the Yugoslav National Council in Zagreb declared independence from the monarchy and proclaimed the State of Slovenes, Croats, and Serbs. Only a month later, on 1 December 1918, the State joined Serbia and Montenegro to form the Kingdom of Serbs, Croats, and Slovenes. The new Kingdom was proclaimed in Belgrade. Its name accommodated the largest ethno-religious groups in the country. In 1929, the Kingdom was officially renamed Yugoslavia, the name by which it had been colloquially known since its inception.
The creation of Yugoslavia removed political and administrative borders that had previously separated its peoples and territories. At the same time, Austria-Hungary was split into a number of successor states, and newly erected borders divided a previously unified area. Consequently, Habsburg territories that became part of Yugoslavia lost tariff-free access to a lion’s share of the large Austro-Hungarian market, but gained such access to Serbian and Montenegrin markets.
Figure 1 maps Yugoslavia in its interwar borders, highlighting former Austro-Hungarian territories in gray. On the eve of WWI, a 600-kilometers-long border separated South Slavs living under different jurisdictions. To the North, Serbia bordered Croatia-Slavonia and Hungary. To the West, both Serbia and Montenegro shared a border with Bosnia-Herzegovina. In the South, a narrow border separated Montenegro from Dalmatia, a former Austrian province.
In 1900, Serbia had 2.5 million inhabitants, of which 90 percent were Serbs.Footnote 15 Another two million or so Serbs lived across the border in Austria-Hungary. With a population of 200,000, Montenegro was tiny in comparison to Serbia. In the Balkan Wars of 1912 and 1913, the Ottoman Empire was driven out of Europe, and Serbia expanded its territory southward to include Kosovo and present-day North Macedonia. At the same time, Serbia and Montenegro partitioned the administrative district Sanjak of Novi Pazar. The new Serbian territories, known as South Serbia, were a multi-ethnic region inhabited by both Christian and Muslim populations.
Around 1900, approximately 2.9 million Croats lived in Austria-Hungary, mostly in the Kingdom of Croatia-Slavonia, which enjoyed autonomy within imperial Hungary, and in the Austrian provinces of Dalmatia and Istria. Croats also lived in southern Hungary and Bosnia-Herzegovina, which constituted a separate part of the empire jointly administered by Austria and Hungary. In 1900, it comprised 1.3 million South Slavs, of which 43 percent were Orthodox Christians, 35 percent Muslim, and 21 percent Roman Catholic. Some 1.3 million Slovenes, the third largest ethno-religious group of the future Yugoslavia, were clustered in several Austrian crown lands, most of which were ceded to the Yugoslav state in 1918.
Ethnic Relations
South Slavs are linked by their language and cultural kinship. Since the early nineteenth century, intellectuals and social elites have believed that it would be possible to create a united South Slav nation based on shared descent, language, and culture. It took a century, however, for the idea to gain mass support. In the meantime, the Yugoslav idea had to compete against Croatian and Serbian nationalism and was repressed by the Austro-Hungarian Empire.
The Yugoslav idea began to evolve among Croat intellectuals and aristocrats.Footnote 16 Its origins can be traced back to the 1830s and the Illyrian movement, which adopted an early-modern view that Croats, Serbs, and Slovenes originated from an ancient people, the Illyrians, and propagated the vision of all South Slavs as a single nation, since they spoke the same language. They supported the Vienna Literary Agreement (1850), which standardized the Serbo-Croatian language based on the Štokavian dialect spoken by most Croats and all Serbs, Montenegrins, and Bosnians. In the 1860s, Illyrianism gave way to Yugoslavism. Josip Juraj Strossmayer, a Croatian Catholic bishop, and Franjo Rački, a Croat-German liberal politician and historian, led the new movement. The Yugoslavists’ manifesto, Jugoslovjenstvo, claimed that Croats, Serbs and possibly Slovenes, despite their historical conditions and different religions, formed part of a single primordial nation, united by common descent and shared history. Yugoslavists founded the Yugoslav Academy of Sciences and Arts in Zagreb, aiming to make it the central scientific and artistic institution of all South Slavs.
Yet there were other unifying ideas.Footnote 17 While the Yugoslavists called for the formation and autonomy of the “Triune Kingdom of Croatia, Slavonia, and Dalmatia,” Croatian nationalists demanded the creation of an exclusively Croatian nation-state outside of Austria-Hungary. They opposed the idea that South Slavic peoples had a national identity of their own and claimed that Serbs and Slovenes were essentially also Croats. Serbian nationalists envisioned an enlarged Serbia that would liberate territories under foreign rule where Serbs had lived. Many of them perceived an independent Serbia as their “Piedmont,” which had the potential to unify all Serbs in one country.
In the decade before WWI, South Slavic ethnic relations entered a “new course.”Footnote 18 The overthrow of the Obrenović dynasty in Serbia in 1903 and the creation of a popular government within a constitutional monarchy opened room for increased South-Slav cooperation. Politicians, academics, lawyers, bankers, entrepreneurs, and students supported this new course. In November 1905, Croat and Serb political parties agreed to close cooperation and a shared political program. The Croat-Serb coalition won the majority of votes in the 1906 and 1908 elections in the Croatian-Slavonian Diet. In 1909, the Yugoslav Academy in Zagreb, together with Serb and Slovene partners, commenced work on a “Yugoslav Encyclopedia.” In the same year, the first Pan-Yugoslav conference of South-Slav socialists took place. Social mobilization was evident in the founding of civil society organizations, charities, reading groups, choirs, athletic clubs, professional, youth, and women’s associations. The athletic Sokol (meaning falcon) movement promoted the idea of South Slavic unity and became the backbone of Yugoslavism.
As South-Slav cooperation increased, Vienna and Budapest went on the offensive to solve the “South-Slav question” in their favor. In 1906, Austria-Hungary offered Serbia an unfavorable trade agreement (Djordjević Reference Djordjević1962). In 1908, the Austro-Hungarian annexation of Bosnia-Herzegovina made the 30-year occupation permanent, which angered many South Slavs within and beyond Austria-Hungary. In 1909, Habsburg prosecutors falsely accused Croat-Serb political coalition members of treason, presenting forged evidence (Calic Reference Calic2019, pp. 40–46). These Austro-Hungarian actions further fueled cooperation among South Slavs who increasingly saw the Empire as a common threat.
Political elites laid the groundwork for Yugoslav unification during WWI.Footnote 19 The Yugoslav Committee, officially founded in 1915 in Paris, was an interest group formed by exiled Croatian and Serbian politicians from Austria-Hungary with the aim of creating an independent South Slavic state. The Corfu Declaration (1917), signed by the prime minister of Serbia, Nikola Pašić, and the president of the Yugoslav Committee, Ante Trumbić, established a provisional blueprint for unifying a common state of the South Slavs living in Serbia, Montenegro, and Austria-Hungary after the Great War. It declared Serbs, Croats, and Slovenes to be “one and the same people, known under three different names.” It was agreed that the future State of the Serbs, Croats, and Slovenes would become a constitutional, democratic, and parliamentary monarchy, under the Serbian Karadjordjević dynasty, with guaranteed universal male suffrage, territorial indivisibility, religious freedom, and full legal equality for the Latin and Cyrillic alphabets within the “united nation.” A major open question was whether the new state would be centralized or federal, but it was agreed to negotiate these constitutional details later.
Meanwhile, WWI forced many South Slavs to fight on opposite sides. Whether and how this helped or hindered forging a common Yugoslav identity (and/or fostered the rise of anti-Habsburg sentiment) is unclear. Yet, from the moment of Austria-Hungary’s defeat, the Serbian army pushed into Habsburg territory, aided by ex-Habsburg, mainly Croatian and Slovenian soldiers. Moreover, in the autumn of 1918 and spring of 1919, Slovene and Serbian soldiers jointly engaged in military actions in the Austrian state of Carinthia, where they fought against Austrians resisting annexation (Gerwarth Reference Gerwarth2016, pp. 195–96). Therefore, for much of the war, imperial loyalties trumped national loyalties, but with imperial defeat the balance shifted in favor of nationalist allegiance.
Defeat in WWI sealed the fate of the Austro-Hungarian Empire. The nationalist movements that had sprung up in its midst, including the South Slavic one, took the opportunity to form new nation-states in 1918, giving their success the appearance of inevitability. In reality, Yugoslav identity was a work in progress (Wachtel Reference Wachtel1998, p. 68).
The first Yugoslav parliamentary elections, held in 1920 across its territory, revealed the political sentiment in the new country. The elections introduced universal suffrage for adult males across the entire area of Yugoslavia (Calic Reference Calic2019, p. 78).Footnote 20 The pro-unification Yugoslav Democratic Party won the relative majority of votes. This party, formed in 1919 by former members of the pre-war Croat-Serb Coalition, advocated an integral Yugoslav nation and a strong centralized democratic state (Calic Reference Calic2019, p. 80). Serbian and Croatian national political options ranked second and third (People’s Radical Party and Croatian Republican Peasant Party). While most parties had local support, the pro-Yugoslav party gathered votes across the country.
Both the state and independent intellectuals played a role in Yugoslav nation-building (Wachtel Reference Wachtel1998, p. 94). The works of intellectuals highlighted the unity of Yugoslav literature and trickled down to state-approved school textbooks, which attempted to build, or even prove, the existence of a Yugoslav national identity (Wachtel Reference Wachtel1998, p. 99). Pro-Yugoslav public intellectuals, such as the Croatian sculptor Ivan Meštrović or writer Ivo Andrić, made visible artistic contributions to Yugoslav cultural identity (Wachtel Reference Wachtel1998, pp. 108–27). Still, a major point of contention in the new Kingdom was its political organization—mostly Serbian politicians wanted a strong central state, while those from the former Habsburg lands advocated federalism.Footnote 21 While political compromise eluded interwar Yugoslavia (Djokić Reference Djokić2007), even the most adamant federalists did not reject a common Yugoslav identity (Djokić Reference Djokić and Djokić2003, p. 144). Yugoslavia’s resurrection after WWII—following its wartime occupation and partitioning by Axis powers—testifies to the progress made in Yugoslav pre-war nation-building (Wachtel Reference Wachtel1998, p. 126).
Ethnic relations played a crucial role in the grain trade. In Central and Eastern Europe, from the middle of the nineteenth century, agricultural cooperatives organized along exclusionary ethnic lines became increasingly powerful actors in the grain trade, replacing Jewish middlemen (Lorenz Reference Lorenz and Lorenz2006). By the late nineteenth century, the movement was in full swing also in the Balkans (Calic Reference Calic, Oberländer, Lemberg and Sundhaussen1993; Lorenz Reference Lorenz and Lorenz2006, pp. 24–25). Thus, within Croatia, Vladimir Matijević and other ethnic-Serbian entrepreneurs from Austria-Hungary founded the Association of Serbian Agricultural Cooperatives (Savez srpskih zemljoradničkih zadruga) in Zagreb in 1898. This initiative followed the Main Association of Serbian Agricultural Cooperatives (Glavni savez srpskih zemljoradničkih zadruga), which originated in Smederevo in 1895 and moved to Belgrade in 1898 (Gnjatović Reference Gnjatović2010, p. 22). In 1902, the Croatian Agricultural Bank was founded, bringing together all Croatian cooperatives (Mataga Reference Mataga2005, p. 25). Clergymen were often in charge of agricultural cooperatives (Lorenz Reference Lorenz and Lorenz2006, p. 26), which can thus be expected to have segmented grain markets along religious lines.
After the turn of the century, Yugoslav sentiment was making headway into rural constituencies. The Croatian Republican Peasant Party, founded by the Radić brothers in 1904, translated problems of rural society into issues of national importance, and thus, won over broader segments of the population for the goal of creating an independent Croatian or Yugoslav state (Calic Reference Calic2019, p. 43). Agricultural cooperatives figured prominently in the party’s political program (Mataga Reference Mataga2005, pp. 23–24). Widespread support of their program thus suggests that Croatian agricultural cooperatives were open to the possibility of supporting a Yugoslav state. The picture is clear after WWI: just as in other new Eastern European countries, in Yugoslavia the state sought to break the hold of ethnic minorities on cooperatives to promote nationwide economic relations (Calic Reference Calic, Oberländer, Lemberg and Sundhaussen1993; Lorenz Reference Lorenz and Lorenz2006, p. 31).
Trade
Already before WWI, future Yugoslav territories engaged in significant trade. Serbia exported agricultural goods and imported Austrian and Hungarian manufactures. The majority of Serbian exports consisted of grains and livestock. Grains alone accounted for about a third of Serbia’s total exports in 1911 (Lampe and Jackson Reference Lampe and Jackson1982, p. 169). Physical and economic geography conditioned this trade. Landlocked Serbia could not reach distant markets via sea, but primarily traded with large, neighboring Austria-Hungary. From the 1870s until 1905, no less than 86 percent of Serbian exports went to the Habsburg Empire (Lampe and Jackson Reference Lampe and Jackson1982, p. 174). Trade statistics for this period report that Austria-Hungary imported a steadily increasing volume of grain from Serbia.Footnote 22
Since 1881, ten-year bilateral treaties regulated Austro-Hungarian and Serbian trade relations. After several short-term extensions, the 1892 bilateral treaty expired in March 1906, and a provisional four-month agreement increased tariffs on trade. Since the two parties failed to reach an agreement by June 1906, now the even less favorable Austrian general tariff applied to Serbian exports. Negotiations reopened, and an agreement was reached in August 1908; however, the crisis over the annexation of Bosnia-Herzegovina prevented the treaty from being ratified. In July 1910, the parties reached a definitive trade agreement, which effectively re-established the terms of the 1908 agreement and kept tariffs relatively high until WWI. This dispute over a new long-term trade agreement later became known as the Customs War.Footnote 23 During the latter, trade between Austria-Hungary and Serbia did not cease. From 1906 to 1910, on average, Austria-Hungary still represented 28 percent of Serbian exports, and already in 1911 the export share increased to 41 percent (Lampe and Jackson Reference Lampe and Jackson1982, p. 174). There are no statistics on trade within the Kingdom of Yugoslavia. However, as we shall document in the results section, trade frictions saw a large decline following the removal of tariffs and the border separating Serbian from other cities. Hence, trade flows were bound to intensify significantly.
DATA
The Sample
To measure market integration, we use a well-tested approach and look at price ratios between cities to detect deviations from the Law of One Price (Federico Reference Federico2012).Footnote 24 The rationale is that price gaps cannot exceed trade costs for very long, as they give rise to arbitrage opportunities when they do. Specifically, we consider wholesale grain markets, which are particularly well documented in the sources.
The sample includes grain prices from a total of 173 cities in the years 1889–1913 and 1922–1928. The spatial distribution of the sample cities, illustrated in Figure 1, entails broad geographical coverage of Yugoslavia. Across the pre-war and interwar periods, our sample is more or less evenly split between cities that had been part of the Austro-Hungarian Empire (68 percent and 56 percent of the sample, respectively) and cities that had been part of the Kingdom of Serbia (32 percent and 44 percent of the sample, respectively).Footnote 25 There are data for 135 cities in the pre-war period and 66 cities in the interwar. For 28 cities, we have data covering both the pre-war and the interwar. We start about a quarter of a century before the war, around the time one of the first censuses collecting ethnic data in our area was published. This is also early enough to have sufficient observations to identify effects of political and ethno-religious borders. Data collection was interrupted during the war and the first years of the new kingdom. We end before the Great Depression and the introduction of price controls (Pertot Reference Pertot1937).
Table 1 reports sample summary statistics. Our dataset is nearly evenly split between treatment group city-pairs that were divided by the pre-unification border and control group city-pairs that this border never divided. As expected, price ratios were higher on average in the treated city-pairs than in the control ones, as the latter, as well as never facing a border and the associated tariffs, were also better connected by transport. The means show that the control group city-pairs were significantly more similar in terms of religion than the treated ones, but the standard deviations show that the variation of religious similarity was no less marked. We also include figures for a restricted sample of city-pairs which have price gaps greater than observable trade costs (transport costs plus tariffs) (see next section for details on this restricted sub-sample). In the restricted sample, transport costs tend to be significantly lower than in the full sample, but otherwise the summary statistics are similar.Footnote 26
SAMPLE SUMMARY STATISTICS

Table 1 Long description
The table presents summary statistics for various samples, including treatment, control, and restricted groups. It has 12 rows and 7 columns. The columns are labeled Variable, Sample, N, Mean, Std. Dev., Min., and Max. The variables include Price ratio, Transport (1925/6 dinar/quintal), Tariff (dinar/quintal), and Religious similarity. Each row provides specific values for these variables across different samples. For example, the Price ratio for the All sample has a mean of 1.297, a standard deviation of 0.305, a minimum of 1, and a maximum of 8. The table also includes detailed statistics for Treatment, Control, and Restricted samples, showing variations in mean, standard deviation, minimum, and maximum values for each variable.
Notes: Std. Dev. = standard deviation, Min. = minimum, Max. = maximum. Price ratios are computed with the higher price in the numerator. City-pairs in the treatment sample were separated by the pre-unification border; city-pairs in the control sample were not.
Source: Authors’ calculation.
Grain Prices
Grains are relatively homogeneous commodities; thus, in contrast to manufactures, the comparison of their prices suffers from relatively little noise. Another implication of homogeneity is that marked differences can be expected in the role of ethnic networks in domestic and international trade. On the one hand, information asymmetries that cut across these two types of trade are not particularly relevant for grains, which had known “reference prices” attached to easily identified qualities. On the other hand, ethnic networks could still potentially mitigate obstacles to credible commitments to respect trade contracts and agreements, which were comparatively relevant for international trade. Indeed, historical research has shown that European grain traders relied on ethnic networks to obtain favorable conditions (Andreoni et al. Reference Andreoni, Paço, Mocarelli and Ongaro2024). In Eastern Europe, in particular, one of the key objectives of agricultural cooperatives was to replace Jewish middlemen and keep commercial profits within their ethnic community (Lorenz Reference Lorenz and Lorenz2006, pp. 37–38). We can thus expect, for example, Serbian grain traders to have charged higher prices when buyers were from other ethnic groups. However, an equivalent effect, higher grain prices in cities with no significant Orthodox presence, would obtain because of their exclusion from the Serbian trading network. In addition, as stressed also by Schulze and Wolf (Reference Schulze and Wolf2009, p. 118), since grains are primary products, their prices are not affected by difficult-to-observe input-output linkages that can contribute to creating border effects.
We collect annual current wholesale price data for six types of grain (wheat, corn, rye, spelt, barley, oats) from period official statistics, published by Austrian, Hungarian, Croatian-Slavonian, Serbian, and Yugoslav authorities.Footnote 27 We convert all prices into dinars per 100 kg to ensure comparability both in the cross-section and over time. In the original sources, grain prices for cities in pre-war Serbia and all cities in Yugoslavia are given in dinars per 100 kg, and in cities in Croatia-Slavonia, Dalmatia, and Slovenia in crowns per quintal (a quintal is equivalent to 100 kg). We convert prices in crowns to dinars using exchange rates from the SEEMHN (2014) database.Footnote 28
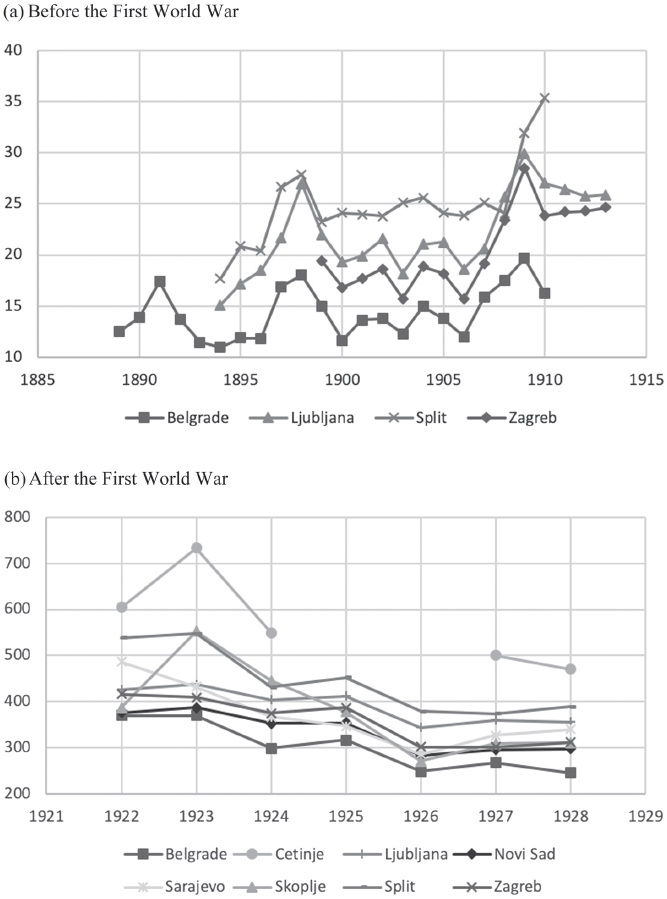
Figure 2 shows prices of wheat in the provincial capitals. In the interest of space, we only present prices of wheat, which was the most traded grain; however, both in terms of trends and levels, the patterns are the same for the other grains. As prices were much higher after WWI than before, we present the two periods separately. As expected, wheat prices tended to co-move, were always lower in Belgrade than in the provincial capitals of the Austro-Hungarian Empire, and a fork opened up during the customs war.
PRICES OF WHEAT IN THE PROVINCIAL CAPITALS (DINARS/QUINTAL)
Notes: Austro-Hungarian prices in crowns per quintal converted to dinar per quintal at the exchange rate (SEEMHN 2014).
Source: See Online Appendix.

Ethnicity
While much of the literature on the economics of ethnicity focuses on linguistic variables to define ethnic groups, here we look at religions.Footnote 29 In our context there was relatively little linguistic variation across cities: in our sample, the mother tongue of an average of 80 percent of the people was Serbo-Croatian.Footnote 30 Indeed, a shared language was the key ethnic marker of the South-Slavic people. Religion, rather than language, was the key marker of ethnic boundaries between Serbs (Christian-Orthodox), Croatians and Slovenians (Catholic), and Bosnians (Muslim).Footnote 31 As Calic (Reference Calic2019, p. 99), one of the most renowned international historians of Yugoslavia, writes, “religious affiliation […] was […] the most distinctive criteria to demarcate between the various ethnic collectives.”Footnote 32
Data support this claim. Hungarian pre-war censuses differentiated between Serbs and Croats (Austrian censuses reported them jointly). For 89 sample cities in Croatia-Slavonia and Vojvodina, in 1910, the correlation is 99 percent between the share of Serbian and Orthodox population, and 85 percent between the share of Croat and Catholic population. This is strong empirical evidence that religion is a good proxy for the main ethnic groups in Yugoslavia.
Relying on religion implies that we cannot completely rule out that secularism rather than nationalism per se, may contribute to altered measured relationships. Yet interwar Yugoslavia (differently from post-WWII Yugoslavia) was a multi-confessional rather than secular state. Although census data do not allow us to gauge the intensity of religiosity, they detect patterns of religious identification across cities that were very stable over time, with hardly anybody identifying as an atheist, either before or after the war. One of the robustness checks uses provincial boundaries (Serbia, Croatia-Slavonia, and so on) instead of religious affiliation to identify ethno-religious groups and finds that the results do not change. Another robustness check uses data on ethnic identity for a sub-sample of over 180,000 observations from Croatia-Slavonia and Vojvodina, where such data are available from the 1910 census.Footnote 33 It finds that the use of ethnic identity instead of religious identity yields results that are quantitatively very close and qualitatively identical.
We collect data on religion and language from population censuses. For the interwar period, we use data from the Yugoslav population census of 1921. Figure 3 illustrates the religious composition of sample cities in 1921. For the pre-war, we use Austrian (1890–1910) and Hungarian (1900–1910) censuses for cities in Slovenia, Dalmatia, and Croatia-Slavonia. There is hardly any within variation: the sample correlation coefficient between the 1900 and 1910 censuses is 99.9 percent for religion and 99.8 percent for language. Hence, we interpolate between census years and otherwise extrapolate with the data from the closest year. Serbian censuses only distinguish the Christian-Orthodox religion and Serbian language from “others” for most cities and offer a refined religious distinction only for 17 county capitals in 1910. A comparison of the observed religious shares and language data in 1921 and in the 1910 census reveals that there was hardly any variation over time.Footnote 34 Therefore, for cities in Serbia, we hold the 1921 religious shares constant (both for the pre-war and the subsequent years).
RELIGIOUS COMPOSITION OF SAMPLE CITIES IN 1921
Source: Authors’ illustration based on sources listed in the Online Appendix.

There are several sources of within-group variation in ethno-religious identity (see Figure 3). Cities in Serbia had either a Christian-Orthodox or Muslim majority. Most cities in former Habsburg territories were predominantly Catholic, but some had an Orthodox or Muslim majority. Therefore, ethnicity varied both within the treated city-pairs (across the border) and within control city-pairs (either within former Habsburg territories or within Serbia/Montenegro).
Transport Costs
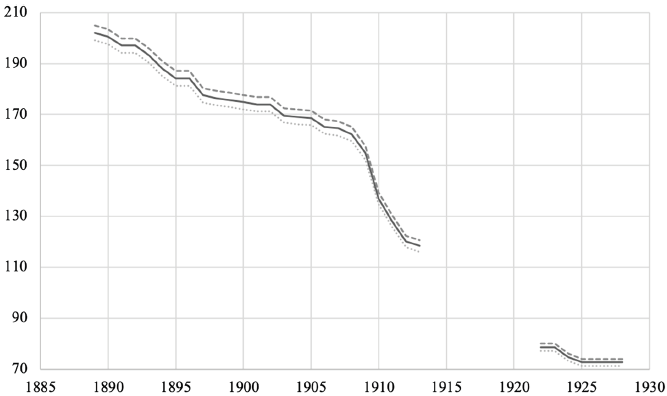
To correctly identify border and ethno-religious effects, it is essential to control for important time-variant confounding variables, which, in our setting, are transport costs and tariffs. To estimate transport costs, we rely on a least-cost pathways approach. In recent years, this approach has become standard in empirical work in trade economics, as the best feasible alternative to direct observations of transport costs between localities (Donaldson and Hornbeck Reference Donaldson and Hornbeck2016; Donaldson Reference Donaldson2018; Allen and Arkolakis Reference Allen and Arkolakis2022). Using geographic information system (GIS) software and historical information, we create a new dataset on predicted city-pair freight transport costs. In short, we first construct a multi-modal transport network database that maps where freight could move along each transport mode (railway, waterway, and ordinary road). We then calculate transport cost parameters that apply to a given unit length of each transport mode. Lastly, we compute lowest-cost freight routes along the network for given cost parameters.Footnote 35 Figure 4 presents the evolution of mean transport costs between sample city-pairs. As would be expected, as a result of the opening of new railway lines, the cost of transporting goods fell over time.
MEAN TRANSPORT COST (WITH 95 PERCENT CONFIDENCE INTERVAL) BETWEEN CITY-PAIRS IN THE SAMPLE (1925/6 DINAR PER 100KG)
Source: Authors’ calculations. See subsection Transport costs and Online Appendix for details.

Trade Tariffs
We control for Austro-Hungarian tariffs on grain imported from Serbia before WWI.Footnote 36 As mentioned before, cities in our pre-war sample are located either in Austria-Hungary or in Serbia. Grain trade between these countries essentially operated in one direction: Serbia exported grains to Austria-Hungary. This requires us to control for tariffs imposed by Austria-Hungary on imports from Serbia. We collect grain-specific tariffs from all tariff treaties signed between Austria-Hungary and Serbia between 1882 and 1910. Figure 5 shows the evolution of Austro-Hungarian tariffs on Serbian grains. For most of the period (1889–1905), tariffs were rather modest: on average, in our sample they were equivalent to 4 percent of the grain price in Serbia. With the outbreak of the customs war between Austria-Hungary and Serbia (1906), tariffs shot up and stayed relatively high until WWI. During this time, tariffs were on average equivalent to 37 percent of the price of Serbian grain.
TARIFFS FOR IMPORTS FROM SERBIA BY GRAIN (DINAR PER 100KG), 1889–1913
Notes: Austro-Hungarian tariff in crowns per quintal converted to dinar per quintal at the exchange rate (SEEMHN 2014).
Source: See Online Appendix.

EMPIRICAL STRATEGY AND RESULTS
The Border Effect Specification
How large was the border effect between Serbia and the Austro-Hungarian Empire? To begin with, we compare trends in price dispersion between city-pairs that were divided by the border (treatment group) with city-pairs that were not divided by the border (control group). As the panels are unbalanced, the trends are estimated with city-pair/grain fixed-effects panel regressions over year dummies. In other words, we estimate the following equation separately for the treatment and control groups of city-pairs:

where p igt and p jgt are the prices of grain g in cities i and j in year t, α ijg are city-pair/grain fixed effects included to address composition effects (since the panel is unbalanced), and each D t is a dummy equal to one in year t.
The patterns shown in Figure 6 are clear. There was hardly any change between city-pairs that remained in the same state. By contrast, there was a large drop of around 20 percent in price dispersion between city-pairs that were no longer divided by a border after the war. Consequently, average price ratios in both sets of city-pairs became essentially the same, hovering around 120 percent.
TRENDS IN PRICE RATIOS IN “TREATMENT” AND “CONTROL” SAMPLES (FIXED-EFFECTS PANEL)
Notes: The trends are estimated with fixed-effects panel regressions of price dispersion over year dummies. City-pairs in the treatment sample were separated by the pre-unification border; city-pairs in the control sample were not. Standard errors are clustered by city-pair/grain.
Source: Authors’ calculations.

Before the war, price dispersion between treated city-pairs was rather volatile, and there is little evidence of a consistent pre-treatment trend. To precisely measure the border effect, however, we need to control for the fact that part of the price dispersion between cities across the border was caused by tariffs. Moreover, on average, city-pairs in the treatment group were more distant from one another than city-pairs in the control group (394 km vs. 177 km). Thus, the development of railway lines is expected to reduce transport costs between cities initially divided by a border more than for the others. We therefore estimate the border effect controlling for transport costs and tariffs. Like in all previous papers estimating the effect of borders on price gaps (Broda and Weinstein Reference Broda and Weinstein2008; Schulze and Wolf Reference Schulze and Wolf2009; Versailles Reference Versailles2012; Aker et al. Reference Aker, Klein, O’Connell and Yang2014; Brenton, Portugal-Perez, and Régolo Reference Brenton, Portugal-Perez and Régolo2014; Robinson Reference Robinson2016), we also include grain/cities fixed effects, which control for time-invariant characteristics affecting market access and local grain prices, such as altitude or land quality, as well as grain/year fixed effects aimed at capturing other factors behind changes in price dispersion over time, such as improved communication in the wake of the spread of telephone and telegraph lines. Specifically, we estimate the following equation:

where Border ijt is 1 if cities i,j were separated by the pre-unification border at time t, and 0 otherwise.Footnote 37 Tariff factor ijgt are grain-specific trade tariffs on exports from Serbia, where the average price was 45 percent lower, divided by the grain price at origin. Transport cost factor ijgt are transport costs divided by the grain price at origin (the lower price). In the absence of a consumption price index, nominal transport costs are computed by reflating the real transport costs with the trend of grain prices. In turn, this trend is computed using a fixed effects panel regression of grain prices over year dummies.Footnote 38 The normalization of observable nominal costs by price of origin is needed to ensure that costs are measured as “iceberg costs” on both sides of the estimating equation. The variables α ig and α jg are city-grain dummies controlling for unobserved time-invariant factors like non-perfect homogeneity of products or differences in institutional quality across cities (for instance, low institutional quality in one city is expected to increase trade costs, and thus, price gaps with other cities). We use a baseline specification with city dummies rather than city-pair fixed effects for two reasons. First, this specification is the standard one in the literature on the border effect, and thus, it facilitates comparison with previous results. Second, a specification with city-pair instead of city fixed effects is not a viable option for the analysis of the role of religious similarity, which has hardly any within-variation. For robustness, in Table B.7 in the Online Appendix, we also present estimates of the border effect based on a standard fixed-effect specification, with city-pair/grain instead of city/grain fixed effects. The variables τ gt are year-grain dummies controlling for unobserved time changes, such as those stemming from common weather shocks or improvements in the communication infrastructure that can potentially affect iceberg trade costs differently across grains.Footnote 39 With 173 cities and 32 time periods, an even more saturated specification, with time trends that vary across cities, is just not computationally viable. However, in one of the robustness checks, we use city-year fixed effects for a balanced sub-sample of cities. Reassuringly, the results with the two different trend specifications are nearly identical. Lastly, ε ijgt is the error term. Standard errors are clustered by city-pair/grain, allowing for arbitrary correlation within cross-sectional units.
Equilibrium price ratios are expected to be equal to trade costs between trading markets; however, they can move at random until they become as wide as costs (Coleman Reference Coleman2007; Federico Reference Federico2012). Hence, only trading city-pairs yield clean measures of trade costs, and the inclusion of other city-pairs in the analysis can cause a negative bias in the estimated coefficients.Footnote 40 Data on urban trade flows are hard to come by and, just as in other similar studies, observing inter-city trade is not feasible. We can, however, infer that trade will not be profitable between cities with price gaps lower than observable trade costs (in other words, transport costs plus tariffs). In what follows, the sample that excludes such cities will be referred to as the “restricted sample.”
Letting the value of the dependent variable contribute to sample selection can lead to bias (Geddes Reference Geddes1990). However, in our setting the resulting decrease in the variation of the dependent variable is truly minimal: the standard deviation of the price ratio goes from 0.305 to 0.304. At the same time, 156,214 observations, which are bound to exhibit a particularly noisy relationship between dependent and explanatory variables, are eliminated. One can thus expect a significant increase in the size of the coefficients with the restricted sample. For robustness, we report both the results with the restricted sample and those with the full sample.
The Border Effect
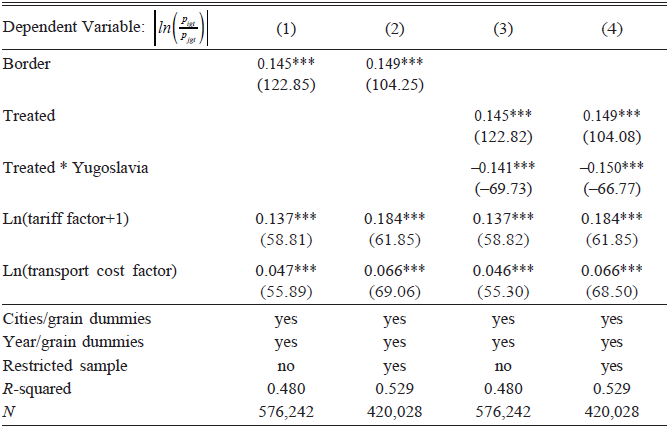
Table 2 presents our estimates of the border effect. All the variables have the expected sign and are highly significant. The fit improves with the restricted sample (Column (2)). In equilibrium, one would expect the marginal effect of tariffs and transport cost factors on the price ratio to be equal to one between trading cities and lower than one for other city-pairs. Hence, their marginal effects are expected to be between zero and one and to become closer to one with a decrease in the share of non-trading city-pairs in the sample. That is exactly what we observe when we evaluate these marginal effects at the sample averages of the price ratio over transport cost or tariff factors (plus one).Footnote 41
THE BORDER EFFECT

Table 2 Long description
A regression results table with the dependent variable being the absolute value of the log price ratio between locations, across four model columns (1) to (4). Columns 1 and 2 report a Border coefficient of 0.145 and 0.149, both statistically significant. Columns 3 and 4 replace it with a Treated coefficient of 0.145 and 0.149, plus a Treated times Yugoslavia interaction of about minus 0.141 and minus 0.150, all significant. All four columns include the log of tariff factor plus 1 (0.137 in columns 1 and 3, 0.184 in columns 2 and 4) and the log of transport cost factor (0.047, 0.066, 0.046, and 0.066), all significant. Each model includes cities/grain and year/grain dummies. Columns 2 and 4 use a restricted sample, while columns 1 and 3 do not. R-squared is 0.480 for columns 1 and 3 and 0.529 for columns 2 and 4. Observations number 576,242 in columns 1 and 3, and 420,028 in columns 2 and 4.
*** = Significant at the 1 percent level.
Notes: t -statistics with standard errors clustered by city-pair/grain are given in parentheses. The restricted sample includes only city-pairs with observable trade costs lower than price gaps.
Source: Authors’ calculations.
The border coefficients estimated with the full and restricted samples are nearly identical. They correspond to an increase in the average price ratio of 20.02 to 20.07 percentage points. These values are consistent with the trends shown in Figure 6, where, as seen before, the drop in the price ratio of the control group after Yugoslavia’s unification is about 20 percentage points.
Reassuringly, the size of our border coefficient is also in line with—albeit somewhat larger than—the majority of those found by other similar studies (Online Appendix Figure B.1). Nevertheless, our coefficients are significantly higher than those estimated by Schulze and Wolf (Reference Schulze and Wolf2009) and by Aker et al. (Reference Aker, Klein, O’Connell and Yang2014). The latter looks rather low in a comparative perspective, lending credence to Aker et al. (Reference Aker, Klein, O’Connell and Yang2014), who claim that in their context, present-day Niger-Nigeria’s trade, bilateral price-gaps understate the true extent of the border effect. Our coefficient is significantly higher than that found by Schulze and Wolf (Reference Schulze and Wolf2009) for provincial borders of the Austro-Hungarian Empire before WWI. This difference suggests that borders between independent polities were higher than “internal borders,” whose effects did not include administrative obstacles to international trade. Thus, internal borders only partially anticipated future trade barriers.
Assuming that the trade elasticity with respect to trade costs is –3.71 (the median value in Head and Mayer’s (Reference Head, Mayer, Gopinath, Helpman and Rogoff2014, table 5) survey of 32 econometric estimates), our baseline border coefficients correspond to a decline in trade by 58 to 60 percent.Footnote 42 These values are close to Anderson and van Wincoop’s (2003) downward revision of border effects estimated with naïve gravity models: for them, national borders reduce trade by 20–50 percent.
The results presented in Columns (3) and (4) soundly reject the hypothesis that the border effect persisted after unification. The coefficients of the treated dummy imply that the effects of the border before unification are identical to those estimated by the baseline. Summing them up with the interaction coefficients yields the border coefficient after unification. The result is that there was no difference between cities that were previously divided by the border and others after unification. The values of the border coefficients after unification are 0.004 for the full sample and –0.001 for the restricted samples.Footnote 43 The border effect had simply vanished after unification.
The Role of Ethnicity
To what extent did the border effect reflect the different ethno-religious make-up of Serbian and Austro-Hungarian cities? Our measure of ethno-religious similarity between cities is standard: the likelihood that two random individuals from the two cities belong to the same group (Alesina and La Ferrara Reference Alesina and La Ferrara2005). As discussed before, in our context the most important marker of sub-national ethnic boundaries was religion, rather than language.Footnote 44 We therefore estimate the role of ethnicity, relying on religious similarity. However, we also look at linguistic similarity in one of the robustness checks. Formally, we measure religious similarity as:

where  and
 are the population shares of religion k in cities i and j in year t.Footnote 45 Its size ranges from zero to one. Thus, the size of its coefficient can be directly compared to those found in other studies using dummy variables (Aker et al. Reference Aker, Klein, O’Connell and Yang2014; Robinson Reference Robinson2016).
We start to answer our question by looking at whether we find that the border effect becomes smaller when we control for ethno-religious similarity. While the spatial distribution of ethnic groups is itself a plausible determinant of the location of the border, here we are interested in the additional frictions that ethnic diversity entails. We subsequently relax the assumption that the effect of ethno-religious similarity on trade costs is time invariant in three ways. Firstly, we allow the effect of ethno-religious similarity to differ before and after Yugoslav unification. This specification tests the hypothesis that the effect of ethno-religious similarity persists after political borders change. Secondly, we let ethno-religious similarity interact with time. This specification allows the effect of ethno-religious similarity to start varying even before political borders change. These two specifications have the advantage of parsimony. However, they have the drawback of imposing specific functional forms on changes in the role of religious similarity (level shift or linear trend, respectively). We also report the results with a specification that has a fully flexible trend, obtained by interacting Religious similarity with year dummies. However, since it would be unwieldy to report the coefficients of 31 dummies in a table and trends lend themselves to graphical representation, we report these coefficients in Figure 7.Footnote 46 In another specification, we allow religious similarity to interact with the border dummy to test whether ethno-religious differences exacerbate the border effect.
TREND OF THE RELIGIOUS SIMILARITY COEFFICIENT, 1889–1927 (REFERENCE YEAR = 1928)
Notes: The restricted sample includes only city-pairs with observable trade costs lower than price gaps. Standard errors are clustered by city-pair/grain.
Source: Authors’ calculations.

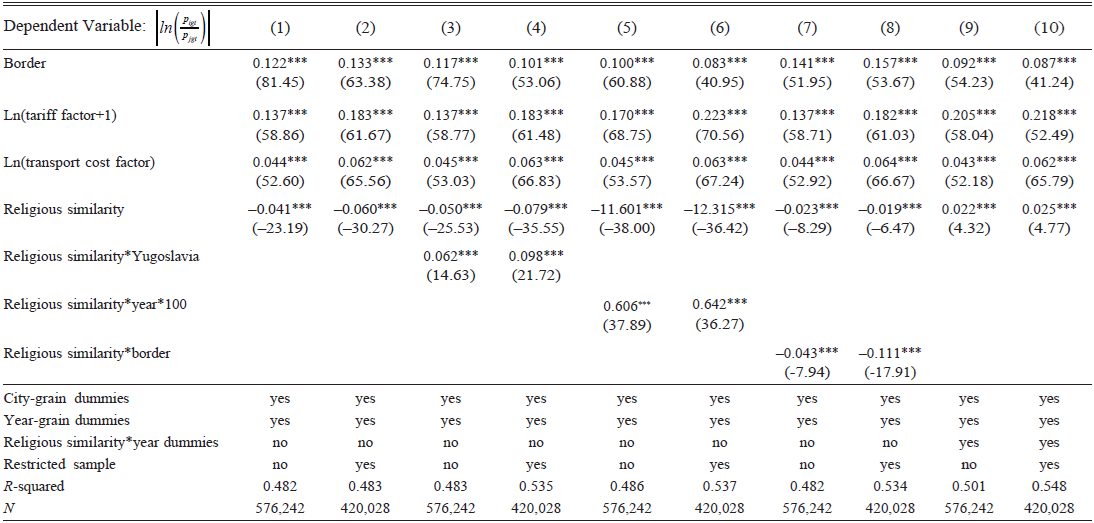
Table 3 presents the baseline results on the role of ethnicity. In Columns (1) and (2), religious similarity has the expected sign and is statistically significant. The border coefficients are lower than in Table 2, but not much: 16 percent or 24 percent for the full and restricted samples, respectively. As it turns out, however, this contribution is too low because it neglects to consider that the effect of ethno-religious similarity varied over time.
THE ROLE OF ETHNICITY

Table 3 Long description
A regression results table with the dependent variable being the absolute value of the log price ratio between locations, across ten model columns (1) to (10). All models report a positive, significant Border coefficient (about 0.083 to 0.157), along with positive significant coefficients for the log of tariff factor plus 1 (about 0.137 to 0.223) and the log of transport cost factor (about 0.043 to 0.064). Religious similarity has a negative significant coefficient in columns 1 to 8 (from about minus 0.019 to minus 12.315) and a small positive one in columns 9 and 10 (0.022 and 0.025). Interaction terms appear in selected columns: religious similarity times Yugoslavia in columns 3 and 4 (0.062, 0.098), religious similarity times year times 100 in columns 5 and 6 (0.606, 0.642), and religious similarity times border in columns 7 and 8 (minus 0.043, minus 0.111). All models include city-grain and year-grain dummies; columns 9 and 10 also include religious similarity times year dummies. Even-numbered columns use a restricted sample. R-squared ranges from 0.482 to 0.548, with 576,242 observations in odd columns and 420,028 in even columns.
*** = Significant at the 1 percent level.
Notes: t -statistics with standard errors clustered by city-pair/grain are given in parentheses. The restricted sample includes only city-pairs with observable trade costs lower than price gaps. The interaction coefficients between Religious similarity and year are multiplied by 100 to facilitate their comparison.
Source: Authors’ calculations.
For the following specification (Columns (3) and (4)), the absolute values of the Religious similarity coefficient before the unification of Yugoslavia increase significantly,Footnote 47 with an average value of –0.064, is significantly higher than those of the coefficients of places with the same ethnicity within present-day Malawi (–0.012) (Robinson Reference Robinson2016) and within Niger or Nigeria (–0.010) but are lower than the coefficient for places across the Niger-Nigeria border (–0.085) (Aker et al. Reference Aker, Klein, O’Connell and Yang2014, table 3, col. 5). In addition, our interaction analysis soundly rejects the hypothesis that there was a persistent effect of religious similarity: summing up the baseline and interaction coefficients implies that after the formation of Yugoslavia the sign of the coefficient had switched from negative (–0.050 or –0.079) to positive (0.013 or 0.019).Footnote 48 This specification detects a significantly greater decline in the border coefficient than in the specification without interaction, with drops of 19 percent (full sample) or 32 percent (restricted sample), suggesting that ethno-religious diversity was indeed an important factor behind the border effect before the war.
The next specification (Columns (5) and (6)) confirms that the market-segmenting effect of ethno-religious diversity vanished over time: in 1889 the coefficient of Religious similarity was –0.154 or –0.186, as compared to 0.006 in 1928. These are economically large changes: the corresponding effects on the average price ratio are –20 or –24 percentage points in 1889, compared to less than 1 percentage point in 1928. Furthermore, the crucial role played by ethno-religious diversity in explaining the border effect before the war is confirmed, with border coefficients even smaller than those of the previous specification. The specification with interaction between the border coefficient and ethno-religious similarity (Columns (7) and (8)) also confirms that ethno-religious diversity exacerbated the border effect: indeed, the coefficients imply that for the restricted sample the border effect was slashed in city-pairs with the same ethno-religious make-up.Footnote 49
All the key results are confirmed by the specification with a fully flexible, non-linear trend (Columns (9) and (10)). As we shall see in Figure 7, this specification also detects a progressive decline in the market-segmenting effect of religious differences over time. As with other specifications allowing the effect of Religious similarity to change over time, the indication is that by the end of our period religious differences actually enabled market integration. Although the size of the coefficient is small, this result might signal particularly developed trade infrastructures between cities with different ethnic make-up and is consistent with Montalvo and Reynal-Querol’s (Reference Montalvo and Reynal-Querol2021) observation that gains from interurban trade increase with ethnic specialization.
In short, we find consistent evidence that differences in the religious make-up of Serbian and Austro-Hungarian cities explain a large share of the border effect. However, the market-segmenting effect of religious diversity vanished over time and was no longer present by the time cities had become part of the same Yugoslav state.
The Mechanism
The literature suggests two distinct potential mechanisms. On the one hand, if ethnicity only mattered when cities were in different countries because reputation was particularly important for international trade (compare Greif Reference Greif2000; Richman Reference Richman2017), then one would expect agents to change their behavior only in the treated cities, which became part of the same state after the unification of Yugoslavia. If, on the other hand, because of nationalism, the main ethnic group of reference changed over time and religious diversity no longer undermined trust (compare, e.g., Depetris-Chauvin, Durante, and Campante Reference Depetris-Chauvin, Durante and Campante2020; Kersting and Wolf Reference Kersting and Wolf2024), trade costs could change already before unification, as South-Slavic mobilization gathered momentum.
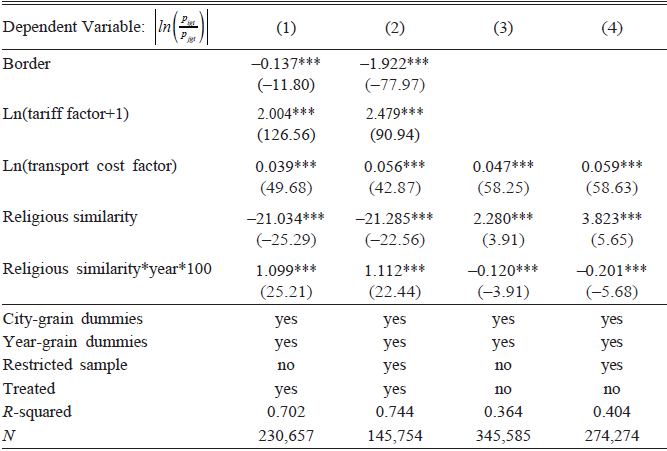
We start by looking at whether and to what extent the declining role of religious similarity was widespread by re-estimating our baseline specification with ethno-religious similarity interacting with time. Table 4 reports the results of this exercise.Footnote 50 The results support the hypothesis that ethno-religious networks enabled international trade, and thus, their relevance decreased as a result of Yugoslav unification. Only in the treatment group of cities initially divided by the border did ethno-religious similarity initially imply lower price gaps, and this effect declined over time.
THE ROLE OF ETHNICITY IN TREATMENT AND CONTROL SAMPLES

Table 4 Long description
A regression results table with the dependent variable being the absolute value of the log price ratio between locations, across four model columns (1) to (4). Border has a significant negative coefficient in columns 1 and 2 (minus 0.137 and minus 1.922) and is not reported in columns 3 and 4. The log of tariff factor plus 1 appears only in columns 1 and 2 (2.004 and 2.479), both significant. The log of transport cost factor is positive and significant in all four columns (0.039, 0.056, 0.047, 0.059). Religious similarity is strongly negative in columns 1 and 2 (about minus 21) and positive in columns 3 and 4 (2.280 and 3.823). Religious similarity times year times 100 is positive in columns 1 and 2 (1.099, 1.112) and negative in columns 3 and 4 (minus 0.120, minus 0.201). All models include city-grain and year-grain dummies. Columns 2 and 4 use a restricted sample. Columns 1 and 2 are for treated cases, and columns 3 and 4 are not. R-squared is 0.702, 0.744, 0.364, and 0.404, with 230,657, 145,754, 345,585, and 274,274 observations respectively.
Source: Authors’ calculations.
Next, we look at the timing of the transition interacting religious similarity with year dummies. The results of this test, presented in Figure 7, suggest that Yugoslav unification alone cannot explain the declining commercial role of ethno-religious ties: both the full and the restricted samples agree that the decline was underway already in the 1890s and the process was virtually complete by 1902.Footnote 51 Even if agents were forward-looking, 16 years before the unification of Yugoslavia seems far too early for them to plausibly anticipate that they no longer needed to rely on ethnic ties to enter into credible contracts because they would soon be part of the same state. Instead, the timing suggests that Yugoslav nation-building, which, as described in the historical background section, intensified around the turn of the century, fostered a pan-Slavic ethnic identity that increased trust among South-Slavs. This interpretation also agrees with evidence that at the same time ethno-religious agricultural cooperatives were becoming open to the Yugoslav idea. Following unification, the ethno-religious coefficient stabilized at a level close to zero.
Robustness Checks
We run a battery of robustness checks (for details see the Online Appendix), testing whether the results change for specific grains, a balanced panel, other subsamples of pairs of similar cities (provincial capitals, cities close to the border between Austria-Hungary and Serbia, small and large cities), excluding observations between cities with a likely high share of non-trading pairs (observations affected by the “customs war” and/or cities outside the hinterland of provincial capitals), after including additional controls (for distance and different trends across the treatment and control groups), or using alternative measures of ethnic similarity (linguistic similarity, same province or ethnic identity, available for a sub-sample of cities). Our main results stand under virtually all specifications: ethno-religious ties initially segmented markets, but this effect vanished over time.Footnote 52
CONCLUSION
This article has generated novel insights into whether ethnicity persistently affects market integration when borders change. We studied a unique historical case: the formation of a paradigmatic multi-ethnic state, Yugoslavia. We compiled a new, large panel of interurban price gaps spanning the period before and after Yugoslav political unification. We examined the effect of the pre-unification border on increasing interurban trade costs within the area of Yugoslavia by comparing city-pairs that were separated by this border (treatment group) to those that were not (control group). We found that the border effect was statistically significant and only somewhat higher in size than those found in other contexts today. Religious similarity—the key marker of ethnic boundaries within the Yugoslav context—accounted for a significant share of this border effect. Borders, however, only segmented markets before unification, and the initial significance of ethno-religious ties in conditioning trade vanished over time, too. These results are robust across grains and other subsamples, the inclusion of additional controls, and the use of alternative measures of ethnicity.
Through an innovative research design, we then analyzed the mechanism at work. We found that the drop in the relevance of religious similarity to explain price gaps affected city-pairs in the treated group of cities that were divided by the border, supporting the idea that ethnic ties were particularly useful in international trade. At the same time, the decline in the commercial relevance of ethno-religious ties was virtually complete already 16 years before Yugoslavia’s unification. These patterns are consistent with the hypothesis that the idea of a Yugoslav nation, increasingly promoted across broad social strata since the turn of the century, fostered the formation of a new ethnic identity with linguistic commonality overcoming religious differences between cooperatives of international traders. Our results provide new evidence on the effects of unification nationalism on economic behavior. They highlight how ethnic identities can shift swiftly, which challenges the idea that ethnic identities are historically persistent and reveals how inter-religious cooperation in Yugoslavia was initially remarkably successful.








 Open access

