

1. Introduction
In the wake of a renewed interest in the historical trajectories of welfare states, questions on the extent and causes of spatial differentiation in pre-industrial poor relief have assumed new importance.Footnote 1 Which spatial unit of analysis is the most relevant for comparative research into relief practices? The question is more than a measurement problem, as the unit of observation determines the policy level studied and the causalities invoked to explain the observed variation. The answer therefore has implications for a wider debate on motives and long-term trends in welfare policies. In this article, we will analyse local data on sources of income and number of recipients of the more than five hundred rural poor tables (local institutions for poor relief) in the provinces of East and West Flanders (present-day Belgium) in 1807 to identify regional patterns in tandem with local variations. While local variations reflected differences in resources and policy options from one parish to the next, broader regional patterns tied in with distinct socio-economic structures. By highlighting the close association between poor relief practices and regional relations of production, we aim to contribute to the wider debate on the relationship between poor relief and socio-economic development in pre-modern Europe.
In what follows we will first discuss the main ways in which spatial variations in pre-industrial poor relief have been observed and explained in the existing literature. Next, we will introduce our case study by presenting the main socio-economic characteristics and the institutional organisation of poor relief in rural Flanders at the end of the ancien régime. We will then present the source materials used and the main results derived from descriptive statistics and spatial mapping in order to identify correlations between economic structure, on the one hand, and distribution and income patterns of poor relief tables, on the other hand. Next, we will interpret our observations by evaluating the role of local policy in moulding the spatial variety of relief regimes. Conclusions follow.
2. Relief regimes between ‘national’ and ‘local’ causalities
The existing literature abounds with several possible causes for variation and change in pre-industrial poor relief. When comparing at the level of countries, differences in family forms,Footnote 2 governmental organisation,Footnote 3 religion,Footnote 4 socio-economic structure,Footnote 5 and urbanisation,Footnote 6 have figured as main explanations for observed variations in (supra-)national welfare regimes. One long ‘national’ tradition in particular has stressed how the Elizabethan Poor Law (1598–1601) laid the basis of a precocious and relatively unique, uniform, secure and generous system of poor relief in early modern England, compared to more haphazard, voluntary, predominantly urban and relatively parsimonious relief practices on the continent.Footnote 7 Particularly influential in this argument is the purported connection between England's early development of agrarian capitalism and its unique, well-developed Poor Law system. In one recent, explicit reformulation of this scholarly tradition, Larry Patriquin argued that the Poor Law originated in sixteenth-century England to compensate for the loss of access to land in the country's precocious process of proletarianisation.Footnote 8
Recent research has, however, increasingly questioned the alleged uniqueness of the English relief system both in time and space, as units of observation other than that of the nation are attracting more attention. One major line of revision has highlighted the role of regional variation both within England and on the continent. English welfare practices in the eighteenth and nineteenth centuries, as Steven King argued, were characterised by a broad regional divide between rural south-east England, where entitlements were broad and allowances high, and industrial north-west England, where entitlements were strict and allowances low.Footnote 9 Using the eighteenth-century southern Low Countries as their case study, Anne Winter and Thijs Lambrecht in turn argued that regional differences and similarities in socio-economic development were at least as important as differences and similarities in national legislation in shaping relief practices.Footnote 10 Lastly, a number of researchers, focused mainly on the English case, have for their part advocated the importance of local variation over regional patterns. Even within broadly similar regional economies and national legislative frameworks, they maintain, differences in local power relations, decision-making processes and resources produced marked variations in the number of recipients and levels of relief from one parish to the next: when all is said and done, therefore, the locality is the most relevant unit within which to study poor relief practices.Footnote 11 Closely related to their studies is the increasing interest in pauper agency in historical research. This strand of research stresses how paupers actively influenced relief practices via ongoing negotiations with relief officials, producing locality-specific or even pauper-specific relief practices.Footnote 12
While research on pre-industrial poor relief has multiplied in recent years, the absence of a common spatial framework hinders comparative analysis and heightens the risk of overstressing variations to the extent of obscuring underlying patterns.Footnote 13 This article will argue that regional socio-economic structures are the most relevant to understanding spatial variations in pre-industrial poor relief practices, and that they delimited the scope for local policies.Footnote 14 We will argue more specifically that the development of commercial agriculture and agrarian capitalism stimulated the expansion of rural poor relief. While we follow Patriquin's causal reasoning on agrarian capitalism as a motor behind the development of rural poor relief, we will deconstruct the ‘national’ dimension of his argument by highlighting processes of regional and local differentiation.Footnote 15 By examining the ways in which the local and regional interacted, we will demonstrate how distinct regional patterns in poor relief practices were in fact the product of the opportunities and constraints of local policies. While the source materials used do not allow us to analyse ‘national’ differences directly, we will reflect on the implications of our findings for this level of analysis in the conclusion.
3. Rural society and poor relief in Flanders
Flanders at the end of the ancien régime is an extremely relevant case for delving deeper into the influence of socio-economic factors on spatial differentiation in welfare policies.Footnote 16 First, processes of agrarian specialisation and transitions to more capitalist types of agriculture took place relatively early in some parts of the region. Second, Flanders was characterised by highly diversified regional economies, ranging from capitalist to subsistence farming in close proximity to one another. Third, local welfare institutions were well developed and local autonomy over distribution practices was high.
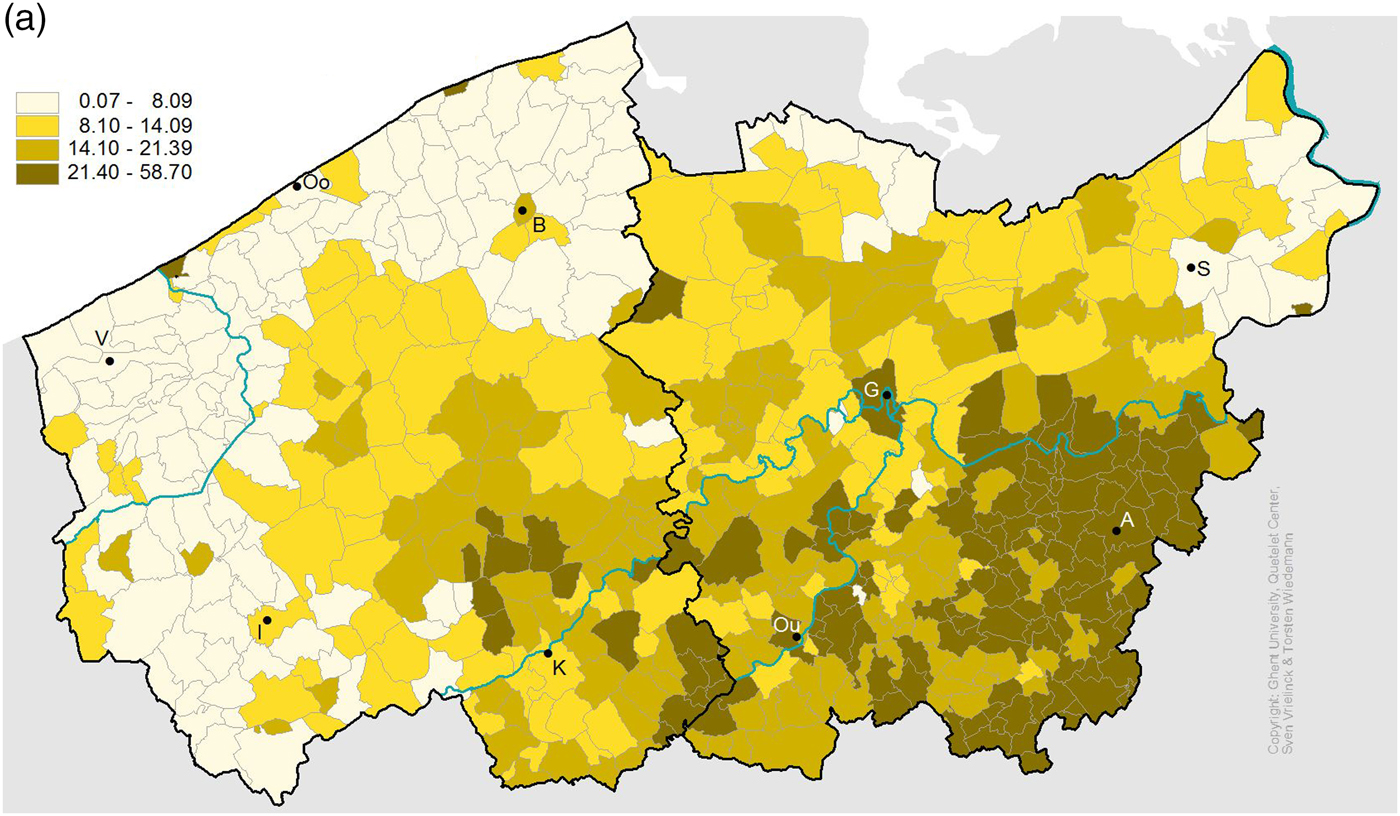
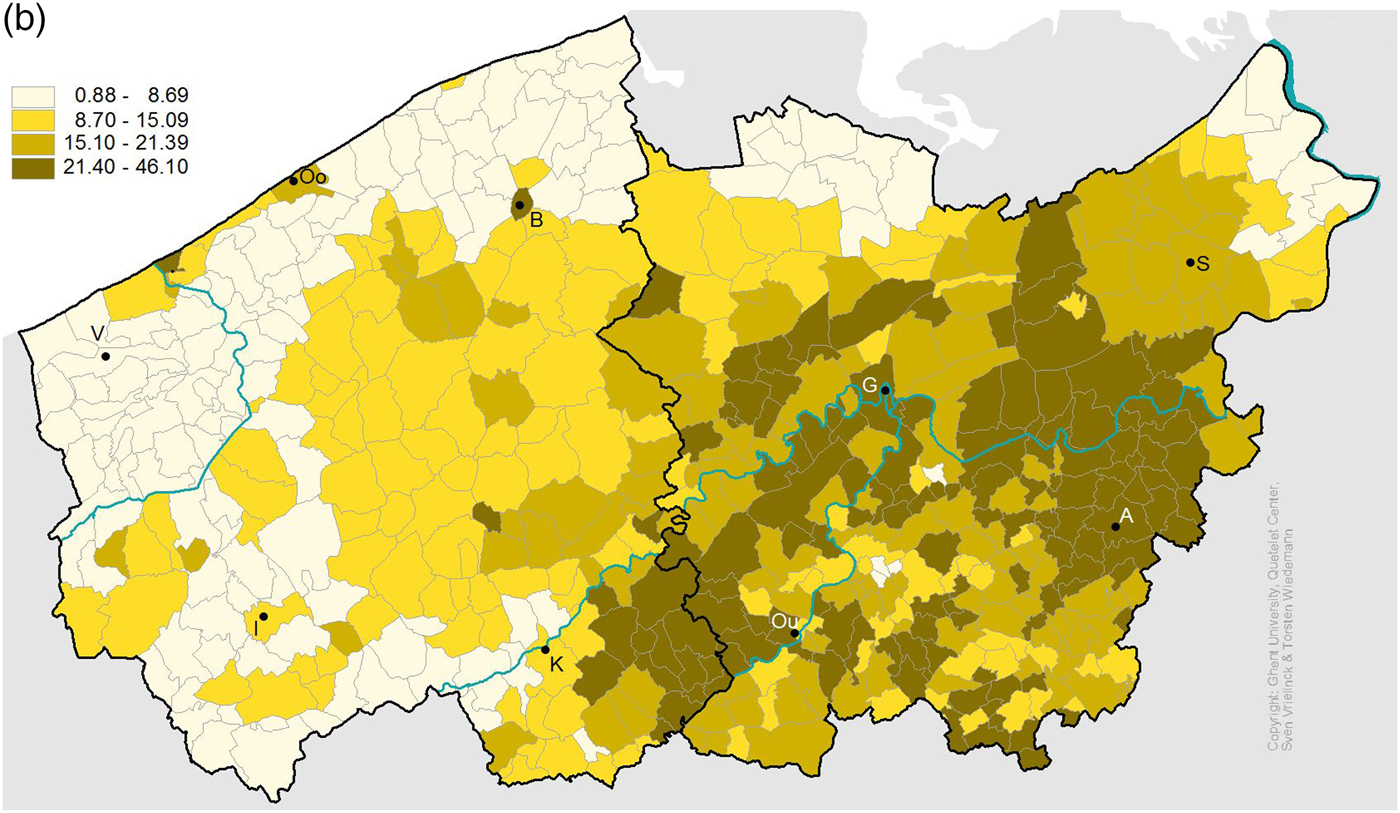
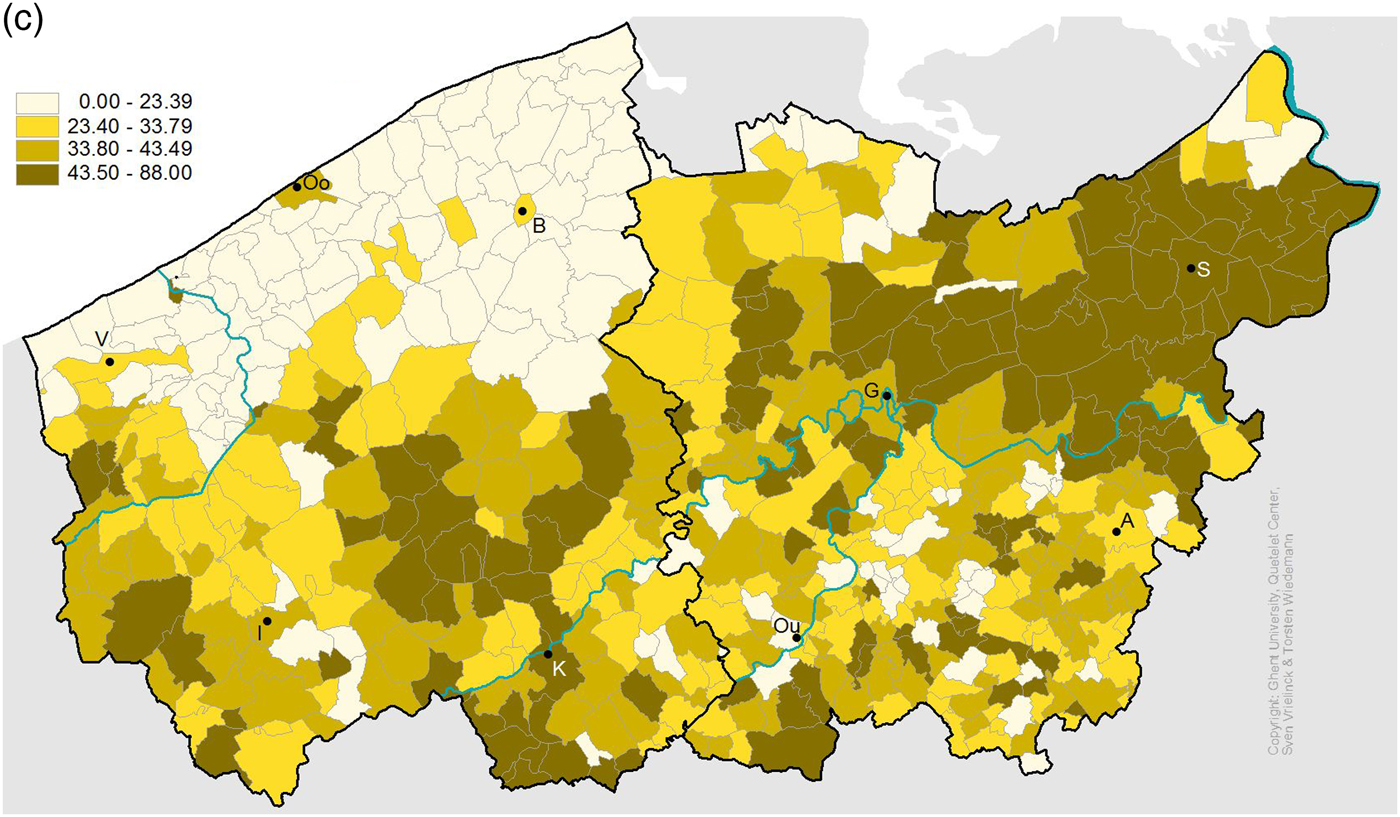
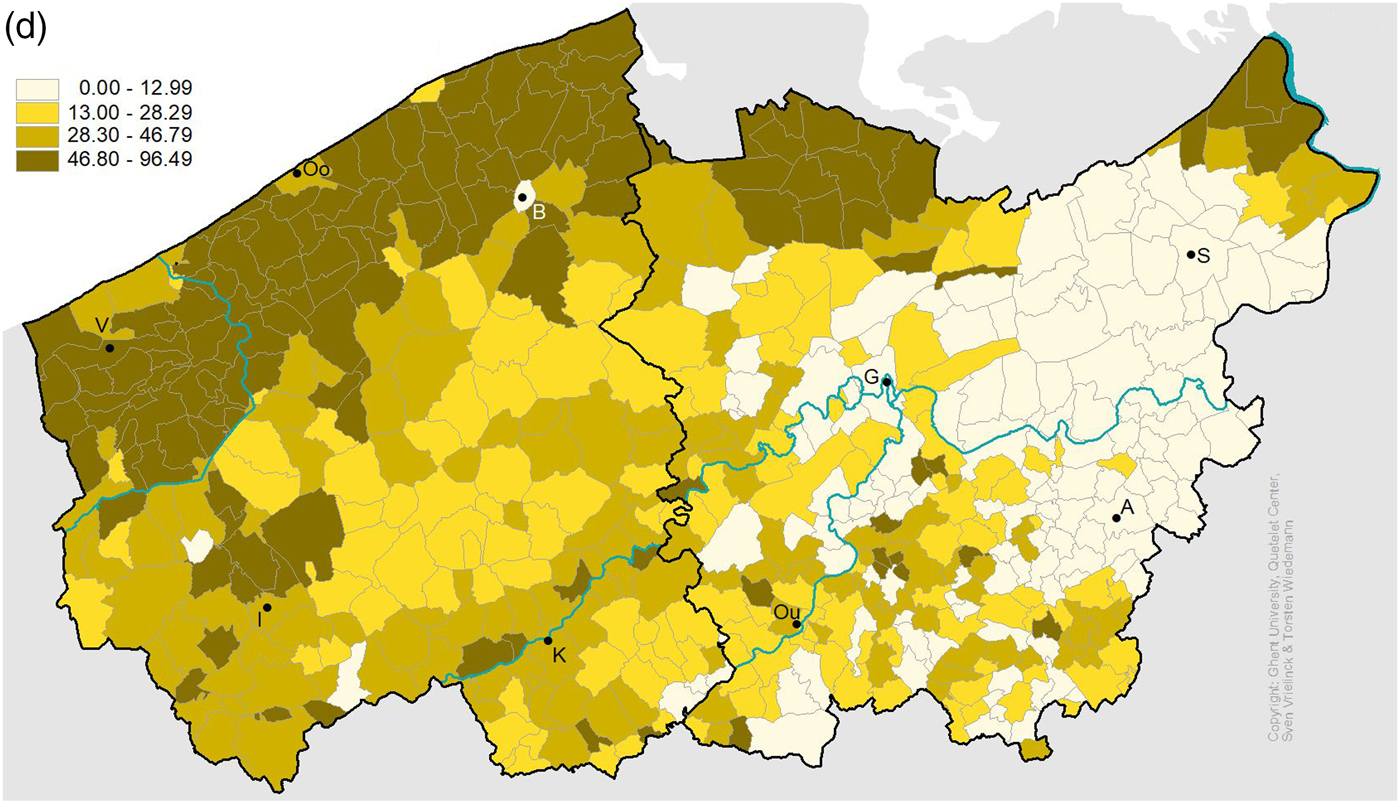
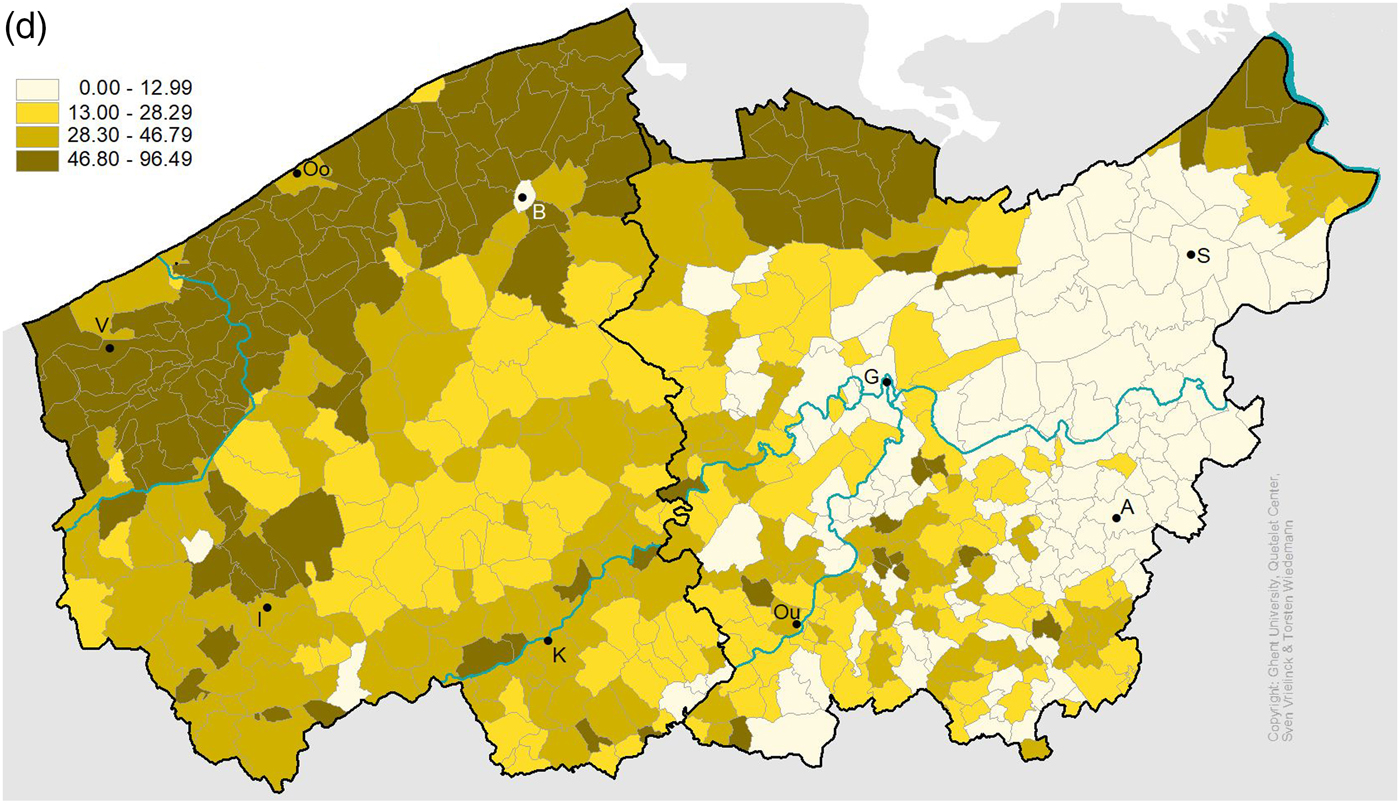
The regional diversity of Flemish agriculture is well illustrated by the agricultural census of 1846, which was the first survey to systematically document farm size.Footnote 17 Figures 1a to 1d show the share of the soil occupied by micro-farms of less than 2 hectares (ha), small farms between 2 and 5 ha, medium-sized farms between 5 and 20 ha, and large farms of more than 20 ha respectively, for all municipalities in East and West Flanders. Farms larger than 20 ha relied on non-family labour (servants and labourers) to exploit their holdings, and were located predominantly at the western and northern borders of Flanders: the polder area between Furnes and Bruges along the North Sea coastline, the area around Ypres with an embranchment along the river Scheldt towards Ghent, the region north-west of Ghent (Meetjesland) and the far north-east of East Flanders (Waasland). In the polder area agricultural production was based mainly on arable farming (wheat) and livestock husbandry destined for export, while the large farms in the other regions produced a wider variety of agricultural and industrial crops mainly destined for local markets. In the polder regions, labour was supplied by a small core of resident day-labourers, supplemented by seasonal migrants from inland regions during the weeding and harvesting months.Footnote 18 The polder area most closely resembles the classic model of agrarian capitalism: large farms owned by non-resident (urban) private and ecclesiastical landowners, leased by rich tenants who supplied the working capital of these large farms and operated by (semi-)proletarian day-labourers. While the ascendance of large commercial leasehold farms in the region dates back to the late Middle Ages, processes of farm engrossment and proletarianisation accelerated markedly in the second half of the eighteenth century.Footnote 19
Percentage of cultivated soil occupied by micro-sized farms (less than 2 ha).

Percentage of cultivated soil occupied by small farms (2–5 ha).

Percentage of cultivated soil occupied by medium-sized farms (5–20 ha).

Percentage of cultivated soil occupied by large farms (more than 20 ha).
On the other side of the spectrum, micro- and smallholdings were predominant in the area of Alost, Dendermonde and Oudenaarde in the south and east of inland Flanders – often owned by the peasants themselves. This constituted the heartland of Flemish husbandry: labour-intensive family farming – mainly potatoes for direct consumption – and were combined with rural textile production. As farms smaller than two ha were plainly insufficient for survival, these households relied heavily on spinning and weaving to make ends meet. Holdings between two and five ha could produce just enough food to feed all mouths, and were therefore also frequently complemented by textile production. Given the absence of large farms, there were few opportunities to supplement household income through day-labouring in the region.Footnote 20 Finally, a middle belt with less distinctive features in terms of farm size was situated in the square between Bruges, Courtray, Ghent and Oudenaarde. In absolute numbers, micro- and smallholdings were the most prominent, but there were also a fair number of medium-sized holdings. This mix of farm sizes provided the basis for long-standing village exchange relationships between large and small farmers, whereby small farmers worked during parts of the year as labourers in return for access to ploughs, horses, food, raw materials and credit, which functioned as a buffer in times of crisis and food shortages.Footnote 21
How, therefore, was this regional diversity in agrarian structures tied in with local relief policies? Local relief infrastructure was well developed in Flanders. When French administrators assumed power in the Austrian Netherlands in 1796, they were impressed by the fact that each parish had a separate, permanent organisation for poor relief – in contrast to eighteenth-century rural France.Footnote 22 These so-called armentafels (poor tables) had their origins in the late Middle Ages and organised the lion's share of rural poor relief.Footnote 23 They derived their revenue and income from charitable gifts, including real estate (land and houses), annuities (in cash and in kind) and lump cash sums. While the ‘national’ level was important in providing the institutional blueprint, the administration of poor tables was left to local authorities. The village community, in close consultation with the local priest, appointed one or two armenmeesters (poor masters) as temporary overseers of the poor who were responsible for the collection of the revenue and its distribution to the poor. The weakness of poor tables was their dependence on revenue generated by capital assets, which implied that the supply of relief was relatively inelastic and could vary between parishes depending on benefactions received in the past.Footnote 24 Income from capital could be supplemented by the collection of alms or local taxes, yet we will see that the extent to which these strategies were used, varied across parishes. The (bi-)annual accounts of these institutions were inspected by lay and ecclesiastical authorities, but as long as no fraudulent practices came to light, villages and parishes had great autonomy in relief management.
When the Austrian Netherlands were annexed by France in 1796, the poor tables were converted into bureaux de bienfaisance, institutions that closely resembled the welfare infrastructure that was already in place. With the exception of income resulting from feudal dues and rights (abolished) and state bonds (never repaid), most of the assets of the former poor tables were transferred to the bureaux de bienfaisance. While more detailed research is required, there are no indications so far that local relief institutions suffered great losses, although the institutional and financial reorganisation of the French period might have implied a temporary decrease in capital income.Footnote 25 Local overseers of the poor moreover maintained a large degree of autonomy. As in the eighteenth century, decisions about deservingness, the type and level of relief and the number of recipients remained a local matter.Footnote 26
4. Distribution regimes at parish level
To what extent did Flanders’ highly diversified regional agrarian structures interact with local autonomy to produce spatial patterns in relief practices? The main data used to shed light on this question stem from an 1808 survey in which the 549 municipalities of the Scheldt and Leie departments provided basic details on the total number of assisted poor and the main sources of revenue of the poor table, distinguishing between fixed revenue, taxes and miscellaneous income.Footnote 27 Drawing on the data collection established under the auspices of the STREAM and LOKSTAT projects, we will use this survey to analyse and compare local distribution and income regimes of poor tables in relation to a number of socio-economic characteristics at the level of municipalities.Footnote 28 While informal help or access to common rights might have constituted alternative sources of support,Footnote 29 it is relevant to study poor tables in their own right because they were by far the most important form of formal relief and because the political economy of their institutional practices is indicative of social relations and power relationships in rural communities, relationships that can in turn reveal something about the relative importance of alternative support mechanisms.Footnote 30
Although the data in the municipal returns pertain to the year 1807 only, we feel confident that the results of our analysis are indicative of the situation in the late eighteenth and early nineteenth centuries. The first decade of the nineteenth century did not record any serious harvest fluctuations or food shortages, and neither 1807 nor the preceding and succeeding years witnessed any strong price fluctuations.Footnote 31 Municipalities moreover had little room to misrepresent their situation, as the poor table accounts were subjected to yearly inspection by the departmental authorities. At the same time, the financial and institutional reorganisation of the French annexation is likely to have depressed the capital base of poor tables, so that overall relief income was somewhat lower – possibly up to one quarter – by 1807 than in the closing years of the ancien régime. Footnote 32 Although this would mean that the survey data underestimate the overall extent of relief-income in the late eighteenth century, they can still be taken as indicative of the spatial variation underlying relief practices in this period, as there is no reason to assume any disproportionate effect of institutional change in certain areas.
Another caveat is that the returns inform us about the nature and value of institutional income, but not about expenses. Expenses included not only poor relief, but also administrative and managerial costs, estate maintenance costs and/or particular requirements associated with certain benefactions (such as financing masses). On the basis of existing case studies, we can assume that around 85–90 per cent of overall expenses went to relief proper.Footnote 33 A further complicating factor is that poor tables need not have spent all their income, but might have built up reserves – examples of which are, however, limited.Footnote 34 Given the likely decrease in income following the regime change, any such positive balances were probably not very large by 1807. In any case, they could have existed only where pressure on relief provision was low – something we come back to later. Although income figures thus likely exceeded actual relief expenses by a margin between 10 and 20 per cent, the data on the amount and type of relief income together with the number of recipients can be taken as indicative of spatial variations in relief distributions.
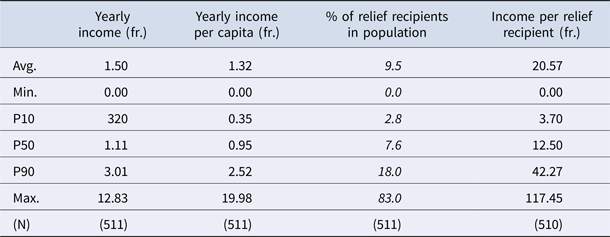
In order to limit our analysis to rural relief practices, 34 parishes with more than five thousand inhabitants were discarded from the analysis, while the data on three pairs of municipalities who shared poor relief resources were merged, leaving a total number of 512 rural parishes for statistical and spatial analysis. Table 1 summarises the main descriptive statistics concerning yearly income, income per inhabitant, number of poor relieved,Footnote 35 and income per relief recipient. The average relief income per capita of 1.32 fr. (1 franc and 32 centimes) was close to the equivalent of a daily wage of an agricultural labour.Footnote 36 This was considerably less than in England, where the Poor Law Commission returns from 1802/1803 recorded average relief expenditures per capita that were the equivalent of an agricultural labourer's weekly wage.Footnote 37 The average of one inhabitant out of ten (9.5 per cent) receiving some form of poor relief is in turn comparable to the English average in 1802/3.Footnote 38 The outcome in terms of average income per relief recipient ranged widely: while the lowest 10 per cent had less than 3.70 fr. income per pauper, the top 10 per cent had more than 42 fr. income per relief recipient, or the equivalent of some five to six week's wages of an agricultural labourer.Footnote 39
Relief income and distribution per municipality, 1807

Source: Poor relief enquiry of 1808 (STREAM). See appendix.
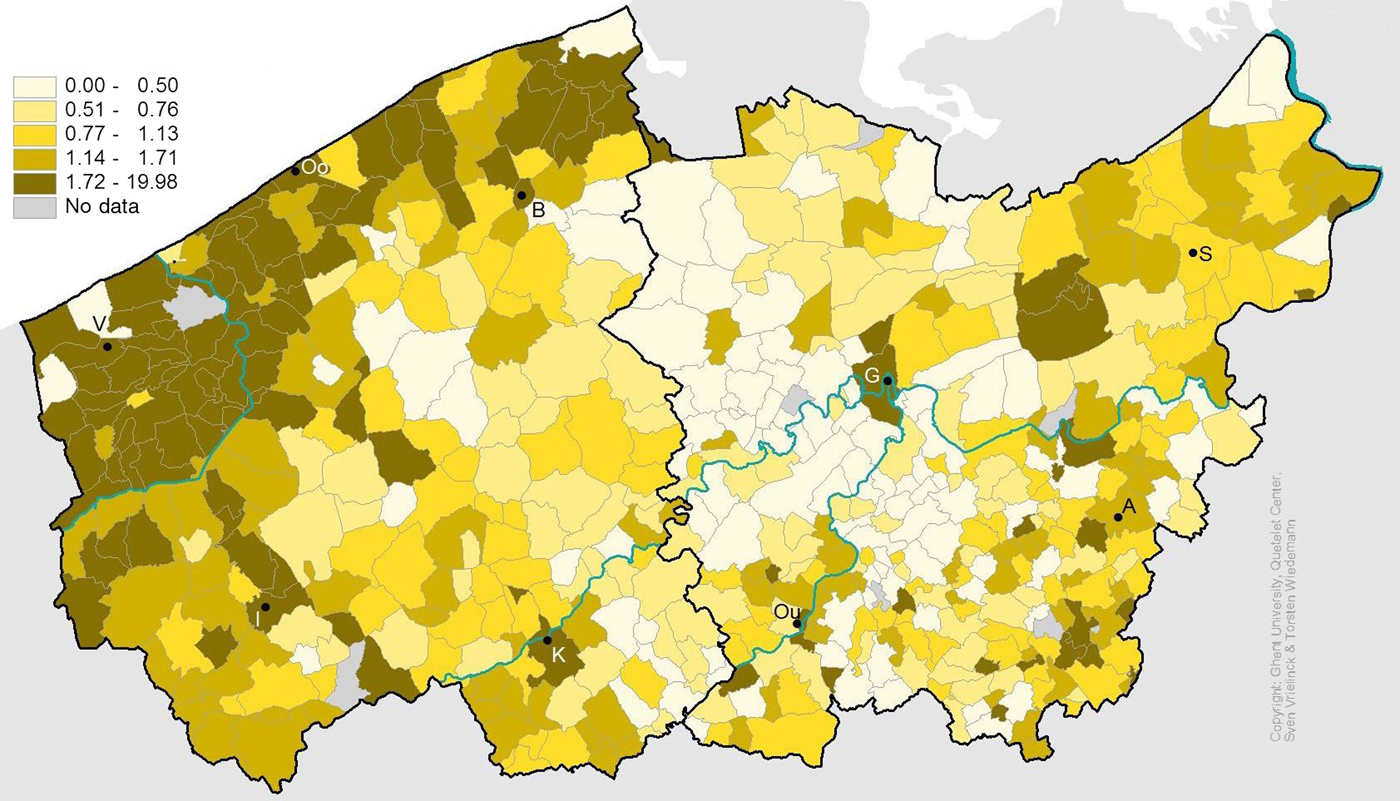
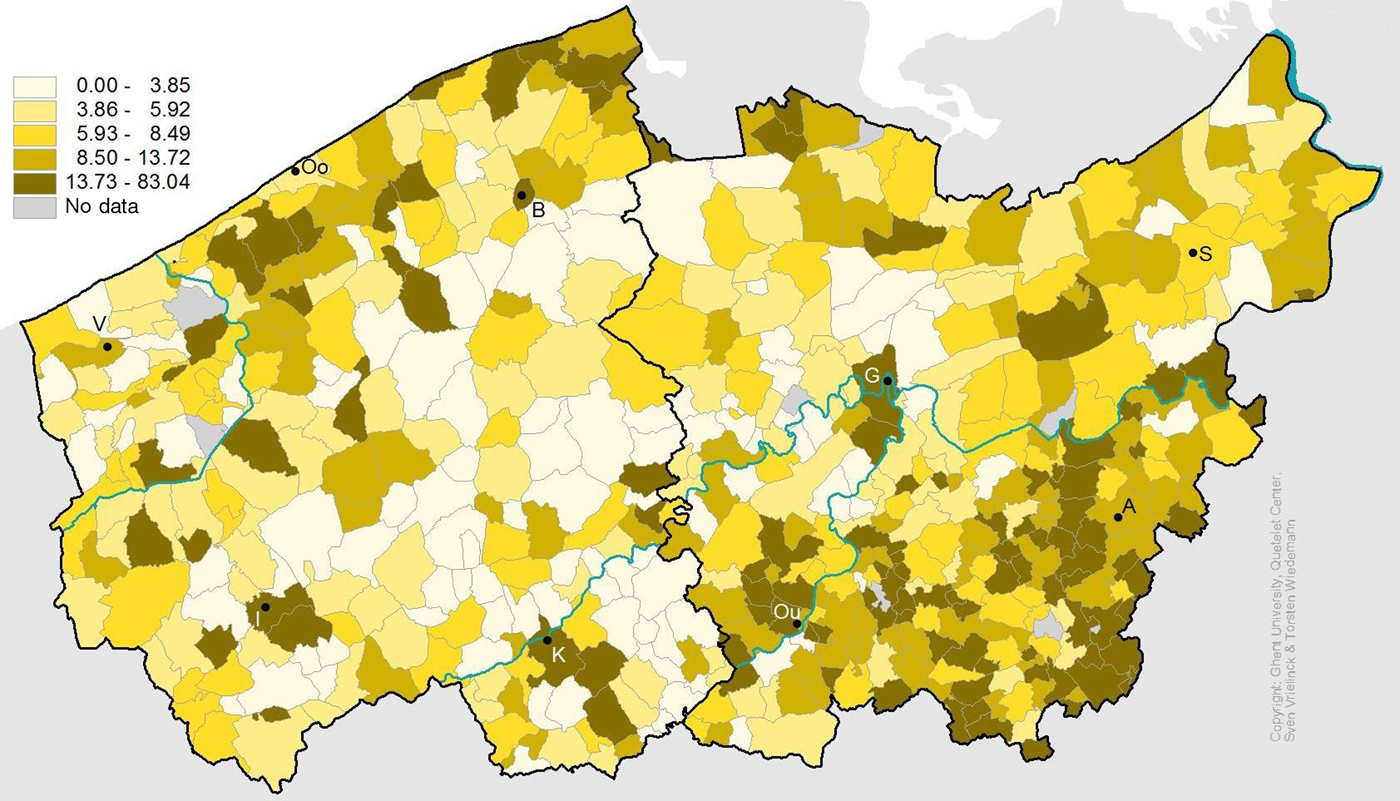
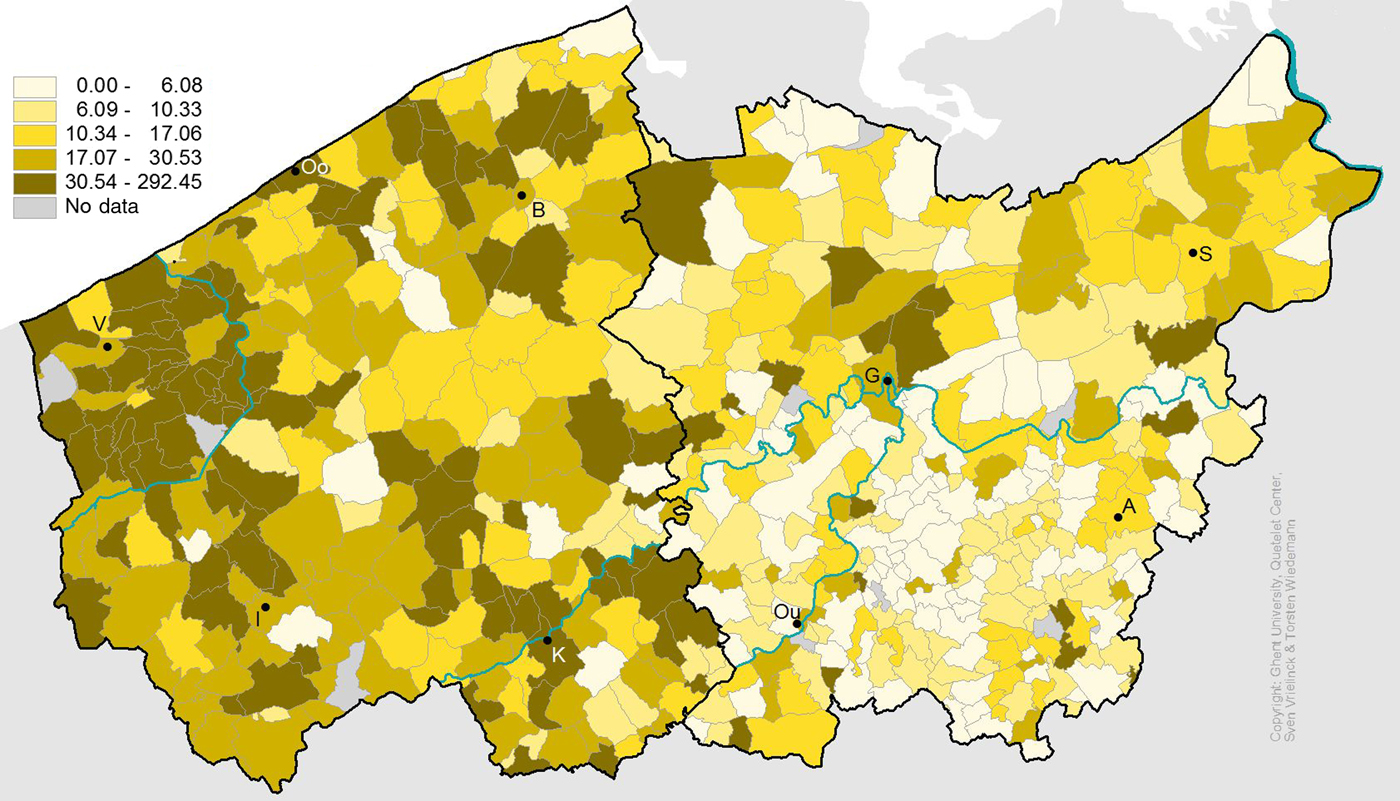
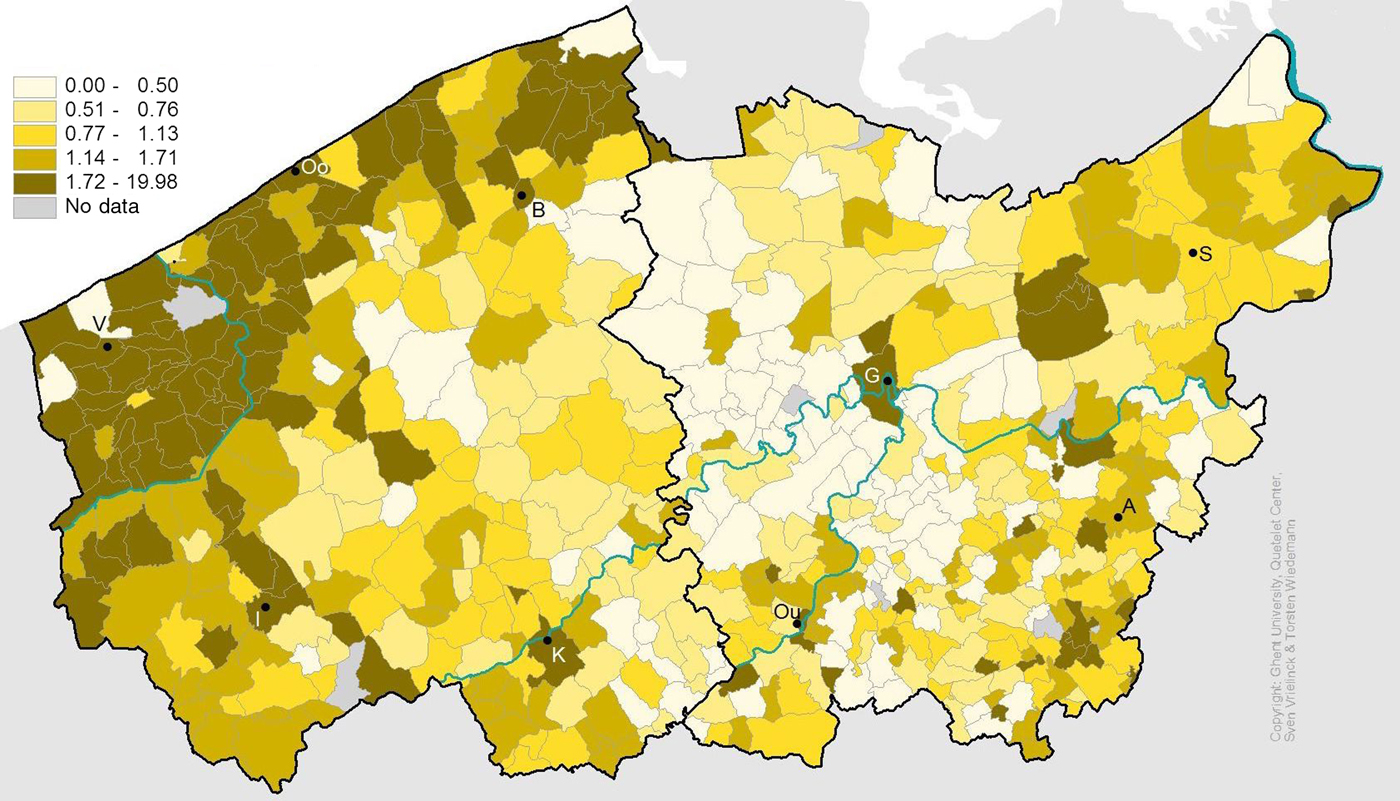
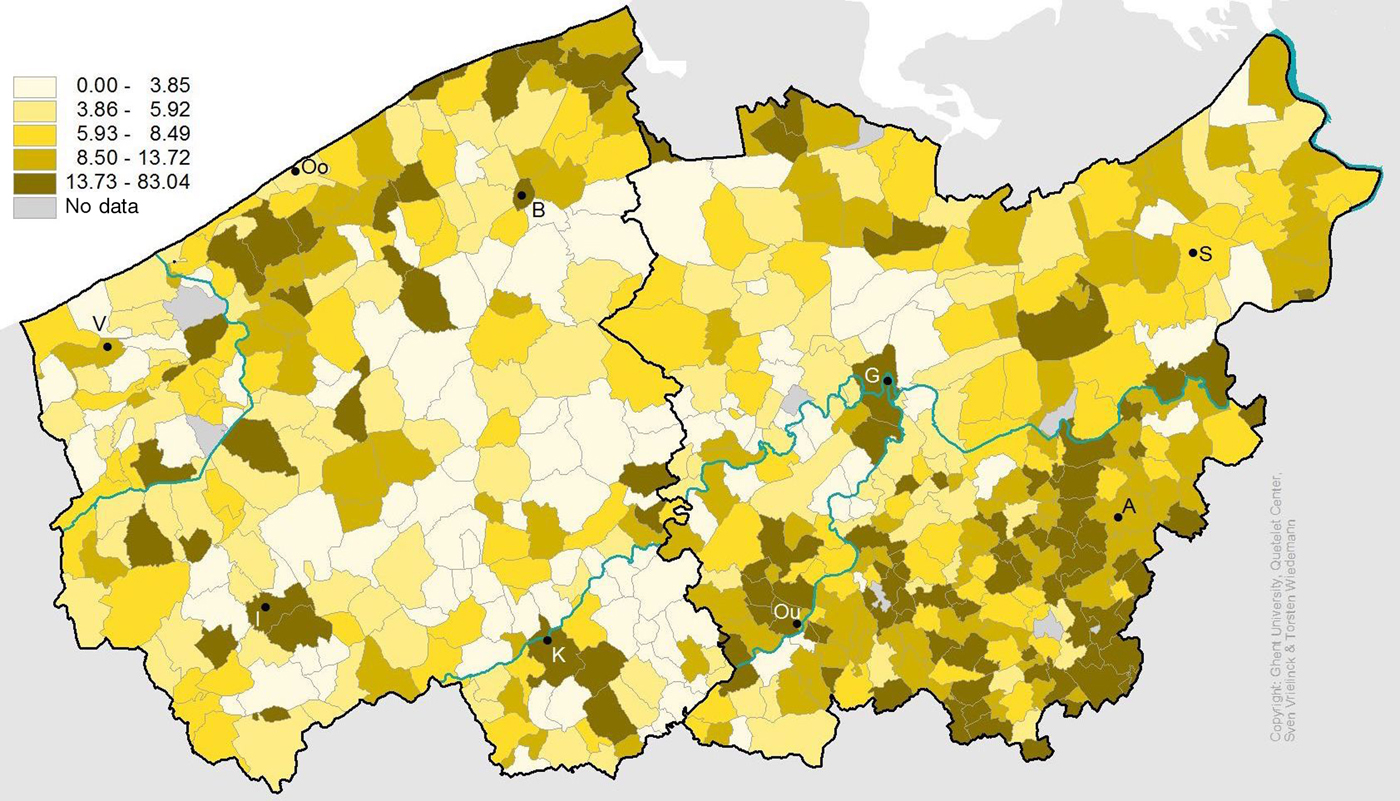
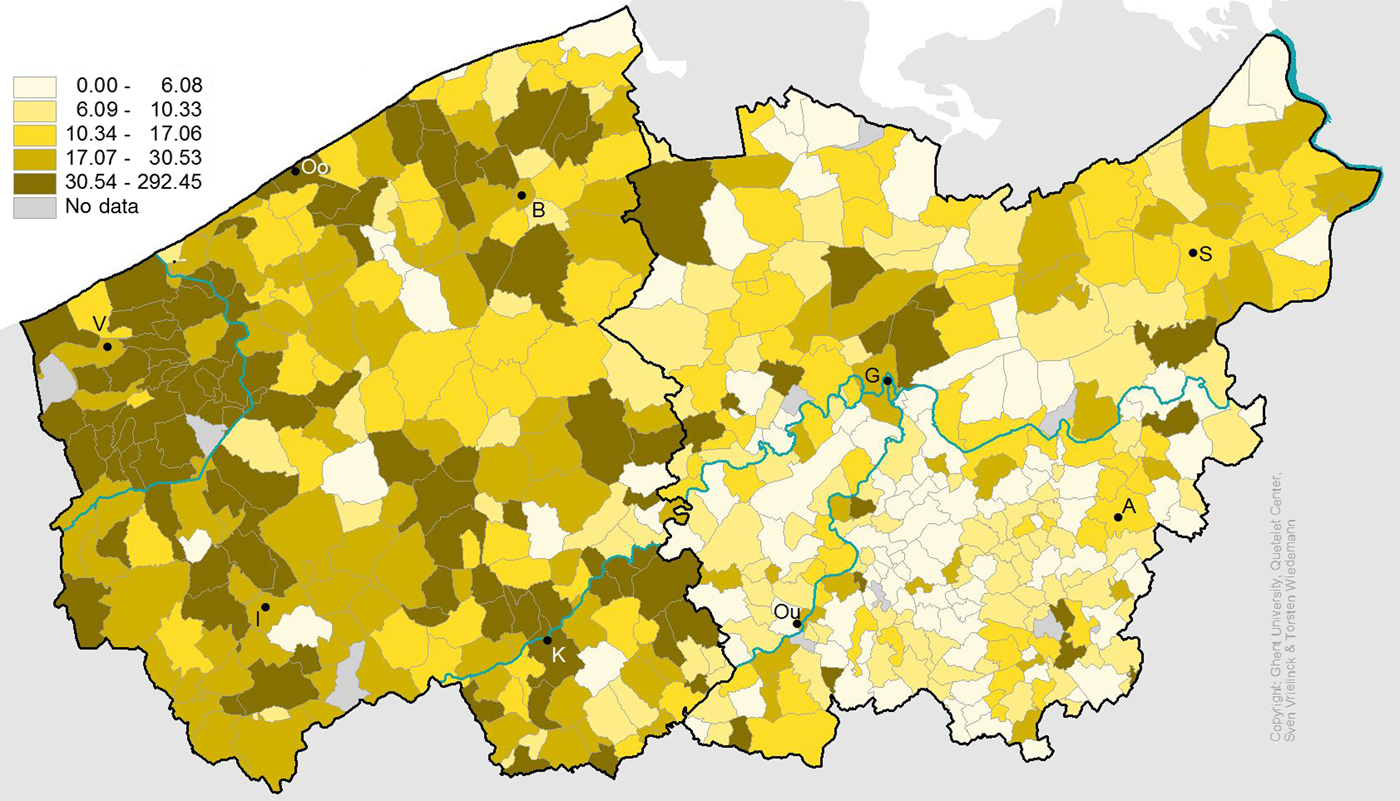
Spatially, high-income parishes were situated predominantly in coastal Flanders, where most parishes belonged to the highest quintile (Figure 2). To a lesser extent, the border region with France, the polder regions in the north-east and small clusters in the south-east counted quite a number of parishes with relatively high incomes. A broad north-south belt in the middle, in contrast, was composed of parishes with overall low to very low levels of total revenue. Figure 3 shows that the highest concentrations in terms of relief recipients were to be found in the south-eastern corner in the region around Alost, and to a lesser extent in the northern part of coastal Flanders and in the Land van Waas in the north-east, with a middle corridor with very low levels in between. Figure 4 shows that income per relief recipient was considerably higher in the western half than in the eastern half of Flanders, where a further differentiation existed between somewhat higher levels in the north-east and low levels in the south-east.
Yearly income per capita (in fr.).
Relief recipients (percentage of population).
Average income per relief recipient (in fr.).
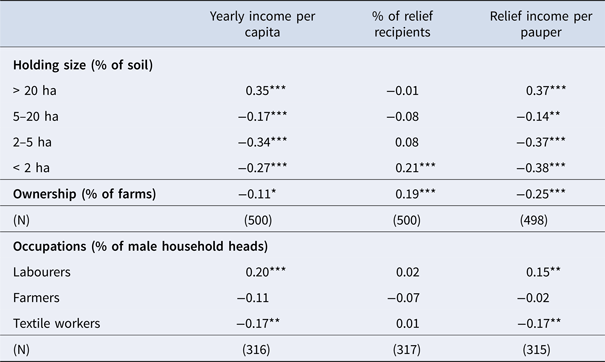
That these spatial patterns were tied in with the main variations in regional economies identified earlier is confirmed by the correlations with a number of proxies for local economic structure derived from the 1796 population census and the 1846 agricultural census as summarised in Table 2.Footnote 40 Because holdings larger than 20 ha necessitate the hiring of labour outside the family, their share of the soil, together with the proportion of labourers among male heads of household, can be taken as proxies for a commercial and capital-intensive type of agriculture combining large landholdings with wage labour. In contrast, the share of small-scale and micro-holdings can be taken as a proxy for the predominance of more subsistence-oriented agriculture. Similarly, the proportion of farmers among male heads of household can help to identify the incidence of independent farmers, while the proportion of textile workers serves as a proxy for involvement in the proto-industrial linen industry.Footnote 41
Correlation table between proxies for local economic structure and distribution patterns, 1796/1846

* p < .05, ** p <. 01, *** p <. 001. Source: Data on holding size and farm ownership from the 1846 agricultural census (LOKSTAT). Data on occupations of male household heads from the 1796 census (STREAM). See appendix.
The correlations in Table 2 corroborate the spatial patterns observed in Figures 2 to 4. They show that high poor relief income was correlated positively with the incidence of large holdings and labourers, which we know were most pervasive in the coastal and polder areas, and negatively with the incidence of medium-sized, small-sized and micro-holdings, farm ownership and textile workers, which were more prominent in the inland areas. The share of relief recipients in the population was in turn significantly correlated with the proportion of farms held in ownership and with the incidence of micro-holdings of less than two ha. Relief income per recipient, finally, was correlated positively with large-scale farms and labourers, and negatively with medium-scale and small-scale and micro-holdings, with farm ownership, and with the proportion of textile workers.
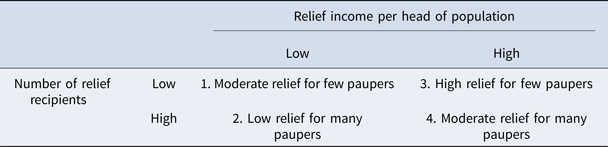
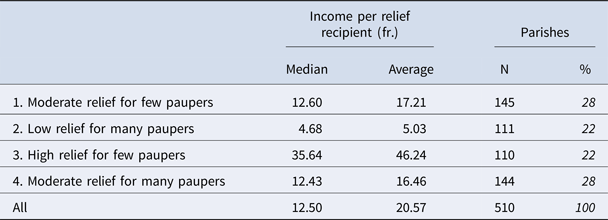
Although regional economies thus played an important part in explaining spatial patterns of distribution practices, local variation nevertheless remained high. To gain better insight into these variations, we distinguished four different regimes of distribution – each representing between 22 and 28 per cent of all parishes – according to whether total relief income per capita, on the one hand, and number of relief recipients per capita, on the other were higher or lower than the median value (Table 3).Footnote 42 On one end of the spectrum stood parishes in the first regime where a low relief income was distributed among few people, resulting in moderate relief for few paupers. On the other end of the spectrum were parishes in the fourth regime with high income and many paupers, resulting in moderate relief for many paupers. The end result in terms of budget per relief recipient was roughly similar in these two regimes, and approximated the overall median of 12.50 fr. (Table 4). This compares favourably with the equivalent of 4.68 fr. for the second regime that combined low income with many relief recipients, resulting in low relief for many paupers. The other extreme was situated in the third regime, where high income was distributed among few people, resulting in a median of 35.64 fr. per relief recipient. The variation in relief income per pauper was thus the result of variation in overall income as much as in the number of people among whom it was distributed.
Four ‘distribution regimes’

Relief income per relief recipient according to distribution regime, 1807

Source: Poor relief enquiry of 1808 (STREAM). Two missing observations. See appendix.
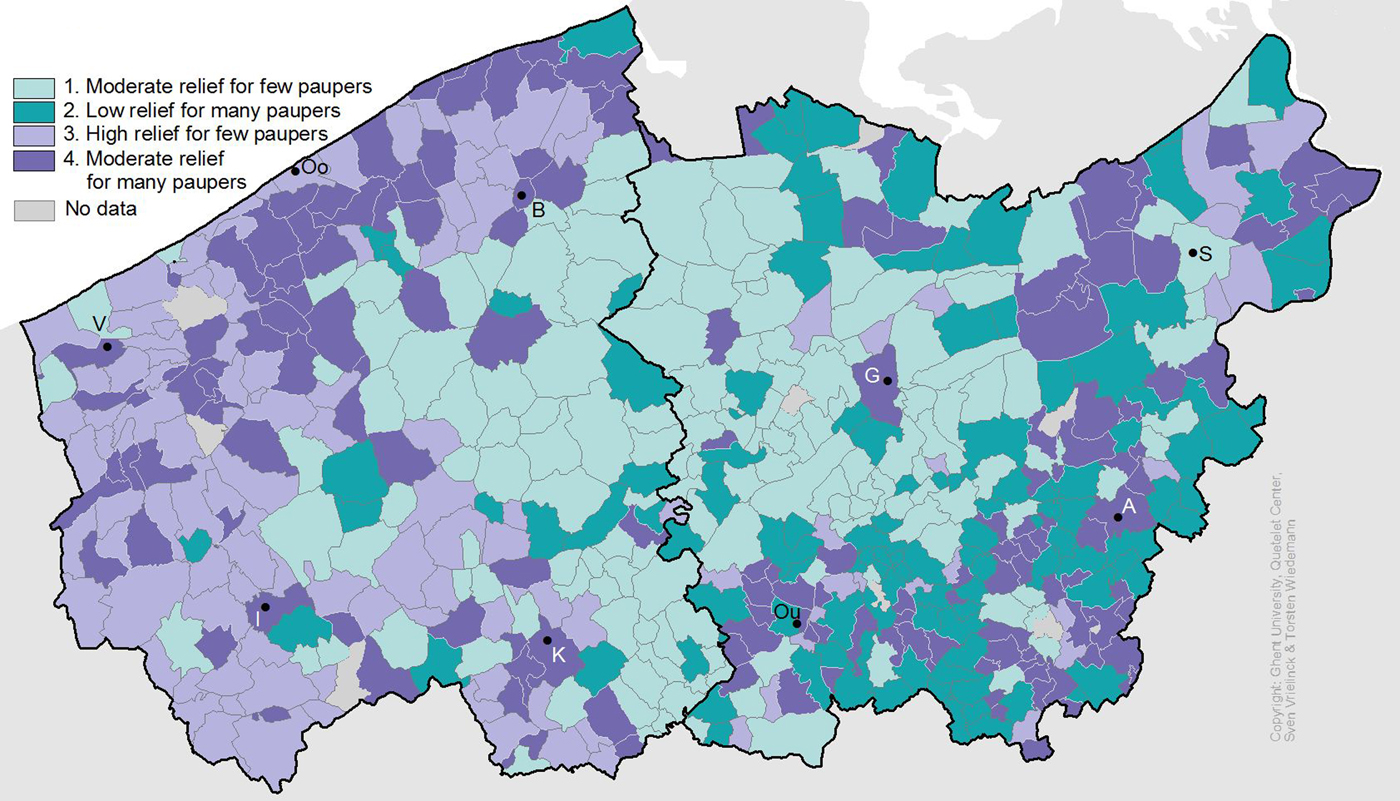
If we look at the spatial distribution of these four ‘distribution regimes’ (Figure 5), some clear regional patterns emerge from the observed patterns of local variation. From west to east we can first identify a broad coastal zone that was dominated by parishes from the third and fourth regimes. This means that they shared a relatively high income and that local variation was determined primarily by the number of recipients among whom it was distributed. Second, there is a broad north-south middle belt dominated by parishes from the first regime, interspersed sporadically by parishes from the second regime. This means that parishes in this area were characterised by an overall low income that was distributed mostly among few paupers, and occasionally among a few more. A third clearly identifiable region in the south-east was characterised by a mix of parishes from the second and fourth regimes. This means that they shared a high number of relief recipients and that local variation was determined primarily by variation in the overall income available for distribution. Lastly, the north-east represents a somewhat more muddled mix of parishes of the four regime types.
Distribution regimes.
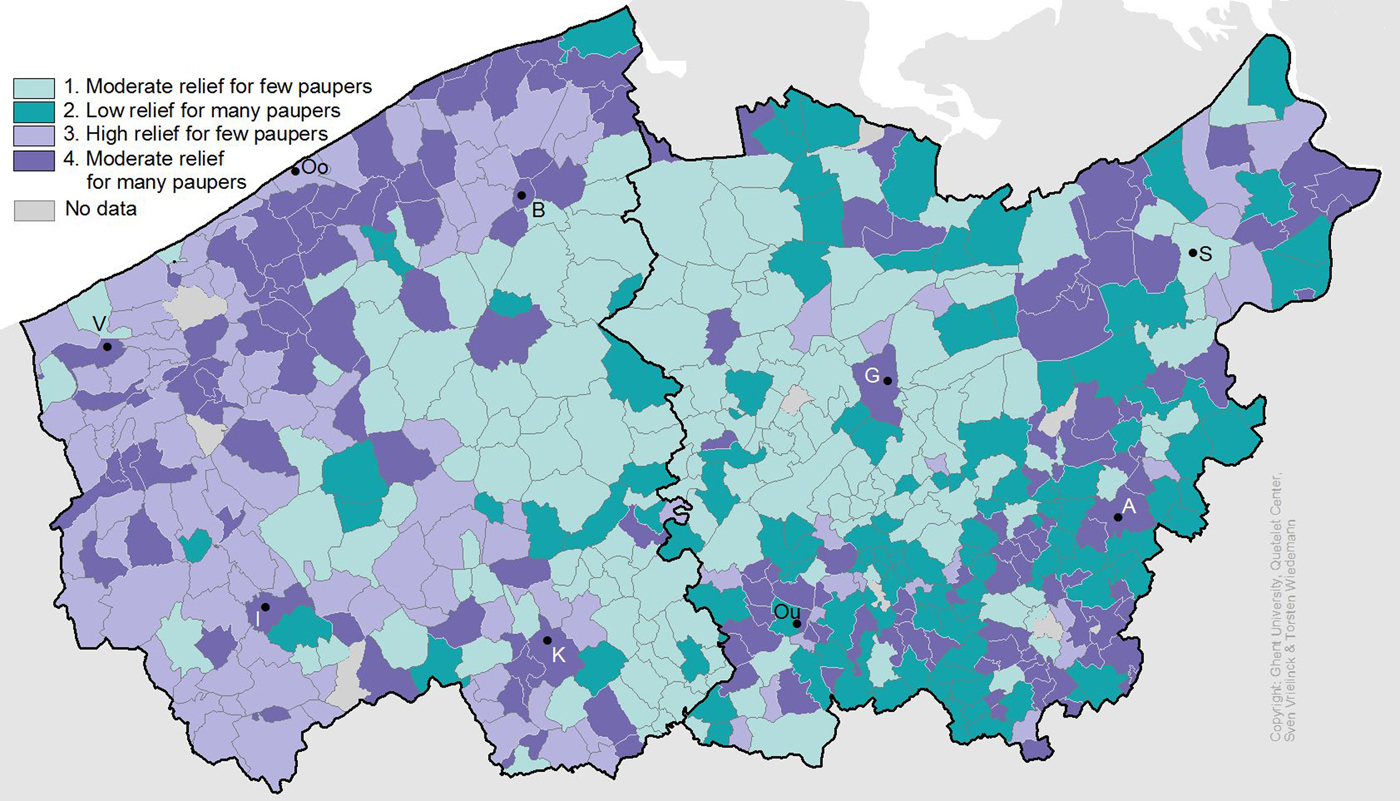
What these analyses suggest so far, then, is a geography of different priorities in distribution regimes, which spatially and statistically ties in with the main variations in regional economies identified earlier. In the south-east, dominated by small-scale self-owned farms and proto-industrial textile production, relieving a relatively high number of people appears to have been the norm, irrespective of the level of income. In the coastal region, in contrast, where large-scale capitalist farming was more pervasive, the shared characteristic appears to have been a relatively high level of income, irrespective of the number of people relieved. Lastly, the middle belt, a region with mixed farm sizes, reciprocal relations and proto-industrial textile activity, was characterised primarily by low levels of income, while the number of recipients varied.
5. Components of income
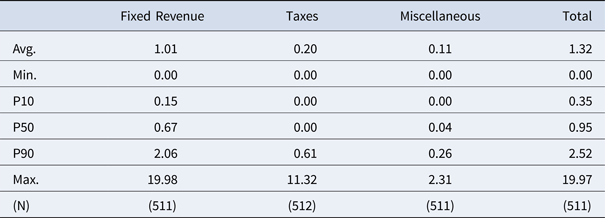
What do these patterns now suggest as to underlying structures and policies? In order to better understand the scope for policy, it is useful to first take a closer look at the components of total income as they were distinguished in the 1807 survey (Table 5). The most important source of revenue, yielding an average of 1.01 fr. per capita, consisted of fixed income derived from capital assets, mostly in the form of rents from land or interests from loans, which had been accumulated from bequests in the past. With an average of 11 cents, income from ‘unforeseen’ revenue – an ambiguous category of non-regular income including collections, one-off donations, logging, the sale of a deceased pauper's possessions, etc. – was overall relatively modest.Footnote 43 In all, 121 parishes recorded no such revenue, while only six parishes recorded the equivalent of more than 1 fr. per capita. Taxes, in contrast, yielded a much higher value with an average of 20 cents per capita – that is, double the equivalent of ‘unforeseen revenue’. The distribution was, however, much more skewed: while 288 parishes derived no income from taxes, 25 parishes at the other end raised more than 1 fr. per capita via taxes. Among the 224 parishes that did record income from taxes, the average value was 48 cents per capita – equivalent to 33 per cent of total income. In other words, while considerably fewer parishes recorded additional income from taxes (44 per cent) than from unforeseen revenue (76 per cent), when taxes were raised they were much more important both in absolute value and in share of total revenue than unforeseen revenue. More research is needed about the origins, evolution and nature of these taxes. In late eighteenth-century coastal Flanders these could take the form of dedicated poor taxes, but by the French period this may well have included municipal fiscal revenue from excises redirected as ‘subsidies’ to the poor table.Footnote 44 In either instance, they indicate a need to raise additional funds via obligatory taxes – either directly or indirectly – and therefore pressure on existing relief provisions.
Components of income per municipality, 1807 (fr. per capita)

Source: Poor relief enquiry of 1808 (STREAM). See appendix.
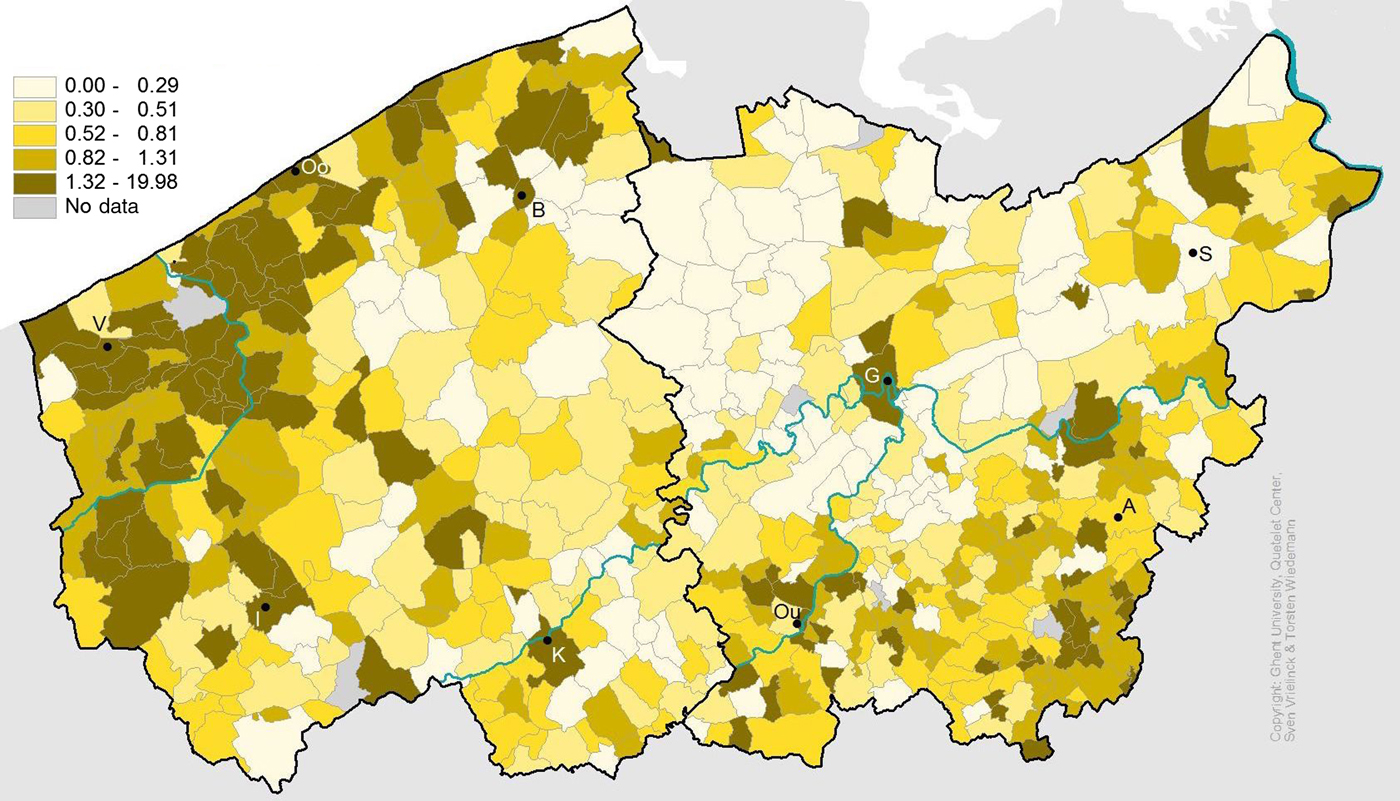
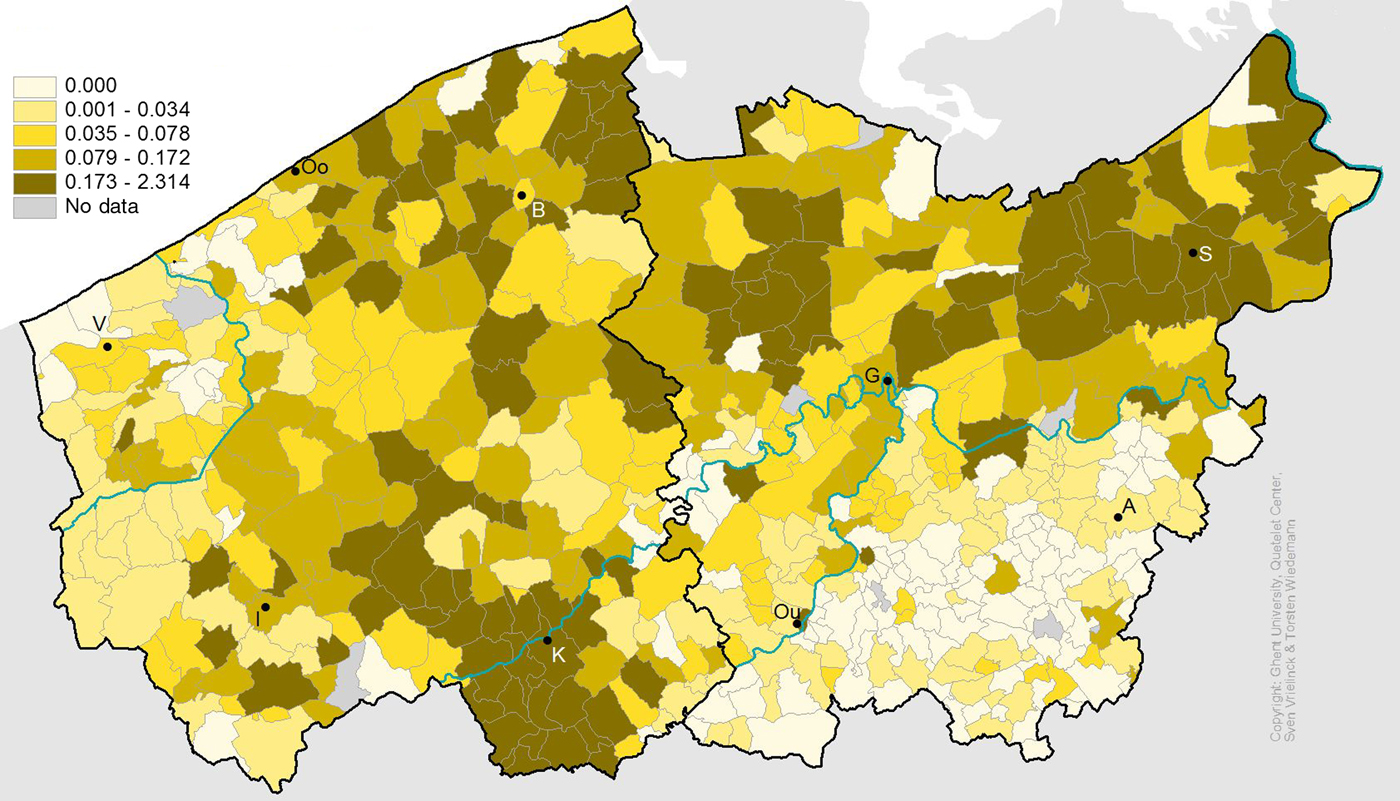
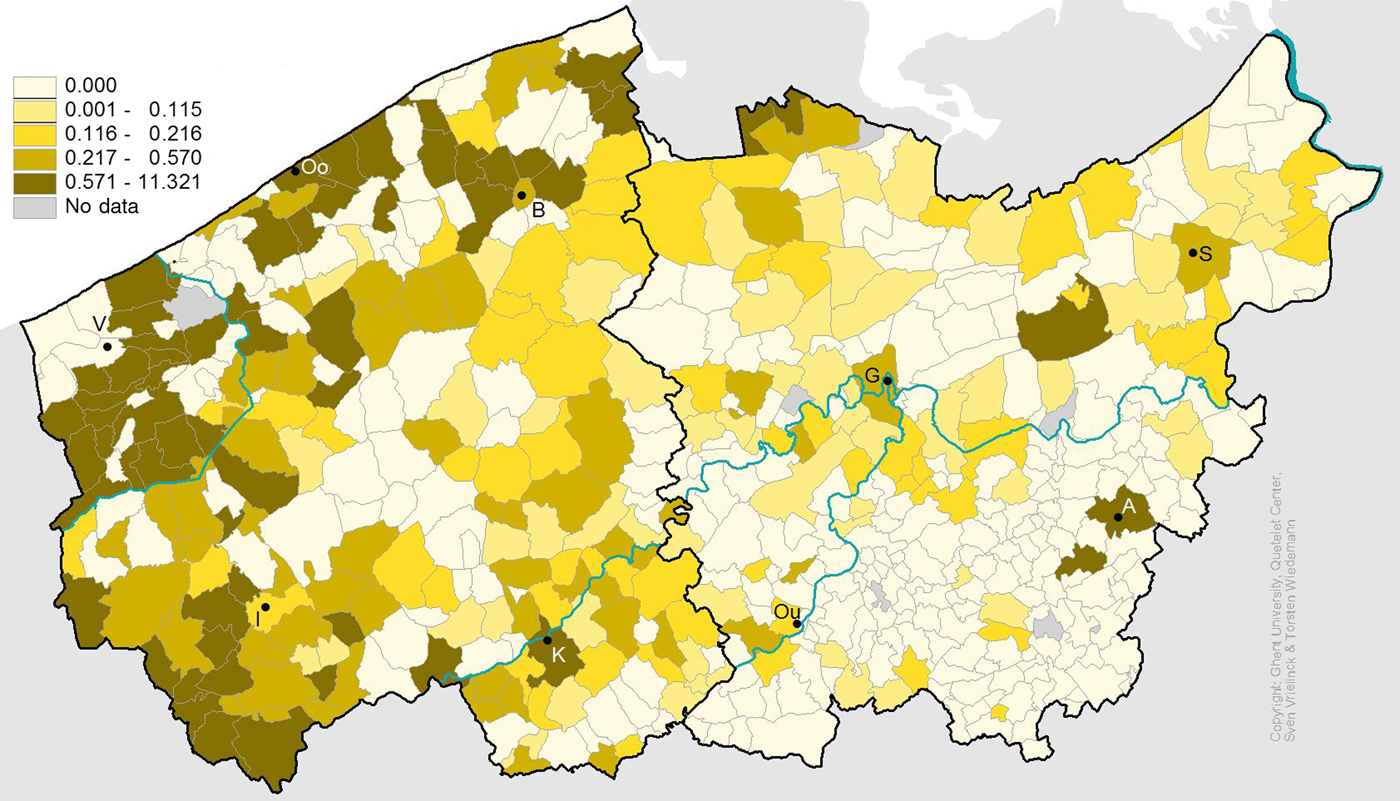
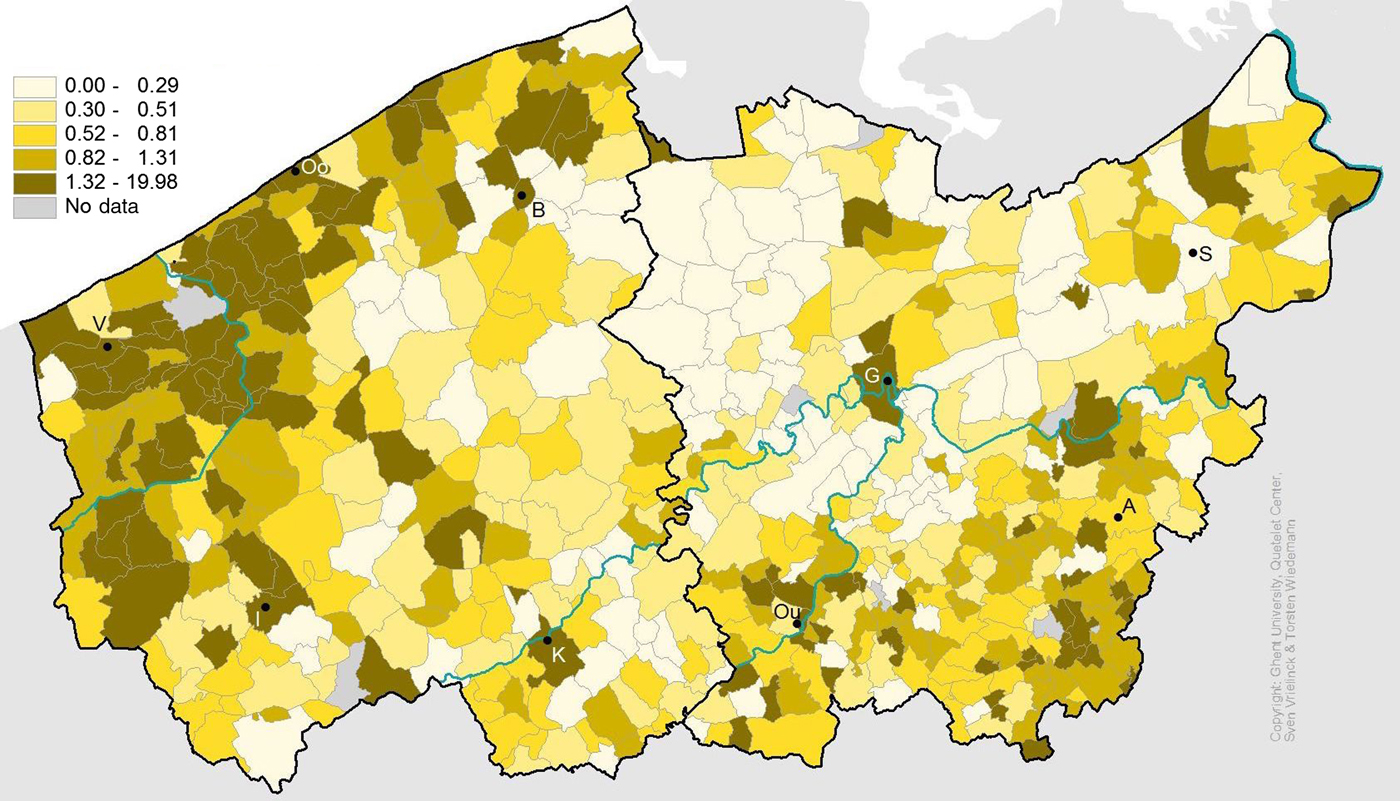
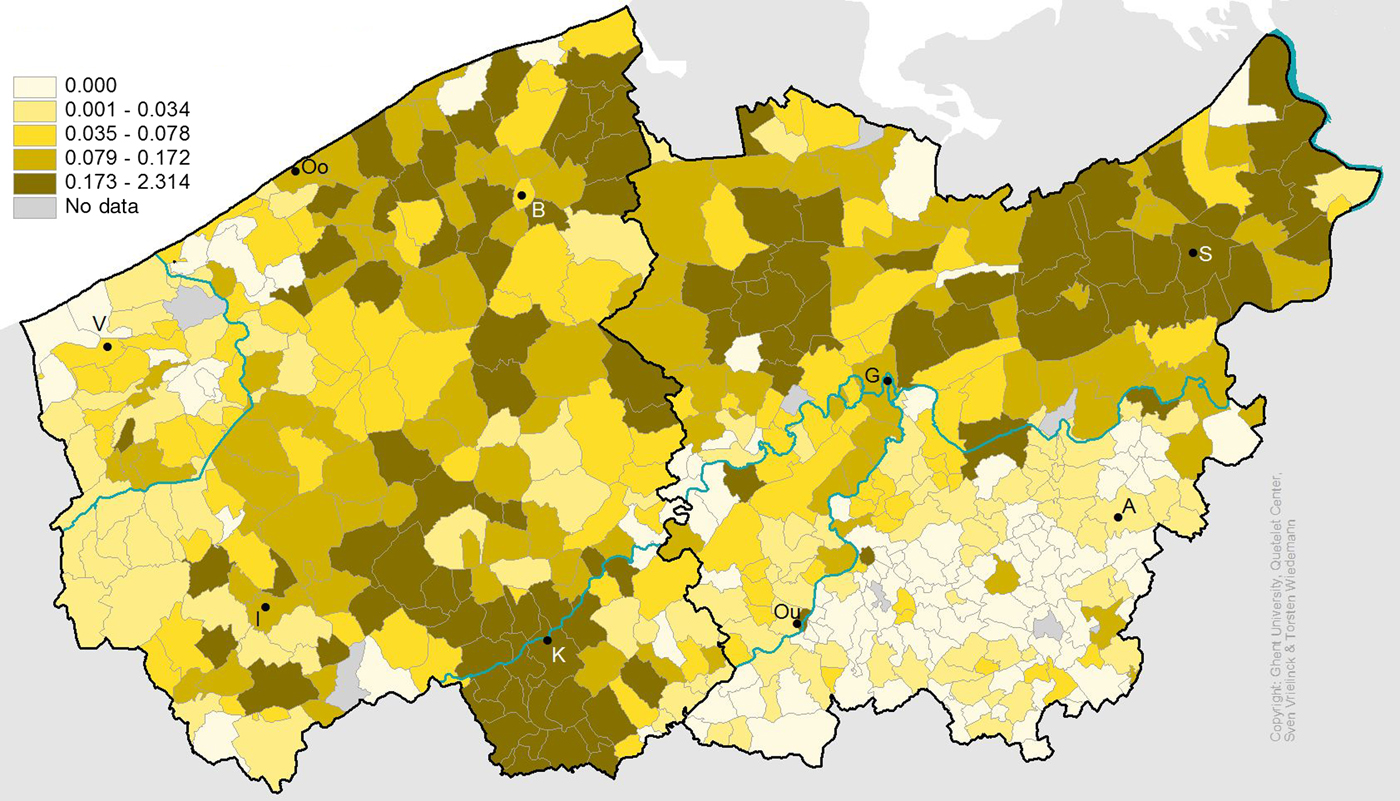
Geographically, the best endowed parishes in terms of fixed revenue were situated in coastal and western Flanders, on the one hand, and in the south-eastern corner, on the other (Figure 6). These were separated by a north-south belt in the middle where most parishes belonged to the lowest two quintiles in terms of fixed revenue per capita. With regard to unforeseen revenue, four clusters with relatively high levels can be identified: three clusters in the northern belt running from the coast to the polders in Waasland, and one southern cluster in the region around Tournai and Courtrai (Figure 7). To the extent that these revenues were indeed derived from donations, these spatial differences might hint at very different practices of daily charity. However, the variety in types of income included in this category hampers further interpretation of these differences at the moment.Footnote 45 The parishes that derived relatively high income from taxes were found in coastal Flanders and the countryside around Ypres in the west, but in the coastal region they were interspersed with parishes recording no taxes (Figure 8). Most of the inland regions of West Flanders and virtually all of East Flanders recorded no or insubstantial income from taxes.
Fixed revenue per capita (in fr.).
Unforeseen revenue per capita (in fr.)
Revenue taxes per capita (in fr.).
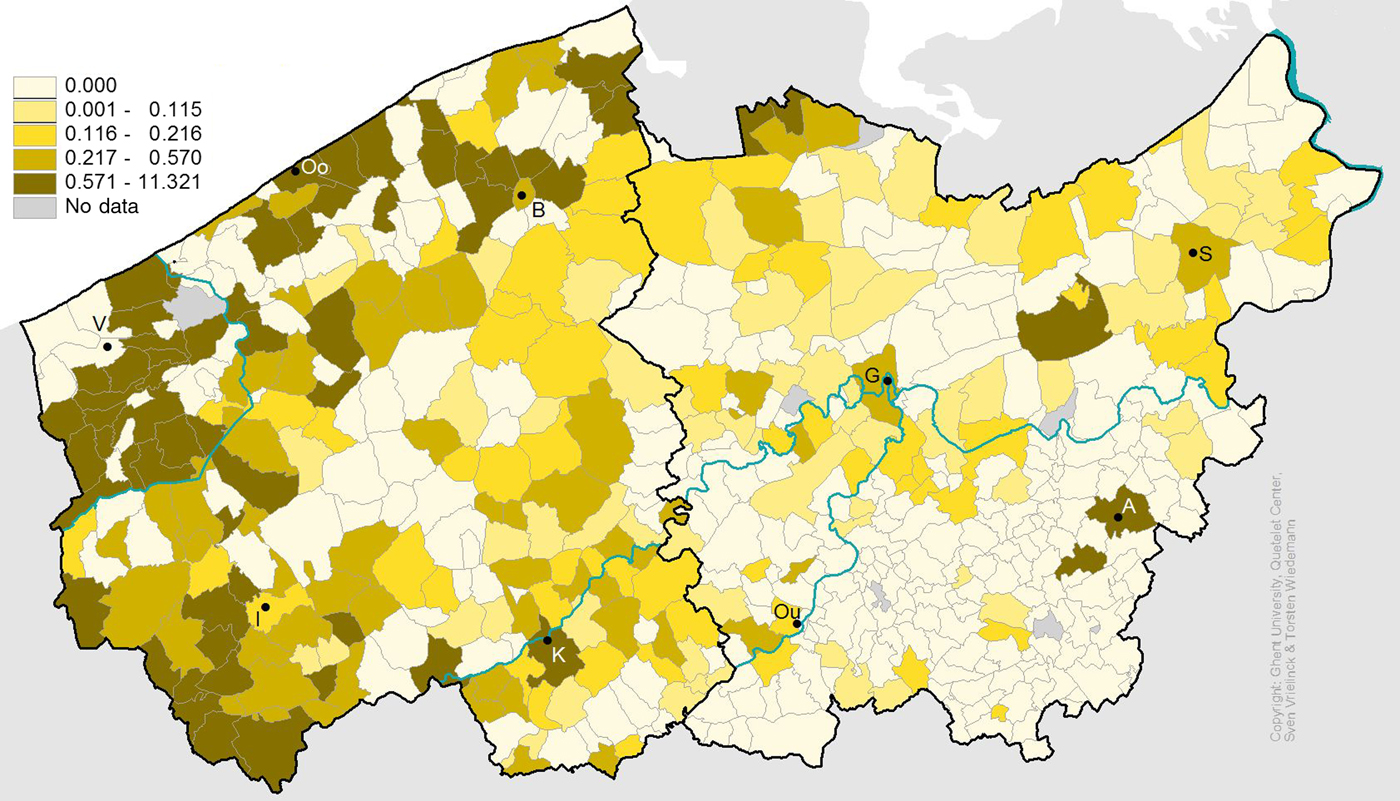
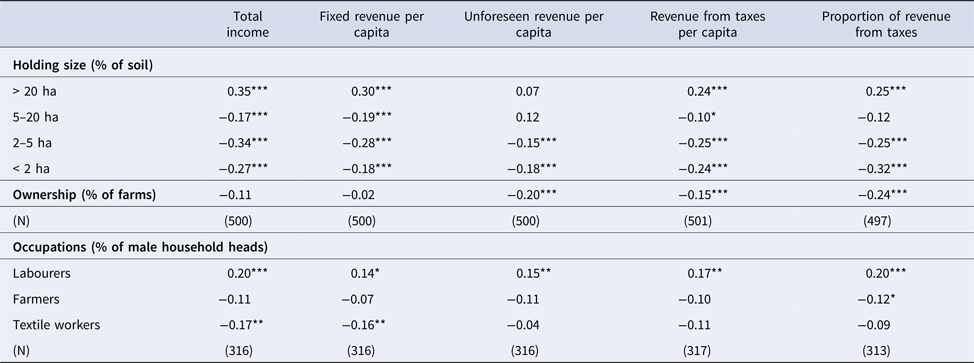
Again, the spatial patterns explored in Figures 6 to 8 suggest a clear association with regional economies, which are confirmed by the correlations in Table 6. Income from fixed revenue was associated positively with the incidence of large farms and labourers, and negatively with that of smaller-scale farming and textile workers. The ambiguous category of ‘unforeseen revenue’ was correlated positively with the incidence of medium-sized holdings and labourers, and negatively with that of small-sized and micro-holdings and of farm ownership. Income from taxes correlated positively with the share of large holdings and labourers, and negatively with that of all other farm size categories and of farm ownership. If we look at the relative importance of taxes as against that of income from fixed and unforeseen revenue, there is a positive correlation with large-scale farms and labourers, and a negative one with small-scale and micro-holdings, ownership and farmers. These results, in other words, further corroborate the spatial patterns observed earlier. Parishes dominated by capital-intensive commercial agriculture, situated mainly in the coastal and polder areas, were more likely to have high relief incomes, financed partly by taxes. Conversely, those characterised by subsistence-oriented cottagers or small-scale independent peasants, situated mainly in the inland areas, were more likely to have less relief income and fewer taxes.
Correlation table comparing proxies for local economic structure and income patterns, 1796/1807/1846

* p < .05, ** p < .01, *** p < .001. Data on poor relief from poor relief enquiry of 1808 (STREAM). Data on holding size and farm ownership from the 1846 agricultural census (LOKSTAT). Data on occupations of male household heads from the 1796 census (STREAM). See appendix.
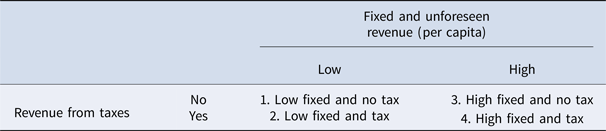
It is important to note that taxes therefore did not feature as ‘compensation’ for low income from other sources. On the contrary, parishes with relatively high income from other sources of revenue were actually more likely to raise additional income from taxes. In order to gain more insight into patterns of local variation, we distinguished four types of ‘income regimes’ – each representing between 18 and 32 per cent of all parishes – according to whether income per capita from fixed and unforeseen revenue, on the one hand, and income per capita derived from taxes, on the other were higher or lower than the median value (Table 7).
Four ‘income regimes’

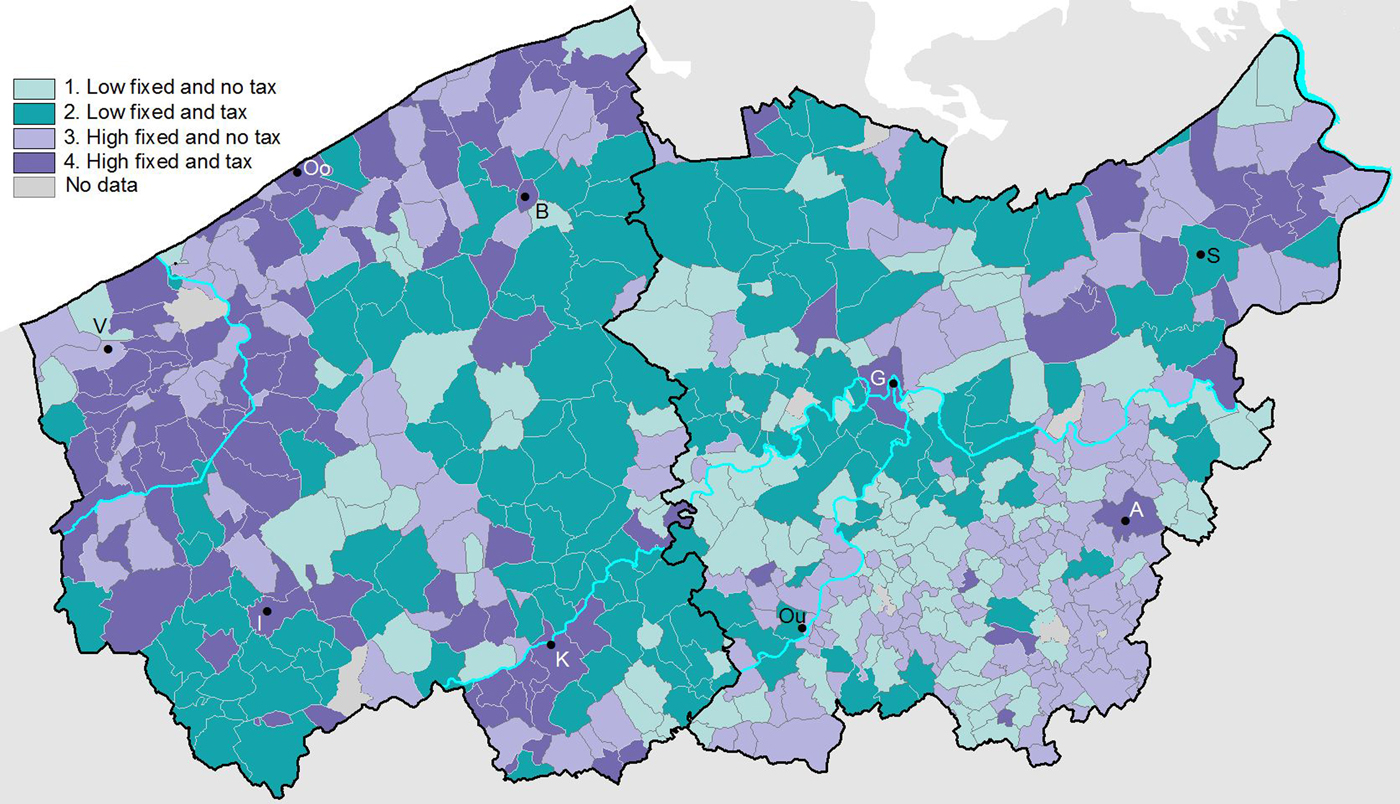
Mapping these income regimes spatially again yields some interesting regional patterns of local variation (Figure 9). From west to east we first encounter a coastal zone where the third or fourth regime dominated, a pattern that also emerges in the north-east polder region. Parishes in this zone thus shared overall high revenue from fixed and unforeseen sources of income combined, and local variation was determined by whether or not they raised additional taxes. Second comes a broad north-south belt of inland parishes characterised mainly by the second and first regime, which means that they shared an overall low revenue from fixed and unforeseen sources of income combined, and that local variation was likewise determined by whether or not they raised additional taxes. Third, the south-east displays a regional pattern with parishes belonging to the first and third regime. They shared an absence of taxes and local variation was primarily determined by the volume of income raised from fixed and unforeseen revenue. The spatial zones identifiable on the basis of income regimes, then, show great resemblance to those identified on the basis of distribution regimes, and reflect their association with regional economies.
Income regimes.
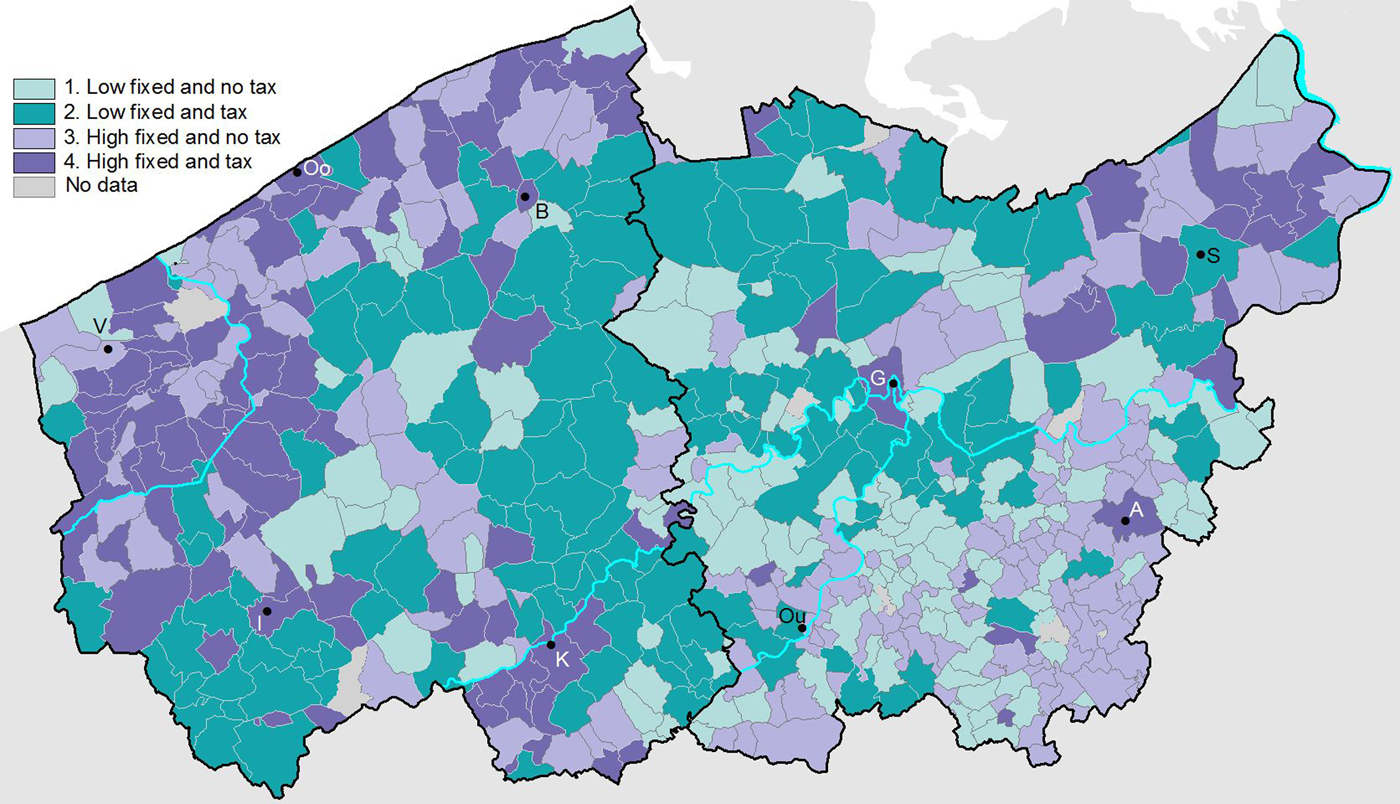
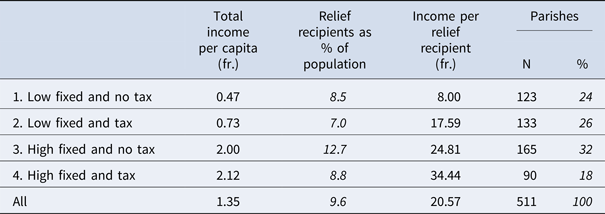
The strong connection between income regimes and distribution practices is also apparent in Table 8. The connection between income regime and total income per capita in the first column is self-evident: while parishes in the first regime with low income from fixed and unforeseen revenue and no taxes recorded very low total income (0.47 fr.), those in the fourth regime that combined taxes with high income from other sources had the highest total income (2.12 fr.). The large difference in total average revenue between parishes in the second (0.73 fr.) and third regime (2.00 fr.), indicates that although taxes could be raised to top up low levels of other income, they did not compensate for them. The other columns in Table 8 lead to some more interesting observations. On the one hand, the second column shows that parishes in the third and fourth income regime counted more relief recipients on average (12.7 and 8.8 per cent) than in the first and second regime (8.5 and 7.0 per cent), which reflects an overall positive correlation between total income and number of recipients. However, within the high-income and low-income groups respectively, the number of relief recipients was significantly lower when taxes were raised than when they were absent. Indeed, when income is kept constant, the proportion of income raised by taxes correlates negatively with the number of relief recipients: the larger the contribution of taxes, other things being equal, the more limited the group of relief recipients.Footnote 46 Although it is theoretically conceivable that a smaller number of paupers might stimulate the raising of taxes, it is more likely that causality ran in the other direction: the existence of poor taxes made relief administrations more restrictive when judging entitlement and worthiness, most likely because overall concern for frugality was higher when expenditure had direct repercussions for the volume of taxes raised. The consequence is that in terms of income per relief recipient, the four income regimes related to very distinct distribution practices, ranging from an average of 8.00 fr. per pauper in the first regime to 34.44 fr. in the fourth regime. This also corroborates the inference that stricter interpretations of deservingness went hand-in-hand with higher expenditure per pauper, as the most needy cases were probably more likely to remain on the lists.
Mean values of income and distribution practices according to income regime, 1807

Source: Poor relief enquiry of 1808 (STREAM). One missing observation. See appendix.
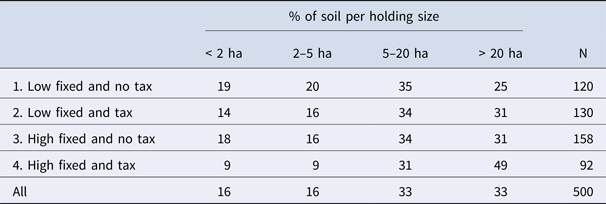
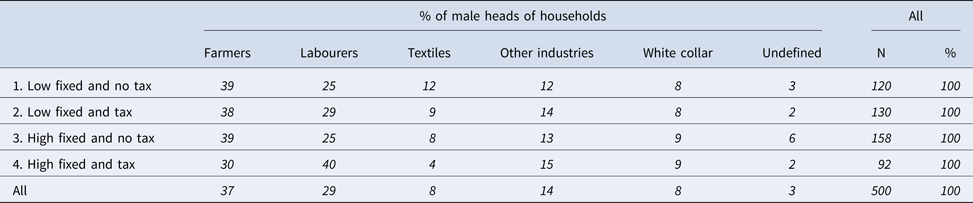
Tables 9 and 10 further confirm the intimate connections between income and distribution practices, on the one hand, and landholding and occupational structures, on the other,Footnote 47 especially as regards the contrasts between the first and fourth regime. The fourth regime, characterised by high income financed partly by taxes, systematically scores high for all the proxies associated with agrarian capitalism: almost half (49 per cent) of the cultivated soil in these parishes was taken up by farms larger than 20 ha, while a large share (40 per cent) of the male heads of households were recorded as labourers and a relatively small share (30 per cent) as farmers. Conversely, the first regime of low income and no tax is associated with high shares of small-sized (39 per cent) and medium-sized (35 per cent) holdings, and with a large proportion (39 per cent) of male household heads recorded as farmers and a relatively low proportion (25 per cent) as labourers. In addition, parishes in this regime on average also counted high numbers of textile workers (12 per cent), which is indicative of a stronger involvement in proto-industrial linen activities that acted as a vital complement to subsistence-oriented agriculture.
Land holding structure according to income regime, 1807/1846

Note: Data on farm size from agricultural census 1846 (LOKSTAT), those on poor relief from poor relief enquiry of 1808 (STREAM). See appendix. The sum of the % slightly diverges from 100% because the census gives only number of holdings per (detailed) size categories rather than exact size of the different holdings, requiring a modest extrapolation.
Occupational structure according to income regime, 1796/1807

Source: Information on occupational structure from 1796 census (STREAM), data on poor relief from poor relief enquiry of 1808 (STREAM). See appendix.
The fourth regime, then, was intimately associated with local economic structures tending towards agrarian capitalism, structures which we know were most pervasive in the coastal areas. The first regime, in contrast, was reserved mainly for parishes where farming was more small-scale, subsistence-oriented and complemented by proto-industrial textile activities, which were present mainly in the southern inland areas. These connections between income regimes and local economic structures, in other words, tally with the spatial patterns observed earlier. Parishes in the intermediate second and third regimes in turn also occupy a middle ground between the first and fourth in terms of the available indicators for local economic structure, which further strengthens the observed associations. Understanding to what extent differentiation between the second and third income regime was associated with variation in local economic structure remains difficult with the proxies at hand.
6. Between destiny, necessity and policy
The spatial and statistical associations between relief patterns and economic structure observed in the previous pages suggest distinct roles for destiny, necessity and policy in moulding the spatial variety of relief regimes. In the first place, relief regimes were of course influenced by the amount of fixed income that was derived from capital assets, that is, the gifts and endowments received in the past. In practice, this meant that the presence of one or two exceptionally generous benefactors in the past could make all the difference between a relatively ‘rich’ and ‘poor’ relief institution. Although this means coincidence played an important role (‘destiny’), we saw that variation in fixed revenue was not completely random, or at least not everywhere. In the coastal areas, where agrarian wage labour and social polarisation were more pervasive – a trend dating back to the late Middle Ages – income derived from fixed revenue was generally higher compared to inland areas. Notwithstanding these generally higher incomes from capital assets, moreover, many coastal parishes raised additional taxes – itself an indication that the eighteenth-century acceleration in proletarianisation increased pressure on existing relief provision.Footnote 48 The overall higher income spent on poor relief in the coastal areas, derived from both capital assets and taxes, fits well with the argument that transitions towards agrarian capitalism necessitate higher relief provisions to compensate for the absence of independent, alternative income among wage labourers (‘necessity’) – as it was formulated most explicitly by Patriquin. That pressure on relief provision was particularly high in these regions is corroborated by the observation that taxes were often raised to complement already high incomes from capital. To the extent that taxes were paid by a larger group than labour-employing farmers, they could moreover provide labour cost subsidies to local employers in the way George R. Boyer argued for south-east England.Footnote 49 Interestingly, distribution policies in these areas could be relatively selective, especially when taxes were raised. This selectivity in turn tallies with arguments by Caterina Lis and Hugo Soly, among others, that the growing obsession with differentiating between ‘deserving’ and ‘undeserving’ poor was related to processes of proletarianisation, and that relief policies were increasingly used as a means of social and economic control as labour became more commodified.Footnote 50 Although fostered by necessity, the influence of ‘policy’ was in any case large in this region; both by raising additional income through taxes and by scrutinising deservingness, policy decisions played an important part in generating the observed local and regional relief patterns in the area.
An area where ‘destiny’ appears to have played a more important role than ‘necessity’ in generating the observed spatial variations is that of south-east Flanders. Most parishes in this region had a relatively large number of relief recipients, irrespective of income. That some tables were considerably richer than others had more to do with ‘destiny’ than ‘policy’, as this was attributable primarily to disparate capital gifts received in the past, and no attempts were made to adjust unequal incomes through raising taxes. The absence of taxes suggests that economic pressure on relief provisions (‘necessity’) was markedly lower here than in the coastal areas. In line with arguments such as that of Patriquin, the predominance of micro-holdings and small-scale holdings and high levels of ownership mean that these communities were characterised by lesser degrees of social polarisation and a greater part of its members still retained, be it small, independent sources of income.Footnote 51 This does not rule out that many were poor, especially the cottagers who cultivated farms of less than two ha. That many were indeed considered poor enough to enjoy some form of relief, is corroborated by the high numbers of relief recipients in the area – which in turn signals the pervasiveness of a more open and less selective policy than in the coastal area. Indeed, poor relief in this area appears to have functioned very differently. Rather than being selective, distribution was of a more generalised nature. Rather than being an instrument of control, poor relief might have functioned more as an instrument of social cohesion in a similar fashion to that described by Katherine Lynch for early modern urban contexts.Footnote 52 Because many inhabitants of these parishes still retained – often very small – plots of land, poor relief probably functioned as a complement to other, independent sources of income, which helps to understand why expenditure per capita was so much lower than in the coastal areas.Footnote 53
Lastly, in the middle area, poor relief was less extensive overall. Parishes in this wide north-south belt overall had relatively little income for relief. Some raised additional taxes, but these could not compensate for low income from capital. Overall relief expenses thus remained low, while relatively few people received any relief. Notwithstanding internal variation, this region was characterised by a particular combination of small-scale farms, on the one hand, and medium-scale farms, on the other, and by high levels of proto-industrial textile activity that offered additional sources of income. Lambrecht observed how this particular combination fostered the existence of distinct exchange networks in the area that tied smaller farmers to large ones in long-standing credit relations, which also functioned as an emergency credit line in times of crisis.Footnote 54 While these reciprocal relationships were under increasing pressure in this period, their past and continued existence as alternative support mechanisms helps to explain why poor relief overall was so little developed in the area. The continued, be it eroding, existence of these networks of reciprocity together with the availability of additional income from proto-industrial textile production and potato plots, would have lessened poor cottagers’ dependence on formal relief provisions (‘necessity’). Furthermore, their long-standing history as informal institutions for exchange and – if need be – redistribution probably also explains why these regions had developed less of a tradition of formal poor relief and why relatively little capital had been built up from previous legacies (‘destiny’).
7. Conclusions
By analysing local income and distribution practices in early nineteenth-century Flanders, we were able to show how they overlapped spatially and correlated quantitatively with the main regional variations in socio-economic structure. But although regional economies played an important role in the explanation of the observed relief patterns, local variation remained high. It is only by observing patterns of local variation that regional patterns emerge, not the other way around. Next to mostly regionally determined variations in socio-economic structures, local variations in policy priorities and historically accumulated capital reserves and traditions could have an important effect on distribution practices, but within limits characterised by underlying regional structures. The close association of rural capitalist relations of production with high levels of poor relief, on the one hand, and of small-scale subsistence farming with low levels of poor relief, on the other, corroborates the idea that the expansion of rural poor relief was spurred by the need for additional support as growing numbers of proletarianised workers lost alternative sources of income and access to alternative support mechanisms such as local exchange networks. The interaction of these regional economies with local policies produced various income and distribution regimes in practice, where poor relief could fulfil very distinct local roles: from an instrument for labour regulation to one of social cohesion, taking up a very different role in parishes’ ‘mixed economy of welfare’.
The results yielded by this study in turn invite further research. As our findings essentially stem from a cross-sectional analysis, further investigation of the purported causalities would benefit from a longitudinal approach, where local relief practices can be analysed over time in relation to changes in agrarian relations of production. Another avenue for future research requires fleshing out the different local regimes identified: did the profile of relief recipients and the types of relief vary according to the observed variations in distribution and income regimes? Likewise, studying the possible interference of intra-regional and inter-regional mobility would help us to better understand how migrants’ relief entitlements interacted with spatial variations in relief regimes. Answers to these questions would also help to gain more insight into the implications of these different regimes for the poor themselves and on the possible interactions with alternative support mechanisms – questions we aim to follow up on in future research.
One last reflection returns to our starting point. Since our empirical study pertains to only one ‘national’ framework, it does not allow for any direct comparative evaluation of the importance of the national level in relief regimes. The fact that so much variety could be observed within one common national framework, however, signals that its influence was probably not decisive. Yet, when compared to the English case, this observation appears in need of qualification. Even when taking into account the possible negative impact of the recent regime changes on Flemish poor table assets in 1807 and the spurt in English relief expenses in the Napoleonic period, there appears to have been a clear difference in the order of magnitude, where at best only the upper 5 per cent of Flemish parishes approximated the average level of relief per capita spent in contemporary England in rural wage equivalents. Likewise, as poor taxes were ubiquitous in England by this time, the elasticity of income was much higher, and standards of minimal provisions might have been more pervasive and uniform, leaving less room for local variation than in Flanders – hypotheses that can only be tested by further comparative research. In any case, however, our results suggest that studying local variation, in conjunction with regional socio-economic structures within and between different ‘national’ frameworks, would provide a more fruitful approach to gaining insight into the underlying causes of spatial variation than using ‘national’ regimes as an a priori meaningful unit of analysis.
Acknowledgements
Earlier versions of this article were presented and discussed at the STREAM project meetings at the University of Ghent, at the HOST seminar at the Vrije Universiteit Brussel and at the ESSHC conference in Valencia. We would like to thank all participants at these venues as well as the anonymous referees and the journal editors for their valuable comments.
Appendix
The main data used in this article were derived from the 1808 survey on poor relief, coupled with a range of proxies from the 1796 population census and 1846 agricultural census. The departmental returns to the 1808 nationwide survey on poor relief provide tabulated information on population size, the number of poor relieved,Footnote 1 and the income at the disposal of each bureau de bienfaisance, in turn divided into fixed revenue (the annual proceeds from renting out land and houses and/or interest from capital), taxes (raised by the municipality but transferred to the bureau de bienfaisance) and miscellaneous one-off sources of income (testamentary donations, church collections, sale of assets and so on) for each municipality.Footnote 2 These returns were collected by Glenn Plettinck in the context of the ongoing STREAM data-collection project (Spatiotemporal Research Infrastructure for Early Modern Flanders and Brabant) co-ordinated by Isabelle Devos (University of Ghent): www.streamproject.ugent.be. The census was carried out in late July and early August 1808, but the figures are based on the accounts of 1807. Population figures were copied from the census that had been undertaken in 1806 (one of the most reliable censuses of the French period).Footnote 3 The data used for the 1796 census go back to the aggregate figures as they were calculated on the basis of the nominal lists and published in a limited edition of so-called ‘Werkdocumenten’, which were collected in digital form by Glenn Plettinck in the context of the STREAM project.Footnote 4 The census returns of the 1846 agricultural census were digitised in the context of the LOKSTAT project (Historische Databank van Lokale Statistieken) co-ordinated by Eric Vanhaute and Sven Vrielinck (University of Ghent): www.lokstat.ugent.Footnote 5 As not all 1796 census lists are preserved, the STREAM data for 1796 provide data for 317 rural municipalities in East and West Flanders, while LOKSTAT data for 1846 could be linked to five hundred rural municipalities recorded in the 1808 poor relief survey. All the maps were provided by Sven Vrielinck and Torsten Wiedemann in the context of the Quetelet Center of Ghent University. We would like to thank Glenn Plettinck, Sven Vrielinck and Torsten Wiedemann in particular for their valuable help in collecting and visualising the data.