I. INTRODUCTION
Antiperovskite manganese nitrides have attracted significant attention in the past decade because of the discovery of a wide variety of interesting physical phenomena such as superconductivity, Reference Prozorov, Snezhko, He and Cava1 giant magnetoresistivity, Reference Kamishima, Goto, Nakagawa, Miura, Ohashi, Mori, Sasaki and Kanomata2 near-zero temperature coefficient of resistivity, Reference Chi, Kim and Hur3,Reference Sun, Wang, Chu, Wen, Nie and Liu4 magnetostriction, Reference Asano, Koyama and Takenaka5 resistive switching phenomenon, Reference Sun, Guo, Wang, Tsujimoto, Matsushita, Shi, Wang, Belik and Yamaura6 and negative thermal expansion. Reference Fruchart, Madar, Barberon, Fruchart and Lorthioir7–Reference Sun, Wang, Wen, Zhu and Zhao10 Experimental evidence has shown that complicated interactions between the lattice, the electronic freedom, and the spin carriers in these compounds play a pivotal role in these phenomena. Reference Kim, Chi, Kim, Choi and Hur11 The understanding of these relationships should be based on real and accurate experimental results. However, different researchers gave different, even opposite results, and the resulting uncertainty makes it difficult to get a real description of these phenomena and further to understand the origin of them.
Even for a simple compound Mn3ZnN, its negative thermal expansion behavior is still in question although many researchers have paid attention to it. Fruchart et al. Reference Fruchart, Madar, Barberon, Fruchart and Lorthioir7 characterized their sample by two successive phase transitions occurring at 180 K with volume expansion and 130 K with volume contraction, respectively. However, the latter phase transition is missing in the study by Kim et al. Reference Kim, Chi, Kim, Hur, Lee and Choi8 The theoretical study performed by Qu and Pan Reference Qu and Pan12 supports the result of Fruchart et al. and suggests that a sample with 25% N vacancy would exhibit a behavior similar to that observed by Kim et al. By changing the sintering temperature, Hamada and Takenaka Reference Hamada and Takenaka9 observed similar behaviors of these two types and found that there is no significant difference between the N content of the two samples, they suggested that the difference between Mn3ZnN of these two types is related to the nitrogen vacancy disorder. However, Sun et al. Reference Sun, Wang, Wen, Zhu and Zhao10 reported that the magnetic phase transition taking place at around 185 K is a second-order phase transition, which is different from the former results.
Until recently, the studies on this kind of compound have mainly been carried out at macroscopic scale. Information from the microscopic scale would be helpful to find the reason for the difference between different researchers' results and further to understand the origin of the interesting phenomena occurred in these compounds. In this work, we report our transmission electron microscopic (TEM) studies of Mn3Zn0.8Ni0.2N, Mn3Zn0.5Ni0.5N, and Mn3ZnN. We found that the sample particle has a “shell” of MnO about a few nanometers thick. To confirm this conclusion at the macroscopic level, we collected the x-ray photoelectron spectrum (XPS) of Mn3ZnN and got the consistent result.
II. EXPERIMENTAL SECTION
Polycrystalline samples Mn3Zn0.8Ni0.2N etc. were prepared by solid-state reaction in vacuum. The detailed process and a discussion of the sample properties are given in Ref. Reference Sun, Wang, Chu, Wen, Na, Nie and Chen13.
TEM thin foils were prepared by crushing the samples in an agate mortar filled with alcohol and then dispersing the fine fragments suspended in alcohol on a microgrid. A Tecnai F20 electron microscope (FEI, Hillsboro, OR) with a field-emission gun, operated at an acceleration voltage of 200 kV, was used for TEM observations. Energy dispersive x-ray spectrum (EDX) and electron energy loss spectrum (EELS) measurements, which were carried out at 400,000 times magnification, were used to recognize the chemical composition of a small area. TEM Imaging and Analysis software was used to quantify the EDX spectra. EELS results were analyzed with Digital Micrograph software. The XPS measurement on Mn3ZnN powder was performed by an ESCALAB 250Xi XPS spectrometer (Thermo Fisher Scientific Inc., Waltham, MA) with an Al anode using the x-ray spot size of 900 µm.
III. RESULTS AND DISCUSSION
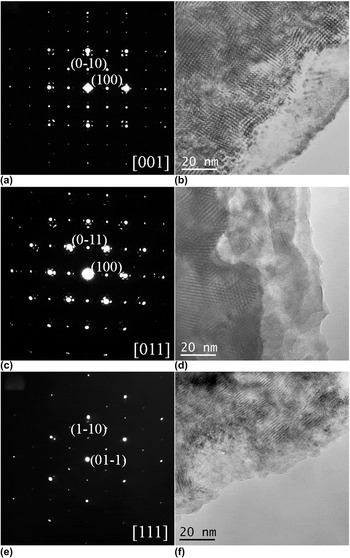
The selected area electron diffraction (SAED) patterns of the three main zone axes ([001], [011], and [111]) of Mn3Zn0.8Ni0.2N are shown in Figs. 1(a), 1(c), and 1(e), respectively. In these patterns, there are some weaker spots around the basic diffraction spots corresponding to the antiperovskite crystal structure, and some of them are much brighter than the others. According to our TEM knowledge, these brighter spots indicate the presence of a second phase, which must be very minor according to the XRD spectrum, and these patterns can be produced on the principle of multiple diffraction. Based on some detailed analyses, we assumed that the sample particles are wrapped by a thin layer of a second phase. This model is supported by the corresponding morphology images shown in Figs. 1(b), 1(d), and 1(f). The near edge area is clearly different from the inner part, indicating that it should be the second phase.
SAED patterns along (a) [001], (c) [011], and (e) [111] directions and the corresponding morphology images (b), (d), (f) of Mn3Zn0.8Ni0.2N.

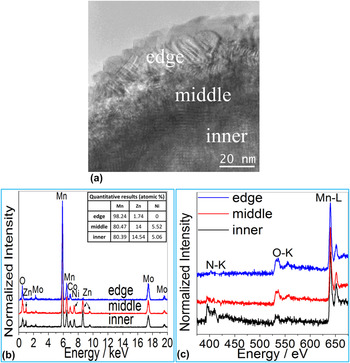
To identify the second phase, we characterized its chemical composition with EDX and EELS measurements. We collected EDX and EELS spectra of the edge and inner area of many particles. We found that there are only Mn and O compositions in the edge area of some particles, and in some other cases, there is also little Zn, Ni, and/or N, whereas there are much Zn, Ni, and N in the inner area. A typical result is shown in Fig. 2. So, we reasonably concluded that the second phase is one of the manganese oxides. The SAED results shown in Fig. 1 suggest that the second phase should have a face-centered cubic crystal structure with a cell parameter a ≈ 4.4 Å. In the manganese oxides, only MnO can satisfy this restriction, which has a space group of Fm-3m with a = 4.436 Å (PDF No.: 1-1206). As a result, we concluded that the second phase is MnO.
(a) Demonstration of different areas for collecting EDX and EELS spectra. Related EDX and EELS spectra are shown in (b) and (c), respectively. The arrows indicate the position of the peaks of Zn and Ni. The EDX and EELS spectra are normalized to have equal intensity of the highest peak. The Mo and Co in EDX spectra are from the microgrid and the sample holder, respectively. The quantification results of the EDX spectra are shown in the inset table in (b). Due to the MnO layer, the Mn content is slightly higher than the nominal value.

The distribution of Zn and Ni elements has a sharp step as going further from the edge to the inner area as indicated by the EDX spectra shown in Fig. 2(b), this significant composition difference and thus resulted different crystal structures should be responsible for the appearance of the sharp border between the edge area and the inner part on the morphology images shown in Figs. 1 and 2.
On the EELS spectra collected from the middle and inner parts shown in Fig. 2(c), the obvious O K-edge should be contributed by the MnO surface.
We also measured the width of the edge area to estimate the thickness of the MnO layer and found that it ranges from about 3 nm to more than 40 nm, showing no dependence of zone axis direction.
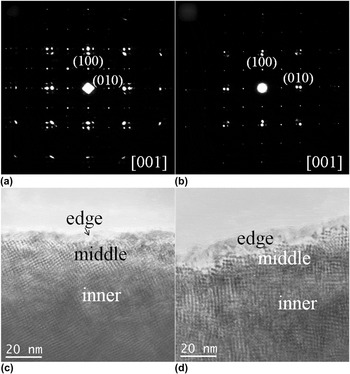
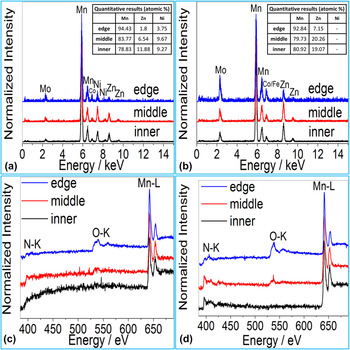
When we found that the Mn3Zn0.8Ni0.2N particle is wrapped in a thin film of MnO, we have a question naturally: is this a general feature? Or is there just something wrong with our sample? So we studied more manganese nitrides: Mn3Zn0.5Ni0.5N and Mn3ZnN. The SAED patterns along [001] direction of these compounds shown in Figs. 3(a) and 3(b) are almost the same as that of Mn3Zn0.8Ni0.2N shown in Fig. 1(a), and the particles also have a clear edge area as shown in Figs. 3(c) and 3(d). EDX and EELS results also suggest that the edge area is mainly manganese oxide as shown in Fig. 4. In summary, we found the same phenomenon in these compounds as in Mn3Zn0.8Ni0.2N, so it should be a general feature in this kind of compound.
SAED patterns along [001] direction of (a) Mn3Zn0.5Ni0.5N and (b) Mn3ZnN, respectively. The corresponding morphology images are shown in (c) and (d), respectively. EDX and EELS spectra of these two particles are shown in Fig. 4.

EDX and EELS spectra collected from different areas of the particles shown in Fig. 3: (a) and (c) for Mn3Zn0.5Ni0.5N; (b) and (d) for Mn3ZnN. The EDX and EELS spectra are normalized to have equal intensity of the highest peak. The Mo and Co (and/or Fe) in EDX spectra are from the microgrid and the sample holder, respectively. The quantification results of the EDX spectra are shown in the inset tables in (a) and (b). Due to the MnO layer, the Mn content is slightly higher than the nominal value.

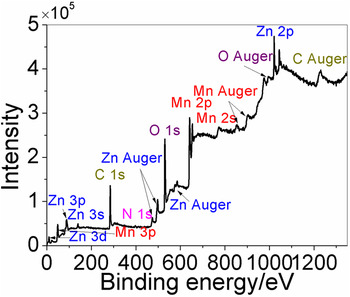
To confirm our TEM conclusion, we carried out XPS measurements on Mn3ZnN powder, which could reveal the information about the surface of the sample within a few nanometers macroscopically. A full-scan spectrum is shown in Fig. 5. The Mn and O peaks are very strong in the spectrum, whereas the N-related peak is negligible. This result also suggests that the surface of the Mn3ZnN powder is covered by manganese oxide. There are also some Zn-related peaks on the spectrum, and in our study, Zn(Ni) was also detected at the edge area of some particles, although its relative content is lower than that in the inner part. This fact may mean that the transformation from manganese nitrides to MnO is incomplete in some cases. As a result, we get consistent result at both the macroscopic and microscopic scales.
The full-scan XPS spectrum of Mn3ZnN powder. The C is from organic contaminants which are hard to avoid in XPS measurements.

The presence of MnO is also supported by some other experiments. In the high-pressure x-ray powder diffraction measurements on Mn3Zn0.8Ni0.2N performed by Hu et al., Reference Hu, Sun, Cong, Zhao, Zhang, Zhang, Li, Liu, Jin and Yu14 there is an obvious peak of MnO (111). And there is also a small but obvious peak which can be determined as MnO (111) in the high-pressure angle dispersive x-ray powder diffraction patterns of Mn3GaC reported by Meenakshi et al. Reference Meenakshi, Vijayakumar, Lausi and Busetto15 However, this peak is almost invisible in the ordinary x-ray powder diffraction patterns.
Our work suggests that there is no or little M on the surface of the sample particles of manganese nitrides Mn3MN (M = Zn, Ni, Cu…). As the shape of our sample particles is manifold, and there is no clue (Only MnO was detected as a secondary phase in XRD patterns as well as TEM mircroanalysis of the composition of the particles) to the presence of pure Mn or M, it is reasonable to conclude that this phenomenon is caused by the preferred loss of M on the surface in the process of our TEM sample preparation, rather than by Mn segregation during sintering. A reasonable explanation of the preferred loss of M is that M has a weaker bonding environment than Mn. On the surface of the sample particle, the activation energy of M may be much lowered due to the surface effect, thus the loss of M would occur under some conditions. Due to the high diffusibility of N, the loss of N is ordinary in Mn3MN, especially on the surface of sample particles. In the presence of O, the oxidation of Mn may occur after the loss of N and M, or they occur at the same time, as a result, the particle is wrapped in a MnO layer with a few nanometers. In a word, antiperovskite manganese nitrides Mn3MN (M = Zn, Ni, Cu…) have a strong surface activity.
Since our samples were sintered in vacuum, the MnO layer should not emerge during sintering. It most likely forms in the process of our TEM sample preparation, i.e., while crushing the samples. Due to the friction heat, some local areas could reach a temperature high enough for the activation of M and N and the diffusion of O, i.e., the formation of MnO surface layer during crushing. Since a higher energy is needed to activate M and N and to diffuse O in the inner area of a particle, a higher temperature should be needed for the formation of a thicker MnO layer. While at a certain temperature (or other equivalent conditions), the thickness of the MnO layer should reach a maximum if the condition lasts long enough.
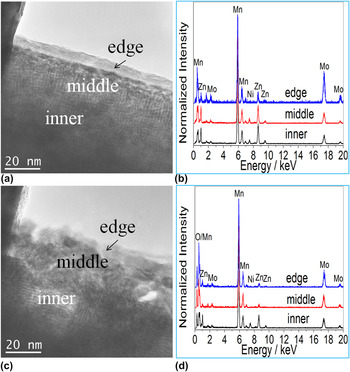
During our TEM work, we have found that the MnO layer could develop due to the electron beam irradiation. As shown in Figs. 6(a) and 6(b), the border between the edge and middle areas is sharp and clear before the irradiation, and their chemical compositions are very different. After some time of irradiation, the middle area loses its M element (Zn and Ni) and the border becomes indistinct, as shown in Figs. 6(c) and 6(d). This phenomenon gives direct evidence to our former conclusion that the loss of M is prior to the loss of Mn in manganese nitrides. The related theoretical studies are eager to be carried out.
The morphology images and corresponding EDX results of a sample particle of Mn3Zn0.8Ni0.2N before [(a), (b)] and after [(c), (d)] some time of electron beam irradiation. The EDX spectra are normalized to have equal intensity of the highest peak. The Mo is from the microgrid.

Hamada and Takenaka Reference Hamada and Takenaka9 represented the different results about Mn3ZnN of different researchers Reference Fruchart, Madar, Barberon, Fruchart and Lorthioir7,Reference Kim, Chi, Kim, Hur, Lee and Choi8 by different heat treatments. Wang et al. Reference Wang, Chu, Yao, Sun, Wu, Ding, Yan, Na, Tang, Li, Huang and Lynn16 found same behaviors in the samples with different Zn content, the samples with 1% and 4% Zn vacancy exhibit two phase transitions, whereas the sample with 7% Zn vacancy exhibits only one phase transition, similar to Hamada's samples sintered at 700 and 900 °C, respectively. This coincidence could be understood based on our results: M is easier to be lost in Mn3MN (M = Zn, Ni, Cu…), and so, higher sintering temperature would result in more M(Zn) vacancies and a small change in the amount of M(Zn) vacancies could greatly alter the properties of the sample. This should be the major reason why different researchers got different, even opposite results.
Besides, when measuring the property of the samples with small size, the relative amount of MnO may be large and its influence cannot be neglected. So, the influence of MnO may be another reason for the difference among different researchers' results. Reference Fruchart, Madar, Barberon, Fruchart and Lorthioir7–Reference Sun, Wang, Wen, Zhu and Zhao10
To understand the physics under the interesting phenomena in manganese nitrides Mn3MN (M = Zn, Ni, Cu…), a real and accurate description of their properties is necessary, so the influence of M vacancies and/or MnO should be carefully avoided to get an accurate result in the future study.
IV. SUMMARY
In summary, we performed systematic TEM studies on Mn3Zn0.8Ni0.2N and found that the sample particles are wrapped in a thin MnO layer. This phenomenon was also found in some other manganese nitrides (Mn3Zn0.5Ni0.5N and Mn3ZnN), indicating that it is a common phenomenon in this kind of compound. The presence of the MnO surface layer was also confirmed by the macroscopic XPS measurements. Our study suggests that M is easier to be lost than Mn in manganese nitrides Mn3MN (M = Zn, Ni, Cu…), this character is much more obvious on the surface due to the surface effect and results in the formation of a MnO layer, i.e., this kind of compound has a strong surface activity.
ACKNOWLEDGMENTS
This work was supported by the State Key Development Program for Basic Research of China (Grant No. 2012CB932302) and the National Natural Science Foundation of China (Grant No. 11174336).