I. INTRODUCTION
Aluminum gallium nitride (AlGaN) metal–semiconductor–metal photodetectors are good candidates for fast detection with a large bandwidth and low-noise performance.Reference Carrano, Li, Brown, Grudowski, Eiting, Dupuis and Campbell1,Reference Walker, Monroy, Kung, Wu, Hamilton, Sánchez, Diaz and Razeghi2 The MSM structure has desirable qualities such as low dark current, fabrication simplicity, and suitability for the monolithic integration.Reference Ferguson, Tran, Karlicek, Feng, Stall, Liang, Lu and Joseph3,Reference Monroy, Calle, Muñoz and Omnès4 The AlGaN ternary alloys have been of interest to researchers for decades for their remarkable tolerance to aggressive environments and tunable cutoff wavelength from 365 to 200 nm, enabling visible-blind and even solar-blind devices.Reference Ferguson, Tran, Karlicek, Feng, Stall, Liang, Lu and Joseph3
However, an extremely long decay time has been commonly reported for GaN/AlGaN-based optical devices after the optical stimulus has been removed.Reference Hou, So, Suria, Yalamarthy and Senesky5–Reference Li, Lin, Jiang, Asif Khan and Chen9 For some devices, it may take hours to days to decay to the ground state. This phenomenon, often referred to as persistent photoconductivity (PPC), has been a bottleneck for applications that require consistent operations and fast response. The possible causes of the PPC effect in GaN and AlGaN/GaN heterostructures have been debated in the literature and include metastable defects,Reference Hirsch, Wolk, Walukiewicz and Haller6,Reference Chen, Chen, Lee and Feng7 gallium vacancy,Reference Qiu and Pankove8 and deep-level defectsReference Qiu and Pankove8,Reference Li, Lin, Jiang, Asif Khan and Chen9 within the epitaxial layers. It is obvious that the suppression of PPC is very desirable for widespread adoption of AlGaN/GaN-based photodetectors.
The reports mentioned above primarily describe photodetector decay behavior when turning on/off a continuous-wave (cw) incident laser. However, for a photodiode illuminated by an ultrafast pulsed laser, the number of injected photons, on a time scale comparable to the PPC decay, is much less than for cw lasers. Yet, the PPC effect in AlGaN photodetectors induced by ultrafast pulsed lasers has not been reported or systematically studied. In this paper, an obvious PPC effect is observed in AlGaN MSM photodiodes with both nanosecond and femtosecond pulsed lasers. Methods to reduce the extremely long decay time were explored and the mechanism of the long decay time is also analyzed.
II. DEVICE LAYOUT AND FABRICATION METHOD
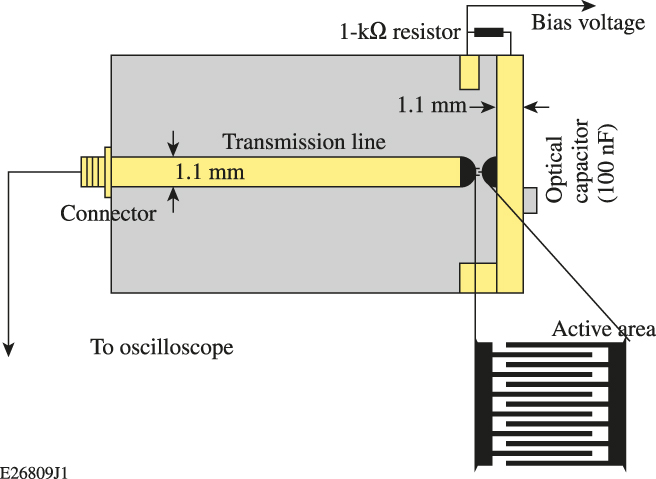
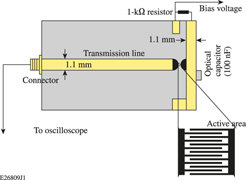
Commercially available sapphire wafers overcoated with 300 nm AlGaN thin films were purchased from PAM-XIAMEN (Xiamen, China). Finger-shaped, interdigitated structures of metal contacts were fabricated on these wafers at the Integrated Nanosystems Center at the University of Rochester (URnano) and Semiconductor & Microsystems Fabrication Laboratory (SMFL) at Rochester Institute of Technology with techniques including photolithography, physical-vapor deposition (PVD), and lift-off process. A Suss MA55 Contact Aligner (SÜSS MICROTEC SE, Garching, Germany) was used for the lithography, which used a 350 W mercury arc lamp with 365 nm wavelength for the light source. LOR and HPR 504 were chosen for the photoresist. A PVD-75 Lesker hybrid sputter-evaporation tool (Kurt J. Lesker Company, Jeffson Hills, Pennsylvania) was used for the metal deposition (both e-beam evaporation and sputtering mode were used). Prior to the metallization, a thin layer of titanium (10 nm) was deposited by e-beam evaporation to enhance the adhesion of the metal contact to the thin film. The metal layer thickness was set to be 120 nm and was deposited by e-beam evaporation (aluminum) or sputtering (gold) feature of the tool. The finger width and spacing were set at 3 µm (referred to as 3 × 3) and 5 µm (5 × 5), respectively; another group with 2 μm finger width and 5 μm finger spacing (2 × 5) was fabricated for comparison. All these designs had an active area of 50 × 50 µm2. A compensation pad with a calculated curveReference Zhao and Donaldson10 tapered from the transmission line down to the active area was added to avoid the reflection noise introduced by the impedance mismatch, as shown in the inset of Fig. 1.
The circuit layout and the active area structure of the photodetector.

For the choice of metallization, the aim is to find good-quality, metal–semiconductor contacts with small numbers of interfacial defects and higher Schottky barrier height. The diode-like behavior of the Schottky barrier should reduce the dark current. The Schottky barrier height can be naively predicted by the metal work function; however, the fabrication of good-quality Schottky barriers with desirable height is more of an art. The actual barrier height usually depends strongly on the chemical bonding of the metal/semiconductor interface and the semiconductor–vacuum surface, which is related to the Fermi-level pinning effects.Reference Wohlmuth, Arafa, Mahajan, Fay and Adesida11 We chose gold as one of the metallizations since gold has one of the highest work functions and good chemical stability. Aluminum was chosen for comparison. Since Al is part of the AlGaN ternary system, there could be some complex chemical interactions that are worth investigating. Additionally, Al has a relatively high work function of ∼4.3 eV.
Figure 1 shows the top view of the photodetector fixture as well as the active area structure. The backside of the circuit board is grounded. The transmission linewidth was designed to be 1.1 mm to match the 50 Ω impedance of the 1.5 GHz oscilloscope input. A large bias resistor (1 kΩ) was used to isolate reflections from the charging circuit and prevent the circuit from recharging quickly. An ultra-broadband (12 kHz to 1 GHz) optical capacitor (100 nF) is soldered between the transmission line and the copper backboard to produce a high-speed electrical connection and prevent the bias portion of the line from discharging.
III. I–V PROPERTY INVESTIGATION
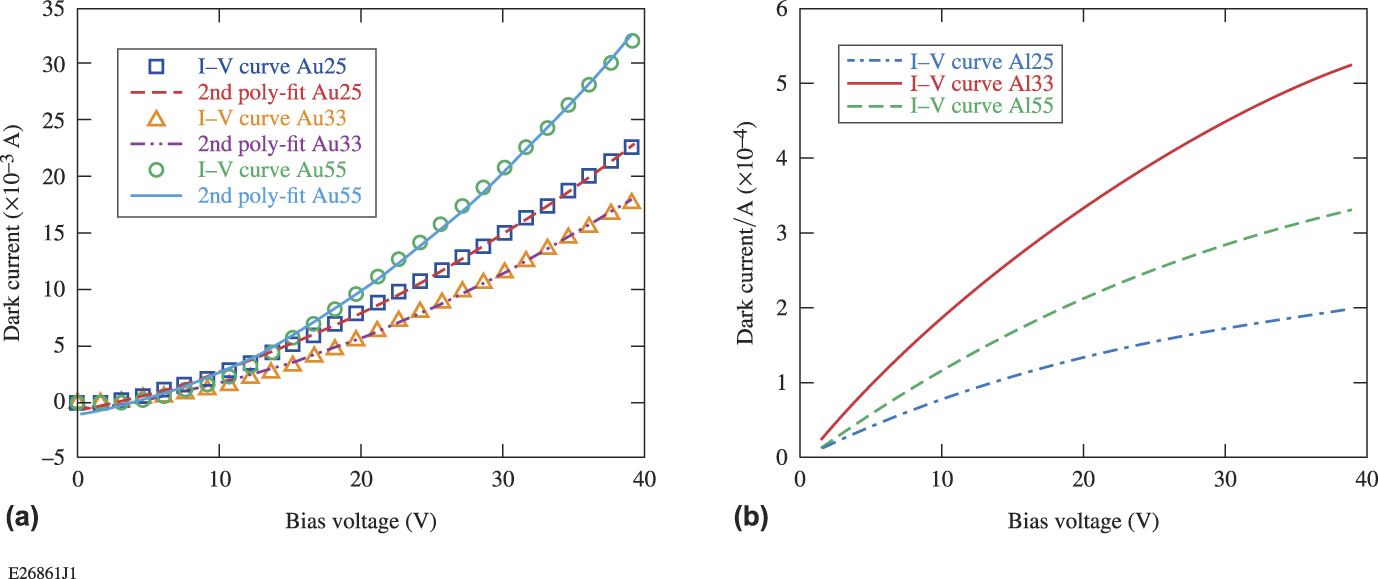
We first compared the current–voltage (I–V) curves and the temporal response of the devices fabricated with different structures and metallization. The I–V curves of devices with different finger sizes and metal contacts were measured with a Keithley 2450 Source Meter (Keithley Instruments, Solon, Ohio) by simply adding a step-voltage sweep on the device, with all measurements taken in the dark. The voltage was ramped from 0 to 40 V, with a 0.1 V step (only part of the data points are shown in the figures).
The I–V curves for devices of different metal contacts and structures are shown in Fig. 2. It was surprising to see that the gold contact showed a higher dark current than the aluminum contact although gold has a higher work function than the aluminum. This demonstrates that the Schottky barrier height is not decided solely by the metal’s work function. In our case, the aluminum contact shows a higher Schottky barrier height but a lower work function.
The I–V curves for devices with 3 μm finger width and 3 μm finger spacing, 5 μm finger width and 5 μm finger spacing, and 2 μm finger width and 5 μm finger spacing. The curves represent (a) a gold contact and (b) an aluminum contact.
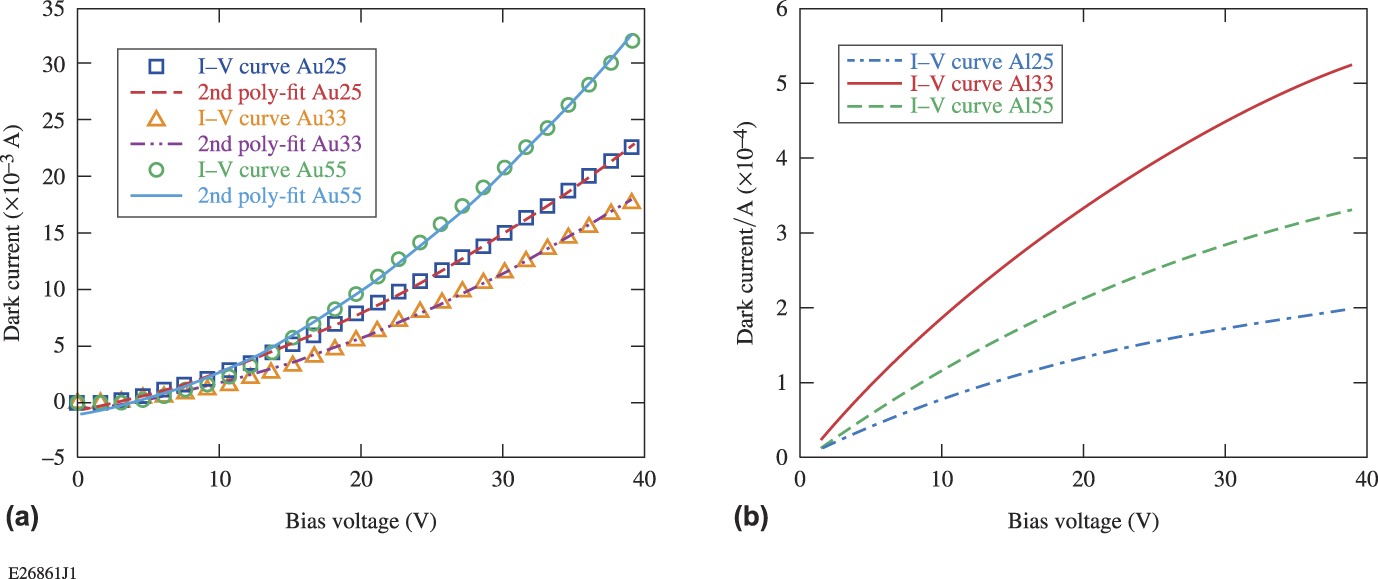
The I–V curves of the gold contact device could be fit with a second-order polynominal, which would indicate a Mott–Gurney Law type dependence. Shockley and Prim developed a modelReference Shockley and Prim12 to describe the space-charge-limited emission in semiconductors as an analog to Child’s Law, and they defined the relationship of the current and voltage as
 $$I = {{9k{\varepsilon _0}\mu A{V^2}} \over {8{w^3}}}\quad ,$$
where k is the dielectric constant, ε0 is the permittivity of the free space (8.85 × 10⁻¹² F/m), µ is the mobility (roughly 280 cm2/V s for GaN at room temperature), V is the applied voltage, w is the distance between two fingers, and A is the contact area. The I–V curve of the gold contact device can roughly fit Eq. (1). For example, we calculated the I–V relationship of Au 55 using Eq. (1). Since there are no data for the parameters of AlGaN but fairly a complete database for GaN, we use some parameters of GaN for the calculation of Al0.17GaN. When choosing the k value, we used the value of 5.35 for GaNReference Barker and Ilegems13 at high frequency and electric field vertical to the c axis of the lattice (different literature gives a value range of 5.3 to 10.4Reference Barker and Ilegems13,Reference Bogusławski, Briggs and Bernholc14 ). The distance between two fingers is 5 µm. Since our device has a coplanar structure rather than sandwich structures of slabs used in Mott–Gurney’s model, we calculated the equivalent contact area with the method developed by Donaldson.Reference Donaldson15 We simplified the device structure into two parallel transmission lines with 5 μm width and 5 μm separation. We then transformed and folded the electrode end face out into the coplanar geometry. Considering that the thickness of the thin film is only ∼0.3 µm, we deduced that the effective contact area is roughly 281 µm2. Therefore, our calculated I–V relationship is I = 3.4 × 10⁻⁶ V 2, which is fairly close to the fitted I–V relation for the Au55 device: I = 7.94 × 10⁻⁶ V 2. Given that there are some approximations for the calculation with Eq. (1), like the contact area, and the values of mobility and dielectric constant may not be the actual value for the materials we are using, our data showed a good fit to the Mott–Gurney Law.
The dark current for the aluminum contact devices, however, showed a more-complex relationship with the bias voltage. The I–V curve did not show a power-law dependence. The mechanism needs further investigation.
The dark currents of different device structures were compared for both gold- and aluminum-contact devices. The devices with 3 μm finger spacing showed a higher dark current than the 5 μm ones (as a result of the smaller finger spacing w, which decreased the resistance), and the 2 μm finger width devices showed a lower dark current than the 5 μm ones (as a result of the larger contact area A). For both contacts, the devices with 3 μm finger spacing showed ∼5/3× higher dark current than the 5 μm ones at a bias voltage over 15 V. These I–V behavior comparisons can be well explained with Pouillet’s Law:
 $$R\left( \Omega \right) = {{\rho \cdot d} \over A} = {{\rho \cdot d} \over {l \cdot w}}\quad ,$$
where ρ is the resistivity, d is the finger spacing, A is the contact area, w is the finger width, and l is the total finger length. We also found that, for both contact types, the I–V curve at voltage above 15 V is close to a linear relationship. Given that Pouillet’s Law normally calculates the resistivity of an ohmic contact, it is doubtful that the contacts were Schottky-like and were instead ohmic. This will be further discussed in the following section.
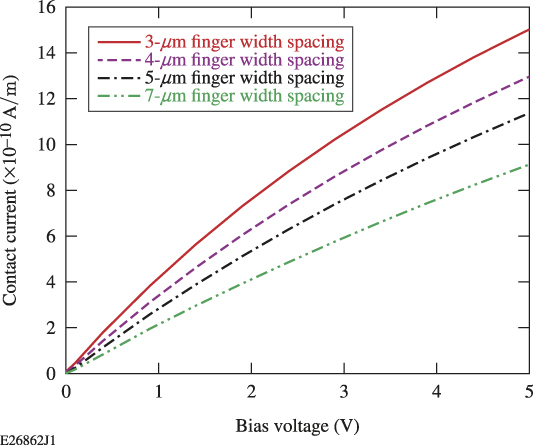
We also prepared a theoretical simulation on the device performance with regard to both the I–V behavior and temporal response. All the simulations were done by APSYS (Crosslight, Vancouver, Canada), which is based on finite element analysis. The simulated I–V curves for devices with different finger widths and spacing are shown in Fig. 3. Although the simulations utilized highly simplified 2-D models, the simulated dark current of different device structures showed a similar trend with the experimental results. Moreover, the simulation results showed a similar I–V curve shape to the Al contact devices. This indicated that the APSYS program uses a different injection mechanism than the Child’s Law, which is similar to the injection mechanism of Schottky contact devices. The Al contact devices are more likely establishing a Schottky barrier.
APSYS simulation results for I–V curves of different structured devices.
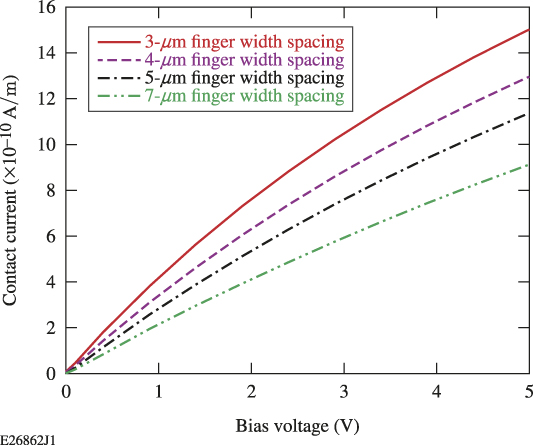
For both aluminum and gold contacts, the dark current was large compared to other reports,Reference Li, Xu, Hsiang and Donaldson16,Reference Li17 and also much larger than theoretical predication made by APSYS and Eq. (1). Several major reasons cause the high dark current. One of the major contributors to the dark current is the compensation pad designed to eliminate the impedance mismatch between the active area and the transmission line. We made an estimation by theoretical calculation on the resistance of the device both for the active area and the compensation pad area, and the results showed that the compensation pad can contribute 173.4× higher dark current than the interdigitated area. Insulation layers under the compensation pad will be added in our next-generation device design. Another reason for the high dark current is the poor material quality. Previous material characterization of the wafers used in this study indicated that the AlGaN thin films had a high dislocation density of ∼1.38 × 108 cm−2, an aluminum composition that varied (spatially) from 7 to 21% and widely distributed macroscopic defects like cracks, grain boundaries, and mosaic features.Reference Zhao and Donaldson10 The high density of different kinds of defects can cause a large dark current by providing intermediate (sub-band gap) states from which free carriers can be excited. The defective materials may also affect the metal–semiconductor interface, degrading the Schottky barrier quality.Reference Monroy, Calle, Pau, Muñoz, Omnès, Beaumont and Gibart18,Reference Carbone and Mazzetti19 Additionally, the silver paste used to couple the device into the measurement circuit elevated the dark current level. The silver paste covers a larger area than the metallization that is defined by lithography (roughly 1 mm2). The relatively low work function of silver (∼4.26 eV) might cause a high leakage current at the silver/semiconductor interface. Our experiment showed that devices employing silver paste had a larger dark current (26–31% higher) than the devices connected by wire bonding directly between the device metallization and the transmission line. Briefly, the large contact area of the compensation pad, the highly defective AlGaN thin film as well as the metal/semiconductor interface, and the application of the silver paste are the main reasons for the high dark current.Reference Carbone and Mazzetti19
IV. OPTICAL RESPONSE TESTING
A 266 nm CrystaLaser (CrystaLaser, Reno, Nevada) with 20 ns pulse duration was used extensively as the laser source. The laser source was a frequency-quadrupled, Q-switched Nd:YAG laser, the output power was ∼50 mW, and the repetition rate can be adjusted internally or triggered externally. The average power reaching the detector was measured to be 38 μW, and most of the measurements were done with a repetition rate of 150 Hz.
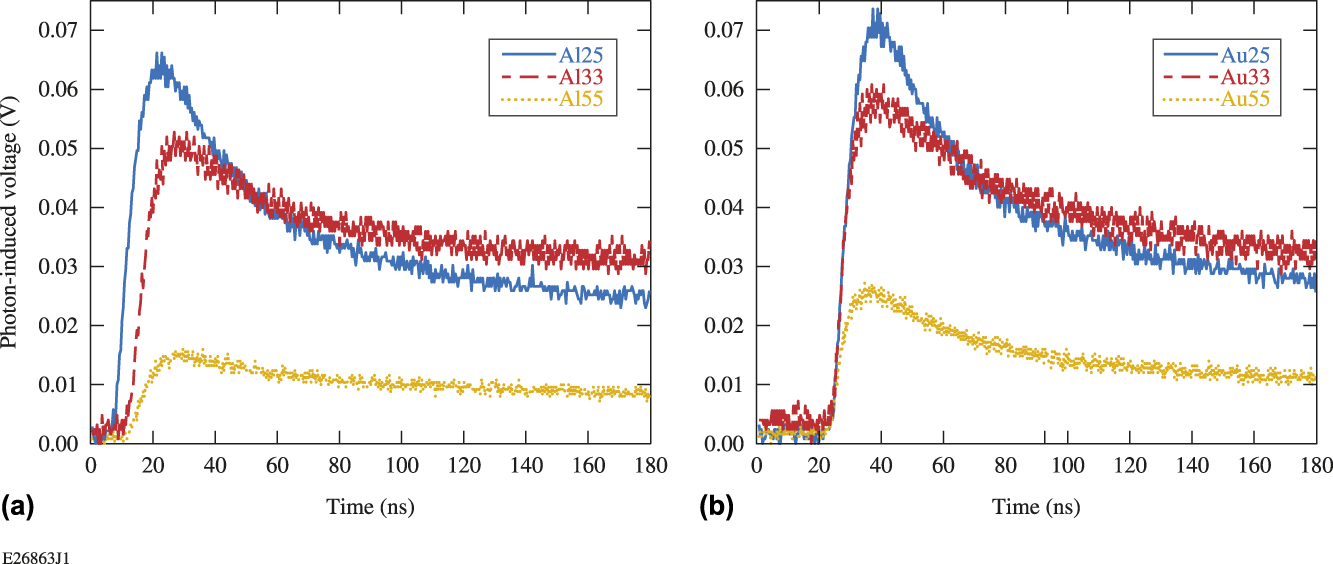
The circuit board with the photodetector, shown in Fig. 3, was mounted on a 3-D translation stage and then plugged into a 1.5 GHz oscilloscope. The bandwidth of the oscilloscope was sufficient to see the anticipated 17 MHz features induced by the optical pulse. The beam sizes were kept constant for each of the tests. Devices with different finger sizes and contact materials were tested for temporal response and the signals were maximized by adjusting the translation stage in both the transverse directions. The dark current was deduced from the baseline of the oscilloscope voltage. Any signal above that level is the photoinduced voltage, which is plotted in Fig. 4.
Response curves of devices with different structures and contact metals. The curves represent (a) a gold contact and (b) an aluminum contact.
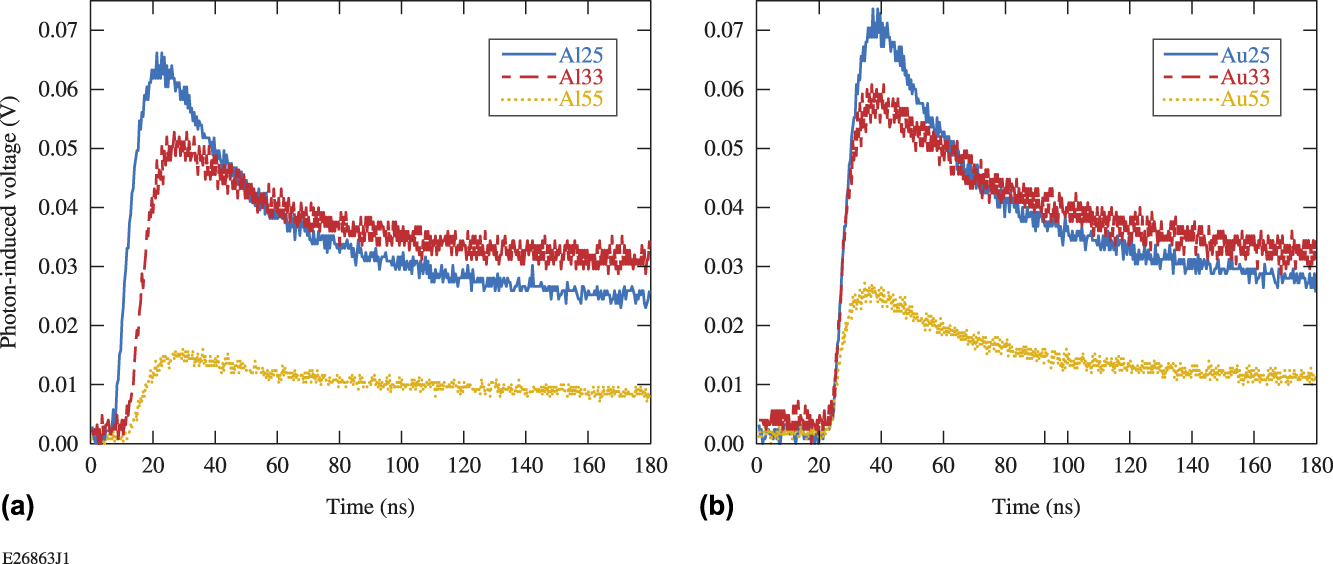
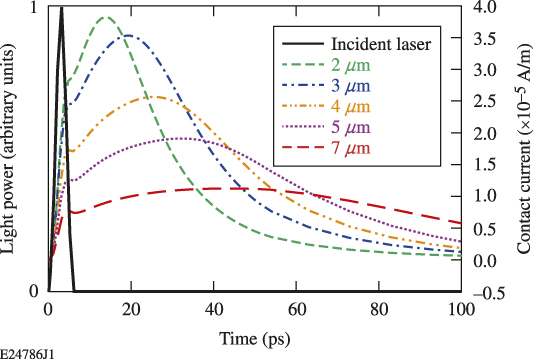
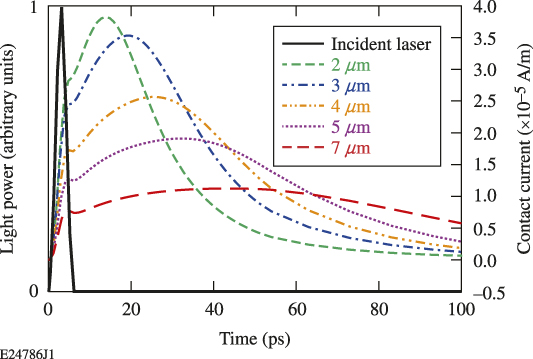
The Au contact devices have higher responsivity and higher dark current than Al contact devices. This is consistent with the previous dark current test. Considering different device geometries, the APSYS simulations predict that larger finger widths and spacings would result in longer response time but lower responsivity, as shown in Fig. 5. The experiments on our devices showed similar trends. Au25 and Al25 both showed the highest responsivity among the three different geometries. This is quite predictable because of the relatively high ratio of active area in these devices, which allows the highest carrier generation. The device with 3 μm finger width/spacing showed higher responsivity than those of 5 μm finger width/spacing, and slightly faster decay (7.58% for Au contact devices and 5.32% for Al contact devices) of the response signal. The simulation predicts that 3 μm device would show 1.74× higher response current than the 5 μm device, while in our experiments, this number is 2.33 and 3.25 for the Au contact and Al contact devices, respectively. Also, the response time difference is not significant compared to the simulation results. This is partly because that the incident laser and testing package is not fast enough to resolve the actual response time; also, the decay time is mainly determined by the PPC effects, not the device geometry.
APSYS simulation for response curves of devices with different finger sizes.
As noted earlier, the AlGaN wafers used for fabrication had a large variability in Al composition fluctuation (7–21%). Three devices with the same finger structure but taken from different parts of a same wafer showed a fluctuation of responsivity (8%) and decay time. These variations are comparable with the device performance difference we measured.Reference Zhao and Donaldson10 The device performance difference caused by the Al% inhomogeneity can obscure the relationship between device structure and device performance.
An obvious problem we found for our devices was that all the devices showed extremely long decay times compared with the theoretical simulation. The response curve would not decay to ground level even when the repetition rate of the incident laser was set to be ∼0.1 kHz (or 10 ms between pulses) indicating a decay time longer than 10 ms. This is often referred to in other research as PPC effects. The main reason was the existence of the deep level traps and DX centers (substitutional donors) in the AlGaN thin film.Reference Ursaki, Tiginyanu, Ricci, Anedda, Hubbard and Pavlidis20,Reference Li, Zhao and Wang21 The mechanism of the decay process and potential factors that may reduce the decay time are discussed in Sec. V.
V. FACTORS THAT CAN INFLUENCE THE PPC PHENOMENON
It has been reported that the PPC effect can be reduced by elevated temperatures that accelerate the carrier liberation rate from deep level traps.Reference Sze22,Reference Espevik, Wu and Bube23 In M. Hou’s work,Reference Park and Chadi24 the temperature of the device was increased from room temperature to about 300 °C by a specially designed in situ heating system. This temperature increase reduced the decay time from 39 h to 24 s. Their research was done with a cw laser and the decay process was initiated by turning the cw laser on or off. Similar findings were not reported, however, in AlGaN photodetectors with pulsed laser incidence, for which the illumination time was much shorter.
Therefore, it is worthwhile that we further investigate the influence of temperature on our device response with an ultrashort pulsed laser. We heat the photodetector by fixing a 10 W, 150 Ω electrical resistor on the back of the circuit board and control the heating process by using an YSI proportional temperature controller. The resistor was put into a 110 V ac circuit in series with a 25 W, 500 Ω resistor and the temperature controller. The sensor of the temperature controller was attached next to the device active area with a copper clip and thermal paste. The temperature tolerance is set to be 0.2 °C.
Considering the poor thermal conductivity of the printed circuit and the epoxy under the device, we fixed the temperature for 30 min for each of the measurements, trying to obtain a homogenous temperature between the temperature sensor and the device, and thermal tape was used to reduce the thermal dissipation into the air. The maximum temperature that could be achieved in this setup was about 70 °C, limited by thermal dissipation to the ambient air and the output power of our temperature controller. The need to maintain optical access and laboratory safety regulations precluded a higher level of thermal isolation.
Response curves under different temperatures (from room temperature to 70 °C) were recorded for analysis. To compare these curves, we defined the average voltage level within 20 ns before the pulse rise as the dark voltage, and the photoinduced voltage as the difference between peak voltage and the dark voltage. The characterization of the decay time is more complex. The millisecond-long decay curves cannot be fit with a simple exponential relationship. However, the early part of the decay curves (∼5 μs) can be fitted with a biexponential relationship:
 $${V \over {V{}_0}} = a \cdot {{\rm{e}}^{ - {t \over {{\tau _{{\rm{fast}}}}}}}} + b \cdot {{\rm{e}}^{ - {t \over {{\tau _{{\rm{slow}}}} + c}}}}\quad .$$
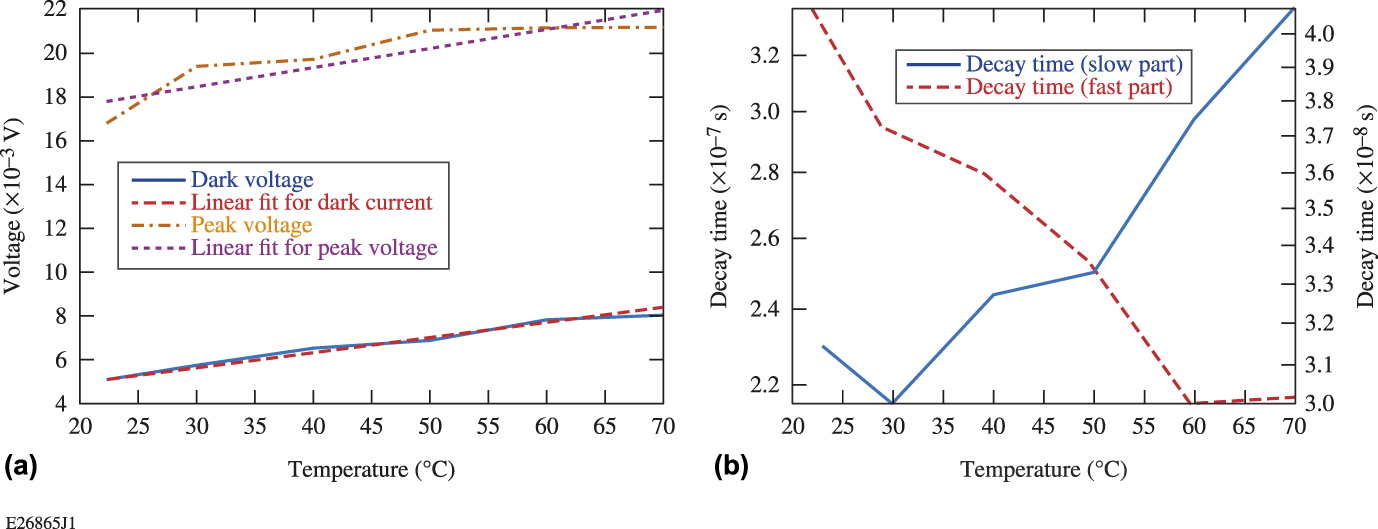
Although τfast and τslow are much shorter than the total decay time, they provide a relative comparison to show how different parameters influence the decay time. Biexponential fittings for the early part of all the measured decay curves were completed, and the fast and slow part of the decay times were compared. The fast part (τfast) is related to the carriers drifting to the electrodes by the bias voltage, and the slow part (τslow) is related to the very slow releasing of the trapped carriers in the deep level trap centers. The photoinduced voltage (peak voltage reduced by background leakage) and the dark voltage versus the temperature are plotted in Fig. 6(a). The response time versus the temperature is shown in Fig. 6(b).
(a) The photoinduced peak voltage and the ground-state voltage versus the temperature with a linear fit. (b) The fast and the slow parts of the decay time by bi-exponential fitting versus the temperature.
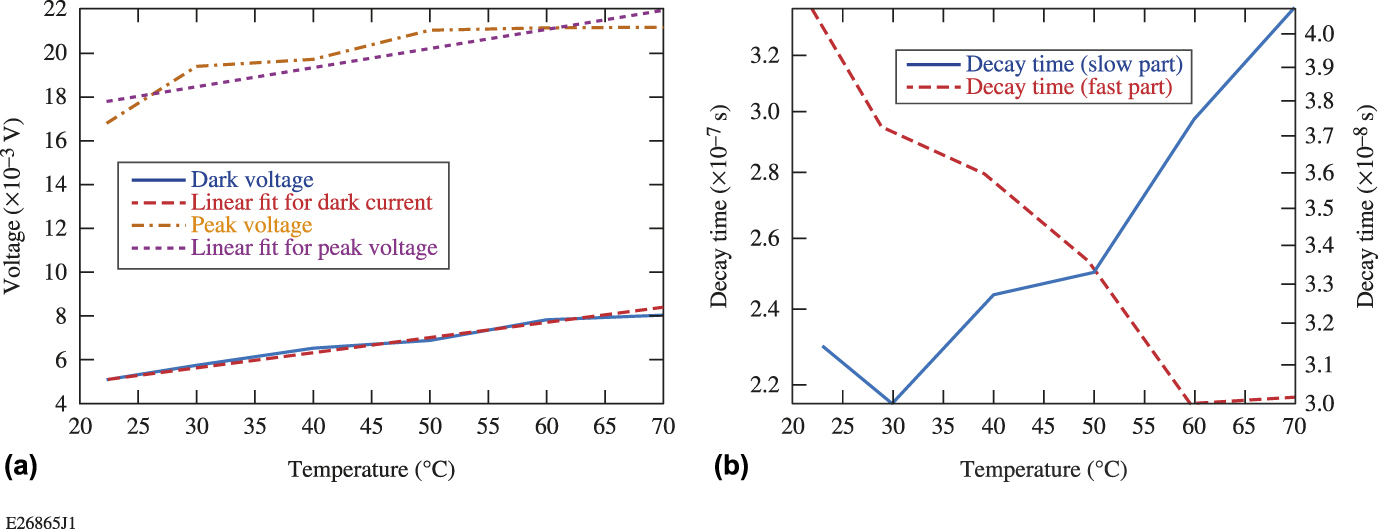
The photoinduced current and the ground-state voltage both increased with the temperature in a near-linear relationship. This is simply because increasing the temperature can increase the intrinsic carrier density, adding more thermally excited electrons into the conduction band. The carrier mobility can also be elevated by increasing the temperature, thereby lowering the resistivity of the materials and increasing the dark current. The increase in the photoinduced current is also because of the higher mobility. Moreover, more trapped carriers were released in the higher temperature.
The response time, contrary to the reference studies,Reference Sze22–Reference Park and Chadi24 showed a more-complex trend. The fast part of the decay time decreased with the increasing temperature (from 42 to 30.1 ns), while the slow part increased (2.2–3.4 μs), as shown in Fig. 6(b). To explain this phenomenon, the increased temperature increases the mobility of the carriers.
The response time has a quadrature relationship with the actual device response time as
 $${\tau _{{\rm{meas}}}} = \sqrt {\tau _{{\rm{pulse}}}^2 + \tau _{{\rm{osc}}}^2 + \tau _{\det }^2} \quad ,$$
where τpulse and τosc are the fall time of the incident laser pulse and the oscilloscope resolution, respectively. The actual detector decay time (τdet) is calculated to be 40.8–28.4 ns with the temperature change. We can obtain an approximation of the actual mobility of the materials we are using by
 $${\tau _{\det }} = {\tau _{{\rm{sweep}}\;{\rm{out}}}} = {d \over {\mu E}} = {d \over {\mu {{{V_{{\rm{bias}}}}} \over d}}}\quad ,$$
where µ is the mobility, E is the electric field, d is the finger spacing between electrodes, and V is the bias voltage. The calculated mobility is ∼0.28–0.38 cm2/(V s) with the temperature changing from room temperature to 350 K. Since other reports claimed that the mobility of electrons in GaN can change roughly from 280 to 340 cm2/(V s) when the temperature rises from 300 to 350 K,Reference Barker and Ilegems13 we could surmise that the AlGaN material we use is of poor quality with high defect concentrations causing bad scattering and blocking problems during the sweep out process of the carriers. Increasing the temperature has proven to elevate the carrier mobility, making the sweep-out process faster. On the other hand, with the increase of the temperature, the number of collisions between the free carriers and the traps also increase, thereby increasing the capture rate of the free carriers. This would result in a longer release process of the trapped carriers, which reflects the increase of the slow part of the decay time.
Increasing the temperature from the room temperature to 70 °C, the decay time remained the same magnitude, and the changes were within 35%. Compared to Ref. Reference Park and Chadi24, they reduced the decay time from 39 h to 24 s by increasing the temperature to ∼270 °C. The change of decay time we saw in our research is much less. A larger decay time change might be found if our device is heated to a much higher temperature, using techniques like in situ heating on the device chip similar to what was described in Ref. Reference Park and Chadi24.
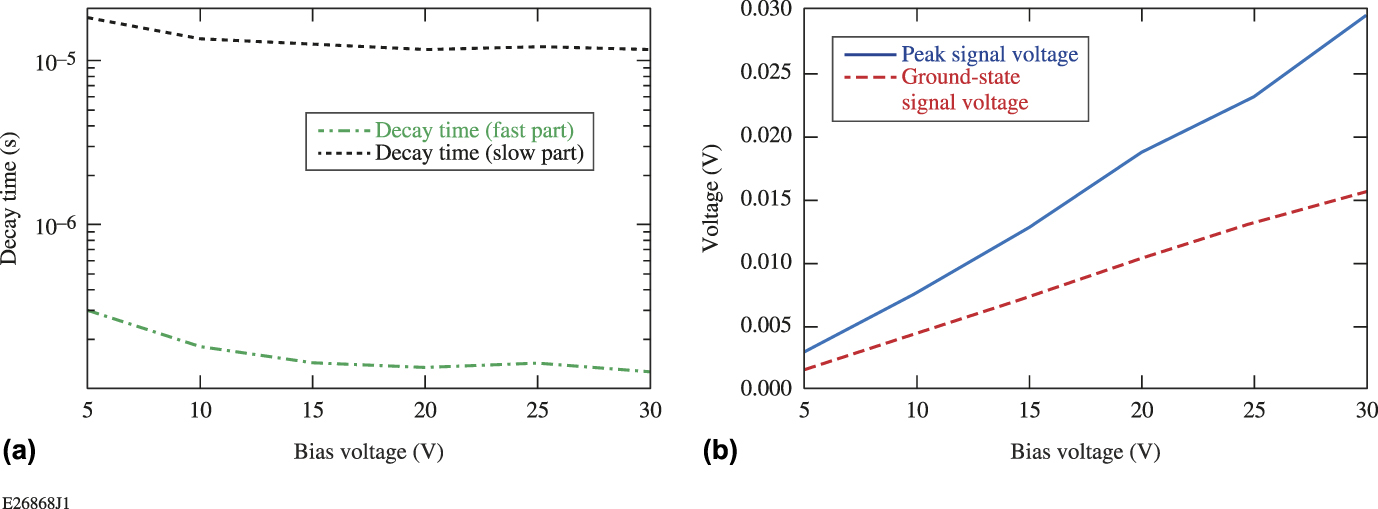
We further investigated the bias voltage’s influence on the decay time. We changed the voltage on the device from 5 to 30 V under room temperature and recorded the response curve under different bias voltages. The response curves under different bias voltages were recorded and analyzed with similar methods. The photoinduced voltage and ground-level voltage of each curve versus the bias voltage are plotted in Fig. 7(a), and both increase with the increasing bias voltage with a near-linear relationship. This could lead to an interesting comparison to the I–V curve of the devices, which showed a parabolic relationship. One reason for this difference is that the dark current measured here was readout in a high-frequency circuit instead of dc circuit with two simple probes. Also, the ground-state voltage did not decayed back to dark current level. Because the decay time is extremely long, the next pulse hit the detector even before the voltage decay back to ground level.
(a) The fast and slow parts of the decay time versus the bias voltage. (b) The peak response, the ground-level voltage, and their relationship with the bias voltage with liner fits included.
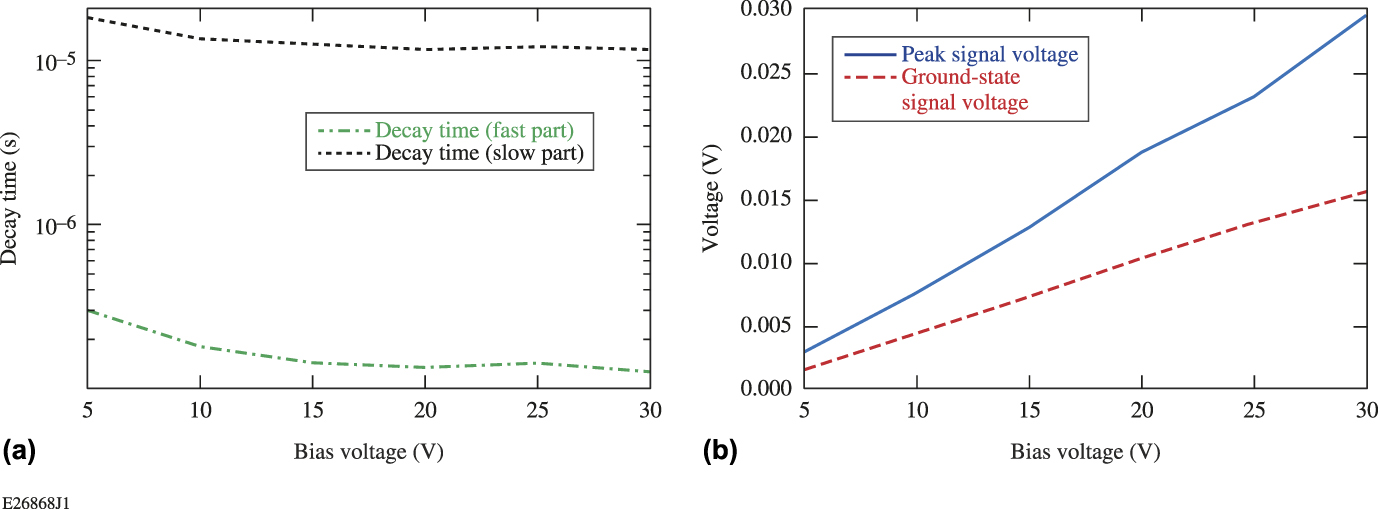
We can easily infer from the normalized curves that the decay time decreases with the increasing bias voltage. By fitting the curves with the Eq. (3), we can obtain the fast and slow part of the decay time, which are shown in Fig. 7(b), with the right axis showing the time scale. The fast part of the decay time decreased from 304.6 to 128.9 ns with the bias voltage from 5 to 30 V, while the slow part of the decay time decreased from 18.15 to 11.63 μs. The reduction in decay time is significant, especially for the fast part. This is quite reasonable since the increasing bias voltage will increase the drifting velocity of the carriers, resulting in a faster sweep out of the carriers to the contacts. (The velocity of the carriers can change roughly from 5.6 to 35 × 106 cm/s with a voltage increase from 5 to 30 V.) It can also accelerate the releasing of the trapped carriers, decreasing the slow part of the decay time.
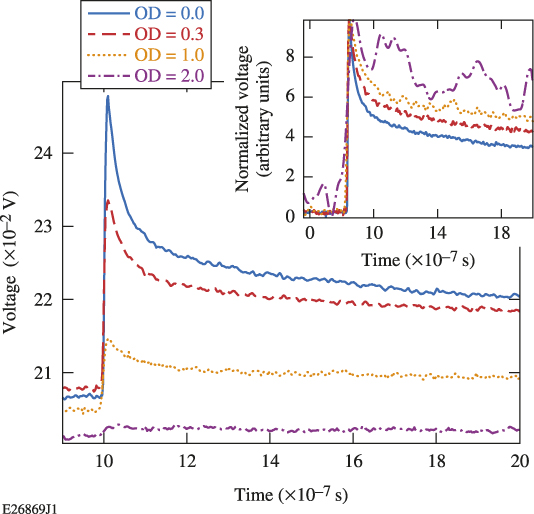
Another influencing factor we examined is the incident power on the device response. The incident power of the laser was adjusted by putting a UV neutral density (ND) filter in the beam path; filters of optical density (OD) = 0.3 and OD = 1 were used. The response curves are shown in Fig. 8; the inset shows the normalized curves.
Response curves with different incident laser intensities. The inset shows the normalized curves.
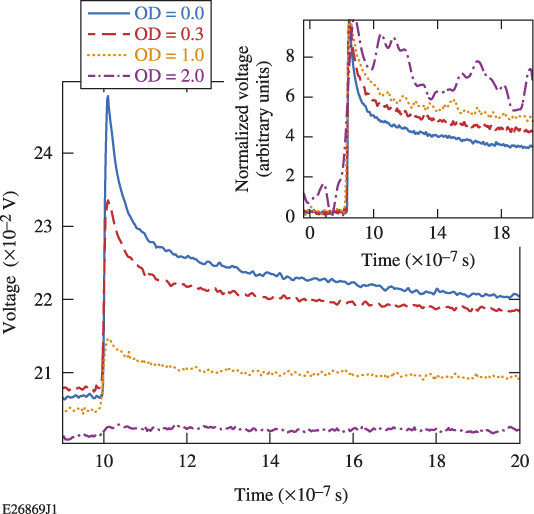
The time it took for the signal to decay to half the peak voltage decreases significantly with higher incident power (from 6.45 to 2.05 ns). This might be explained by the saturation of the deep-level traps. At lower illumination levels, the majority of the traps were occupied. With the increase of the injected carrier density, more carriers that are free from being trapped drift to the electrodes, which are reflected as showing a faster decay time. Another explanation might be the screening effect of the space-charge region with a high level of carrier injection. With high density of carriers screening the field, parts of the carriers recombine by the mutual attraction of the holes and electrons instead of drifting to the electrodes. These processes would also reflect a faster decay in the response curve. The following experiment on devices applied with the pulsed bias voltage can also be related to the space-charge screening effects.
VI. INVESTIGATION ON THE METAL–SEMICONDUCTOR NATURE
Both Au and Al contact devices showed much larger dark current and longer decay times than for normal for MSM photodetectors based on AlGaN.Reference Ferguson, Tran, Karlicek, Feng, Stall, Liang, Lu and Joseph3,Reference Li, Zhao and Wang21 Therefore, it is doubtful that the metal–semiconductor contact is actually a Schottky contact. It has been reported that both Al and Au on highly defected or compositional fluctuated AlGaN thin film may form ohmic contact based on the fabrication method.Reference Sze22
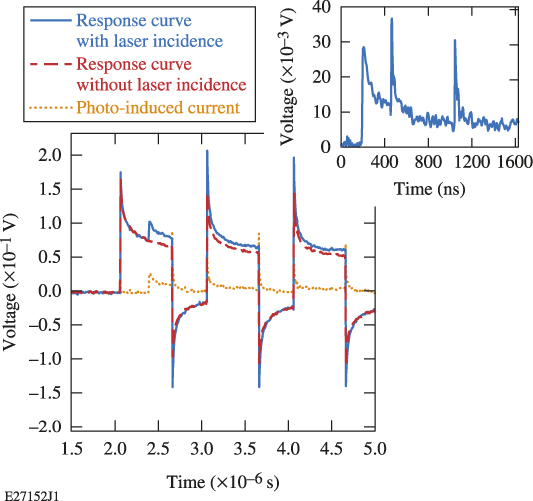
We therefore studied the nature of the contact by applying a square pulsed voltage on the device. A Stanford Research System Digital Delay Generator was used to produce a series of four, square voltage pulses (4 V) on the device. The pulse duration was 0.6 μs and the pulse separation was 1 μs. The CrystaLaser is triggered by the digital delay generator, and the laser pulse illuminated the photodetector 0.3 μs after the front edge of the first square pulse. Consequently, there was a bias voltage of 4 V generating an electric field of ∼8 kV/cm at the moment when light-induced carriers were generated. The optical-capacitor and the 1 kΩ bias resistor were removed to allow faster recharging of the capacitance to maintain a steady-state electric field. The response signals with and without the laser incidences were both recorded by using the oscilloscope and are shown in Fig. 9. The pure photoinduced current is subtracted by calculating the difference of the two curves. We eliminated the part when the bias voltage is on and temporally concatenated these parts, producing a “decay curve,” shown as the inset of Fig. 9.
Response curves with a square pulsed bias voltage applied on the photodetector and a laser pulse incident during the first square voltage. The curves with/without the laser incidence and the photoinduced current are shown. The inset shows the combination of the photoinduced current when the square voltage is on.
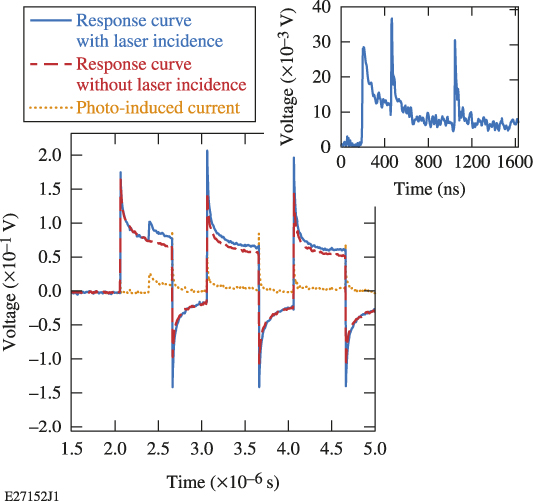
The subtracted pulse was continuous if the spikes caused by the charging/recharging of the circuit capacitance are ignored. There is no current when the bias voltage is off. The continuity showed that the carriers generated by the incident laser have almost no recombination or drift process when the bias voltage is turned off. This indicates that there is no built-in voltage or depletion region on the device; otherwise, the carriers would be partly depleted by the built-in voltage of the Schottky barrier. If the carriers were kept in the deep level traps when there is no bias voltage, they could not drift to the electrodes and would be too far from each other to recombine. The releasing process resumes when the bias voltage is back on. Therefore, the contacts are more likely an ohmic contact and have high dark current.
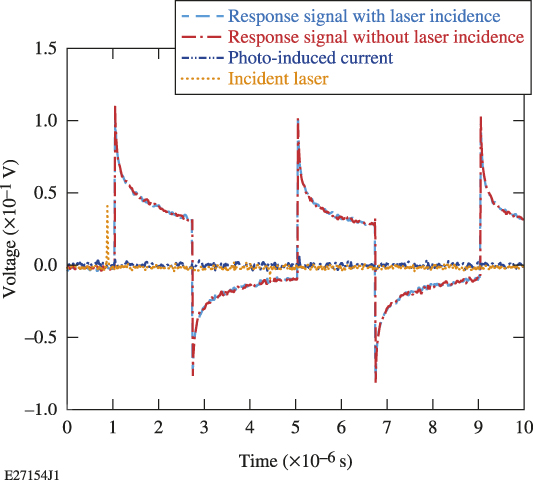
However, if there were Schottky contacts, the traps may also prevent the carriers from being swept out by the Schottky contact built-in voltage. To provide more evidence, another test is conducted by setting the incidence of the laser pulse slightly before (∼0.1 μs) the rising edge of the first square pulse. A similar test setup was used, and the response signals with/without the laser incidence are shown in Fig. 10. The photoinduced current is also subtracted from these two curves and we can find that there is nearly no current in the entire measurement period. The photogenerated carriers did not generate any current even when the bias voltage resumed. This is probably because all the photogenerated carriers recombined before the bias voltage was on. There was no bias voltage or electric field when the carriers were generated. The carriers recombined by the Coulomb force in a very short time (less than 0.1 μs). No carriers were swept to the electrodes by the built-in voltage after they are generated, further proving the ohmic behavior of the contact. The method described here provides insight into the carrier behavior immediately after the illumination by the laser. It provides a good demonstration for the ohmicity of the metal–semiconductor interface by observing whether or not the carriers move when the electric field is turned off.
Response curves with a square pulsed bias voltage applied on the photodetector and a laser pulse incident before the first square voltage. The curves with/without the laser incidence and the photoinduced current are shown.

VII. DISCUSSION AND CONCLUSIONS
The biggest problem for all the devices tested is that they suffer from PPC effects. To explain the mechanism of the PPC effect, different theories have been put forward. Carbone’s workReference Ursaki, Tiginyanu, Ricci, Anedda, Hubbard and Pavlidis20 believed that the long decay time is caused by the high density of macroscopic defects like grain boundaries and cracks in the thin-film materials, which act as massive traps that captured the free carriers. The positive charged traps caused by the captured holes act as a barrier for the photoexcited holes, thereby significantly slowing down the recombination process and elongating the decay time of the device.Reference Ursaki, Tiginyanu, Ricci, Anedda, Hubbard and Pavlidis20,Reference Espevik, Wu and Bube23 Some other researchers tried to explain this in microscopic way like trapping of free carriers at localized deep level defects.Reference Li, Zhao and Wang21,Reference Park and Chadi24,Reference Katz, Garber, Meyler, Bahir and Salzman25 The very slow releasing process of the trapped carriers cause the extremely long decay time. In our situation, we have high density of microscopic defects like dislocations and vacancies based on our investigation of the material properties.Reference Zhao and Donaldson10 The defects can trap and slowly release the carriers. Also, the change in fast and slow part of the decay time, as well as the responsivity, can well explain the influence of bias voltage, temperature, and incident intensity based on this theory. However, given the fact that there are mosaic features on the thin-film surface, there might also exist macroscopic defects that can form potential barriers, which will further slowdown the decay process. It is therefore necessary to say that the two mechanisms are not mutually exclusive and can happen at the same time.
There are different factors that can influence the decay time. From the previous experiments with different bias voltages, laser intensities, and temperatures, we learned a lot on the influencing factor of the decay time. By increasing the bias voltage from 5 V to 30 V, both the fast and slow part of the decay time are reduced by 57.6% and 35.9%, respectively. By reducing the intensity of the incident laser using different filters from OD 0.3 to OD 2, the fast and slow part of the decay time are increased by 41.8% and 37.3%, respectively. By increasing the temperature from room temperature to 70 °C, the fast part of the decay time reduced 28.3%, while the slow part increased 35.3%. All the above factors can affect the decay time effectively, but in different mechanisms.
Given the poor performance of the photodetector (high dark current and PPC effects), several improvements can be tried. To reduce the high dark current, better-quality wafers with less defects and better chemical uniformity could be used. For example, a buffer layer could be used to reduce strain in the AlGaN. Also, an insulating layer of SiO2 can be inserted under the compensation pad of the detectors (not the finger area).
In conclusion, AlGaN MSM photodetectors with different structures and contact materials were fabricated, packaged into fast circuits, and tested for their I–V behavior and temporal response. I–V curves and the temporal response for devices with different structures showed a similar trend as predicted results of APSYS simulations. The devices with gold contacts showed higher responsivity, dark current, and faster response time than devices with aluminum contact. All the devices showed nonideal behavior, including high dark current and long decay time, which is found to be related to the fact that the metal–semiconductor contact shows ohmic behavior. The decay time was found to be influenced by the bias voltage, the incident laser power, as well as the temperature. This research should be of great value for future research on PPC effects on ultrafast devices and ohmic contact fabrication.
ACKNOWLEDGMENTS
This material is based upon work supported by the Department of Energy National Nuclear Security Administration under Award Number DE-NA0001944, the University of Rochester, and the New York State Energy Research and Development Authority. The support of DOE does not constitute an endorsement by DOE of the views expressed in this article.
This report was prepared as an account of work sponsored by an agency of the U.S. Government. Neither the U.S. Government nor any agency thereof, nor any of their employees, makes any warranty, express or implied, or assumes any legal liability or responsibility for the accuracy, completeness, or usefulness of any information, apparatus, product, or process disclosed, or represents that its use would not infringe privately owned rights. Reference herein to any specific commercial product, process, or service by trade name, trademark, manufacturer, or otherwise does not necessarily constitute or imply its endorsement, recommendation, or favoring by the U.S. Government or any agency thereof. The views and opinions of authors expressed herein do not necessarily state or reflect those of the U.S. Government or any agency thereof.