1 Introduction
In Australia, the superannuation system has achieved retirement savings of around
 $\$2.8$
trillion (AUD) in assets (The Association of Superannuation Funds of Australia ASFA 2018b), which is one of the largest systems in the world and primarily consists of defined contribution (DC)-type funds. The current system, established in 1992, made it compulsory for employers to contribute a minimum percentage of wages, called Superannuation Guarantee (SG), to their employees’ chosen superannuation funds. As the Australian superannuation system has been in operation for over 26 years and the DC system has reached a mature stage, more retirees from the baby boomer generation are now reaching retirement with significant superannuation savings. For many countries, the growing cost of public pensions as a result of increasing longevity and deterioration dependency ratios (Harmer Reference Harmer2008) has created a need to substantially reform their retirement systems. Many countries follow a three-pillar retirement income structure similar to the Australian system which has a public pension or social security framework providing basic retirement income, a public or privately funded defined benefit (DB) or DC retirement fund, and other forms of personal retirement savings which are often incentivised by tax benefits and subsidies (Ken Reference Ken2009). The accumulation of personal retirement savings through DC-type funds is a popular choice. However, the transition from DB to DC shifts the financial and longevity risks from employers to individuals, and important decisions on retirement life cycle management are now made by individuals. Given the long-term time frame for retirement planning, individuals face significant uncertainties when trying to make decisions of which the consequences or outcomes will become apparent 30 or 40 years down the track.
To forecast economic outcomes in the future using simplistic assumptions with constant or fixed investment returns, income and expenditures do not capture the uncertainty inherent in retirement cycle management. Variability in future retirement income is obviously very important for a retiree to know and face. For this reason alone, a forecasting model in retirement life cycle management should be able to provide a measure of uncertainty in predicted retirement outcomes. Stochastic ESGs are examples such a forecasting model. A well-known stochastic ESG model is the four-factor Wilkie investment model proposed by Wilkie (Reference Wilkie1984). Based on the 1984 Wilkie’s model, a series of model updates in both practical and theoretical aspects have been proposed, such as those by Wilkie (Reference Wilkie1995), Şahin et al. (Reference Şahin, Cairns and Kleinow2008), Wilkie et al. (Reference Wilkie, Şahin, Cairns and Kleinow2011), Wilkie & Şahin (Reference Wilkie and Şahin2016 Reference Wilkie and Şahin2017a,b,c Reference Wilkie and Şahin2018 Reference Wilkie and Şahin2019). Several other models, such as the Ahlgrim model, were subsequently developed by Ahlgrim et al. (Reference Ahlgrim, D’Arcy and Gorvett2005) within the Casualty Actuarial Society. Zhang et al. (Reference Zhang2018) revisit the Wilkie’s model and apply their updated model for the US. For the Australian system, Carter (Reference Carter1991) adjusts Wilkie’s cascade model to fit Australian data. Butt (Reference Butt2009) and Butt & Deng (Reference Butt and Deng2012) investigate stochastic models for retirement, focusing on post-retirement investment strategies and shortfall probability. To model the superannuation and retirement outcome distribution, Price & Suryadi (Reference Price and Suryadi2011) propose a Wilkie-type stochastic Retirement Income Model-Hypothetical model for the Australian Treasury. De Ravin (Reference De Ravin2015) applies a stochastic asset model to provide optimal asset allocation decisions for retirement income planning.
The general life cycle management issue is complicated. Before retirement, individuals have to make a series of financial decisions including asset allocation and when to retire, and as a result, how much to spend in retirement. At retirement, retirees have to decide whether they purchase an income stream product, such as an annuity (Andreasson & Shevchenko Reference Andreasson and Shevchenko2019; Alonso-García & Sherris Reference Alonso-García and Sherris2019), to mitigate the longevity risk. After retirement, retirees have to choose the optimal consumption or drawdown strategies (Butt & Deng Reference Butt and Deng2012; Callil et al. Reference Callil, Danzinger and Sneddon2018; Zhang Reference Zhang2018; Forsyth et al. Reference Forsyth, Vetzal and Westmacott2019) and annuitisation strategies for the retirement stage in the DC system with personal bequest objectives (Chen et al. in press). This problem becomes more complicated at the household level.
In this paper, we do not claim or attempt to tackle the aforementioned life cycle management problem as a whole. Rather, we examine the possible future outcomes of superannuation contributions before retirement and the total income, including the withdrawal and Age Pension after retirement in the Australian system for an individual, so that we can shed light on retirement income questions in countries moving towards the DC system.
We extend our Wilkie-type SUPA model (Sneddon et al. Reference Sneddon, Zhu and O’Hare2016) and improve it for the Australian system by including the house price and recalibrating the model using historical data from 1992 to 2018. Then, we show how to use this probabilistic approach to model both the accumulation and decumulation phases at the individual level in an integrated way. We also show how to use the SUPA model to quantify uncertainty and model the downside risks associated with retirement savings. With an example, we demonstrate how to address important policy questions regarding retirement savings and the retirement system more generally with the SUPA model. Finally, we made our model available onlineFootnote 1 and updated regularly so that people can benchmark other models for their own retirement planning purposes.
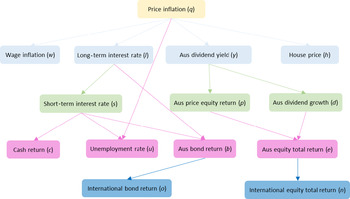
The SUPA model can naturally model the interdependency between economic and financial variables; and therefore, it consistently represents the economic environment in which pension funds operate. Once the model is calibrated, all SUPA variables can be simulated via their interconnected cascade structure, as presented in Figure 1, and subsequently used to project future possible superannuation balances and their distributions. The full spectrum of possible outcomes during the accumulation phase can help individuals understand the adequacy of their superannuation savings and the uncertainties involved. During the decumulation phase, the simulated outcomes can be used to guide investment and consumption decision-making processes. For example, the SUPA model can estimate the expected duration that the current superannuation balance can last under different drawdown strategies, so the model can be relied upon to find an optimal consumption strategy which will meet the objectives of retirees. Importantly, such a model can also be used to analyse the impact of policy changes, such as the policy issues highlighted in the recent report (Daley & Coates Reference Daley and Coates2018) of the Grattan Institute. Currently in Australia, for both the government and superannuation industry, the right level of SG rate (Rice & Bonarius Reference Rice and Bonarius2019; Taylor Reference Taylor2019; Coates et al. Reference Coates, Mackey and Cowgill2020) and retirement ageFootnote 2 are two heated debates. Increasing superannuation contribution rates may retard current economic activities and lower home-take incomes, and it does not translate into a correspondingly higher retirement income, while their current economic well-being is disproportionately impacted (Daley & Coates Reference Daley and Coates2018). It is likely that other countries will face similar issues in the future. The analysis presented here can serve as a case study when benchmarking similar pension systems of other countries (e.g. UK DC system, USA 401(k)).
Cascade structure of the SUPA model with 14 variables.

This paper is structured as follows. In section 2, we describe the SUPA model and how to use it for superannuation accumulation and decumulation simulations. In section 3, we introduce the Australian superannuation system. We report on the implementation of SUPA to the superannuation accumulation and decumulation phases and on addressing two of the eight recommendations in the Grattan Institute report (Daley & Coates Reference Daley and Coates2018). Section 5 concludes and discusses ongoing and future research.
2 Stochastic Economic Scenario Generator
The stochastic economic scenario generator (ESG) used in this paper is the SUPA model, developed at CSIROFootnote 3 , as a multi-factor cascading model aims at projecting retirement income by simulation (Sneddon et al. Reference Sneddon, Zhu and O’Hare2016). We further generalise and improve the model by adjusting several dynamics and incorporating two additional economic variables: unemployment rates u(t) and real estate price returns h(t). Examining all possible future outcomes requires the simulation of a large number of scenarios of each economic variable through both the accumulation and decumulation phases. The validity of these simulated future scenarios requires the model parameters to be calibrated to historical data and reproduce historical economic scenarios statistically.
2.1 Cascading structure of the SUPA model
The SUPA model is a stochastic model that describes the individual behaviour of economic factors, such as price inflation, wage growth, interest rates and asset returns by stochastic time series, as well as examines their interdependent relationships via a cascade structure described in Figure 1. Similar to Wilkie model, the price inflation q(t) is simulated individually and its performance cascades through the other economic variables, such as wage growth w(t); long-term interest rates l(t), short-term interest rates s(t), cash returns c(t), domestic (Australia) equity returns p(t), domestic total returns e(t), international equity total returns n(t), domestic bond returns b(t) and international bond returns o(t). All the residuals are assumed to be normally distributed (Wilkie Reference Wilkie1984 Reference Wilkie1995; Ahlgrim et al. Reference Ahlgrim, D’Arcy and Gorvett2005). More specifically, the dynamic process of each economic factor in this model is influenced to some degree by other variables in the model following inherent relationships within the economy based on established economic theory. In Figure 1, the arrows describe the flow of the influence of one variable on another within the structure. These relationships are incorporated in the specification of the dynamic process of each economic factor, as shown in Table A.2 in the Appendix. The full description of the calibration process for the SUPA model can be found in the Appendix.
Superannuation Guarantee
 $\mathrm{SG}_{t}$
(%) from 1992 to 2025.

3 The Australian Superannuation System
In this section, we provide some details about the Australian superannuation system regarding the Superannuation Guarantee, superannuation fund management fees, investment strategies and the Association of Superannuation Funds of Australia (ASFA) retirement standard benchmarks implemented in section 4.
3.1 Superannuation Guarantee
The Australian Superannuation Guarantee, introduced in 1992, mandates that employers make compulsory contributions to an employee’s DC superannuation fund. The SG rate started with a compulsory rate of 3% of wages in 1992, gradually grew to 9% in 2002 and remained so until 2013. The current SG rate is
 $9.5\%$
and is set to gradually increase to 12% of the salary by 2025. The contribution rate
 $\mathrm{SG}_{t}$
in each year can be set to the minimum mandatory contribution rate reported in Table 1
Footnote
4
.
Strategy and investment fee from ASIC’s MoneySmart calculator.

However, the system is still maturing, and many retirees may have insufficient superannuation savings to fully fund retirement from superannuation savings alone (Deloitte 2014). Thus, Australia’s government-funded means-testedFootnote
5
Age Pension remains a major source of income for many retirees. The primary objective of Australia’s superannuation system is not to fully support individuals in retirement, but “to provide income in retirement to substitute or supplement the Age Pension”
Footnote
6
. In the Grattan Institute report, Daley & Coates (Reference Daley and Coates2018) state that “The conventional wisdom that Australians don’ t save enough for retirement is wrong. The vast majority of retirees today and in the future are likely to be financially comfortable”. The ASFA Retirement Standard (ASFA 2018a) reports that the annual budget needed by Australian retirees to fund a modest or comfortable standard of living is
 $\$27,368$
or
 $\$42,754$
, respectively, for a single homeowner at retirement. In June 2018, a single household can receive up to
 $\$23,662$
in full Age Pension payments and, therefore, does not require substantial retirement savings to live a modest lifestyle. We will discuss the gender gap issue in the accumulation phase in section 4.1 and the retirement consumption in the decumulation phase in section 4.2.
3.2 Fund management fees
In order to set the superannuation fund fees and costs in our examples, we use the rates and prices provided by the MoneySmart superannuation calculator of the Australian Securities and Investments Commission (ASIC)Footnote
7
. The total annual superannuation fee usually consists of at least three components: (1) the annual administration fee, which is fixed at
 $\$50$
; (2) asset-based fees, which are a percentage of the total balance with an indirect cost ratio depending on the fund level and (3) investment option fees, which depend on the investment strategy in Table 2 and are also proportional to the superannuation balance. According to these rates, with
 $\$100,000$
invested in a Balanced strategy (
 $0.5\%$
) in a medium-level (
 $0.6\%$
) super fund, one has to pay
 $\$1,150$
(
 $\$50$
fixed admin fee,
 $\$600$
super fund fee and
 $\$500$
investment fee) per year. In some super funds, the investment fee is also associated with performance. Generally, the higher the expectation of return, the higher the investment fee. The total cost could include other fees, such as advice fees, exit fees and brokerage fees.
3.3 Investment strategies
The portfolio return of the superannuation balance is obtained as a weighted average of growth (risky) and defensive asset returns. Unlike the ASIC MoneySmart calculator which uses the expected returns for the superannuation balance, we use the Monte Carlo simulated returns generated from the SUPA model. The portfolio weight in growth assets, such as Australian equity, is denoted by
 $w_{1}$
, whereas the weight in defensive assets, such as domestic bond, is denoted by
 $w_{2}=1-w_{1}$
. The predetermined investment strategies are listed in Table 2. Other age- and performance-based strategies, such as a linear de-risking strategy and dynamic optimal strategy (Zhang et al. Reference Zhang, Langrené, Tian, Zhu, Klebaner and Hamza2019a,b; Forsyth et al. Reference Forsyth, Vetzal and Westmacott2019), can also be implemented in our model. One popular de-risking strategy is to linearly decrease the investment in growth assets with age as
 $w_{1}=\max[1-\{\text{age}\}\%,0]$
, which is a non-negative number. Should the retiree reach 100 years old, then
 $w_{1}=0$
, which is equivalent to the Cash strategy in Table 2.
4 Analysing Superannuation Outcomes
In this section, we first simulate all the variables in the SUPA model and then compute the superannuation balance of individuals at retirement for each scenario and provide the distribution of all these scenarios to analyse the saving power in the current superannuation system. We also investigate the gender gap to see the impact of differences in initial wages on the superannuation balance at retirement. For the decumulation phase, we discuss whether an individual can attain a more comfortable lifestyle in retirement and how long such a lifestyle can be sustained under the current Age Pension policy. In the end, we test two policy recommendations: retaining the SG rate at
 $9.5\%$
and delaying the retirement age to 70 on the basis of the Grattan Institute report (Daley & Coates Reference Daley and Coates2018). Our numerical results are based on 100,000 Monte Carlo paths, which are large enough for our test cases.
4.1 Accumulation phase
In this SUPA application of superannuation accumulation, we make a few important assumptions. First, as 1992 is the starting time when compulsory superannuation was introduced, requiring all employers to make mandatory contributions for their employees, we set the superannuation balance before 1992 to zero and started the accumulation in 1992. Second, the superannuation contribution rate is set to the year-based minimum rate listed in Table 1, and the contributions are added to the account at the end of each year. We ignore the salary-sacrificed superannuation contribution and the extra part higher than the SG rate paid by some employers. Third, future wages are indexed by wage growth
 $w_{t}$
, so there is no assumption about wage increase as a result of promotion or a change of job. Fourth, no other income stream contributes to an individual’s superannuation account. Fifth, economic variables, such as wage growth, equity returns and interest returns, are calculated on an annual basis, and the superannuation balance is adjusted by the portfolio return of the predefined Balanced investment portfolio, which is the default strategy that includes 30% of the growth assets and 70% of the defensive assets. Sixth, each individual is assumed to work full-time up until the exact age of 65 for existing retirees and 67 for future retirees, and exit the workforce at retirement. We assume no working gap during this accumulation period from 1992 to 2018.
Based on these assumptions and the current superannuation policy, we accumulate the superannuation balance using the following algorithm. Let
 $B_{0}$
be the initial superannuation balance at the starting age,
 $B_{t}$
be the accumulated superannuation balance after t years of the employee’s working life and
 $B_{T}$
be the final superannuation balance at retirement. The retirement time T varies between individuals. We also consider the tax rate
 $\mathrm{Tax}_{t}$
for compulsory contribution at year t, which is a constant 15%. The superannuation balance
 $B_{t+1}$
is accumulated from time t to
 $t+1$
after the minimum contribution as
 \[B_{t+1}=\left[B_{t}+\mathrm{SG}_{t}W_{t}(1-\mathrm{Tax}_{t})\right]e^{R_{t}},\]
where
 $\mathrm{SG}_{t}$
is the superannuation guarantee rate,
 $W_{t}$
is the wage at time t,
 $R_{t}$
is the portfolio return, and
 \[W_{t}=W_{t-1}\cdot e^{w_{t-1}},\]
where
 $w_{t}$
is the wage growth rate at time t simulated by the SUPA model.
For a 39-year-old full-time male with an average (age-based) weekly ordinary time earnings (AWOTE) of
 $\$623.2$
(AUD) in 1992 retiring at the age 65 in 2018, the projected superannuation balance is
 $\$188,570$
(standard deviation:
 $\$32,355$
) in 2018. This is based on 26 years of compulsory superannuation contributions since 1992. Likewise, the projected superannuation balance of a full-time single female with AWOTE of
 $\$518.7$
(AUD) in 1992 is
 $\$156,390$
(standard deviation:
 $\$26,823$
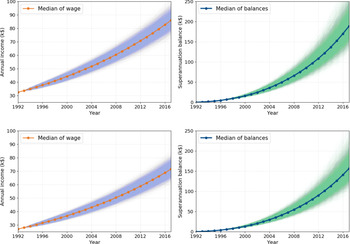
) in 2018, noting a lower value reflective of a gender wage gap affecting initial values in Figure 2. Thus, a coupled household consisting of a male and a female with average weekly earnings, who both work full-time, is estimated to have around
 $\$344,960$
in superannuation in 2018.
Monte Carlo simulations of the wage (left) and superannuation balance (right) simulated by the SUPA model for a single full-time male (above) and a female (below) with AWOTE. 10,000 simulated paths are shown.

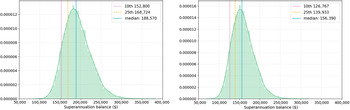
In the analysis of retirement income adequacy, the important issue is the potential downside risk to the future income, as the median and/or average amount does not account for the uncertainty in retirement income. To understand the downside risk, we need to rely on stochastic models in order to estimate the future retirement income. Figure 3 shows the possible future distributions of the superannuation balances for a male and a female, as simulated by the SUPA model. Additionally, illustrated in the figure is the
 $10\text{th}$
percentile super amount, defined here as the fund balance at which there is a 10% probability that the super fund balance will actually fall below this level. By using such a downside risk measure for future superannuation, we can assess if an investment strategy is appropriate for superannuation. Rather than using the averaged performance only, we also provide the
 $10\text{th}$
and
 $25\text{th}$
percentiles of the possible scenarios to measure the outcomes from the negative market environment. In this example, for a single full-time male or female with AWOTE, their superannuation balance can fall below
 $\$168,724$
(
 $\$139,933$
) or
 $\$152,800$
(
 $\$126,767$
), respectively, with 25% and 10% probability. In other words, there is a 25% chance that they will have around 89% or less of the expected superannuation amount when they reach retirement age, and a 10% chance that they will only have around 81% or less of it. Such a downside risk should be considered, and the simulated 10% and 25% percentiles are also used as inputs of the initial wealth in retirement planning.
Probability distribution of the simulated superannuation balances of a single full-time male (left) and a female (right) with average OTE and
 $10\text{th}$
(dotted),
 $25\text{th}$
(dashed) percentiles and the median (solid).

4.2 Decumulation phase
Retirement income is composed of the annual withdrawal from an account-based pension, which is a regular income stream purchased with accumulated superannuation savings, mean-tested Age Pension, private savings and other lifetime income streams, such as lifetime annuity if purchased any. We can investigate several aspects of the decumulation phase to show the projected future retirement income using the SUPA model. First, we can show how long the superannuation savings can last for in a given consumption level. The time at which the superannuation is completely depleted can be called the ruin time. Inversely, we can determine what the consumption should be if the intention is for the superannuation not to reach zero for a specific number of years. Second, we can estimate the total Age Pension someone can receive during retirement discounted by inflation rate to today’s value. This information can help policymakers estimate the impact of any policy change on the Age Pension budget.
We demonstrate the ruin time, and the total Age Pension someone can receive after being retired in this example. We make the following assumptions. First, after retirement, the individual makes no further contributions and commences withdrawals from the account-based pension until death or depletion of the balance. Second, the investment portfolio consists of Australian (domestic) equity and international equity as growth assets, as well as domestic and international bonds and short-term deposits as defensive assets. Third, the consumption level is fixed at the beginning of retirement and is adjusted by inflation. Retirees may need to withdraw more than the minimum rate for the additional expense that the Age Pension and other income cannot cover. The ruin time will depend on the initial targeted consumption. Fourth, retirees do not withdraw on their existing assets, such as private savings and investment property, nor use the Pension Loans Scheme. Fifth, the maximum Age Pension, as well as the means test thresholds, is indexed by the consumer price index (CPI), whereas the deeming rates are set to be constant, as defined by the Australian Department of Human ServicesFootnote 8 . Sixth, the targeted consumption level chosen by the retiree is indexed by the CPI.
The SUPA model can simulate all the necessary economic factors that we need to illustrate the future retirement income during the decumulation phase under these assumptions. The Age Pension, as a part of the retirement income, can be projected by the inflation rate and wage growth simulation, and the means test thresholds can also be projected as they are indexed by the CPI. In the asset test, the future value of various kinds of assets will change with the simulated returns. Thus, we can project the future means-tested Age Pension payment in the future for each retiree. In this example, we will demonstrate the simulated results of the account-based pension in the decumulation phase, how long the superannuation can last for a modest and comfortable life standard and the Age Pension payments.
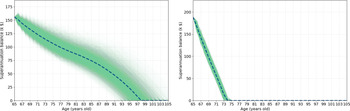
We illustrate in Figure 4 how the superannuation balance decreases over time for an individual retired in 2018 with a superannuation balance of
 $\$188,570$
. This person also owns a home, with
 $\$150,000$
testable assets and
 $\$50,000$
in financial assets. These user settings can be changed easily in the model. With a modest lifestyle, the superannuation balance is expected to reach zero when the retiree is 96 years old. The Appendix shows the details of the historical data used to calibrate the SUPA model, as well as the parameter calibrations, to make our results replicable. By contrast, with a comfortable lifestyle, the superannuation is expected to be depleted much sooner at 74 years old. This representative individual has to withdraw at least a minimum from the account-based pension, combined with Age Pension welfare entitlements, at an amount equal to the ASFA retirement standard. We simulated 100,000 Monte Carlo paths for each variable to compute the annual superannuation withdrawal. The actual ruin time will also depend on the investment strategy chosen for the superannuation fund. In this section, we choose a fixed Conservative strategy, defined as 30% invested in growth assets and 70% in defensive assets.
The Age Pension payment at different ages for modest and comfortable consumption discounted by inflation q(t) is given in Table 3. In March 2018, the maximum Age Pension is
 $\$23,662$
, including the pension and energy supplements for a single household. For a modest lifestyle, the person will be entitled to partial Age Pension from age 65 and this gradually increases to the maximum Age Pension at age 85. For a comfortable life, the same person would be entitled to the maximum Age Pension at age 71. With the same superannuation balance at age 65, a modest lifestyle can last up to age 101, whereas a comfortable lifestyle can only last up to age 74. After the account-based pension is depleted, this person will live solely on the Age Pension. If this retiree dies at a certain age, we can get the distribution of the legacy superannuation. The medians of the legacy superannuation balance are given in Table 4 for two different consumption rates.
Age Pension discounted entitlement for two different lifestyles (modest and comfortable) with a starting superannuation balance of
 $\$188,570$
. “max” (
 $\$23,662$
) is the maximum Age Pension.

Monte Carlo simulations and median (dashed curve) of the account-based pension balance with ASFA modest (left) and comfortable (right) lifestyles.

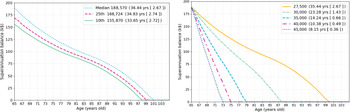
The plots in Figure 5 show the change in account-based pension balances with different starting values for a modest lifestyle. We use the median, as well as the
 $10\text{th}$
and
 $25\text{th}$
percentiles as simulated in section 4.1, Figure 3, as the initial balances. We expect this person to save up to
 $\$188,570$
at the age of retirement, which could last for 36.44 years, whereas there is a 25% and 10% chance that this person can only have
 $\$168,724$
and
 $\$155,870$
in superannuation, which will only last for 34.83 and 33.65 years, respectively, with a modest lifestyle. We also show the change in a median balance under different annual consumptions. The average ruin time for consumption of
 $\$27,500$
and levels starting from
 $\$30,000$
increasing by
 $\$5,000$
to
 $\$45,000$
per year is 35.44, 23.28, 14.24, 10.38 and 8.15 years. The standard deviations of the ruin times are also displayed.
Legacy superannuation balance discounted for modest and comfortable lifestyles with a starting superannuation balance of
 $\$188,570$
for different death ages from 65 to 98.

Superannuation balances in the decumulation phase for different simulated balances (left) with modest consumption and different consumption levels (right) and the ruin time with their standard deviations.

The chance of depleting the superannuation before death and the total Age Pension payment that one can receive relies on mortality estimates. One can easily compute the probability of ruin using the distribution of ruin time and the survival rates from existing life tables. These assumptions in the above examples can be modified with ease without affecting the integrity of the SUPA model. Other retirement outcomes in the decumulation phase under fixed withdrawal strategies, such as the minimum statutory drawdown strategy, and the dynamic strategy, such as the ‘Rule of Thumb’ strategy (De Ravin et al. Reference De Ravin, Liu, Van Rooyen, Scully and Wu2019) with annuitisation strategies can also be simulated using the SUPA model (Chen et al. in press).
4.3 Grattan Institute recommendations
Whether to increase the superannuation guarantee rate from 9.5% to 12% between 2021 and 2025 and whether to delay retirement age to 70 are two heated debates in Australia now (Rice & Bonarius Reference Rice and Bonarius2019). In the Grattan Institute report (Daley & Coates Reference Daley and Coates2018), the authors provide eight recommendations, such as maintaining the SG rate at
 $9.5\%$
, which is contrary to the planned future rise to 12%, extending the retirement age to 70, reducing the assets test taper rate from
 $3\%$
to
 $2.25\%$
and reforming superannuation tax breaks, including the value of the family home in testable asset. For all these recommendations, we can easily apply the SUPA simulation to test these recommendations via future projections of economic variables. Recently, there has been a heated debate on the Superannuation Guarantee in Australia. In this section, we demonstrate two tests on the first two recommendations using the SUPA model. First, we compare the results obtained when increasing the SG rate to 12% by 2018 and when maintaining the SG rate at
 $9.5\%$
. We then show the results when raising the age for Age Pension and superannuation eligibility to 70 years.
We consider someone aged 30 years old entering the workforce in 2018 and working for 37 years until retirement at age 67 in the year 2055. This person earns the AWOTE in 2018, which is
 $\$1,586.3$
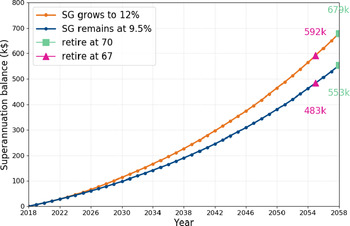
per week. In Figure 6, we simulate the superannuation balance for this individual and discount it by inflation q(t) to the present value in 2018 by using two different SG rates,
 $9.5\%$
and 12%, for two different retirement ages, which are 67 and 70. The same assumptions and algorithms as in section 4.1 are used in this example. The simulated results show that the median of the simulated superannuation balance is
 $\$483,000$
if the SG rate remains at
 $9.5\%$
, compared with
 $\$592,000$
if the SG rate increases up to 12%. Increasing the retirement age by 3 years to the year 2058 could add another
 $\$70,000$
and
 $\$127,000$
, respectively, to the final median balances.
Median of the simulated superannuation balances in 2055 (triangle) and 2058 (square) for different SG rates, 12% (above) and
 $9.5\%$
(below), discounted back to year 2018.

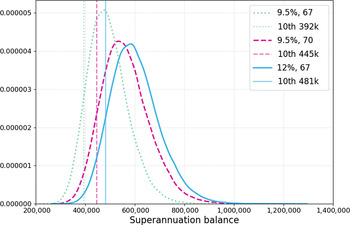
Probability distributions of the simulated balances and their
 $10\text{th}$
percentiles for maintaining the SG rate at
 $9.5\%$
and the retirement age at 67 (dotted curve), extending the retirement age to 70 (dashed curve) and raising the SG rate to 12% whilst keeping the retirement age at 67 (solid curve) and SG rate at
 $9.5\%$
.

To obtain more information from possible future scenarios under different policy changes, we show the distributions of the simulated superannuation balances and their
 $10\text{th}$
percentiles in Figure 7. The effect of delaying retirement to 70 years old has a similar effect on the superannuation balance. In other words, raising the SG rate from
 $9.5\%$
to 12% and increasing the retirement age from 67 to 70 bring an additional amount of
 $\$109,000$
and
 $\$70,000$
to the individual’s superannuation account. The differences between the medians and the
 $10\text{th}$
percentiles of the two policy changes, raising the SG rate (solid curve) and delaying the retirement age (dashed curve), are
 $\$39,000$
and
 $\$36,000$
. Increasing the SG rate shows higher balances; however, it can have a negative impact on the economy and on the living standard through reduced take-home pay. Considering this impact, we cannot justify whether one recommendation is better than the other unless we model the relationship between wage growth and the change in SG rate.
5 Conclusion and Discussion
In this paper, we used a probabilistic approach to analyse superannuation outcomes during both the accumulation and decumulation phases; importantly, through stochastic modelling of future economic scenarios, we can incorporate a measure of uncertainty when estimating the future superannuation savings and retirement income. The probability distributions of the uncertain superannuation outcomes have been used to estimate the average balances and quantify the risks as expressed by the
 $10\text{th}$
and
 $25\text{th}$
percentiles of the possible unfavourable outcomes. Because the stochastic SUPA model projects the stochastic distribution of future inflation, wage growth and asset returns, we have considered all major economic factors when analysing future superannuation balances, Age Pension payment and retirement income. The examples presented in this paper demonstrate additional insight that can be generated from using a stochastic approach.
This paper also outlines the huge potential of using stochastic investment models to inform the current debate about the Australian superannuation system whilst providing downside risk estimates in the superannuation accumulation and decumulation phases. For example, we used the Grattan Institute report (Daley & Coates Reference Daley and Coates2018) which comments that the superannuation fund fee is too high and that reducing it would increase the retirement income and budget revenue more than the planned increase of the SG rate.
The SUPA model can be combined with mortality models, such as the Lee-Carter model (Lee & Carter Reference Lee and Carter1992), in which the length of each simulated life is the aggregate result of a series of year-upon-year conditional survival probabilities to work out the probabilities of ruin. Alternative models, such as the Hyndman-Ullah mortality model (Hyndman & Ullah Reference Hyndman and Ullah2007), or newer models, can be considered in the future to provide a better estimation of mortality rates that will then be used to analyse retirement income (Wang et al. Reference Wang, Koo and O’Hare2016) and calculate mortality-related retirement products, such as annuities. Mortality estimation would also allow us to answer mortality-related issues, such as whether a person will outlive their superannuation fund needs.
Acknowledgements
We are grateful to the conference and seminar participants of the 2019 Actuaries Summit and the 23rd International Congress on Insurance: Mathematics and Economics 2019, the 25th Forecasting Financial Markets Conference 2018, the European Actuarial Journal Conference 2018, the Actuarial Institute seminar and the Korea Development Institute seminar for the constructive comments. We also thank Aaron Minney, head of retirement income research at Challenger, Ltd. The authors acknowledge the financial support of the Australian Research Council Linkage Projects, Grant LP160101038.
Disclaimer
This publication represents the opinions of the authors and is the product of scientific research. It is not meant to represent the view of CSIRO or Monash University. To the extent permitted by law, CSIRO and Monash University (including their employees and consultants) exclude all liability to any person for any consequences, including but not limited to all losses, damages, costs, expenses and any other compensation, arising directly or indirectly from using this publication (in part or in whole) and any information or material contained in it.
Appendix A SUPA Model: Calibration and Simulation
This Appendix details the historical data used to calibrate the SUPA model and presents the parameter calibrations in order to make our results replicable. There are 14 economic variables simulated using Monte Carlo numerical schemes, and all parameters in the SUPA model are calibrated using historical data from 1992 to 2018, as shown in Table A.1. The data come from various sources, such as the Reserve Bank of Australia, the Australian Bureau of Statistics and Bloomberg terminal. Most of the historical data consist of indices, except for the short-term s(t) and long-term l(t) interest rates and the unemployment rate u(t). We convert the historical indices to the economic variables appropriate for our SUPA model before calibration. More specifically, we process the indices into a series of log ratios to denote the change rates of these indices. For example, based on the CPI (all groups) from 1992 to 2018, we can compute the inflation rate q(t), which is a log ratio of the CPI by
 $\ln({\text{CPI}}(t)/\text{CPI}(t-1))$
for the period from 1993 to 2018. This transformation provides an annualised percentage change in the CPI. The same procedure is applied to other historical data, such as the wage index W(t), the equity price index P(t), the domestic total equity price index E(t), the international total equity price index N(t), the domestic bond index B(t) and the international bond index O(t) and the house price index H(t). Using an asset price index and a total return index, we can compute the dividend yield y(t) and thus the dividend growth rate d(t).
Australian historical data from 1992 to 2018.

Dynamics of the variables and calibrated parameters of the SUPA model.

Kernel density estimate of empirical errors.

A.1 Calibration
Table A.2. shows that the economic component, which is specified as an autoregressive (AR) process, tends to revert to a long-term mean (also known as an Ornstein–Uhlenbeck process), in addition to being influenced by other economic factors, as depicted in Figure 1. Each economic factor incorporates a disturbance term which captures a related stochastic component in its dynamics. Most variables follow an AR process, whereas the domestic dividend growth rate follows an ARMA(0,1) process. Using Python packages, such as statistics, sklearn and statsmodels, one can easily obtain the estimated parameters of each model. The parameters used within the model for the price inflation variable are calculated by fitting the time series data of annual changes in the CPI (all groups) between 1992 and 2018. Whenever an economic variable’ s behaviour is related to the behaviour of other economic variables within the SUPA model, the time series data of the past performance of these other variables are incorporated into the fitting process alongside those of the key economic variables being considered.
We use the dynamics for inflation proposed by Wilkie (Reference Wilkie1984). The inflation rate q(t) follows a discretised mean-reverting Ornstein–Uhlenbeck process or an AR(1) process:
 \begin{equation}q(t)=\mu_{q}+\phi_{q}(q(t-1)-\mu_{q})+\epsilon_{q}(t),\end{equation}
where
 $t\in2,3,...,T$
,
 $\mu_{q}$
is the long-term mean inflation rate, a positive
 $\phi_{q}$
is the AR coefficient and
 $\epsilon_{q}(t)$
is the disturbance term. We can rewrite equation (A.1) as:
 \[q(t)=\mu_{q}(1-\phi_{q})+\phi_{q}q(t-1)+\sigma_{q}z_{q}(t),\]
where
 $z_{q}\sim\mathcal{N}(0,1)$
. The ordinary least squares method is applied to estimate the parameters, namely the speed of mean reversion
 $\phi_{q}$
, the mean of inflation
 $\mu_{q}$
and the volatility
 $\sigma_{q}$
which is the standard error of
 $\epsilon_{q}$
. We assume all the residuals
 $\epsilon=\sigma\cdot z$
are independent and normally distributed.
Another example of an AR(1) process in the SUPA model is the domestic equity dividend yield y(t). The log dividend yield follows the AR(1) process in the work of Butt & Deng (Reference Butt and Deng2012):
 \begin{equation}\ln y(t+1)=\phi_{y}\ln y(t)+(1-\phi_{y})\ln\mu_{y}+\epsilon_{y}(t).\end{equation}
We define a new variable
 $X_{y}$
as the log-ratio of the dividend yield and the mean dividend yield,
 $X_{y}(t)=\ln\left(y(t)\right)-\ln\left(\mu_{y}\right)$
, where
 $\mu_{y}$
is the mean of y(t), and then one can rewrite equation (A.2) as:
 \[X_{y}(t+1)=\phi_{y}X_{y}(t)+\sigma_{y}z_{y}(t).\]
For the domestic dividend growth rate d(t), there are exogenous variables
 $\epsilon_{y}(t)$
,
 $\epsilon_{y}(t-1)$
which are the residuals of the domestic dividend yield y(t), and the moving average terms
 $\epsilon_{d}(t)$
,
 $\epsilon_{d}(t-1)$
in the dynamics:
 \[d(t)=q(t)+\mu_{d}+\tau_{d,1}\epsilon_{y}(t)+\tau_{d,2}\epsilon_{y}(t-1)+\epsilon_{d}(t)+\theta_{d}\epsilon_{d}(t-1).\]
We calibrate this model with respect to the exogenous variable
 $[\epsilon_{y}(t),\epsilon_{y}(t-1)]$
by maximum likelihood estimation.
Table A.2. reports the calibrated parameters of the SUPA model. All these time series variables can be discretised via a Euler scheme and can therefore be simulated at any frequency level by Monte Carlo methods. In practice, however, we simulate all the variables annually with the time interval
 $\Delta t=1$
. We generate a large number (10,000) of Monte Carlo paths for each of these variables. For example, the price inflation
 \begin{equation}q(t+\Delta t)=(1-\phi_{q})\mu_{q}\Delta t+\left[1-(1-\phi_{q})\Delta t\right]q(t)+\sigma_{q}z_{q}(t+\Delta t)\sqrt{\Delta t},\end{equation}
where
 $z_{q}(t+\Delta t)\sim\mathcal{N}(0,1)$
is a normally distributed random variable at time
 $t+\Delta t$
. The annual historical data from year 1992
 $t=0$
to 2018
 $t=T$
are used for this superannuation project, although higher-frequency data (quarterly or monthly) are available.
A.2 Empirical error analysis
We plot the histogram and the kernel density estimate of the empirical errors from 1994 to 2018 in Figure A.1. We acknowledge the limitation of the model due to the small amount of data; nevertheless, the empirical distributions of the residuals look not too far from being centred, unimodal and symmetric and can be approximated by normal variables.
The mean, standard deviation, skewness and excess kurtosis (3.0 is subtracted from the kurtosis) of the empirical errors are given in Table A.3.
The lower triangular part of their correlation matrix is given in Figure A.2. Most terms in the correlation matrix exhibit low correlations as expected. The main exceptions are the correlations between the inflation and long-term real interest rates and the short- and long-term real interest rates. Further improvement of the model is continuing as part of our research activities.
Moments of empirical errors.

Correlation matrix of residuals.