I. INTRODUCTION
Duplex stainless steel is a class of materials that attracts great interest due to its improved resistance to general and localized corrosion, stress corrosion cracking, abrasion, and wear.Reference Jorge, Reis and Balancin1–Reference Cabrera, Mateo, Llanes, Prado and Anglada4 In addition, it shows higher strength than the austenitic grades while also carrying a lower cost due to the decreased concentration of alloying elements, mainly molybdenum and nickel.Reference Olsson and Snis5 Consequently, duplex stainless steel has become a typical material of choice in chemical, petrochemical, and nuclear industries,Reference Sahraoui, Hadji and Yahi6 as well as in desalination plants.Reference Olsson and Snis5
Duplex stainless steel is generally composed of equal volume fraction of two phases austenite γ and ferrite α. Due to such inhomogeneities, each phase will respond differently for a given applied load.Reference Johansson, Oden and Zeng7 The correct prediction of the macroscopic properties of this material requires a local description of its properties taking into account the interaction between its constituents and their geometric arrangement.Reference Siegmund, Werner and Fischer8 While several stereological parameters were proposed to describe the microstructure and phase distribution,Reference Horvath, Tabernig, Werner and Uggowitzer9 the understanding will not be complete without knowing the local phase features. Nanoindentation can provide valuable information on the local elastic and plastic properties in dual phases materials with higher spatial resolution and minimal influence of geometric or texturing effects.Reference Baltazar Hernandez, Panda, Kuntz and Zhou10, Reference Choi, Seo and Jang11 Ahn et al.Reference Ahn, Um, Choi, Kim, Oh, Kim and Han12 combined nanoindentation with Electron Backscattered Diffraction to study the nanohardness of statically and dynamically transformed ferrite in supercooled austenite. Campos et al.Reference Campos, Bautista, Cáceres, Abenojar and Torralba13 utilized nanoindentation to study the duplex stainless steel prepared by powder metallurgy to understand the effect of alloying elements and sintering conditions on the mechanical properties of their material. It is interesting to obtain quantifiable distinct properties of the phases using the same technique given that the phases can be clearly discerned.
Studying the microstructure of duplex stainless steel is traditionally performed through chemical etching to identify the ferritic and austenitic phases.Reference Femenia, Canalias, Pan and Leygraf14 Such approach is nontrivial, requiring skill and experience in sample preparation as well as analysis. Furthermore, Wang et al.Reference Wang, Yang, Guo, Zhou and Song15 have shown that surface treatments significantly affect the mechanical properties estimated through nanoindentation. Magnetic force microscopy (MFM) provides a valuable alternative to locally identify the phases without the need for specific surface treatment that may alter the surface.Reference Dias and Andrade16 The technique exploits the difference in the magnetic characteristics of the phases (α is ferromagnetic and γ is paramagnetic) to unequivocally distinguish the phases with high resolution.Reference Dias and Andrade16
In this work, we use nanoindentation to locally investigate the mechanical properties of ferrite and austenite in a duplex stainless steel sample. With the surface remained intact, MFM is used to identify the phases and assign indentation force curves to the respective phase. Combining MFM with nanoindentation enables a statistically valid experiment to be performed with ease. No phase transformation of austenite to martensite is observed in the deformed regions. The recorded indentation curves are utilized to quantify the elastic and plastic properties of the phase. Ferrite is found to have higher elastic modulus, hardness, and strain-hardening exponent than austenite. The yield strength of both phases is similar. This is explained in the context of the work of Cheng and Cheng.Reference Cheng and Cheng17
II. EXPERIMENTAL PROCEDURE
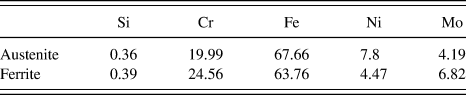
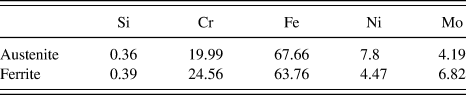
A commercial austenitic–ferritic duplex stainless steel sample (Uranus 50) is examined throughout the course of this work. Nominally, the sample has an equal phase balance between the austenite and ferrite. Table I shows the chemical composition of the two phases indicating the high concentration of the alloying element. The average grain size of austenite and ferrite is 10 μm (data not shown). The sample is subjected to mechanical testing using nanoindentation followed by a magnetic force microscope scanning to the indented area.
Chemical composition (wt%) of the as-received duplex stainless steel Uranus 50.
Nanoindentation experiments are performed using MFP Nanoindenter (Asylum Research, Santa Barbara, CA) with a Berkovich tip. The sample has the form of a strip with 1 × 2.5 cm2 surface area and a 2 mm thickness. The indentation experiments are run under depth control to reach a maximum depth of 200 nm. This depth is chosen to be shallow enough to probe the properties of the phases while generating relatively large remaining indents that can be easily distinguished and examined with the atomic force microscope (AFM). The sample is loaded and unloaded slowly at a speed of 10 nm/s, while the force is recorded at the corresponding depth. A grid of 14 × 12 indentations is created in an area of 70 × 70 μm2. The indenter tip is made of industrial diamond with elastic modulus of 865 GPa and Poisson’s ratio of 0.2. The nanoindentation experiments are run inside an acoustic enclosure with a temperature control unit to minimize thermal drift.
MFM scans are conducted using MFP three-dimensional atomic force microscope (Asylum Research) using a CoCr-coated tip. The tip is magnetized along its axis before scanning. The MFM scanning is a standard two-pass tapping/lift mode. After the first scanning pass, the tip is lifted by a predetermined distance of 30 nm to follow the topography profile. By doing so, the tip dynamics are mainly affected by the magnetic forces, and the phase plots clearly distinguish the magnetic and the nonmagnetic domains in the steel sample.
III. RESULTS AND DISCUSSION
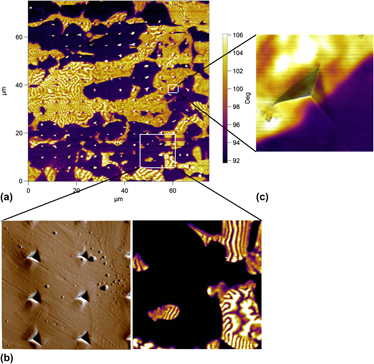
The determination of the local mechanical properties of austenite and ferrite in duplex stainless steel mandates the ability to distinguish these phases without altering the surface. MFM scans of the indented area can assist us in separating the indentation results into groups based on whether the remaining indent lies in a magnetic domain (ferromagnetic ferrite), a nonmagnetic domain (paramagnetic austenite), or at the interface. Figure 1(a) shows the 75 × 75 μm2 phase plot of the indented area extracted from the lift mode. Clear magnetic domains with their worm-like shapes can be easily distinguished in a plain nonmagnetic matrix (nonmagnetic to indicate paramagnetism of the phase, which does not affect the cantilever dynamics). Furthermore, among these domains, remaining indents can be observed. MFM manages to show the distribution of the ferromagnetic ferrite within the paramagnetic austenite without the need to perform any chemical etching steps.
MFM scans for duplex stainless steel. (a) A 75 × 75 μm2 phase scan in lift mode for the area containing the nanoindentation grid. The ferrite domains are distinguished through the worm-like magnetic domains, while austenite is plain. Nanoindentation grid can be easily noticed as regular bright spots. (b) A scan for a small indentation grid at a slower scan speed for the area marked in (a). The indentations are almost indistinguishable. The bright spots in (a) are artificial due to abrupt variations in the surface altering tip dynamics. (c) Scan of a single indentation shows no variation of phase magnetic characteristics after deformation, and a sharp phase boundary is observed passing though the remaining indent.

It is interesting to notice that the remaining indents in the austenite matrix show bright spots that might support the idea that some magnetic characteristics of these indents are probed, affecting the tip dynamics. Having a closer look on a group of indents that demonstrated such behavior revealed an important explanation of such observation [see Fig. 1(b)]. When the scan size was reduced (∼20 × 20 μm2) along with the scan speed, the previously observed magnetic characteristics disappeared from the remaining indents. In fact, the effect of the remaining indents in the lift phase scan almost disappeared making it almost indistinguishable. To further verify this finding, an indentation located at an interface is scanned and the resulting image is shown in Fig. 1(c). The scan shows a clear boundary separating the two domains (ferrite and austenite) that extends inside the remaining indent. It is surprising that the deformation of the material under the indentation load has no visible effect of the separation between the two domains. Based on our finding, in our range of indentation, the plastic deformation in the austenite did not result in any martensitic transformation and the material kept its paramagnetic properties.
The explanation of the artificial magnetic characteristics of the remaining indents is as follows. Due to the elastoplastic properties of this steel, indentation resulted in the well-known phenomena of pileup. Although the topography of the sample was recorded in the first tapping stroke of the scan, the high scanning speed did not generate an accurate record of the surface. The large scan size also added to this deficiency. During the second stroke (lift mode), the tip was coming across these pileups. The tip hits these abrupt surface variations altering its dynamics and showing these artificial bright spots at the remaining indents. This is why, with a lower scan speed and a small scan size, these spots disappeared.
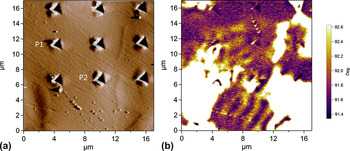
While the phase plots of MFM showed a strong contrast between the ferritic and austenitic domains in Fig. 1, an extra weak signal was noticed in the lower left corner of the scan. A clearer image of the lower left 17 × 17 μm2 area is shown in Fig. 2. The topography map does not provide any information on the phases present, as shown in Fig. 2(b). On the other hand, the lift mode phase plot not only shows the expected strong magnetic signal of the ferritic domains but also a weak magnetic signal of extended periodicity connecting the ferritic domains. This buried magnetic signal indicates the presence of a hidden ferritic domain under the austenite phase. Our investigation of the spatial range of the magnetic forces above the surface (data not shown) indicated that the magnetic forces can alter the tip dynamics approximately 400 nm above surface. Consequently, we believe that the thickness of the austenitic layer is on the order of couple of hundreds of nanometers. This yielded an even greater effect on the force curves recorded in this region.
A topography and lift phase scans for the lower left corner of Fig. 1. (a) A topography scan showing the remaining indents with no information to the phases present. (b) A lift phase scan revealing a strong ferrite magnetic signal besides a weak periodic signal connecting the ferrite domains. This indicates that a buried ferrite layer is underneath the austenite. Points P1 and P2 show large values of F max and Wu/Wt due to the effect of the strong buried ferrite influence.

The MFM scans are further used to divide the nanoindentation force curves into three groups: austenite, ferrite, and interface as were previously outlined. As a preliminary investigation, the quantities that can be extracted directly from the force curves are compared, namely the force recorded at maximum depth F max and the ratio between the elastic energy to the total energy Wu/Wt involved in the indentation experiment,Reference Cheng and Cheng17 where

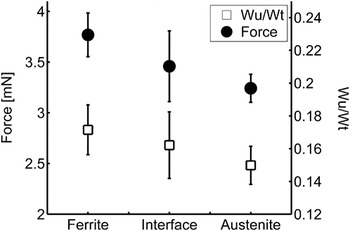
Before further processing, Chauvenet’s criterion is applied on these quantities recorded for each group to eliminate any outliers. Figure 3 shows that there is indeed a difference in the properties of the force curves measured in each domain. Ferrite has higher maximum force and energy ratios than austenite, while the interface properties show intermediate results between the two domains. This provides the motivation to quantify the mechanical properties of these phases.
Maximum force recorded F max and energy ratio Wu/Wt for each phase and for the interface. The plot shows that differences exist between the phases, implying differences in mechanical properties. The interface records intermediate values between the two phases.

It is interesting to find that two points in the interface group recorded significantly large force and energy ratio values and statistically were marked as outliers. These two points are marked P1 and P2 in Fig. 2(a). With the assistance of MFM scans, it is realized that these two points were highly affected by the buried ferrite domain by recording such high values.
The unloading section of the force curves contains information related to the elastic modulus of the phases. The procedure proposed by Oliver and PharrReference Oliver and Pharr18, Reference Oliver and Pharr19 is used to estimate the contact area A c and extract the values of the elastic modulus E according to the following relations:
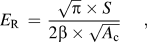

where S is the slope of the unloading curve evaluated at maximum indentation depth. The value of β is 1.03. The value of Poisson’s ratio  for steel is assumed to be 0.3. The contact area is evaluated at the contact depth h c, where
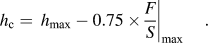
The loading section of the force curves contains the plastic characteristics of the indented domain. The most straightforward quantity to estimate that is related to material plasticity is the domain hardness H, which is evaluated as
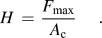
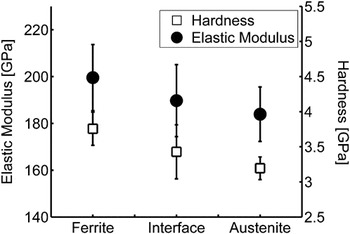
Figure 4 shows the elastic modulus values for each group of data. It is interesting to see that ferrite shows the highest elastic modulus of 199.5 ± 14.1 GPa, while the austenite showed the lowest with 183.9 ± 11.6 GPa. This agrees very well with the analysis performed by Moverare and Odén.Reference Moverare and Odén20 The hardness values calculated in Fig. 4 demonstrate the same trend, with ferrite hardness being 3.75 ± 0.23 GPa and austenite hardness being 3.19 ± 0.16 GPa. We can see that ferrite supersedes the austenite in its mechanical properties both elastically and plastically. Moverare and OdénReference Moverare and Odén21 have explained that although ferrite is generally considered as the strong phase,Reference Siegmund, Werner and Fischer8, Reference Fischer, Rammerstorfer and Bauer22, Reference Siegmund, Werner and Fischer23 duplex stainless steel samples might show the opposite behavior.Reference Inal, Gergaud, Francois and Lebrun24 The reason behind this is the role that nitrogen plays in stabilizing the austenite phase and in acting as a planar glide promoter, which enhances the strength of austenite.Reference Moverare and Odén21 This complies with the fact that the nitrogen concentration in this particular sample is very low (<0.07%).Reference Solomon and Devine25
The elastic modulus and hardness values estimated for each group. The ferrite supersedes austenite in both quantities showing that ferrite is the strong phase. The properties of the interface show to be a weighted average of the two phases with no predominant behavior.

The properties of the interface are calculated and result in intermediate values between the two phases (E = 189.7 ± 15.4 GPa and H = 3.42 ± 0.38 GPa) also seen in Fig. 3. In fact, interface boundaries have an important role in the microscale deformation of the two phases. Fréchard et al.Reference Fréchard, Martin, Clément and Cousty26 studied the plastic deformation of this type of steel and identified activated slip systems in each phase. They noticed that ferrite grains showed delayed deformation with two main mechanisms. First, the pileup of austenite dislocations at the phase boundary induced dislocation generation in ferrite. Second, some ferrite grains were totally sheared by the dislocation traces of the surrounding austenite. For such BCC/FCC (body centered cube/face centered cube) system, the Kurdjumov–Sachs crystallographic relation must be satisfied: {111}fcc//{110}bcc and {011}fcc//{111}bcc for the dislocations to be able to be transferred from the austenite to ferrite. Serre et al.Reference Serre, Salazar and Vogt27 showed similar behavior but also noticed new curved deformation bands in ferrite grains that were explained to appear by the incompatibility of the ferrite grain with the neighboring austenitic grains. In our localized deformation, the interface demonstrated to be a weighted average effect of properties between the two phases without a predominant behavior. The large indented area and the inability to control the precise location of interface indentation could not assist in better analyzing these regions.
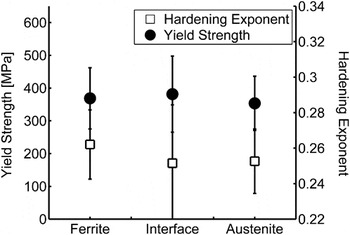
To achieve a better insight and attempt to glean more information concerning the plastic properties of the phases, the force curves were used to estimate the yield strength Y and hardening exponent n of the phases. Dao et al.Reference Dao, Chollacoop, Van Vliet, Venkatesh and Suresh28 utilized dimensional analysis to relate material plastic properties to measurable quantities from the force curves. They provided a reverse algorithm that can estimate Y and the n of the indented material. Their set of empirical equations was solved and the results are plotted in Fig. 5.
Plastic properties of the three groups namely Y and n. Austenite and ferrite have similar yield strength, while the hardening exponent for ferrite is slightly lower than ferrite. The values are in very good agreement with the literature.Reference Solomon and Devine25 This does not contradict what was seen in the hardness values as explained by Cheng and Cheng.Reference Cheng and Cheng17

The values of Y of the three groups lie in the range of 370 MPa. This value agrees very well with the values reported in Solomon and DevineReference Solomon and Devine25 for the yield strength of bulk samples. The n value reported in Solomon and DevineReference Solomon and Devine25 is 0.2, which is less than the range obtained in this study of 0.25. It is noted that Dao et al.Reference Dao, Chollacoop, Van Vliet, Venkatesh and Suresh28 discussed the uniqueness and accuracy of the algorithm and demonstrated that the solution is unique given that n < 0.3 or Y/E r < 0.03. Our material properties lie within these limits. On the other hand, the algorithm suffered from high sensitivity in predicting Y and n.Reference Gouldstone, Chollacoop, Dao, Li, Minor and Shen29 Still, their values were estimated with reasonable accuracy compared to experiments,Reference Dao, Chollacoop, Van Vliet, Venkatesh and Suresh28 especially when averaging several experimental indentation results. The error in n is expected to be larger due to its magnitude, numerical accuracy, and the uncertainties in the dimensionless functions.
While the trend observed previously in the hardness data can be seen in the hardening behavior of the three groups, the Y behavior shows no significant differences among the different domains. It is instructive to analyze the plasticity results using the dimensional analysis performed by Cheng and Cheng.Reference Cheng and Cheng17 TaborReference Tabor30 used slip line field analysis for indentation in a rigid plastic solid using a frictionless rigid wedge, coming to the conclusion that H and Y are related where H = 3Y. However, for most metals, strain hardening results in an increase in yield strength of the material and consequently the plastic strain will vary across the deformed region. TaborReference Tabor30 suggested to modify the relation into H = 3Y 0, where Y 0 is the uniaxial flow stress at some specified strain value. On the other hand, Cheng and ChengReference Cheng and Cheng17 showed that H/Y is not constant for a large range of material properties. Furthermore, they showed that H depends on E, Y, and n, where the strain hardening has its greatest effect at small values of Y/E. Comparing the Y values to the H values of this duplex stainless steel, we find that H ∼ (8–10)Y, in very good agreement with what Cheng and ChengReference Cheng and Cheng17 demonstrated at Y/E ∼ 0.002 and n ∼ 0.25. In summary, ferrite demonstrates higher elastic modulus and strain hardening than austenite, while they both have very similar yield strength. The difference observed in the values of H between the two phases is real and is a consequence to the elastic and hardening differences between them.
It is worth mentioning that thermal stresses are generally introduced in duplex stainless steel during cooling due to the difference in thermal coefficients of expansion between the two phases.Reference Johansson, Oden and Zeng7 Trying to simulate them from cooling modeling, the experimental values of residual stresses demonstrate smaller values than what simulations expect.Reference Siegmund, Werner and Fischer8, Reference Siegmund, Werner and Fischer23 Johansson et al.Reference Johansson, Oden and Zeng7 argued that plastic deformation and creep might be the reason for causing stress relief. Such stress relief is also anisotropic based on sample processing and texture.Reference Johansson, Oden and Zeng7 Furthermore, Johansson et al.Reference Johansson, Oden and Zeng7 demonstrated that although residual stresses increase in the initial elastic loading, they start decreasing during plastic deformation. Given these findings and knowing that nanoindentation causes highly localized deformation, we would argue that such stresses, despite not being included in our analysis, would not have a significant influence to invalidate the results.
IV. CONCLUSION
MFM is accurately capable to identify austenitic and ferritic phases in duplex steel. The magnetic scans show very sharp boundaries between the domains. No clear phase transformation is observed in the austenite. The sharp transition between phases was maintained through indentations.
The nanoindentation analyses indicate that ferrite mechanical properties supersede austenite. This is seen in the elastic modulus, hardness, and strain-hardening exponent. The yields strength of the two phases is believed to be the same. The values extracted from indentation force curves agree very well with the literature.
The combination of MFM and nanoindentation provides a relatively easy and fast method to conduct and distinguish large number of indentation experiments and obtains a statistical characterization of the local mechanical properties of duplex steel. This kind of study may be extended to compare and verify several proposed rules of mixtures to estimate the macroscopic properties of duplex stainless steels. It may also be extended to higher temperature experiments where the austenite becomes the stronger phase and grain boundary coherency plays a significant role in describing the deformation.