

Introduction
There have been several cases of unexplained pneumonia in hospitals in Wuhan, Hubei province, China, in December 2019. Subsequent research has confirmed that the disease is an acute respiratory infection caused by a new coronavirus infection, which is identified as coronavirus disease 2019 (COVID-19) by the World Health Organization. COVID-19 has caused great harm to the health of people all over the world. As of 5:54 pm CEST on 5 July 2021, there had been 183 560 151 confirmed cases of the COVID-19 globally, with 3 978 581 deaths (Ref. 1). Furthermore, it seems that the harm will continue.
Currently, the COVID-19 pandemic in China has been largely contained, but the pandemic is still raging in other countries around the world. Traditional Chinese medicine (TCM), along with western medicine (WM) has contributed greatly to the fight against the pandemic together with WM. Some TCMs such as Jinhua Qinggan granules, Lianhua Qingwen capsules/granules and Xuebijing injection were used to treat COVID-19 patients, and have been proven to be effective. Furthermore, the application rate of TCM among all COVID-19 patients in China is as high as 92% (Ref. 2).
Moreover, some statistical analysis-based studies on the differences between integrated Chinese with western (ICW) and WM in the treatment of COVID-19 have been conducted (Refs Reference Zhou3–Reference Ouyang7). However, each of the included studies are relatively incomplete with limited indicators analysed. Therefore, the data from ICW with WM and WM-alone treatments for COVID-19 patients from the included literature studies must be pooled to comprehensively compare and evaluate if there is any difference in clinical outcomes among patients. Specifically, our meta-analysis study found that ICW in combination with WM in treating COVID-19 patients obtained better rates of exacerbation reduction, death reduction and cure, and faster recovery compared with those of WM-alone-treated patients. These results imply that ICW joining force with WM in treating COVID-19 patients is a better strategy compared with WM-alone, suggesting the application of ICW actually may have contributed to the relatively quicker containment of the COVID-19 pandemic in China.
Methods
Eligibility criteria
Population: Randomised controlled (RC) and non-randomised controlled (NRC) trials of the patients diagnosed with COVID-19 were included.
Intervention: We included studies, among which the control group received WM treatment and the event group received TCM (including oral medicine and injection) in combination with WM treatment.
Outcomes: To be included, a trial has to have used clinical data of the treatment effects of ICW and WM. We applied no language restrictions. There are no explicit limits on the characteristics of patients such as age, sex, severity of disease and treatment time.
Information sources
We searched PubMed, Embase, Cochrane Central Register of Controlled Trials (CENTRAL), China Clinical Trial Registry, Chinese Biomedical Literature Database (CBM), China National Knowledge Infrastructure (CNKI) and Wanfang databases, and the last search date is 10 February 2021.
Search strategy
We searched related articles in the above databases using the following keywords independently or in combination:
(1) COVID-19;
(2) Traditional Chinese Medicine or TCM;
(3) Western Medicine or WM;
(4) Treatment Outcome.
Selection process
Firstly, two researchers (Ruizhe Yu and Dejian Zhao) independently reviewed titles and abstracts of the first 50 records, and discussed inconsistencies until consensus was obtained.
Secondly, two researchers independently screened titles and abstracts of all retrieved articles and reached consensus by discussion.
Finally, two researchers independently screened full-text of the articles, and consensus was also reached on inclusion or exclusion by discussion.
Data extraction process
The two authors extracted data of all indicators from the included articles and recorded them in a data sheet independently. Extracted data were compared, and discrepancies, if any, were resolved through discussion.
Data items
(a) The collected indicators include effective rate, cure rate, exacerbation rate, turning negative rate of viral nucleic acid, remission rate and remission time of symptoms such as fever, cough, feebleness and chest computed tomography (CT), number of white blood cells (WBCs) and lymphocytes (LYM) of the COVID-19 patients.
(b) We collected data on:
• author, year and source of publication;
• study design, number of patients;
• methods of randomisation, blind or not;
• treatment duration, TCM and WM treatment;
• indicators.
Study risk of bias assessment
We used the revised Cochrane risk of bias tool (RoB 2.0) to assess the risk of bias in the included RC trials. For NRC trials, we used risk of bias in non-randomised studies of interventions (ROBINS-I) to evaluate the risk of bias.
Effect measures
The ratio risk (RR) and weighted mean difference (WMD) were used as the indexes of the statistical analysis for counting data and for continuous data, respectively, and both of which were demonstrated in effect size and 95% confidence intervals (CIs). The computations of RR and WMD are given in the following standard formulas:

where ai and ci are the events, and n 1i and n 2i are the group size for two studied groups in study i, respectively.

where m 1i and m 2i are the mean response, sd1i and sd2i are the standard deviations for the two studied groups in study i, respectively.
Synthesis methods
RevMan 5.4 software provided by the Cochrane Collaboration was used for the meta-analysis. We used forest plot to present study results, and subgroup analysis was used because of the difference in data quality of RC and NRC trials.
Heterogeneity of all studies was evaluated through the I 2 test. When P ⩾ 0.1 and I 2 ⩽ 50%, the fixed-effects model is used considering the small heterogeneity. When P < 0.1 and I 2 > 50%, the random-effects model is used considering the large heterogeneity; we analysed the source of heterogeneity and conducted a subgroup analysis based on the possible heterogeneity factors.
Moreover, sensitivity analysis was used to analyse stability of the test results. When the heterogeneity was so large that the source cannot be judged, we analysed the data by using descriptive analysis rather than meta-analysis.
Reporting bias assessment
Publication bias by the funnel plot was evaluated if the number of studies included in the meta-analysis reached 10. If the points on the funnel plot were scattered symmetrically and showed an inverted symmetrical funnel shape, it indicated that the publication bias of the included study was small, and if the points on the funnel plot were clustered, the publication bias was considered large.
Results
Study selection
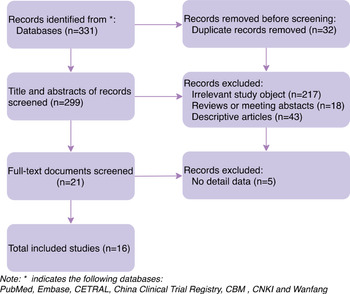
A total of 331 records were found in databases, including 42 English articles and 289 Chinese articles. After manual removal of duplicates, 299 records were retained. We screened titles and abstracts of 299 records, from which we reviewed 21 full-text documents of the included records. Finally, 16 articles were included. Figure 1 shows the flow diagram of study selection.
Flow diagram of literature selection.

Study characteristics
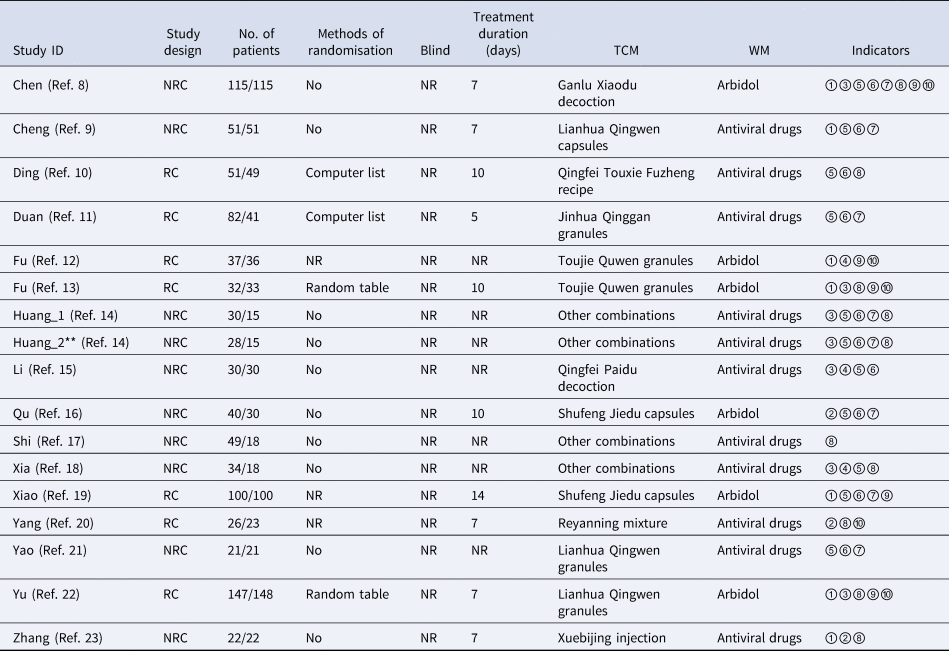
The 16 included studies contained 1649 patients with confirmed COVID-19 status, and the general characteristics assessed were author, study design, number of patients, methods of randomisation, blind or not, treatment duration, TCM and WM treatment and indicators, as shown in Table 1.
Characteristics of the evaluated studies with author, study design, number of patients, methods of randomisation, blind or not, treatment duration, TCM and WM treatment and indicators

NR denotes that the characteristic is not reported. The symbol ‘**’ denotes that there are two trials in the study of Huang.
The indicators are divided into three categories, that is, overall indicator, symptom indicator and blood indicator. The overall indicators include effective rate (numbered as ① in Table 1), turning negative rate of viral nucleic acid (numbered as ②), exacerbation rate (numbered as ③) and cure rate (numbered as ④). The symptom indicators include fever remission rate or time (numbered as ⑤), cough remission rate or time (numbered as ⑥), feebleness remission rate or time (numbered as ⑦) and chest CT improvement rate (numbered as ⑧). The blood indicators include WBC amounts (numbered as ⑨) and LYM amounts (numbered as ⑩).
Risk of bias in studies
Among the 16 studies assessed, seven studies were RC trials, and the rest were NRC trials, which included 10 trials in the remaining nine studies.
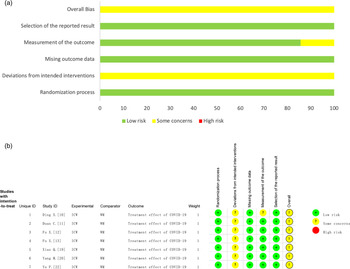
For RC trials, risk of bias assessment (RoB2) (Ref. Reference Sterne24) recommended by Cochrane was used. Because of sudden outbreak of the epidemic, allocation of intervention measures was mainly based on medical humanity, and patient health along with baseline data of the patients were basically the same, so it did not interfere with the research conclusions. Except in the study by Ding et al. (Ref. Reference Ding10), where the investigators did not mention the use of a reasonable scale when measuring the patient's fever, cough and other symptoms, appropriate measuring methods were used in all the other studies. All of the studies provided complete outcome data, and none of them reported results selectively. Moderate quality results among these RC trials are shown in Figure 2a and b.
(a) Risk of bias graph of seven RC trials. (b) Risk of bias summary of seven RC trials.

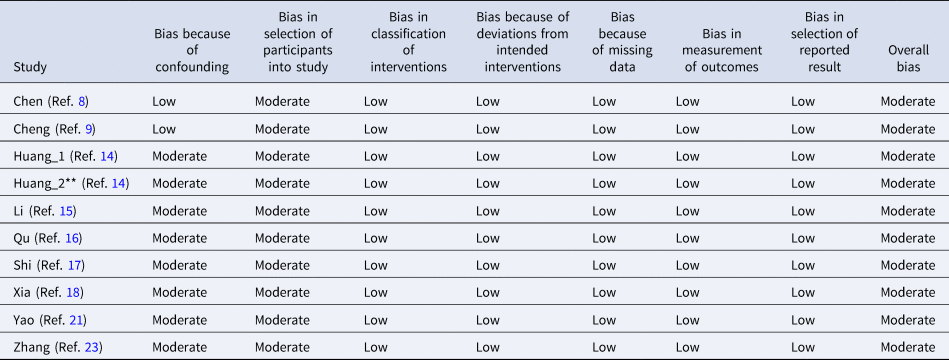
The ROBINS-I (Ref. Reference Sterne25) was used to evaluate NRC trials. Most NRC trials have issues associated with baseline confounding and only Chen (Ref. Reference Chen8) and Cheng (Ref. Reference Cheng9) have used effective and reliable methods of propensity matching and comparability analysis of baseline data. Moreover, no time-varying confounding problem was observed in the included studies. The time of admission and the time point at which intervention began differed, but the intervention effect was only affected by the duration of intervention, so the risk of bias among the subjects was moderate. All research interventions were well-defined, and there were no interfering factors other than the interventions used in the control group and the event group. All data were fully reported. We maintained a unified standard for the outcome evaluation method between the intervention groups, and there was no selective reporting of the results. Therefore, overall risk of bias is moderate, and detailed results about risk of bias are shown in Table 2.
Risk of bias evaluation on 10 NRC trials in nine studies

The symbol ‘**’ denotes that there are two trials in the study of Huang.
Results of individual studies and syntheses
Overall indicator
Effective rate: The ‘effective rate’ is derived from the curative effect criterion which is divided into three levels: significantly effective, effective and ineffective with a detailed explanation as follows.
Effective rate = (significantly effective + effective)/number of cases × 100%.
(1) Significantly effective: Chinese medical symptoms and signs disappeared or significantly reduced, and the total score was reduced by ⩾70% and (2) Effective: Chinese medical symptoms and signs were reduced, with 30% ⩽ total score reduction <70% and (3) Ineffective: Chinese medical symptoms and signs did not improve, and the total score was reduced by <30% (Ref. 26).
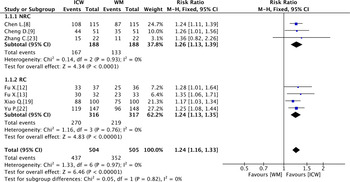
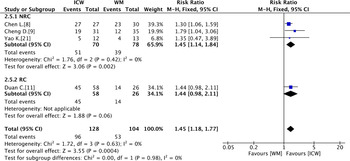
Seven studies reported effective rate indicators. We used subgroup analysis because of the differences between the data qualities of RC and NRC trials. A fixed-effects model was used owing to the minor heterogeneity. The meta-analysis showed that the effective rate of the ICW group was significantly higher than that of the pure WM group. The indicators obtained were RR = 1.24, 95% CI: 1.16–1.33 and P < 0.01, and is shown in Figure 3. Publication bias was not performed because of the limited number of studies. The results of meta-analysis did not change after excluding each study separately through sensitivity analysis.
Forest plot comparison of effective rate.

Cure rate: The definition of ‘clinical cure rate’ is based on the ‘New Coronavirus Pneumonia Diagnosis and Treatment Plan (Trial Sixth Edition)’ (Ref. 27). The criteria are as follows: (1) Body temperature returns to normal for more than 3 days and (2) respiratory symptoms improve significantly, and obvious absorption of inflammation is showed on the chest CT at least twice and (3) a negative for COVID-19 viral nucleic acid.
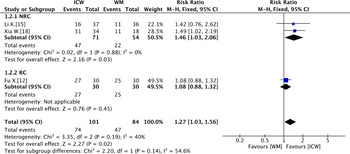
Three studies reported cure rate data. We used subgroup analysis because of the differences between the data qualities of RC and NRC trials. A fixed-effects model was used owing to the minor heterogeneity. The meta-analysis results indicated that the cure rate of ICW group is better than that of the WM group. The indicators observed were RR = 1.27, 95% CI: 1.03–1.56, P = 0.02, and is shown in Figure 4. Publication bias was not performed because of the limited number of studies. The sensitivity analysis of cure rate was not carried out because only three studies involved cure rate and excluding any one of the three studies will seriously affect the results of meta-analysis.
Forest plot comparison of cure rate.

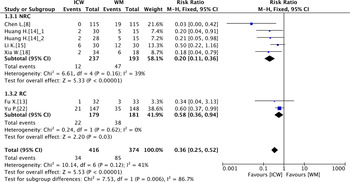
Exacerbation rate: Seven trials reported the rate of exacerbation. We used subgroup analysis because of the differences between the data qualities of RC and NRC trials. A fixed-effects model was used owing to the minor heterogeneity.
The findings indicated that the addition of TCM effectively slows the progression of the disease and improves its symptoms. Therefore, the exacerbation rate of ICW treatment was significantly lower than that of pure WM treatment, and the meta-analysis was observed to be statistically significant. The corresponding indicators obtained were RR = 0.36, 95% CI: 0.25–0.52, P < 0.01, and is shown in Figure 5. Publication bias was not performed because of the limited number of studies. The result of meta-analysis did not change after excluding each study separately through sensitivity analysis.
Forest plot comparison of exacerbation rate.

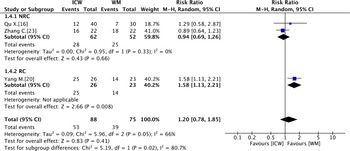
Turning negative rate of viral nucleic acid: Only three studies reported the turning negative rate of viral nucleic acid. We used subgroup analysis because of the differences in the data qualities between the RC and NRC trials. The subgroup analysis results indicated that the study design may be the source of heterogeneity. The random-effects model was adopted because of the high heterogeneity.
No statistically significant difference of the viral nucleic acid turning negative rate was observed between the treatment of ICW and that of WM. The corresponding indicators obtained were RR = 1.20, 95% CI: 0.78–1.85, P = 0.41, and is shown in Figure 6. Publication bias was not performed because of the limited number of studies. Sensitivity analysis of cure rate was not carried out because only three studies involved cure rate and excluding any one of the three studies will seriously affect the results of meta-analysis.
Forest plot comparison of viral nucleic acid turning negative rate.

Symptom indicator
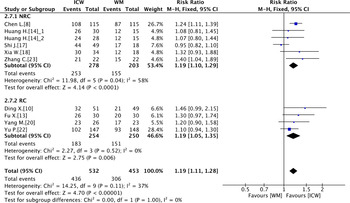
Fever remission rate: Five studies reported the fever remission rate. We used subgroup analysis because of the difference between the data qualities between RC and NRC trials. The subgroup analysis results indicated that the study design may be the source of heterogeneity. The random-effects model was adopted because of the high heterogeneity.
The result of meta-analysis showed that the fever remission rate of the ICW treatment was better than that of the WM treatment statistically. The indicators of meta-analysis on fever remission rate were RR = 1.24, 95% CI: 1.09–1.42, P = 0.001, and is shown in Figure 7. Publication bias was not performed because of the limited number of studies. The result of meta-analysis did not change after excluding each study separately through sensitivity analysis.
Forest plot comparison of fever remission rate.

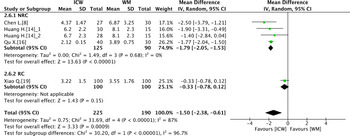
Fever remission time: Eight trials reported the fever remission time. We used subgroup analysis because of the differences between the data qualities of RC and NRC trials. The subgroup analysis results indicated that the study design may be the source of heterogeneity. Among these eight trials, only Xiao et al. (Ref. Reference Xiao19) used RC design whereas other studies used NRC studies. The random-effects model was adopted because of the high heterogeneity.
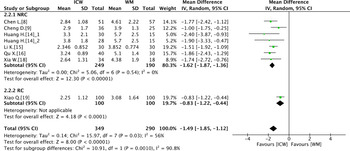
The results of meta-analysis showed that the fever remission time of the ICW treatment was obviously statistically better than that of WM treatment. The indicators of meta-analysis on fever remission time were identified to be WMD = −1.49, 95% CI: −1.85 to −1.12, P < 0.01 and are shown in Figure 8. Publication bias was not performed because of the limited number of studies. The result of meta-analysis did not change after excluding each study separately through sensitivity analysis.
Forest plot comparison of fever remission time.

Cough remission rate: Five studies reported the cough remission rate. We used subgroup analysis because of the differences between the data qualities of RC and NRC trials. The subgroup analysis results indicated that the study design may be the source of heterogeneity. The random-effects model was adopted considering the large heterogeneity.
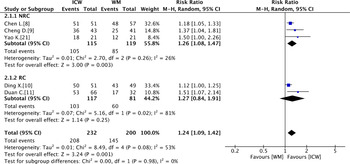
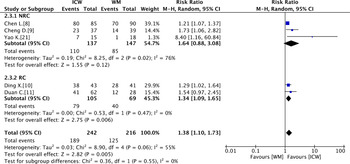
The results from the meta-analysis showed that the cough remission rate of ICW treatment was statistically better than that of WM treatment. The indicators of meta-analysis on cough remission rate were RR = 1.38, 95% CI: 1.10–1.73, P = 0.005, and are shown in Figure 9. Publication bias was not performed because of the limited number of studies. The result of meta-analysis did not change after excluding each study separately through sensitivity analysis.
Forest plot comparison of cough remission rate.

Cough remission time: Seven trials reported cough remission time. We used subgroup analysis because of the difference between the data qualities of RC and NRC trials. The results of subgroup analysis indicated that the study design may be the source of heterogeneity. The random-effects model was adopted because of the large heterogeneity from the study by Xiao et al. (Ref. Reference Xiao19).
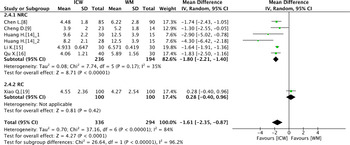
The results of meta-analysis showed that the cough remission time of ICW treatment was statistically less than that of WM treatment. The obtained indicators of meta-analysis on cough remission time were WMD = −1.61, 95% CI: −2.35 to −0.87, P < 0.0001, and is shown in Figure 10. Publication bias was not performed because of the limited number of studies. The meta-analysis results did not change after excluding each study separately through sensitivity analysis.
Forest plot comparison of cough remission time.

Feebleness remission rate: Only four studies described the feebleness remission rate. We used subgroup analysis because of the differences between the data qualities of RC and NRC trials. The fixed-effects model was used owing to the minor heterogeneity.
Meta-analysis results showed that the feebleness remission rate of ICW treatment was statistically better than that of WM treatment. The indicators of meta-analysis on feebleness remission rate were RR = 1.45, 95% CI: 1.18–1.77, P < 0.01, and is shown in Figure 11. Publication bias was not performed because of the limited number of studies. Meta-analysis results did not change after excluding each study separately through sensitivity analysis.
Forest plot comparison of feebleness remission rate.

Feebleness remission time: Five trials reported feebleness remission time. We used subgroup analysis because of the differences between the data qualities of RC and NRC trials. The subgroup analysis results indicated that the study design may be the source of heterogeneity. The random-effects model was adopted because of the large heterogeneity from the study by Xiao et al. (Ref. Reference Xiao19).
The meta-analysis results showed that the feebleness remission time of ICW treatment is statistically less than that of the WM treatment. The indicators of meta-analysis on feebleness remission rate were identified as WMD = −1.50, 95% CI: −2.38 to −0.61, P < 0.001, and is shown in Figure 12. Publication bias was not performed because of the limited number of studies. Meta-analysis results did not change after excluding each study separately through sensitivity analysis.
Forest plot of comparison of feeble remission time.

Chest CT improvement rate: CT evaluation criteria (Ref. 28) were established to assess treatment efficacy. It is characterised as lesion absorption when reduction of lesion area is ⩾70%, and as improved when reduction of lesion area ⩾30%. If there is no change in the lesion area it is characterised as no change. When the increase of lesion area is >30%, it is characterised as aggravated. The lesion absorption and improvement are effective.
Ten trials reported chest CT improvement rate. We used subgroup analysis because of the differences between the data qualities of RC and NRC trials. The fixed-effects model was used owing to the minor heterogeneity.
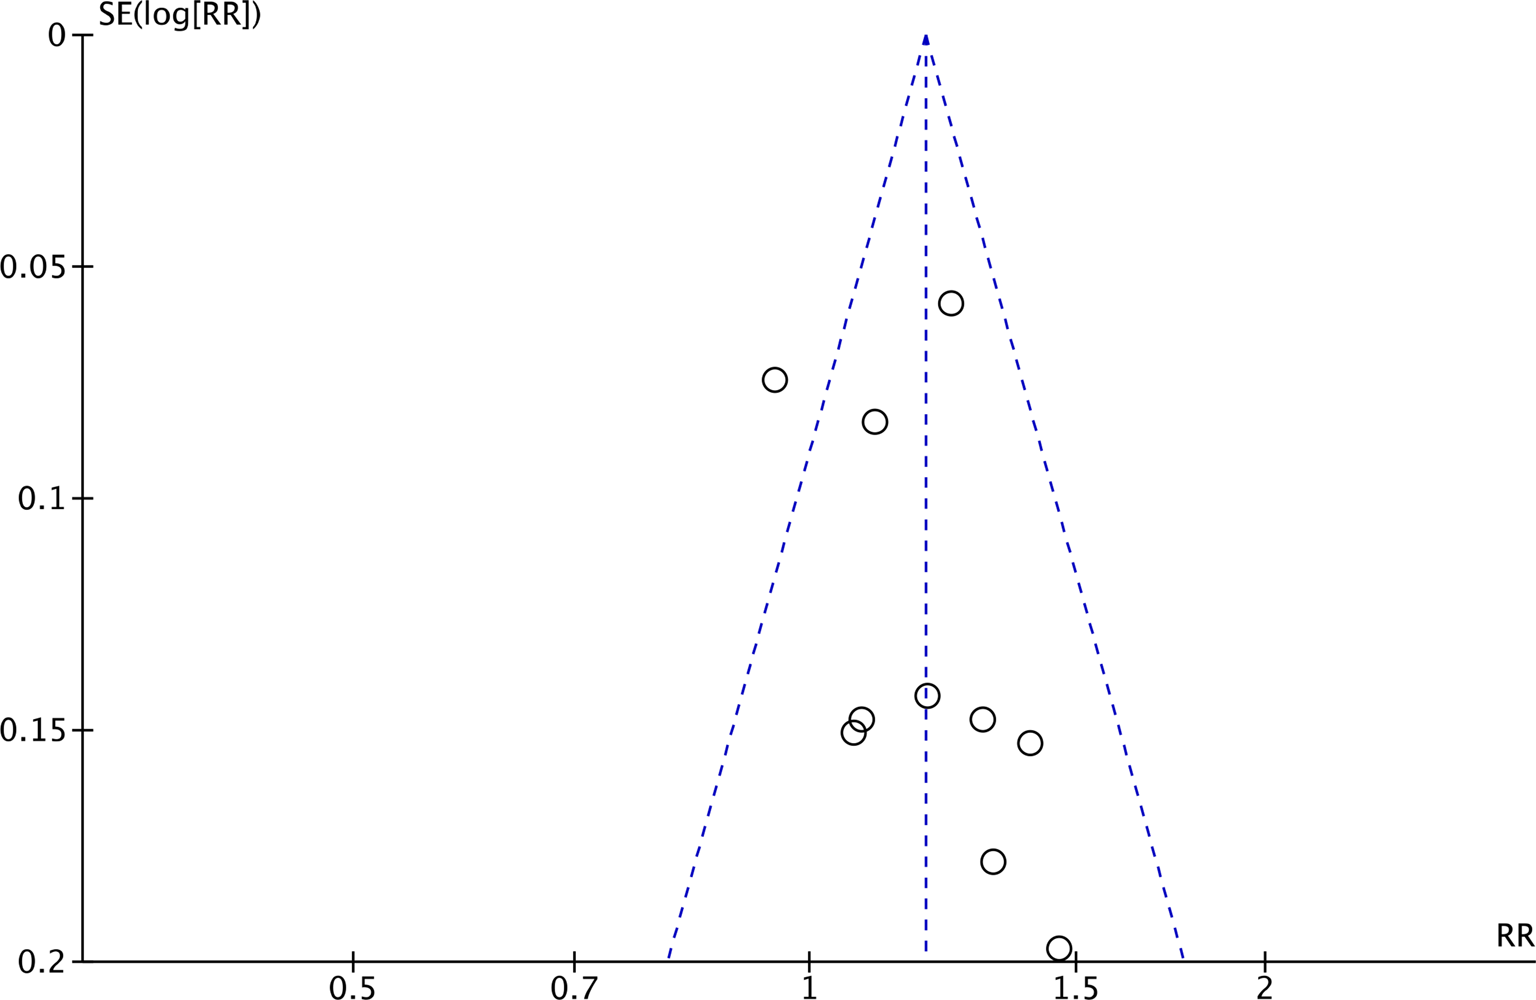
Obviously, meta-analysis results indicated that the chest CT of ICW treatment was significantly higher than that of the WM treatment. The indicators obtained were RR = 1.19, 95% CI: 1.11–1.28, P < 0.001, and is shown in Figure 13. We assessed the potential publication bias by using funnel plots. It showed no significant publication bias among the included studies as shown in Figure 14. The result of meta-analysis did not change after excluding each study separately through sensitivity analysis.
Forest plot comparison of chest CT improvement rate.

Funnel plot of publications of chest CT improvement rate.

Blood indicator
Comparability of WBC and LYM before treatment: The guidelines state that patients with COVID-19 may experience a decrease in WBC and LYM. If the patient's LYM is significantly reduced, the patient is prompted to have a poor prognostication, which will have a high risk of heavy exacerbation (Ref. Reference Huang29). We compared the pre-treatment WBC and LYM data to prove the comparable baseline.
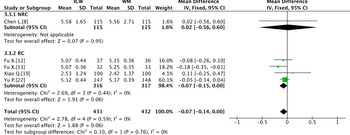
For WBC count, five studies provided the pre-treatment data of WBC. We used subgroup analysis because of the differences between the data qualities of RC and NRC trials. The fixed-effects model was used owing to the small heterogeneity. Meta-analysis results suggested that there were no statistical differences among pre-treatment data of WBCs. The indicators obtained were WMD = −0.07, 95% CI: −0.14 to 0.00, P = 0.06, and is shown in Figure 15. Publication bias was not performed because of the limited number of studies. The result of meta-analysis did not change after excluding each of studies separately through sensitivity analysis.
Forest plot comparison of WBC before treatment.

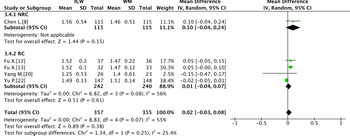
For the LYM count, five studies described the pre-treatment data of LYM. We used subgroup analysis because of the differences between the data qualities of RC and NRC trials. The random-effects model was adopted because of the major heterogeneity between the studies and the study by Yu et al. (Ref. Reference Yu22). Meta-analysis results suggested that there were no statistical differences among LYM pre-treatment data. The indicators obtained were WMD = 0.02, 95% CI: −0.03 to 0.08, P = 0.38, and is shown in Figure 16. Publication bias was not performed because of the limited number of studies. The result of meta-analysis changed after excluding the study by Yu et al. (Ref. Reference Yu22) separately through sensitivity analysis.
Forest plot comparison of LYM before treatment.

WBC and LYM after treatment: We compared the after-treatment data of WBCs and LYM to prove the effect of the treatment. Meta-analysis indicates that the ICW group is better than the WM group in improving immunity and reducing the risk of inflammation.
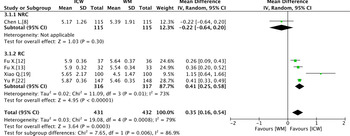
For the five studies that reported the WBC count after treatment, we used subgroup analysis because of the differences between the data qualities of RC and NRC trials. The random-effects model was adopted because of the large heterogeneity. The indicators obtained were WMD = 0.35, 95% CI: 0.16–0.54, P < 0.001, and is shown in Figure 17. Publication bias was not performed because of the limited number of studies. The result of meta-analysis did not change after excluding each study separately through sensitivity analysis.
Forest plot comparison of WBC after treatment.

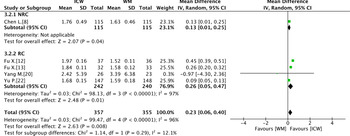
For the five studies that reported the LYM count after treatment, we used subgroup analysis because of the differences between the data qualities of RC and NRC trials. The random-effects model was adopted because of the large heterogeneity. The indicators obtained were WMD = 0.23, 95% CI: 0.06–0.40, P = 0.008, and is shown in Figure 18. Publication bias was not performed because of the limited number of studies. The result of meta-analysis changed after excluding the study by Fu et al. (Ref. Reference Fu13) separately through sensitivity analysis.
Forest plot comparison of LYM after treatment.

Discussion
COVID-19, an extremely contagious disease, is caused by a previously unknown type of coronavirus. Because of our limited knowledge about the disease at the beginning of the outbreak, we remained at the exploratory stage of treatment plan. However, there were several retrospective analyses, resulting in several low-quality studies. However, it has become evident that ICW is helpful in improving the symptoms among patients with mild-to-moderate symptoms.
Based on previous experiences, the combination of Chinese and WMs can usually complement each other and achieve good results. For example, some adverse events related to the use of corticosteroids, for example, fungal infections, have made corticosteroids controversial in the treatment of severe acute respiratory syndrome (SARS) patients (Refs Reference Griffith30, Reference Wang31). There are reports which indicate that some SARS survivors who received high-dose corticosteroids developed femoral head necrosis after treatment (Refs Reference Hong32, Reference Shen33). According to evidence-based medicine report, the application of Chinese medicine can be helpful to effectively reduce the daily average use dose of corticosteroids (Ref. Reference Chen34). In the Guangdong Provincial Hospital of Traditional Chinese Medicine, Chinese medicine is used as the primary treatment for the early, middle, extreme and convalescent periods of the SARS disease even without the use of corticosteroids and antiviral drugs, thus indicating that it is feasible and safe to treat patients with TCM-alone (Ref. Reference He35).
With SARS-CoV-2 infection, 20% of patients will rapidly develop severe disease manifestations including atypical interstitial pneumonia, acute respiratory distress syndrome and multiple organ dysfunctions, and nearly 10% among will die eventually. It is fortunate that the pathological mechanism of this disease evolution is being revealed gradually. Studies show that excessive immune response characterised as extensive endothelial damage, complement-induced blood coagulation and systemic micro-vascular disease plays a key role in disease progression (Ref. Reference Perico36). By observing histopathological changes in lungs, spleen, liver, heart, kidney, thyroid and testis of patients who died because of COVID-19, it was found that the patient's high-inflammation and repair states coexisted, and the high-inflammation state caused pathological processes such as coagulation status, micro-thrombosis, fibrosis and angiogenesis (Ref. Reference Nie37). Therefore, it is necessary to start early treatment procedures for patients with severe disease symptoms to prevent multiple organ fibrosis. In the previous application of the ICW, 36 kinds of Chinese medicine monomer active ingredients such as baicalein (Refs Reference Cui38, Reference Sun39), puerarin (Ref. Reference Hu and Huang40), gallic acid (Refs Reference Jin41, Reference Rong42) and astragaloside (Ref. Reference Cho43) and other 25 kinds of Chinese medicinal compound active ingredients such as Yupingfeng powder (Refs Reference Xu44–Reference Cui46), Bufei decoction (Refs Reference Yang47, Reference Zhang48) and Buyang Huanwu decoction (Ref. Reference Wang49) were used, and these medicinal compounds can reduce the expression of inflammatory factors and regulate the balance of redox, induce apoptosis of lung fibroblasts and block the process of fibrosis through the transforming growth factor-β1/Smad, phosphatidylinositol-3-kinase/Akt and nuclear erythroid 2-related factor 2/glutathione or other pathways, which indicates good anti-pulmonary fibrosis activity and can effectively improve symptoms of fibrosis and delay disease progression (Refs Reference Ding50, Reference Leung51). This may explain why the ICW treatment has better therapeutic effect compared with WM treatment. Therefore, TCM, especially the compound prescriptions, have a good prospect for the clinical application in prevention and treatment of fibrosis (Ref. Reference Ma52), but more related clinical trials should be carried out to cope with moderate and severe patients of COVID-19.
Conclusion
Treatment experiences from previous emerging contagious diseases, such as SARS and H1N1, have proven that the ICW treatment has better treatment outcomes than mere WM treatment, and this study has come to a similar conclusion. Pooled 16 studies were systematically analysed for differences between the ICW and WM treatments in three broad categories, that is, overall indicators, symptom indicators and blood indicators by meta-analysis. The results showed that the combination of Chinese medicine played a significant role in better controlling the exacerbation of patient's condition, improving cure rate and repairing immunity of COVID-19 patients.
The treatment experiences of SARS, H1N1 and COVID-19 all have shown that Chinese medicine has complementary effects with WM. All these seem to suggest that Chinese medicine could withstand the challenge of fighting emerging epidemic diseases. Thus, it is valuable to carry out more such practices and further research, which would facilitate the development of Chinese medicine and perhaps benefit the world. It is, therefore, reasonable to speculate that Chinese medicine, and perhaps other traditional medicine, can aid in our fighting against emerging epidemic diseases in the future.
Financial support
This research received no external funding.
Conflict of interest
The authors declare no conflict of interest.