INTRODUCTION
Photosynthesis and biomass production set the basis of crop yield. In high-yielding crop breeding programmes, all efforts are aimed ultimately at improving the population photosynthetic efficiency and material-producing ability as much as possible through construction of an ideal plant architecture. Plant architecture is the three-dimensional organization of the above-ground plant parts and encompasses, for example, branching pattern, plant height and the arrangement of leaves and fruit branches. Plant architecture is of major agronomic importance as it determines the adaptability of a plant to cultivation, its harvest index and potential yield (Reinhard & Kuhlemeier Reference Reinhard and Kuhlemeier2002; Yang & Hwa Reference Yang and Hwa2008). Plant breeders have paid special attention to plant architecture for centuries in varietal improvement. A good example is the global production of cereal grains: the Green Revolution led to the creation of higher-yielding cultivars with shorter and sturdier stems in rice and wheat by modification of plant architecture (Peng et al. Reference Peng, Richards, Hartley, Murphy, Devos, Flintham, Beales, Fish, Worland, Pelica, Sudhakar, Christou, Snape, Gale and Harberd1999).
‘Cotton plant architecture’ represents a series of important traits that are useful to consider for the genetic improvement of cotton. These traits include plant height, stem node length, stem internode length, total fruit branches, effective fruit branches, fruit branch length, fruit branch nodes, fruit branch internode length, total fruit branch nodes and fruit branch angle. Different types of cotton plant architecture have been suggested as ideal for different environmental conditions and cultivation practices in various regions. Plant architecture breeding programmes are an effective way to improve cotton fibre yield and quality (Wang et al. Reference Wang, Wu, Huang, Zhu, Guo and Zhang2006; Song & Zhang Reference Song and Zhang2009). For example, the successful breeding of high-yielding cotton varieties Simian3 and Baimian1 was based on modification of plant architecture with moderate plant height and leaf size, sturdy main-stem, narrower fruit branch angle and optimum fruit branch internode length (Zhang et al. Reference Zhang, Zhu, Guo, Yu and Zhang2006; Li et al. Reference Li, Wang, Dong, Fu, Zhang and Lian2010).
Plant architecture traits, however, are quantitative traits controlled by many genes and it is difficult to attain ideal plant architecture through conventional artificial selection (Reinhardt & Kuhlemeier Reference Reinhard and Kuhlemeier2002). Fortunately, developments in genomics research have provided alternative tools to improve efficiency in plant breeding programmes. Molecular markers linked to the causal genes and quantitative trait loci (QTLs) can be used for marker-assisted selection (MAS) (Xu & Crouch Reference Xu and Crouch2008). To date, there have been several studies attempting to identity QTLs for cotton plant architecture. Zhang et al. (Reference Zhang, Zhu, Guo, Yu and Zhang2006) detected three QTLs for plant height, two for fruit branch length and three for ratio of plant height to fruit branch length in a recombinant inbred lines (RILs) population of upland cotton (Gossypium hirsutum L.). Wang et al. (Reference Wang, Wu, Huang, Zhu, Guo and Zhang2006) identified three QTLs for fruit branch length and one for ratio of plant height to fruit branch length in another RIL population of G. hirsutum. Song & Zhang (Reference Song and Zhang2009) detected 26 QTLs dispersed over 15 chromosomes in an inter-specific population derived from G. hirsutum and G. barbadense for six plant architecture traits: first fruiting branch position, stem leaf size, plant height, stem internode length, fruit branch angle and fruit branch internode length. Li et al. (Reference Li, Song, Zhao, Xia, Jia, Wang, Dong and Wang2014) developed two F 2:3 upland cotton populations to map QTLs for plant architecture traits, and detected a total of 73 QTLs: five for plant height, ten for stem node length, six for stem internode length, nine for total fruit branches, three for effective fruit branches, eight for fruit branch length, eight for fruit branch nodes, eight for fruit branch internode length, ten for total fruit branch nodes and six for fruit branch angle. The above QTL data will be helpful in determining the genetic basis of cotton plant architecture traits. However, only a few previously reported QTLs have actually been applied in breeding programmes. This may be because these QTLs were population-specific, and the genetic variation detected in a unique bi-parental population might not be shared with other genetic populations. In addition, the limited genetic recombinations in most populations used for linkage mapping make it difficult to map QTLs with a high resolution, which severely limits their application in breeding programmes.
Association mapping based on linkage disequilibrium (LD) has recently gained popularity among plant geneticists as an alternative to overcome some of the limitations of bi-parental mapping (Jannink et al. Reference Jannink, Bink and Jansen2001; Buntjer et al. Reference Buntjer, Sorensen and Peleman2005). One advantage is the ability to use existing germplasm collections and associated data sets, thus eliminating the need to generate new mapping populations from crosses among inbred parents. Several association panels in rice (Agrama et al. Reference Agrama, Eizenga and Yan2007), maize (Yang et al. Reference Yang, Yan, Shah, Warburton, Li, Li, Gao, Chai, Fu, Zhou, Xu, Bai, Meng, Zheng and Li2010), barley (Massman et al. Reference Massman, Cooper, Horsley, Neate, Dill-Macky, Chao, Dong, Schwarz, Muehlbauer and Smith2011), wheat (Joukhadar et al. Reference Joukhadar, El-Bouhssini, Jighly and Ogbonnaya2013) and soybean (Niu et al. Reference Niu, Xu, Liu, Yang, Wei, Xie and Zhang2013) have been constructed for performing association mapping studies. In cotton, the first attempt at association mapping was in 2008: 30 markers associated with fibre-related traits were detected in 56 G. arboreum accessions genotyped using 98 simple sequence repeat (SSR) markers (Kantartzi & Stewart Reference Kantartzi and Stewart2008). Abdurakhmonov et al. (Reference Abdurakhmonov, Kohel, Yu, Pepper, Abdullaev, Kushanov, Salakhutdinov, Buriev, Saha, Scheffler, Jenkins and Abdukarimov2008) performed an association mapping of fibre quality traits using a set of 95 core microsatellite markers in 285 exotic G. hirsutum accessions and detected 0·06–0·13 of SSR markers associated with the main fibre quality traits. Subsequently, Abdurakhmonov et al. (Reference Abdurakhmonov, Saha, Jenkins, Buriev, Shermatov, Scheffler, Pepper, Yu, Kohel and Abdukarimov2009), Zhang et al. (Reference Zhang, Qian, Zhu, Chen, Wang, Mei and Zhang2013) and Cai et al. (Reference Cai, Ye, Zhang and Guo2014) obtained successively a series of molecular markers associated with fibre quality traits by the association mapping method. Mei et al. (Reference Mei, Zhu and Zhang2013) carried out an association mapping of lint yield and its components in Chinese upland cotton cultivars. A total of 55 marker–trait associations were detected between 26 SSRs and seven lint yield traits, of which 41 were detected in more than one environment, and many associations were consistent with QTLs identified in previous reports of linkage mapping. Zhao et al. (Reference Zhao, Wang, Chen and Li2014) identified 42 marker zloci associated with Verticillium wilt resistance through association mapping in an elite G. hirsutum germplasm population, and among which ten marker loci were found to be consistent with previously identified examples. The above research will aid the further understanding of the genetic basis of important quantitative traits in cotton, and will contribute to MAS of target traits. However, up to now, there have been no reports on association mapping of plant architecture traits in cotton.
In the present study, an association mapping panel comprising 172 G. hirsutum accessions was first characterized with a total of 101 polymorphic SSR markers and five agronomically important plant architecture traits of cotton: height of node of first fruiting branch, plant height, total fruit branches, effective fruit branches and fruit branch angle. This was used to: (1) investigate the phenotypic and genetic diversity; (2) estimate the population structure; (3) assess LD and LD decay; and (4) identify marker–trait associations and favourable alleles for plant architecture traits. The current study will lay the foundation for analysing the genetic mechanisms underlying plant architecture traits and the use of MAS for plant architecture breeding in cotton.
MATERIALS AND METHODS
Selection of cotton accessions
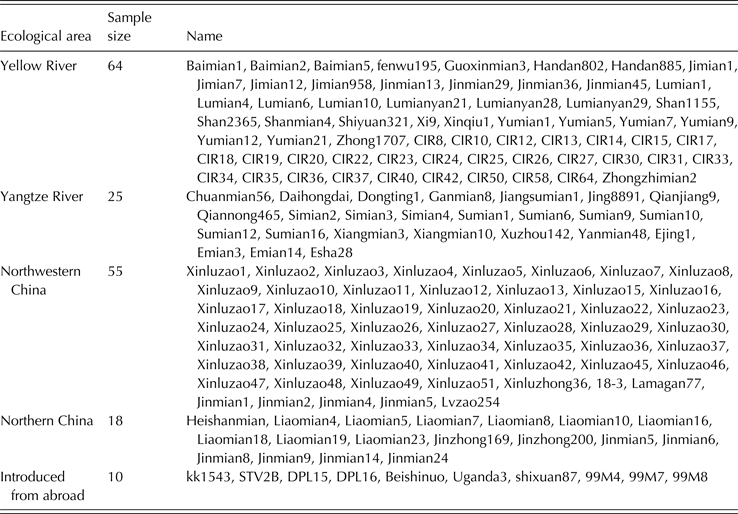
A total of 172 representative G. hirsutum cultivars and breeding lines were selected to construct an association mapping panel (Table 1). These accessions have been or are being grown in different ecological cotton-growing areas of China: 64 were from Yellow River, 25 from Yangtze River, 55 from Northwestern China, 18 from Northern China and 10 were introduced from abroad. All accessions showed stable inheritance after many generations of self-pollination.
Ecological area and name of 172 upland cotton accessions in the present research

Phenotypic data collection and analyses
All accessions were planted in four environments to evaluate phenotypic performance: two at the Cotton Research Institute of Shihezi, Shihezi, Xinjiang (85°56′E, 44°16′N, 442 m asl), the first in 2012 and the second 2013 (designated as E1 and E3, respectively), and two at the Henan Institute of Science and Technology, Xinxiang, Henan (113°52′E, 35°18′N, 95 m asl), again in 2012 and 2013 (E2 and E4, respectively). All the experiments were laid out in a randomized complete block design with single row plots and two replications. In Shihezi, 38–40 plants were sown in each row (0·45 m wide and 5 m long); in Xinxiang, 14–16 plants were sown in each row (1·0 m wide and 5 m long). All activities were performed according to normal local management practices.
Ten consecutive plants in the middle of each row were tagged for trait measurement. Five primary cotton plant architecture traits were evaluated: height of node of first fruiting branch (cm) is the distance between cotyledon node and first fruiting branch. Plant height (cm) is the distance between the ground next to stem and the top growth point of the stem. Total fruit branches are the total number of fruit branches. Effective fruit branches are the total number of fruit branches with bolls. Fruit branch angle (°) is the angle measured between the stem and fruiting branch recorded for the middle branch of all branches. Branch angle was only determined in environments E2–E4, while the other four traits were investigated in all four environments. Analysis of variance (ANOVA) of the phenotypic data was performed using SAS 9.4 software.
SSR genotyping
Total genomic DNA of the 172 accessions was extracted using the improved cetyl trimethylammonium bromide (CTAB) method (Paterson et al. Reference Paterson, Brubaker and Wendel1993). Based on the previously published genetic linkage map information from G. hirsutum × G. barbadense (Guo et al. Reference Guo, Cai, Wang, Han, Song, Wang, Niu, Wang, Lu, Shi and Zhang2007), SSR markers at approximately 10-cM intervals for each chromosome were selected to ensure broad genome-wide coverage of genotyping and a representative estimation of genetic distances. Furthermore, the reported markers linked to QTLs for agriculturally significant traits of cotton (Zhang et al. Reference Zhang, Yuan, Yu, Guo and Kohel2003; Mei et al. Reference Mei, Syed, Gao, Thaxton, Smith, Stelly and Chen2004; Nguyen et al. Reference Nguyen, Giband, Brottier, Risterucci and Lacape2004; Shen et al. Reference Shen, Guo, Lu, Zhu, Yuan and Zhang2007; Qin et al. Reference Qin, Guo, Zhang and Zhang2008; Song & Zhang Reference Song and Zhang2009) were also selected for association mapping. As a result, 386 primer-pairs were used to screen 172 accessions. All SSR primer-pair information can be downloaded from the Cotton Marker Database (http://www.cottonmarker.org, accessed February 2015). The protocol for polymerase chain reaction (PCR) amplification and examination followed that of Zhang et al. (Reference Zhang, Guo and Zhang2002).
Since G. hirsutum is an allopolyploid species, SSR markers often yield complex band patterns and some have been located at more than one locus. The details of SSR genotyping used to measure the complex band patterns of large-scale genotypes were described previously in a study by Mei et al. (Reference Mei, Zhu and Zhang2013). Briefly, the band pattern in kk1543 (numbered 1 in the panel) was designated as 1, similar patterns were also designated as 1, and different ones were designated as 2, 3, 4, 5 and so on. Thus the alleles from all accessions on each marker locus were measured.
Genotypic data analysis
The software PowerMarker 3.25 (Liu & Muse Reference Liu and Muse2005) was used to estimate the number of alleles per locus, the gene diversity index and the polymorphism information content of polymorphic SSR primer-pairs for the tested cotton accessions. The model-based (Bayesian) cluster software STRUCTURE 2.3 (http://pritchardlab.stanford.edu/software.html, Pritchard et al. Reference Pritchard, Stephens and Donnelly2000) was chosen to estimate the population structure (k = 1 to 10, with five runs for each k) of the 172 cotton accessions using a burn-in of 10 000 and a run length of 50 000. The most likely number of clusters (k) was selected by comparing the logarithmized probabilities of data LnP(D) and Δk according to Evanno et al. (Reference Evanno, Regnaut and Goudet2005), and the Q-matrix was derived for the subsequent association mapping. The LD was estimated by calculating the square of the correlation coefficient (r 2) between all pairs of markers with the software package TASSEL 2.1 (Yu et al. Reference Yu, Pressoir, Briggs, Vroh, Yamasaki, Doebley, McMullen, Gaut, Nielsen, Holland, Kresovich and Buckler2005). All pairs of adjacent loci within the same chromosome in LD were referred to as an LD block (Stich et al. Reference Stich, Melchinger, Frisch, Maurer, Heckenberger and Reif2005). The r 2 values of each pair of SSR loci were plotted against map distance (cM) between markers and LD decay was estimated.
Association mapping and favourable allele identification
A mixed linear model (MLM) performs better than a general linear model (GLM) in controlling spurious associations (Yu et al. Reference Yu, Pressoir, Briggs, Vroh, Yamasaki, Doebley, McMullen, Gaut, Nielsen, Holland, Kresovich and Buckler2005; Zhao et al. Reference Zhao, Aranzana, Kim, Lister, Shindo, Tang, Toomajian, Zheng, Dean, Marjoram and Nordborg2007) and so the MLM model in TASSEL software was performed using simultaneous accounting of multiple levels of population structure (Q-matrix) and relative kinship among the individuals (K-matrix), and the P value and R 2 (phenotypic variation explained by marker) for each marker–trait association were determined (Bradbury et al. Reference Bradbury, Zhang, Kroon, Casstevens, Ramdoss and Buckler2007). Based on the results of association mapping, alleles of loci significantly associated with the target traits were further analysed. The phenotypic allele effect was estimated through comparison between the average phenotypic value over accessions with the specific allele and that of all accessions:
 $${a_i} = \displaystyle{{\sum {{x_{ij}}}} \over {{n_i}}} - \displaystyle{{\sum {{N_k}}} \over {{n_k}}}$$
where a i is the phenotypic effect of the ith allele; x ij is the phenotypic value over the jth accession with the ith allele; n i is the number of accessions with the ith allele; N k is the phenotypic value over all accessions; and n k is the number of accessions. If a i > 0, the allele is considered to have a positive effect; if a i < 0, this corresponds to a negative allele. The favourable alleles were then identified according to the breeding objective of each target trait (Zhang et al. Reference Zhang, Qian, Zhu, Chen, Wang, Mei and Zhang2013).
RESULTS
Phenotypic diversity
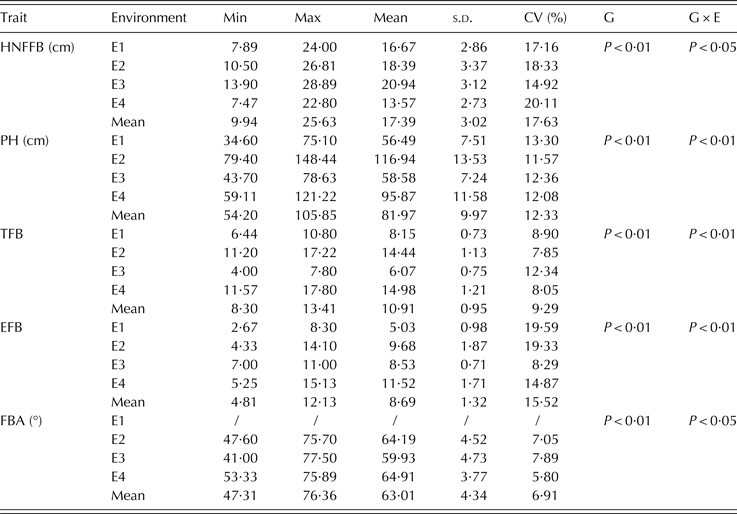
Descriptive statistics and ANOVA for plant architecture traits across different environments are listed in Table 2. The cotton accessions used in the present study represent a broad variation in plant architecture traits. For height of node of first fruiting branch, the mean for the four environments was 17·39 cm (range of 9·94–25·63 cm), while for plant height, total fruit branches, effective fruit branches and fruit branch angle, the means for the four (three for fruit branch angle) environments were 81·97 cm (range 54·20–105·85), 10·91 cm (range 8·30–13·41), 8·69 cm (range 4·81–12·13) and 63·01° (range 47·31–76·36°), respectively. The mean coefficients of variance (CV) for height of node of first fruiting branch, plant height, total fruit branches, effective fruit branches and fruit branch angle were 17·63, 12·33, 9·29, 15·52 and 6·91%, respectively, demonstrating that there were abundant phenotypic variations within this germplasm panel. The ANOVA showed that the variance of genotype (G) and the interactions between genotype and environment (G × E) were significant (P < 0·05) or highly significant (P < 0·01) for all traits. The phenotypic correlation analysis (Table 3) showed highly significant (P < 0·01) negative correlations between height of node of first fruiting branch and total fruit branches (r = −0·425), or effective fruit branches (r = −0·137), or fruit branch angle (r = −0·248), while all correlations between plant height, total fruit branches, effective fruit branches and fruit branch angle were highly significant (P < 0·01) but positive (r = 0·267~0·856).
Descriptive statistics and ANOVA for plant architecture traits across different environments
HNFFB, Height of node of first fruiting branch; PH, Plant height; TFB, Total fruit branches; EFB, Effective fruit branches; FBA, Fruit branch angle; E1, E2, E3 and E4 represent Shihezi in 2012, Xinxiang in 2012, Shihezi in 2013 and Xinxiang in 2013, respectively; / means data of FBA in E1 is absent.
Phenotypic correlations among plant architecture traits across four/three environments of 172 G. hirsutum accessions
HNFFB, Height of node of first fruiting branch; PH, Plant height; TFB, Total fruit branches; EFB, Effective fruit branches; FBA, Fruit branch angle.
Genetic diversity
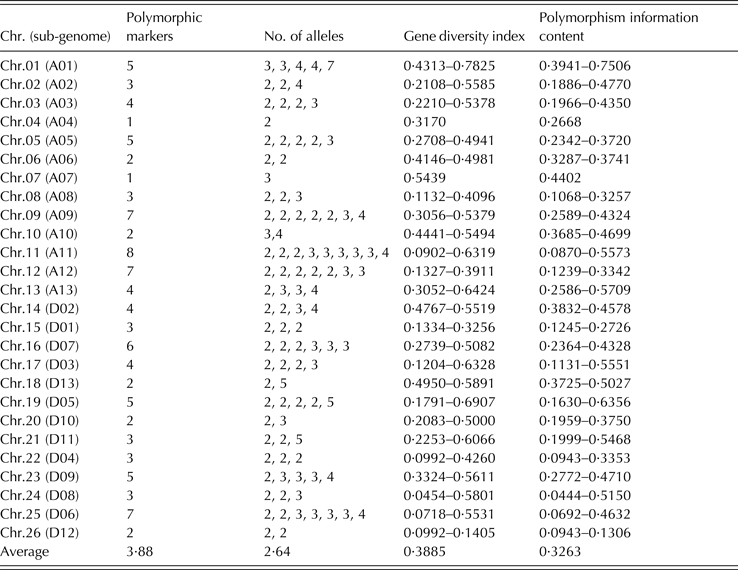
A total of 386 SSR markers were selected across 26 chromosomes to screen the polymorphisms of 172 G. hirsutum accessions. Of these markers, only 101 polymorphic marker loci were obtained, in which 52 loci were located in the A-genome and 49 loci in the D-genome (Table 4). There were one to eight polymorphic loci in each chromosome (sub-genome) with an average of 3·88. For 267 alleles from 101 polymorphic loci, the number of alleles for each locus was two to seven with an average of 2·64: 56 loci with two alleles, 31 loci with three, ten loci with four, three loci with five and one locus with seven. This indicated that these upland cotton varieties had few alleles and low genetic diversity. The gene diversity index of 101 loci was in the range of 0·0454–0·7825 with average of 0·3885 and the polymorphism information content was 0·0444–0·7506 with average of 0·3263, which illustrated that there was a large difference in distribution frequency in upland cotton accessions.
Polymorphic marker distribution and characteristics across 26 chromosomes among 172 G. hirsutum accessions
Population structure
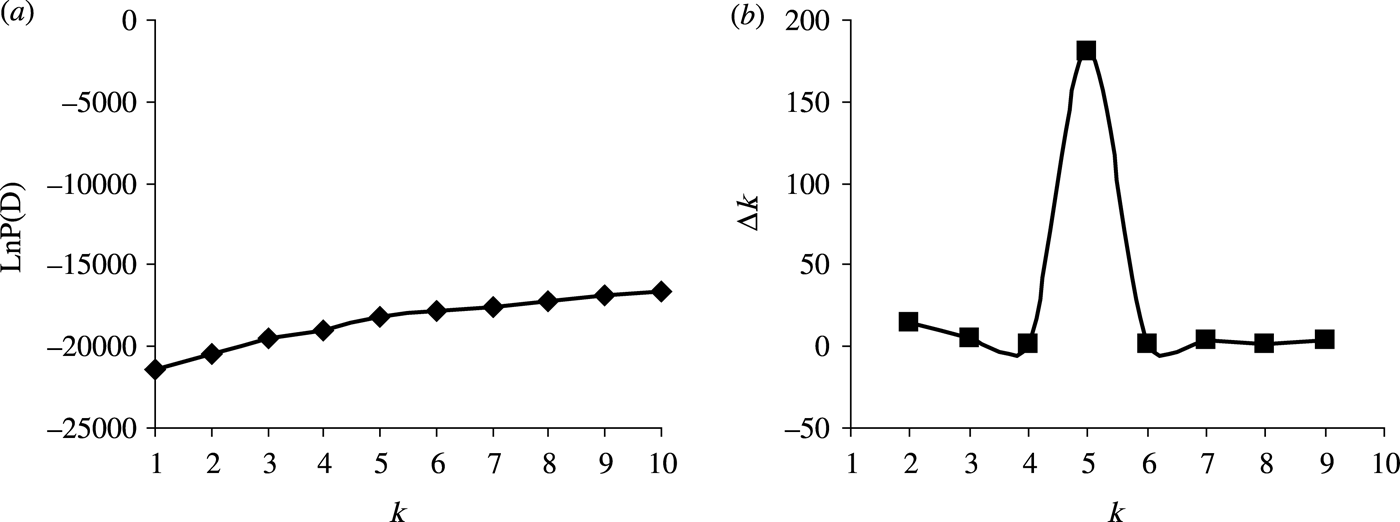
Population structure inference for the panel of 172 cotton accessions was performed using model-based software STRUCTURE 2.3 and 101 polymorphic marker loci. The structure was estimated by setting the number of clusters (k) at 1–10 with five replications for each k. The LnP(D) value increased continuously with k of 1–10 (Fig. 1(a)), and there was a sharp peak of Δk at k = 5 followed by a drastic decline of Δk for k > 5 (Fig. 1(b)). Accordingly, the total panel could be assigned into five clusters, designated Clusters 1–5, respectively (Fig. 2). Cluster 1 contained 29 accessions with 18 from Yellow River, one from Yangtze River, seven from Northwestern China and three from Northern China. Cluster 2 contained 29 accessions with four from Yellow River, 17 from Northwestern China, five from Northern China and three from abroad. Cluster 3 contained 75 accessions with 35 from Yellow River, 21 from Yangtze River, nine from Northwestern China, five from Northern China and five from abroad. Cluster 4 contained 26 accessions in which two from Yellow River, one from Yangtze River, 19 from Northwestern China, two from Northern China and two from abroad. Cluster 5 contained 13 accessions with six from Yellow River, two from Yangtze River, three from Northwestern China and two from Northern China. The corresponding Q-matrix at k = 5 was generated for further marker–trait association mapping.
Estimated LnP(D) and ∆k over five repeats of STRUCTURE analysis. (A) LnP(D) for k from 1 to 10 for 172 G. hirsutum accessions; (B) ∆k for k from 2 to 9 for 172 G. hirsutum accessions.
The summary plots of Q-matrix estimates for the 172 G. hirsutum accessions: Cluster 1 (red); cluster 2 (green); cluster 3 (blue); cluster 4 (yellow); cluster 5 (pink). Colour online.
Linkage disequilibrium and linkage disequilibrium decay
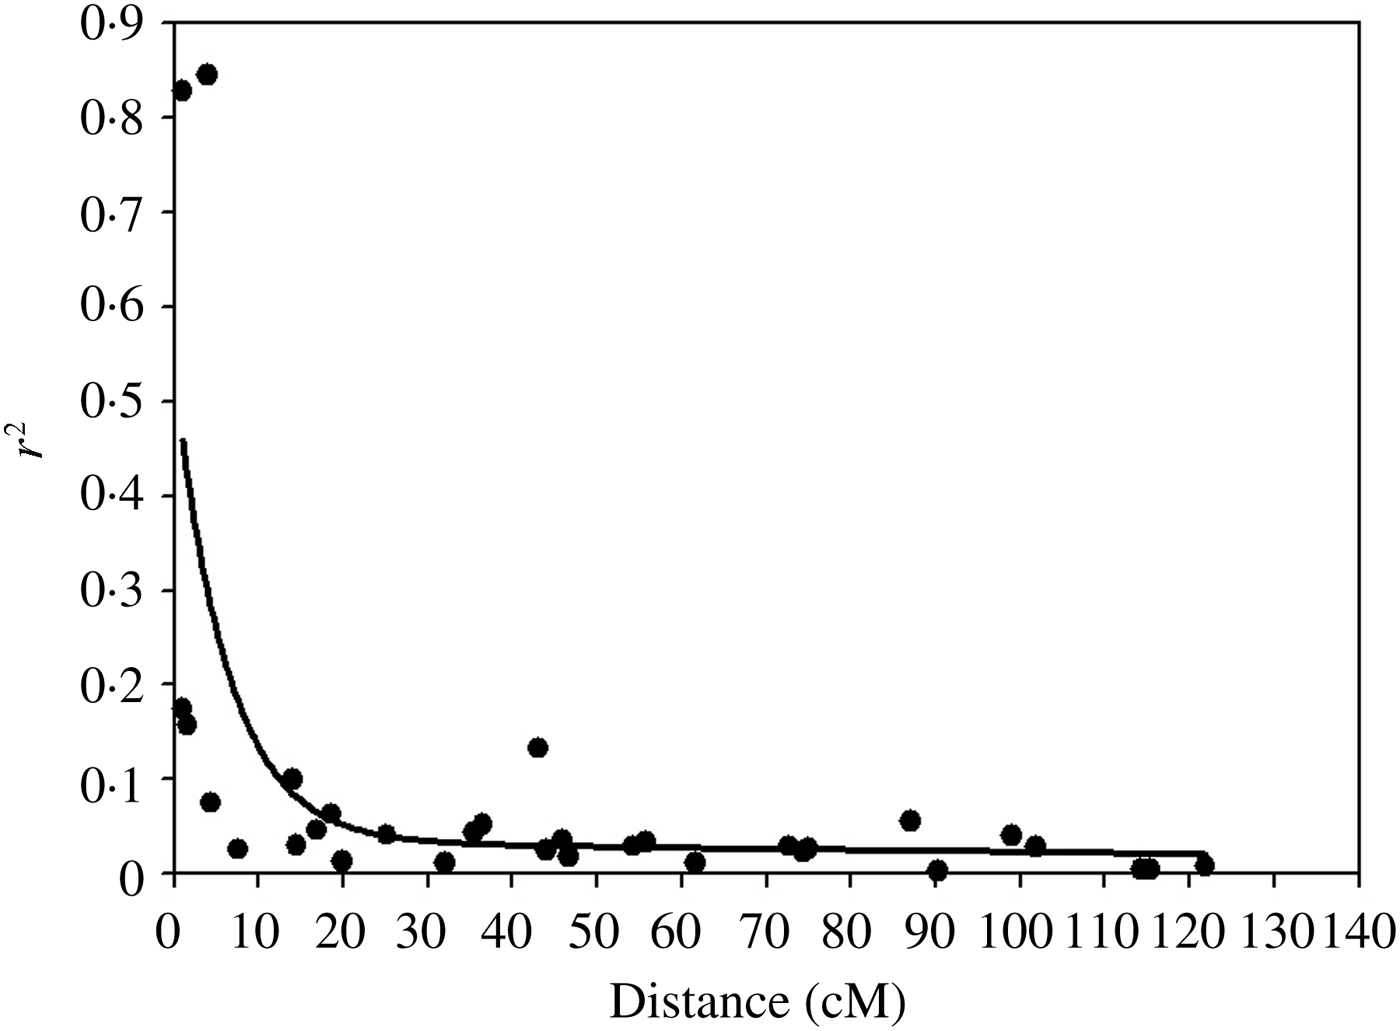
Linkage disequilibrium analysis was performed using the TASSEL 2.1 software package. The results showed that among the 5050 SSR locus combinations of 101 marker loci, there was a widespread LD regardless of whether combinations were co-linear (linked loci pairs) or not (unlinked loci pairs), accounting for 0·35 of the total number of combinations. However, significant support (P < 0·01) for the probability of disequilibrium paired-loci was not high, accounting for only 0·10 of the total number of combinations (data not shown). The LD decay rate was investigated using the r 2 values (P < 0·05) of the SSR loci on the same chromosomes. The intra-chromosomal LD decay occurred at a genetic distance of approximately 13–14 cM (r 2 = 0·1); if the threshold of LD decay was set to r 2 = 0·2, the genome-wide LD extended up to about 6–7 cM, revealing the potential for association mapping in G. hirsutum accessions (Fig. 3).
Linkage disequilibrium (LD) decay plot of 172 G. hirsutum accessions. Inner fitted trend line is a non-linear logarithmic regression curve of r 2v. genetic distance.
Association mapping for plant architecture traits
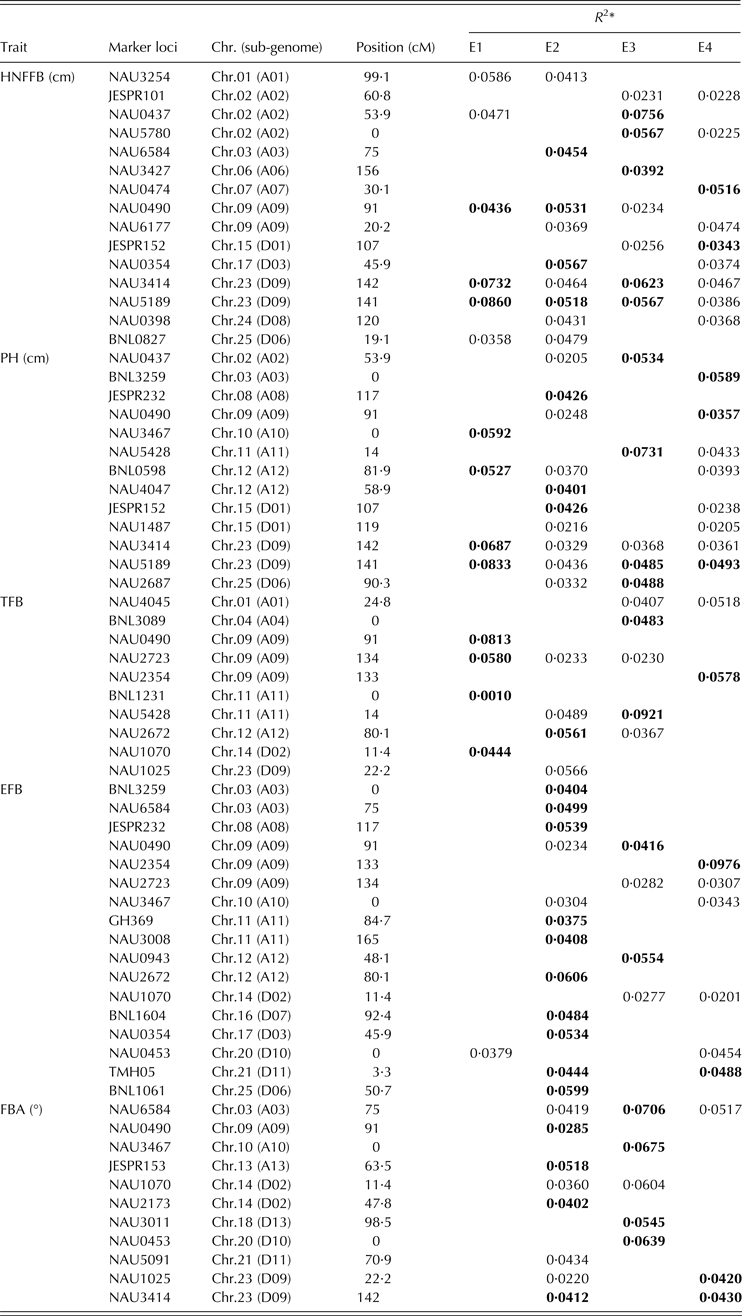
Considering both population structure (Q) and relative kinship (K), the association mapping with the MLM model was performed for the five plant architecture traits across four (three for fruit branch angle) environments. There were a total of 197 significant (P < 0·05) associations between 76 marker loci and five plant architecture traits. To reduce the danger of false positives, only associations that were highly significant (P < 0·01) in at least one environment and associations that were significant (P < 0·05) in at least two environments were counted – giving a total of 66 marker–plant architecture trait associations (Table 5). The number of markers associated with height of node of first fruiting branch, plant height, total fruit branches, effective fruit branches and fruit branch angle were 15, 13, 10, 17 and 11, respectively, and the corresponding ranges in phenotypic variation explained by markers were 0·0225–0·086, 0·0205–0·0833, 0·0010–0·0921, 0·0201–0·0976 and 0·0220–0·0706. Out of 66 associations, 35 were detected in more than one environment, with four associations being detected simultaneously in four environments, another four detected simultaneously in three environments and 27 detected simultaneously in two environments. There were 17 markers simultaneously associated with two or more traits. Thus, 12 loci were simultaneously associated with two traits, four loci were simultaneously associated with three traits, and one locus was simultaneously associated with five traits – which might be caused by tightly linked genes or/and pleiotropy.
Significant marker–plant architecture trait associations, explained phenotypic variation in G. hirsutum accessions
HNFFB, Height of node of first fruiting branch; PH, Plant height; TFB, Total fruit branches; EFB, Effective fruit branches; FBA, Fruit branch angle; E1, E2, E3 and E4 represent Shihezi in 2012, Xinxiang in 2012, Shihezi in 2013 and Xinxiang in 2013, respectively.
* Non-bold and bold data indicate significant at P < 0·05 and P < 0·01 levels, respectively.
Favourable allele exploration for plant architecture traits
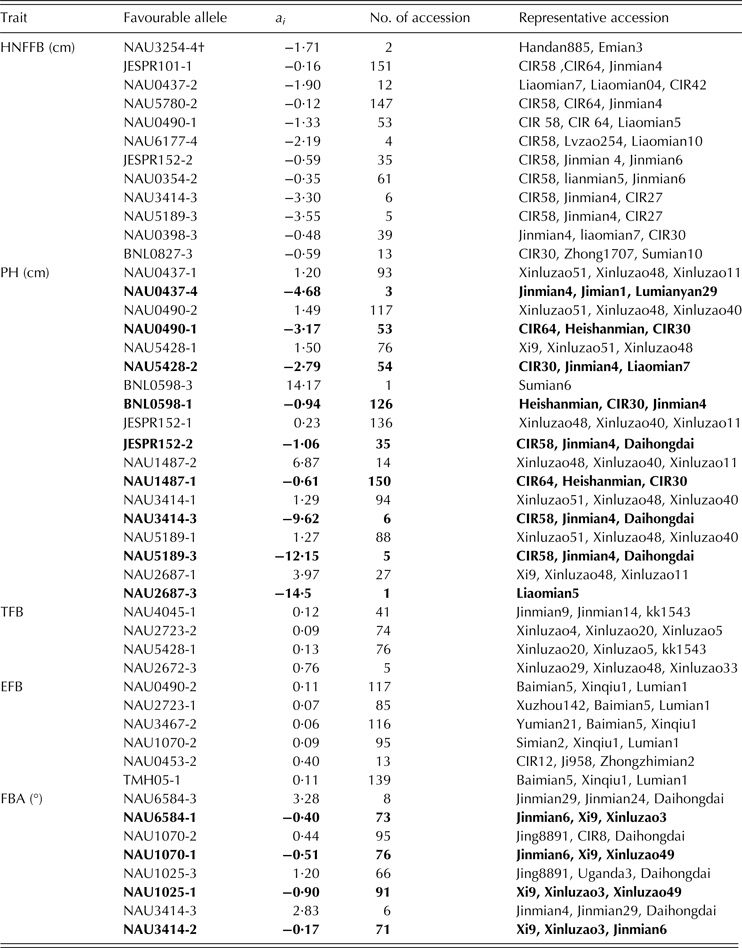
To further explore favourable alleles associated with QTLs for plant architecture traits, phenotypic effects (a i) and representative accessions of favourable alleles of loci for plant architecture traits, found to be significant in at least two environments, were analysed (Table 6). There were 12, 18, four, six and eight favourable alleles from 12, nine, four, six and four marker loci for height of node of first fruiting branch, plant height, total fruit branches, effective fruit branches and fruit branch angle identified, respectively. It is noteworthy that desirable cotton plant architecture, which differs from yield and fibre quality, can vary with environmental conditions and cultivation practice in different regions. For instance, the expanded cotton plant architecture with increased plant height, long fruit branches and moderate fruit branch angle is ideal in dry regions with adequate light, whereas compact architecture with lower plant height, short fruit branches and small fruit branch angle is ideal in rainy areas with low light levels. Therefore for plant height and fruit branch angle, the synergistic alleles and the negative alleles are both favourable alleles in cotton plant architecture breeding programmes according to specific breeding objectives. Among all favourable alleles, NAU5189-3 had the most negative phenotypic effect for height of node of first fruiting branch, and decreased height of node of first fruiting branch by 3·55 cm – the representative accessions for this allele were CIR58, Jinmian4 and CIR27. NAU2672-3 and NAU0453-2 had the most positive phenotypic effect for total fruit branches and effective fruit branches, and increased total fruit branches and effective fruit branches by 0·76 and 0·40, respectively – the representative accessions for these two alleles were Xinluzao29, Xinluzao48 and Xinluzao33, and CIR12, Ji958 and Zhongzhimian2, respectively. For plant height and fruit branch angle, however, BNL0598-3 and NAU6584-3 increased plant height and fruit branch angle by 14·17 and 3·28, respectively: corresponding representative accessions for these two alleles were Sumian6 for plant height and Jinmian29, Jinmian24 and Daihongdai for fruit branch angle. NAU2687-3 and NAU1025-1 decreased plant height and fruit branch angle by −14·5 and −0·90, respectively: corresponding representative accessions were Liaomian5 for plant height; and Xi9, Xinluzao3 and Xinluzao49 for fruit branch angle.
Favourable alleles, their phenotypic effects (a i) and representative accessions* for plant architecture traits
HNFFB, Height of node of first fruiting branch; PH, Plant height; TFB, Total fruit branches; EFB, Effective fruit branches; FBA, Fruit branch angle.
* Representative accessions are the top three entries (N.B.: the numbers of a few representative accessions are less than three) for the target trait value of accessions with the corresponding favourable allele.
† Non-bold and bold data indicate synergistic and negative favourable alleles which are available for PH and FBA, respectively.
DISCUSSION
Research and application of plant architecture has been reported frequently in rice, wheat, maize and other cereal crops (Perreira & Lee Reference Perreira and Lee1995; Zhuang et al. Reference Zhuang, Lin, Lu, Qian, Hittalmani, Huang and Zheng1997; Peng et al. Reference Peng, Richards, Hartley, Murphy, Devos, Flintham, Beales, Fish, Worland, Pelica, Sudhakar, Christou, Snape, Gale and Harberd1999; Kulwal et al. Reference Kulwal, Roy, Balyan and Gupta2003). Cotton plant architecture is related closely to yield and fibre quality (Wang et al. Reference Wang, Wu, Huang, Zhu, Guo and Zhang2006; Li et al. Reference Li, Wang, Dong, Fu, Zhang and Lian2010). Favourable plant architecture can improve crop light transmittance and photosynthetic efficiency, and increase harvest index. Research on plant architecture can provide new criteria for crop breeding and cotton breeders have paid increasing attention to plant architecture. However, because plant architecture traits are quantitative traits controlled by genotype and environment, complex multigenic relationships and substantial G × E interactions underlying plant architecture hinder efficient improvement of these traits in conventional breeding programmes. Many parameters, such as height of node of first fruiting branch, plant height, stem node length, stem internode length, total fruit branches, effective fruit branches, fruit branch length, fruit branch nodes and fruit branch angle, can be used to evaluate the efficiency of cotton plant architecture. Of these traits, height of node of first fruiting branch can indicate cotton earliness because early-maturing cotton varieties generally show low height of node of first fruiting branch (Yu Reference Yu2007). Plant height, associated with plant morphogenesis and lodging resistance, is an important agronomic trait that has been used in plant architecture breeding to achieve yield potential in crops (Liu et al. Reference Liu, Ai, Zhu, Liu, Guo and Zhang2014). Total fruit branches reflects the potential productivity of individual plants contributing to cotton yield, whereas effective fruit branches reflects the actual productivity of individual plants contributing to cotton yield. Fruit branch angle reflects the level of compactness of cotton plant architecture, and a certain angle is advantageous for ventilation and light penetration and increases photosynthetic efficiency. For these reasons, the present study used association mapping, a modern molecular biology method, to dissect the genetic basis of the five major plant architecture traits. The results will provide important information for cotton plant architecture breeding using molecular techniques.
A suitable association mapping panel should embrace as much phenotypic and genotypic diversity as can be reliably measured in common environments (Flint-Garcia et al. Reference Flint-Garcia, Thuillet, Yu, Pressoir, Romero, Mitchell, Doebley, Kresovich, Goodman and Buckler2005). It is especially critical to select samples that encompass genetic diversity as much as possible. In the present study, 172 representative G. hirsutum cultivars and breeding lines were selected for the association mapping panel. Although this sample was restricted to 172 G. hirsutum accessions, these accessions derived from multiple pedigrees including Deltapine, Stoneville, Foster and Uganda, and also have been or are cultivated in different ecological cotton-growing areas of China: Yellow River, Yangtze River, Northwestern China and Northern China. Because of the unique climatic conditions of these areas, plant architecture of local cotton varieties shows distinct characteristics. In brief, the frost-free period of Northwestern/Northern China is relatively short and plants are generally smaller with a compact plant type. However, the frost-free period of the Yellow/Yangtze River is relatively long and so cotton plants are generally larger and less compact. The phenotypic measurements in four (three for fruit branch angle) different environments indicated a high degree of diversity in plant architecture traits. However, the marker results showed that only 101 of the 386 SSR markers were polymorphic in all accessions, indicating that intra-specific genetic diversity was far less than inter-specific diversity in allotetraploid cotton, as shown in previous studies (Multani & Lyon Reference Multani and Lyon1995; Bowman Reference Bowman2000; Ulloa et al. Reference Ulloa, Meredith, Shappley and Kahler2002). More than 0·80 of the 101 polymorphic loci only generated two or three alleles, showing that genetic diversity in this panel was relatively low, which might have affected the detection power of association mapping for target traits.
Linkage disequilibrium is the basis of association mapping. In different maize population groups, 0·49–0·56 of the SSR pairs had significant LD (Stich et al. Reference Stich, Melchinger, Frisch, Maurer, Heckenberger and Reif2005, Reference Stich, Maurer, Melchinger, Frisch, Heckenberger, Rouppe Van Der Voort, Peleman, Sørensen and Reif2006). A high percentage of SSR pairs in LD was also reported for population groups of cultivated barley germplasm (45–100%) (Kraakman et al. Reference Kraakman, Niks, Van Den Berg, Stam and Van Eeuwijk2004; Malysheva-Otto et al. Reference Malysheva-Otto, Ganal and Roder2006) as well as for durum wheat elite germplasm (52–86%) (Maccaferri et al. Reference Maccaferri, Sanguineti, Noli and Tuberosa2005). The present study showed that significant support (P < 0·01) for LD of paired loci was not high, accounting for only 0·10 of the total number of combinations, which is comparable with reports in maize (10%) (Remington et al. Reference Remington, Thornsberry, Matsuoka, Wilson, Whitt, Doebley, Kresovich, Goodman and Buckler2001) and sorghum (8·7%) (Hamblin et al. Reference Hamblin, Mitchell, White, Gallego, Kukatla, Wing, Paterson and Kresovich2004). The low proportion of pairwise LD between SSR loci in cotton could also be associated with higher recombination rate observed in allopolyploid cotton (Brubaker et al. Reference Brubaker, Paterson and Wendel1999), as well as mutation and experimental hybridizations undertaken in the recent breeding history of upland cotton germplasm.
The extent of LD can provide information for the needed marker density and mapping resolution in an association mapping study (Gupta et al. Reference Gupta, Rustgi and Kulwal2005). In contrast to the human genome, where a very high density of molecular markers is needed for association mapping in most cases (Kruglyak Reference Kruglyak1999), the cotton genome may require significantly fewer markers for effective LD-mapping of complex traits, as also reported for other crops (Kraakman et al. Reference Kraakman, Niks, Van Den Berg, Stam and Van Eeuwijk2004; Barnaud et al. Reference Barnaud, Lacombe and Doligez2006). In the current association mapping panel, the threshold of LD decay was set to r 2 = 0·1 and r 2 = 0·2, and the genome-wide LD extended up to about 13–14 and 6–7 cM, respectively, which is similar to previous reports (Abdurakhmonov et al. Reference Abdurakhmonov, Saha, Jenkins, Buriev, Shermatov, Scheffler, Pepper, Yu, Kohel and Abdukarimov2009; Mei et al. Reference Mei, Zhu and Zhang2013). Based on the LD decay in the panel of 335 G. hirsutum varieties, it is suggested that about 1000 polymorphic markers are required for successful association mapping with LD extending to 5–6 cM (r 2 ≥ 0·2) (Abdurakhmonov et al. Reference Abdurakhmonov, Saha, Jenkins, Buriev, Shermatov, Scheffler, Pepper, Yu, Kohel and Abdukarimov2009). Therefore, with the next-generation sequencing technology and the development of cotton genomics research, utilizing databases (e.g. Cotton Marker Database, Expressed Sequence Tags database from GenBank and Unigene database) to develop new and stable molecular markers such as SSRs and single nucleotide polymorphisms (SNPs) will play an important role in promoting genome-wide association analysis in cotton.
The key constraints for the successful use of association mapping in plants are population structure and genetic relatedness, which can result in spurious marker–trait associations that may make it difficult to distinguish loci that truly affect the target traits (Gupta et al. Reference Gupta, Rustgi and Kulwal2005; Myles et al. Reference Myles, Peiffer, Brown, Ersoz, Zhang, Costich and Buckler2009). Several statistical strategies have been developed to account for issues related to population structure and relatedness (Yu et al. Reference Yu, Pressoir, Briggs, Vroh, Yamasaki, Doebley, McMullen, Gaut, Nielsen, Holland, Kresovich and Buckler2005, Reference Yu, Holland, McMullen and Buckler2008; Price et al. Reference Price, Patterson, Plenge, Weinblatt, Shadick and Reich2006). One powerful strategy is MLM, which accounts for multiple levels of relatedness simultaneously, and can improve control of both type I and II error rates (Yu et al. Reference Yu, Pressoir, Briggs, Vroh, Yamasaki, Doebley, McMullen, Gaut, Nielsen, Holland, Kresovich and Buckler2005). Neumann et al. (Reference Neumann, Kobiljski, Denčić, Varshney and Börner2011) performed genome-wide association mapping in bread wheat (Triticum aestivum L.) with two different approaches: GLM incorporating the population structure (Q) only and MLM including the kinship-matrix (K). The results showed that, using a mix of the kinship and the Q-matrix approach, many loci were detected that coincided with known major genes or QTLs. New loci should be definitively verified by the MLM approach instead of the Q-matrix in the GLM alone. In cotton, Abdurakhmonov et al. (Reference Abdurakhmonov, Saha, Jenkins, Buriev, Shermatov, Scheffler, Pepper, Yu, Kohel and Abdukarimov2009) performed an association mapping study of fibre quality traits with the MLM model using 202 microsatellite markers in a panel of 335 G. hirsutum varieties and showed that the MLM-derived significant associations were confirmed in GLM and structured association test, accounting for population structure and permutation-based multiple testing. Therefore, the association between markers and target traits performed with the MLM model in the present study will reduce the danger of false positives due to considering both population structure and genetic relationship. However, it has the risk of rejecting true positives and so may miss some important QTLs with the complex of models (Zhao et al. Reference Zhao, Aranzana, Kim, Lister, Shindo, Tang, Toomajian, Zheng, Dean, Marjoram and Nordborg2007). More in-depth comparisons should be made of different models in association mapping scans.
The acquirement of stable QTLs is the basis of MAS. In cotton, using conventional linkage mapping, several common QTLs for fibre quality traits were detected simultaneously in diverse populations, generations and environments (Shen et al. Reference Shen, Guo, Zhu, Yuan, Yu, Kohel and Zhang2005; Sun et al. Reference Sun, Zhang, Wang, Gong, Shi, Liu, Li, Gong, Shang and Yuan2012). These common QTLs have high reliability and can potentially be used in MAS to improve cotton fibre quality. Subsequently, Cai et al. (Reference Cai, Ye, Zhang and Guo2014) performed an association mapping of fibre quality traits in 99 G. hirsutum accessions and showed that 36 significant marker–trait associations coincided with previously reported QTLs detected based on family-based QTL mapping, and four marker–trait associations corresponded to previously reported association mapping results. These QTLs, detected in different populations with different genetic backgrounds, were also stably inherited and can be used in MAS for fibre quality improvement. Because of their importance in breeding programmes, cotton plant architecture traits have been assessed using conventional linkage mapping (Wang et al. Reference Wang, Wu, Huang, Zhu, Guo and Zhang2006; Song & Zhang Reference Song and Zhang2009; Li et al. Reference Li, Song, Zhao, Xia, Jia, Wang, Dong and Wang2014). Li et al. (Reference Li, Song, Zhao, Xia, Jia, Wang, Dong and Wang2014) identified four common QTLs for plant architecture traits, including total fruit nodes, fruit branch nodes, fruit branch length and fruit branches, across two upland cotton populations and suggested these QTLs could be used for MAS to facilitate cotton plant architecture. In the present study, a total of 66 marker–trait associations for plant architecture traits were detected using association mapping. Of 66 associations, 35 were detected in more than one environment – of these, four associations were detected simultaneously in four environments, four associations were detected simultaneously in three environments, and 27 associations simultaneously in two environments. The markers related to these associations had high stability and so could be used in MAS of target traits. Unfortunately, however, because there has been little research on QTLs for cotton plant architecture traits, and the markers used in different laboratories differ, QTL mapping results are not easy to accurately compare between the present study and previous studies. With increasing amounts of research, the QTLs together with trait-associated markers obtained in the current work will be further verified.
Identifying the marker loci associated with traits is just the beginning of association mapping. Confirming the differences in allelic variation based on the marker–trait association and exploring and utilizing the favourable alleles for MAS is the ultimate goal. For example, Guo et al. (Reference Guo, Zhang, Ding, Zhu, Shen and Zhu2005) applied the favourable allele from the marker, BNL1521, linked to a major QTL for fibre strength in MAS, and found a highly significant difference in mean fibre strength in plants with or without the favourable allele. Li et al. (Reference Li, Liu, Zhao, Wang, Zhang, Liu, Zhou, Yang, Li and Wang2013) obtained three individuals with Verticillium wilt resistance using selection of resistant genotypes (favourable alleles) of five markers: BNL3031, BNL3241, NAU1230, JESPR153 and NAU1225. In the present study, comparing the average phenotypic value of each allele for target traits in the 35 stable detected associations, provided 12, 18, four, six and eight favourable alleles from 35 marker loci for height of node of first fruiting branch, plant height, total fruit branches, effective fruit branches and fruit branch angle, respectively. The 48 favourable alleles can be used in MAS of cotton plant architecture traits. It should be noted that some favourable rare alleles with a frequency of less than 0·05 were present in the tested G. hirsutum collections. The use of stringent probability thresholds will reduce the danger of false positives, but meanwhile has the risk of rejecting true positives caused by setting the thresholds too high (Yan et al. Reference Yan, Warburton and Crouch2011). Because the present study aimed at mining favourable alleles for plant architecture traits, these favourable rare alleles might be important true alleles in plant architecture breeding programmes, which needed to be verified in the future. Similar studies have been reported in some previous studies (Mei et al. Reference Mei, Zhu and Zhang2013; Cai et al. Reference Cai, Ye, Zhang and Guo2014). In addition, most of the detected associations in the present study were of very small effect, so these favourable alleles should be further confirmed by transferring into near-isogenic lines (NILs) to measure their positive effects. Since most upland cotton cultivars developed in China were derived from limited founder parents (such as DPL15, DPL16, STV2B and Uganda3), there is great challenge in genetic improvement and a high risk of vulnerability to changing climate (Mei et al. Reference Mei, Zhu and Zhang2013). New variations that have emerged and accumulated during the long breeding history should be fully exploited and additional diversity should be introduced into breeding programmes to broaden the genetic basis of upland cotton. Therefore, the cultivars that possess the most favourable alleles should be explored to construct a multi-parent population, and simultaneously, a ranking system for MAS or genomic selection should be developed based on the results of association mapping.
It is noteworthy that desirable cotton plant architecture can vary with environmental conditions and cultivation practices in different regions. Therefore, both the synergistic alleles and the negative alleles for some traits, especially plant height and fruit branch angle, can be utilized in cotton plant architecture breeding programmes according to specific breeding objectives. In addition, some markers are simultaneously associated with more than one plant architecture trait, which might be caused by tightly linked genes or/and pleiotropy, and partly explains strong genetic correlations among them. These co-associated genetic loci could simultaneously improve multiple target traits in cotton plant architecture breeding programmes via MAS.
The current work was supported by grants from National Natural Science Foundation (grant no. 31371677), High-tech Programme 863 (grant no. 2012AA101108), Open Cooperation Project of Science and Technology of Henan Province (grant no. 142106000041), Key Research Project of Science and Technology of Henan Province (grant no. 14A210006) and Ph.D. Special Fund Project of Xinjiang Production and Construction Corps (grant no. 2012BB003).