“We're saying place children first and prisons last.”
— NY Assemblyman Roger L. Green, December 6, 1993 Footnote 1
In 1993, a group of Black state legislators in NY had a closed-door meeting with then-Governor Mario Cuomo to encourage him to avoid spending money on prison construction. Green, a Democrat from Brooklyn, and his counterparts implored the governor to spend more money on social programs such as youth counseling and job programs rather than correctional facilities. This perspective, one of emphasizing social welfare and actively lobbying against increasing funding to prisons, is a common one among Black state legislators in the last few decades as the criminal justice system has rapidly grown.
In the last three decades, states increased their expenditures on criminal corrections from $15 billion to over $53 billion (Kyckelhahn Reference Kyckelhahn2014). In tandem with the rise in corrections budgets, the state prison population swelled from just over 300,000 in 1980 to over 1.9 million by 2015 (Kaeble and Glaze Reference Kaeble and Glaze2016; Kalish Reference Kalish1981). Not only are there more people physically incarcerated than ever before, but more individuals, and most of those under correctional control, are under community supervision: in 2015, more than 4.5 million Americans under state jurisdiction were on probation or parole, up from 1.3 million in 1980 (Kaeble and Glaze Reference Kaeble and Glaze2016; Maxwell Reference Maxwell1982).
Because of the stunning increase in the number of people incarcerated in the last three decades, and because the incarceration rate in the United States is 5–10 times higher than the rates in Western Europe and other democracies (Travis, Western, and Redburn Reference Travis, Western and Redburn2014), most scholars focus on the physical institutions of the carceral state, prisons and jails. The carceral state encompasses a much more diverse set of institutions, though, including programs such as parole and probation. The massive scope of these programs, with 1 in 31 Americans now under some form of correctional control (Pew Center on the States 2009), is partially due to rapid growth in state spending on these activities. Corrections is now the fifth-largest category of state spending after Medicaid, elementary and higher education, and transportation (Kyckelhahn Reference Kyckelhahn2014), highlighting how states prioritized criminal policymaking in the last three decades.
This study considers the determinants of corrections spending and tests a new hypothesis to explain changes in these expenditures over time: Black political incorporation. Researchers have given a great deal of focus to racist attitudes, but I argue this phenomenon is less relevant as time has passed in the post-Civil Rights and Voting Rights Act era (though, these attitudes are certainly still part of criminal justice policymaking). Unlike voters in the 1940s and 1950s (Key Reference Key1949), the gains of the Civil Rights Movement empowered Black communities to mobilize politically and elect more Black representatives in state legislatures. Whereas once racial threat determined the construction of corrections policy, the growing incorporation of Black political elites and Black communities more generally allows Black representatives to further policies advantageous to them or “block” policies that are not (Filindra and Pearson-Merkowitz Reference Filindra and Pearson-Merkowitz2013).
Though Black representatives are leaders on many issues, in particular those that have racial implications (Bratton and Haynie Reference Bratton and Haynie1999; Haynie Reference Haynie2001), this study considers one particular area: corrections. The criminal justice system disproportionately affects the Black community, and accordingly, African Americans appear less punitive than Whites in public opinion surveys, favoring social policy solutions to crime rather than prison time for offenders and disapproving of the death penalty at a much higher rate (Ghandnoosh Reference Ghandnoosh2014; Gramlich Reference Gramlich2018; Unnever and Cullen Reference Unnever and Cullen2007). I thus expect Black representatives to legislate on this policy, and that these representatives will decrease corrections spending in an effort to reduce the harm prisons and other coercive institutions inflict on their communities (Yates and Fording Reference Yates and Fording2005). This perspective highlights the positive effect of racial diversity in state legislatures and suggests Black legislators make a difference in one area of concern to their constituents, corrections. This paper adds to our understanding of descriptive representation in two ways: first, by emphasizing a key role of representatives in policymaking—the budgetmaking process. It is not only through passing and sponsoring bills that representatives affect policy, it is also through the funding of policy priorities. Second, this study broadens the scope of policy areas of interest to both Black representatives and constituents, to widen the idea of “Black interests” to encompass prison policy and corrections more generally.
This study moves this literature forward by arguing the relationship between both Black political representation and the Black electorate and corrections spending is negative because of growing Black political and social incorporation into positions of political and social power. Generally drawing from the social control hypothesis, previous studies found either a positive or inconsistent relationship between growing racial diversity and outcomes such as corrections spending, incarceration, or punitiveness more broadly (e.g., Breunig and Ernst Reference Breunig and Ernst2011; Greenberg and West Reference Greenberg and West2001; Jacobs and Carmichael Reference Jacobs and Carmichael2001; Neill, Yusuf, and Morris Reference Neill, Yusuf and Morris2014; Smith Reference Smith2004; Stucky, Heimer, and Lang Reference Stucky, Heimer and Lang2007), though those studies considered a limited time period, most often the 1980s through the 1990s. Because I argue the explanatory power of the social control hypothesis has decreased over time, such a limited time period significantly changes our interpretation of the relationship between race and punitive policy outcomes. This study improves on the ones before it by amassing a longer dataset of state corrections spending from 1983 to 2011, allowing for an assessment of the effect of racial diversity on punitive outcomes obscured by more truncated studies. It is important to note that although political incorporation is a countervailing effect to the expansion of the carceral state, punitive policies passed in previous eras ensure that the hyperincarceration of Black Americans persists in the present era. Second, I subset corrections expenditures to its two components: institutional and community corrections. The first component broadly reflects spending on prisons and jails, whereas the second covers allocations to reentry programs such as parole and probation. By extending the time period, emphasizing the growing role of Black representatives in state policy, and considering multiple kinds of corrections spending, this study adds nuance to our understanding of how and why racial dynamics matter in the construction of state policy.
This paper proceeds as follows: first, I outline my argument on Black political and social incorporation. I then introduce my expenditures dataset, describe my empirical approach and data sources, before estimating these relationships quantitatively. I find support for the counterbalancing hypothesis, that states with a higher percentage of Black state representatives have lower per capita spending on total and institutional corrections by .36 and .33 dollars, respectively. In contrast, neither the size of the Black electorate nor other state policy variables such as partisanship or crime appear to play a role in the growth of corrections expenditures. This suggests first, the importance of descriptive representation, a finding similar to that in Eckhouse (Reference Eckhouse2019a), that increasing racial diversity on city councils lessens racial disparities in arrest rates. Second, punitive policies driven by feelings of racial animus are somewhat attenuated in the modern era via political incorporation. Importantly, these results refine our current theories of the growth and adoption of punitive policies and budgets at the state level. The incorporation of Black Americans into state legislatures is significant in shaping the character and scope of state corrections systems—and theories such as racial threat or social control fail to account for this growing political and social power. I conclude with some thoughts about the consequences of these results for the study of the carceral state more broadly, and the importance of descriptive representation at the state level in reducing states' reliance on punitive measures.
Representation, Incorporation, and Corrections Spending
I argue the growing empowerment of the Black public and elites specifically prompts changes in state crime policy and that growing political and social incorporation are significant drivers of corrections spending. Previous studies of the impact of race on punitive outcomes have considered a variety of such policies: incarceration rates, felon disenfranchisement laws, prisoner mental health access, among others (e.g., Behrens, Uggen, and Manza Reference Behrens, Uggen and Manza2003; Jacobs and Carmichael Reference Jacobs and Carmichael2001; Jacobs and Helms Reference Jacobs and Helms1999; Percival Reference Percival2009). Though these scholars have studied a variety of related crime and punishment policies, they largely all seek to understand the depth of state punitiveness. Punitiveness is a broad concept, comprising multiple dimensions, from the imposition of punishment via incarceration or poor conditions of confinement and increasing arrests of certain crimes (Neill, Yusuf, and Morris Reference Neill, Yusuf and Morris2014). Corrections spending is a particularly valuable area to study punitiveness, as all these dimensions require funding from the government. The amount allocated to corrections spending represents the priorities of states regarding criminalization, sentencing, and crime. Previous studies contribute much to our understanding of these policies, but they do not capture punitiveness in a broad sense, as I do here by turning the focus to state spending.
Though I argue it is growing racial diversity of the polis and elites that drive changes in corrections spending, I am certainly not the first to consider why spending in this area has changed over time (e.g., Breunig and Ernst Reference Breunig and Ernst2011; Stucky, Heimer, and Lang Reference Stucky, Heimer and Lang2007). Previous studies primarily focus on partisanship, finding corrections spending increases at the state level under Republican governors and Republican-controlled legislatures and at the national level, under Republican presidents (Caldeira and Cowart Reference Caldeira and Cowart1980; Jacobs and Helms Reference Jacobs and Helms1999; Stucky, Heimer, and Lang Reference Stucky, Heimer and Lang2007). However, analyses studying the effect of Republican politicians on other outcomes such as incarceration (e.g., Jacobs and Carmichael Reference Jacobs and Carmichael2001; Smith Reference Smith2004), three-strikes laws (e.g., Karch and Cravens Reference Karch and Cravens2014), bans on felons' access to food stamps (e.g., Owens and Smith Reference Owens and Smith2012), among others, find mixed results regarding the effect of partisanship on these policies. I argue these mixed results are at least partially attributable to the import of descriptive representation on punitive policies. For one, both Democrats and Republicans alike supported the construction of the carceral state (Hinton Reference Hinton2016; Murakawa Reference Murakawa2014), so it is unlikely conservative ideology is the sole driving force behind them. Moreover, more punitive constituencies do not necessarily reflect the interests of Black Americans more broadly, making descriptive representation an essential link for ensuring the representation of that group in issues related to criminal justice (Eckhouse Reference Eckhouse2019b). This by no means suggests partisanship is irrelevant, but rather that the impact of legislators' race on public policy will be stronger than that of ideology.
Descriptive Representation and Political Incorporation
Increasing racial diversity in state legislatures has brought scholarly attention to how minority representatives legislate. The concepts of descriptive and substantive representation suggest that as more members of the legislature look like a minority group (i.e., increasing descriptive representation), those members will legislate closely to the policy positions of that group (i.e., increasing substantive representation; Pitkin Reference Pitkin1967). This represents political incorporation, or “the extent to which self-identified group interests are articulated, represented, and met in public policy making” (quoted in Fraga et al. Reference Fraga, Martinez-Ebers, Ramirez and Lopez2003). This study, similar to others before it, focuses specifically on Black state legislators and the Black electorate rather than Latinx state legislators and the Latinx electorate, as Blacks are often the particular target of punitive policies. Moreover, previous studies found little evidence of the linkage between Latinx state population and punitive outcomes (though this is a promising avenue for research; Greenberg and West Reference Greenberg and West2001; Jacobs and Carmichael Reference Jacobs and Carmichael2001). I argue a vital policy to the Black community, and one that Black representatives will prioritize, is criminal justice. I rely on studies that suggest Black representatives faithfully represent Black constituents and introduce and pass more bills in line with their interests (e.g., Bratton and Haynie Reference Bratton and Haynie1999; Preuhs Reference Preuhs2006; Whitby Reference Whitby2000). In a similar vein, Black representatives appear to be more responsive to Black constituents' requests, a point I return to below (Butler and Broockman Reference Butler and Broockman2011).
Extant studies that consider the effect of descriptive representation on punitive policy outcomes are mostly conducted at the local, municipal level. Black mayors and Black city councilors, for example, are associated with lower racial disparities in arrest rates; reductions in cities' reliance on punitive court fees and fines; lower violent crime arrests for African Americans; increases in citizen placement in vocational education; and establishment of civilian police review boards, to offer a few examples (Browning, Marshall, and Tabb Reference Browning, Marshall and Tabb1984; Davis, Livermore, and Lim Reference Davis, Livermore and Lim2011; Eckhouse Reference Eckhouse2019a; Sances and You Reference Sances and You2017; Stucky Reference Stucky2012). This reflects the dynamic described above, whereby Black representatives are responsive to Black constituents' interests (e.g., Butler and Broockman Reference Butler and Broockman2011), specifically regarding criminal justice. The local context is particularly useful to study the effect of race on policy outcomes, as mayors and city councilors exert direct control over municipal policies on policing, local courts, and the like.
At the state level, there are fewer studies on the effect of descriptive representation on criminal justice outcomes, but the ones that do exist suggest Black state legislators are able to shift real policy outcomes of import to Black constituents. Yates and Fording (Reference Yates and Fording2005) find, for example, Black elected officials are negatively related to the imprisonment rate of African Americans, though they do not affect the racial gap in sentencing. Percival (Reference Percival2016) finds that increasing descriptive representation makes it more likely that states will adopt rehabilitative services for former prisoners, similar to another study that found Black legislators decreased the number of collateral consequences for former prisoners (Ewald Reference Ewald2012). And, most related to the paper here, Clegg and Usmani (Reference Clegg and Usmani2017) find that increasing Black political representation results in declines in state spending on corrections, though there is an opposite effect when considering incarceration rates. In general, representatives can also engage in “blocking,” using their negative agenda setting power to prevent undesirable measures from passing (Filindra and Pearson-Merkowitz Reference Filindra and Pearson-Merkowitz2013).
Scholars studying representation have considered the effect of racial diversity on different outcomes, from introducing, sponsoring, or voting for bills favorable to Black interests, but research on the effect of individual legislators on policy outcomes has been mixed. This could be attributable to the variation in Black legislative power, dependent on institutional context, outside electoral mobilization on behalf of Black interests, or even the level of government considered (Browning, Marshall, and Tabb Reference Browning, Marshall and Tabb1984; Haynie Reference Haynie2001; Miller Reference Miller2008; Preuhs Reference Preuhs2006), but the overriding perspective in this literature is Black legislators legislate differently than their non-Black counterparts. Theories suggest Black representatives legislate according to the broader interests of their group, at least when it comes to “Black interests,” a characterization that typically assigns any policy with racial implications as falling into this category (Bratton and Haynie Reference Bratton and Haynie1999; Haynie Reference Haynie2001). Other studies have extended the idea of Black interests to policies with wide-ranging impact on Black people, such as welfare assistance for the poor, social services, and crime prevention (Browning, Marshall, and Tabb Reference Browning, Marshall and Tabb1984; Clark Reference Clark2019; Marschall and Ruhil Reference Marschall and Ruhil2007; Owens Reference Owens2005; Owens and Smith Reference Owens and Smith2012; Preuhs Reference Preuhs2006), but fewer have considered how Black legislators impact an area with serious implications for Black constituents, corrections policy.
Punitive Policies Matter to Black Constituents
The assumption underlying my argument thus far has been Black legislators legislate on behalf of the interests of Black constituents, specifically regarding criminal justice. However, that assumption relies on the idea that Black constituents hold coherent and relatively less punitive attitudes than their White counterparts. Extant research supports this assumption: not only are there policy differences between Blacks and Whites, with Blacks less punitive than Whites and a vast divide in the approval of policies such as the death penalty (Bobo and Johnson Reference Bobo and Johnson2004; Unnever and Cullen Reference Unnever and Cullen2007), but Blacks are also more likely than other racial groups to view police practices such as use of force as a problem (Sunshine and Tyler Reference Sunshine and Tyler2003). Another survey found White respondents to be more punitive than Black respondents, but that the punitiveness of Black respondents grew over time as fear of crime rose (Clegg and Usmani Reference Clegg and Usmani2017). By arguing Black constituents care about criminal justice issues, I am by no means suggesting that they cannot hold punitive views as well, but that they are relatively less likely to do so than White constituents, thus transmitting a less punitive signal to their Black (and non-Black) representatives.
The lower level of punitiveness in Black public opinion is likely at least partially attributable to the disproportionate impact the criminal justice system has on Black Americans Whereas African Americans represent 12% of the American population, they made up a full third of the prison population in 2016 (Gramlich Reference Gramlich2018). Punitive laws passed at the state, local, and national levels beginning in the 1970s and 1980s introduced mandatory minimum sentencing and harsh prison terms for a variety of crimes, particularly drug-related offenses, that swept thousands of people of color into prison (Alexander Reference Alexander2010).
This disproportionate representation in the criminal justice system has not escaped the attention of Black legislators, who recognize the preferences of their communities as primary reasons to pursue criminal justice policies: the Tennessee Senate Minority Leader Lee Harris remarked in 2016, “We have too many Tennesseans wasting away in jail for non-violent, minor crimes that involve either drugs of simply an inability to pay fines. By and large, these crimes disproportionately affect Black Tennesseans. It is an injustice when lives are irreversibly ruined by crimes of substance abuse and crimes of poverty” (emphasis added). Similarly, Nick Perry, the chair of the Black, Puerto Rican, Hispanic and Asian Legislative Caucus in the New York State Assembly, said this in 2018: “For too long, our criminal justice system has disproportionately burdened the poor and communities of color. We can no longer ignore the impact that an unfair criminal justice system has on our communities” (emphasis added). Emphasizing the real impact of these policies on communities of color, Washington Representative Eric PettigrewFootnote 2 said in 2019, “Since joining the legislature, I have advocated for reforms to our criminal justice system … When these systems are broken, Black people and Black communities disproportionately feel the impacts. I am excited to work with the growing number of Black legislators to remain centered on ensuring that legislative fixes are actually serving our communities” (emphasis added). These modern examples echo perspectives put forth by Black representatives since at least the 1970s, as Black state legislators rallied against the death penalty in the 1970s in NJ; pushed for prison reform at least two meetings of the Black State Legislators Association in LA and IL in the 1970s; and rallied against the construction of new prisons and more funding for prisons in NY in the 1980s.Footnote 3 Not only is the Black public concerned about the criminal justice system and its disproportionate effect on African Americans, but Black legislators themselves recognize interest among their constituents and legislate directly on behalf of those interests.
Descriptive representation is therefore a potentially powerful force for altering the nature and character of state corrections systems, as Black representatives legislate for Black interests. This argument departs from the work in this subfield, however, that relies either on partisan politics or social control explanations to explain punitive policies. Although partisanship is certainly a contributor to criminal justice policy, solely examining the political makeup of the government obscures important racial considerations in corrections policy. The social control hypothesis, on the other hand, emphasizes race as an important contributor to the adoption of punitive policies, but argues politicians use these policies to control minority populations (Garland Reference Garland2002; Key Reference Key1949; Wacquant Reference Wacquant2009). I argue this focus is too myopic, as it neglects the importance of political gains made by Black legislators after the Civil Rights Movement. Moreover, the growing population of Black Americans shifts the importance of racial threat, making it less tenable as an explanation in an increasingly racially diverse electorate (Blalock Reference Blalock1967). In particular, these perspectives suggest Whites use their political power to punish minorities and ensnare them in the carceral state (Key Reference Key1949), with the assumption that these minorities are powerless to stop the adoption of these policies. However, with the adoption of the Voting Rights Act in 1965 and the development of majority–minority districts, the number of Black state legislators has grown rapidly, from 172 in 1969 to 628 in 2009 (National Conference on State Legislators 2009; Preuhs Reference Preuhs2006). Between 1971 and 2009, the percentage of Blacks in state legislatures more than quadrupled, from 2 to 9%, though that number has only increased by a single percentage point since 1999 (Wiltz Reference Wiltz2015). Nevertheless, the growing institutional and representational power of African-American representatives (e.g., Preuhs Reference Preuhs2006) has significantly altered state legislatures nationwide. I argue the political incorporation of Blacks is an important counterbalancing effect to social control and places Black agency and empowerment squarely at the center of state corrections policy.
Examining State Budgets
Though most studies analyzing the effect of race on policy outcomes look at individual legislator behavior such as roll-call votes, sponsorship, or passage of bills because they are readily observable (e.g., Bratton and Haynie Reference Bratton and Haynie1999; Haynie Reference Haynie2001), I argue the effect of these legislators on overall agency budgets is especially important. Sponsoring or introducing a bill in the state legislature, for example, is virtually meaningless without the eventual deployment of state funds for those initiatives. Spending on corrections, then, is a direct reflection of a state's commitment to funding state punitiveness (Neill, Yusuf, and Morris Reference Neill, Yusuf and Morris2014), via the deployment of funds to incarcerate and surveil. Moreover, examining an alternative policy outcome like incarceration rates likely would not provide a complete picture of the effect of Black representation on imprisonment, as that number changes relatively slowly over time and is heavily influenced by decisions made by policymakers 10, 15, or 20 years prior (Spelman Reference Spelman2009). Spending, then, represents a variable that is more readily and immediately influenced by legislators.
Legislators play an important role in the bargaining process to create a state budget. Budgets are not determined in a vacuum: they represent the outcome of a complex bargaining process by which both the governor and the state legislature must approve funding for individual state agencies. The bulk of scholarly study on the state budget process typically cites the perceived power the legislature holds over the executive in the budgeting process, assuming governors are fairly weak (Kousser and Phillips Reference Kousser and Phillips2009). In the face of balanced budget requirements for example, Alt and Lowry (Reference Alt and Lowry2000) find governors must make significant concessions to the legislature to pass a budget. Thus, this model of legislative-executive bargaining places most of the budgeting power in the hands of the legislature. This power differential implies the legislature as a whole, and individual legislators, are able to exert power over the level of appropriations levied to agencies—though this power can depend on whether the government is unified and the incentive for state legislators to bring specific projects to their districts to benefit their constituents (Alt and Lowry Reference Alt and Lowry2000; Barrilleaux and Berkman Reference Barrilleaux and Berkman2003).
I expect Black legislatorsFootnote 4 to exert a negative influence on the level of state corrections spending, as more appropriations to that policy would negatively affect Black constituents. However, there is important variation among these legislators. For one, Black legislators tend to represent the privileged members of that community, and less so the problems of the marginalized within that community, like AIDS prevention or poverty among Black women (Cohen Reference Cohen1999). These significant differences account at least partially for some Black elites pushing for more incarceration and tougher sentences, chronicled qualitatively by Fortner (Reference Fortner2015) and Forman (Reference Forman2017). Though these claims give us pause at assuming all Black legislators hold the same preferences about criminal justice, I expect a negative relationship between spending and descriptive representation for several reasons. First, the cases detailed by scholars such as Fortner (Reference Fortner2015) and Forman (Reference Forman2017) are largely in the 1970s, punitive policy responses to growing levels of crime in that decade. The time period considered in this study begins in the early- to mid-1980s, as crime rates began to wane and Black legislators who may have been once punitive started to become less so (more detail on this below; Fortner Reference Fortner2015). Second, these case studies are of Washington, D.C., and NY, and may not be representative of Black state legislative behavior across all states. We may expect Black state legislators in the South, for example, to experience and prioritize different initiatives than their counterparts in places such as D.C. and NY. Therefore, though this study argues the overall influence of Black state legislators on corrections budgets will be negative, I am by no means suggesting Black state legislators hold the same, consistent views on criminal justice.
The negative influence, I argue, is at least partially driven by partisanship: Black representatives are overwhelmingly Democratic, all but six of nearly 600 Black state legislators in 2001 were Democratic (King-Meadows and Schaller Reference King-Meadows and Schaller2007). Following the logic of the partisan politics theory described above, Democrats are relatively less supportive of funding to carceral institutions overall (Stucky, Heimer, and Lang Reference Stucky, Heimer and Lang2007) and as a result, Black state representatives (who are overwhelmingly Democratic) will be similarly hesitant to support carceral funding. I expect Black legislators to decrease spending on both total and institutional corrections because prisons disproportionately affect the Black community. Furthermore, I expect these representatives will favor community corrections spending to fund diversionary and reentry programs over institutional corrections. That is, “[prison] populations only increase when the beds and the money are available” (Spelman Reference Spelman2009, 55). By decreasing corrections spending, Black legislators are limiting the amount of money that can be used to further expand the carceral system, build more prisons, and increase the incarceration rate. Indeed, as more money is allocated to corrections, more prisons can be built, the incarceration rate can increase, and worse conditions for inmates likely follow: increasing numbers of prisoner lawsuits alleging constitutional violations, for example, and potentially dangerous overcrowding conditions within facilities (Schlanger Reference Schlanger2003).
Hypothesis 1. State legislatures with a higher percentage of Black legislators will spend less on corrections, and relatively less on institutional corrections than on community corrections than those with a lower percentage of Black legislators.
Next, I theorize that much like Black political incorporation, social incorporation of Black residents is similarly related to corrections spending. This theory refers to the growing social influence of the Black electorate on all types of legislators. However, for the most part, a growing Black electorate will elect more Black representatives whether due to personal preferences regarding the racial makeup of legislators or the construction of majority–minority districts in efforts to increase legislative diversity (Overby and Cosgrove Reference Overby and Cosgrove1996). These Black representatives, by extension, decrease states' reliance on corrections. Even if areas with growing Black populations have White representatives, growing racial diversity encourages representatives of all races to more effectively legislate on behalf of a more diverse set of interests, representing the incorporation of those interests (Cameron, Epstein, and O'Halloran Reference Cameron, Epstein and O'Halloran1996; Overby and Cosgrove Reference Overby and Cosgrove1996; Swain Reference Swain1995). Although Black districts that elect Black representatives highlight the importance of descriptive representation, the growing Black electorate encourage substantive representation, that legislators legislate on behalf of Black interests regardless of their own race (Grose Reference Grose2005; Pitkin Reference Pitkin1967). Moreover, the political incorporation of Black legislators may not even be possible without the electoral mobilization and political pressure from Black voters (Browning, Marshall, and Tabb Reference Browning, Marshall and Tabb1984). Indeed, a higher level of Black descriptive representation in the states is associated with higher political interest within that community (Clark Reference Clark2019), though Black community groups may face hurdles in representing their preferences at the state level rather than the local level (Miller Reference Miller2008). Though most studies examining racial threat and social control use the percentage of the state's population that is Black (e.g., Breunig and Ernst Reference Breunig and Ernst2011; Stucky, Heimer, and Lang Reference Stucky, Heimer and Lang2007), I argue the most valid measure of social incorporation as I define it here concerns the voting population, the percent of Black citizens who vote. Representatives of all races will be more likely to represent Black interests as the percentage of the Black community who votes increases.
Hypothesis 2. States with a higher percentage of Blacks who voted will spend less on corrections, and relatively less on institutional corrections than on community corrections than states with a lower percentage of Blacks who voted.
Data and Methodology
Estimating the relationship between corrections spending and political and social incorporation requires data on state-level outcomes for decades. First and foremost, I collected data on state-level corrections expenditures, and also on those expenditures in the specific categories of institutional and community corrections. Institutional corrections largely refers to spending on any facilities used for the confinement of the convicted or accused (i.e., prisons and jails), whereas community corrections expenditures comprises non-institutional correctional activities such as parole boards and probation activities and programs (Kyckelhahn Reference Kyckelhahn2014). I collect this information for all states between 1983 and 2011, as this time period reflects a massive expansion in the criminal justice system: states significantly increased their carceral capacity via the construction of prisons and other punitive institutions, and corrections expenditures more than tripled in that time period, the fastest growing sector of state spending among expenditures on education, welfare, health, and highways (Kyckelhahn Reference Kyckelhahn2014). Beginning the dataset in 1983 intentionally reflects the beginning of a decade with ever increasing incarceration rates and also, the nascent beginnings of the National Black Caucus of State Legislators (NBCSL), established in 1977 and growing in the following decade. NBCSL's establishment encouraged coordination among Black state legislators across all states and therefore, provides an excellent starting point to consider the influence of these legislators as their political power grew. The end point of the time period, moreover, represents the beginning of waning incarceration rates, as those dipped for the first time in decades in 2010 and 2011. Establishing 2011 as the conclusion of the dataset, then, allows me to establish patterns in corrections spending prior to any decreases in incarceration rates. Finally, the data prior to 1983 from BJS is inconsistent: not all years are reported, and the breakdown of institutional and community corrections is spottily recorded.
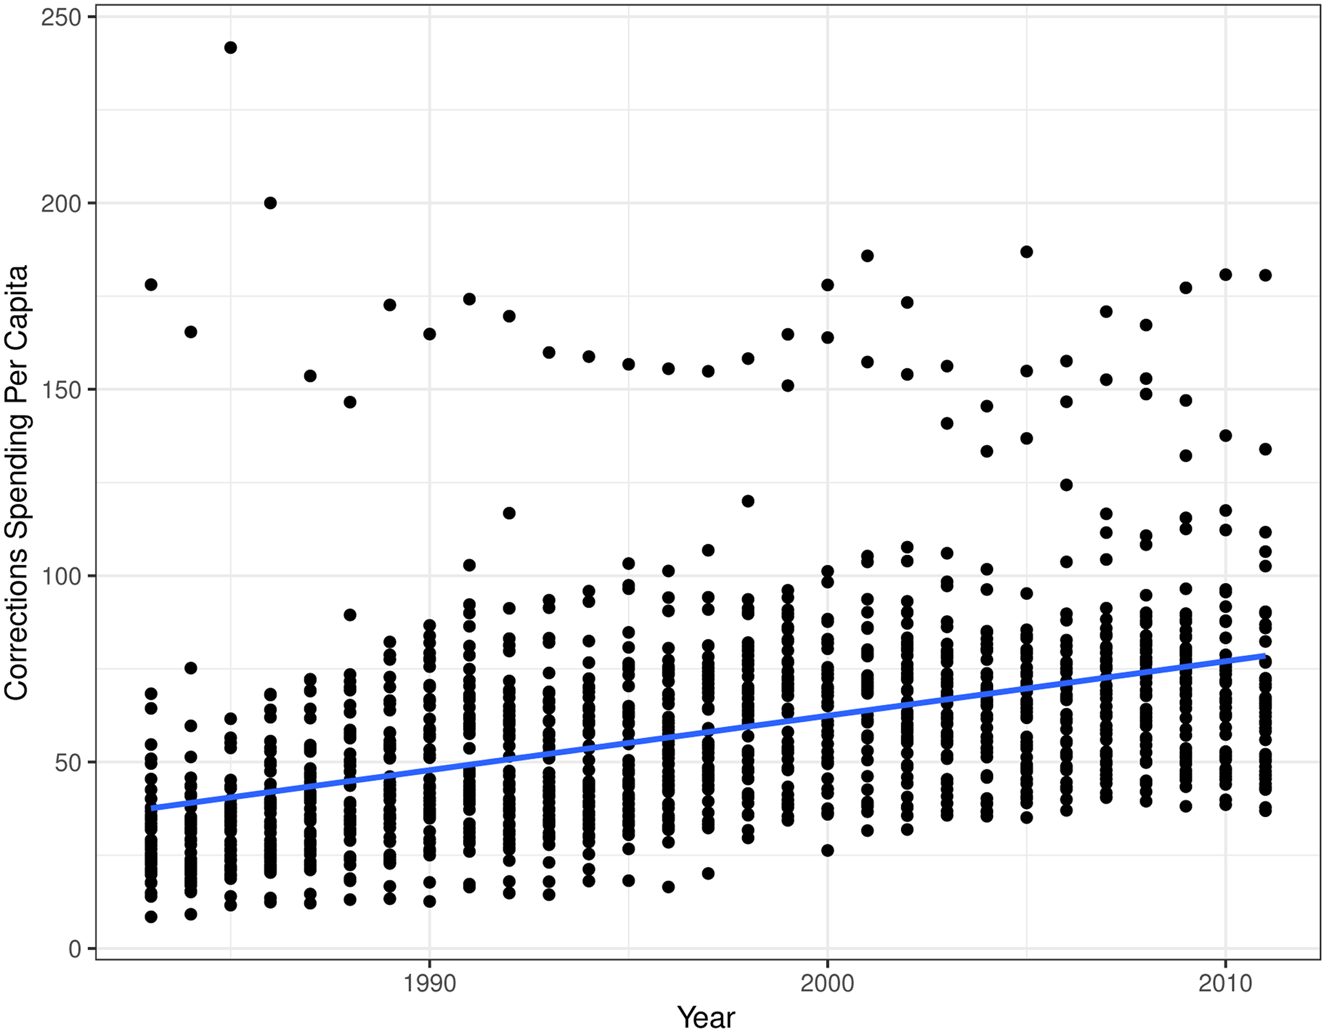
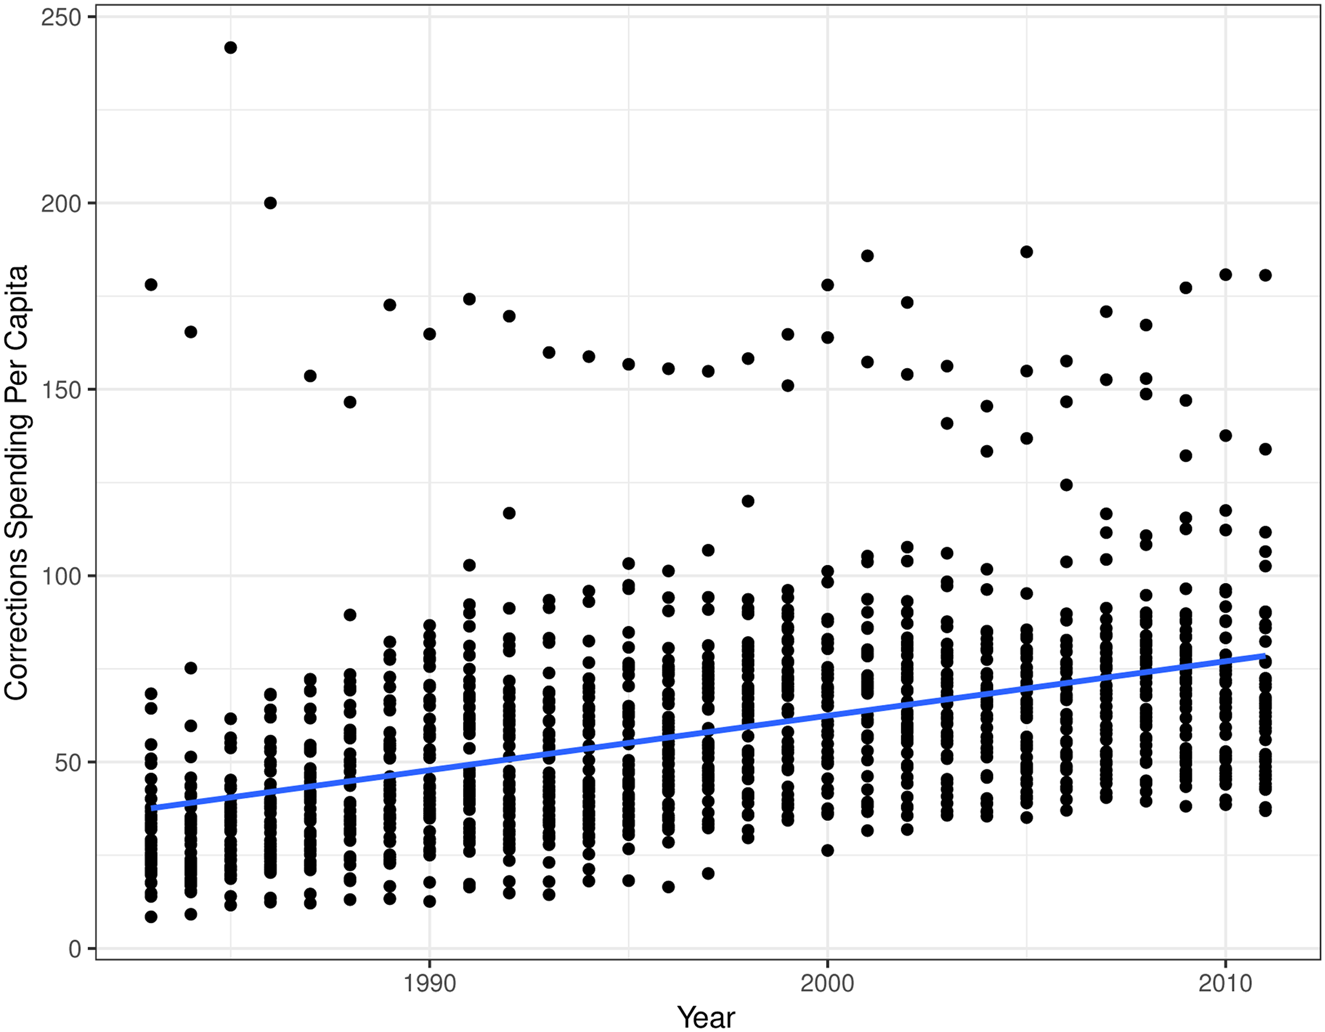
Figure 1 shows per capita state corrections expenditures from 1983 to 2011, highlighting a persistent increase in spending over the last three decades. Despite the fairly uniform increase in corrections spending, there is extensive variation among the states in the level of expenditures allocated to corrections: states in the 50th percentile for corrections spending in 2010, such as DE, spent over $29,000 per resident, whereas the 25th (such as CA) and 75th (like AK) spent approximately $21,000 and $40,000 per resident, respectively (Kyckelhahn Reference Kyckelhahn2014). Most of this spending, approximately 80%, is allocated to institutional corrections and prisons (Kyckelhahn Reference Kyckelhahn2014). That pattern holds for the entire time period of this study, 1983 to 2011, in nearly all states. The average state in this time period spent approximately $60 million on community corrections, whereas the average state spent over $250 million on institutional corrections. This discrepancy is at least partially due to the massive costs of the physical incarceration of the convicted—reentry programs are less expensive by nature.
State per capita corrections expenditures, 1983–2011. Data from the Bureau of Justice Statistics.
Expenditures data are from the Bureau of Justice Statistics' Justice Expenditure and Employment Extracts Program (JEE). The original data reflect dollars spent in each year,Footnote 5 but I adjusted the expenditures for inflation using the consumer price index (CPI), which measures the annual cost of goods and services. The CPI for the years 1982–1984 were standardized to $100 and expenditures for the remaining years were adjusted by the following formula: (y i,t/CPIt) × 100, where yi,t refers to expenditures in a given state and year, CPIt refers to the consumer price index in each year (it is the same across states), and 100 is the benchmark dollar amount for 1982–1984. I then calculated spending by category per capita, dividing the inflation-adjusted expenditures by the state's population to eliminate the right-skew in the data, as some states vastly outspend others. Thus, the final dependent variables are the per capita, inflation-adjusted dollars spent on total, institutional, and community corrections. The dataset contains 49 observations for each year between 1983 and 2011, with approximately 1,400 total observations for each of the three dependent variables. NE is excluded because it has a unicameral and nonpartisan legislature.
With the information on the dependent variables collected, I estimate an equation analyzing the effect of Black political and social incorporation on state corrections spending from 1983 to 2011 using an ordinary least squares (OLS) estimation:
 $$\eqalign{y_{i\comma t\;} = &\alpha _{i\;} + \beta 1\lpar {\percnt \,{\rm Black}\,{\rm Legislators}} \rpar _{i\comma t-1} \cr & \quad + \beta 2\lpar {\percnt \,{\rm Blacks}\,{\rm Who}\,{\rm Voted}} \rpar _{i\comma t-1} + \delta _{t\;} + X_{i\comma t-2} + \varepsilon _{i\comma t}} $$
In this equation, yi,t refers to per capita total, institutional, and community corrections expenditures in state i and year t. Percent Black Legislators comes from multiple sources: mostly the Joint Center for Political and Economic Studies (JCPES), but also data shared by Preuhs (Reference Preuhs2006). I was unable to find data for 2 years, 1995 and 1996, so I imputed those values as the mean of this variable for the year before and after the missing data, 1994 and 1997. Next, I operationalized social incorporation via the percent of Blacks who voted. I use the Current Population Survey Voter Supplement FileFootnote 6 to construct an approximate state-year estimate of the percent of voters that are Black (similar to Avery and Fine Reference Avery and Fine2012). I then merge that estimate with data from the United States Election ProjectFootnote 7 on the total number of ballots cast for the highest office (voter turnout), before multiplying these two variables together to get an approximate number of Blacks who cast a vote in each election. I then divided that number by the total number of African Americans who resided in each state and in each year and multiplied that by 100, creating a measure of the percent of Blacks who voted. The voter turnout variables, however, are only estimated every 2 years, so I replace the years in which it is not collected with the previous year's estimate.
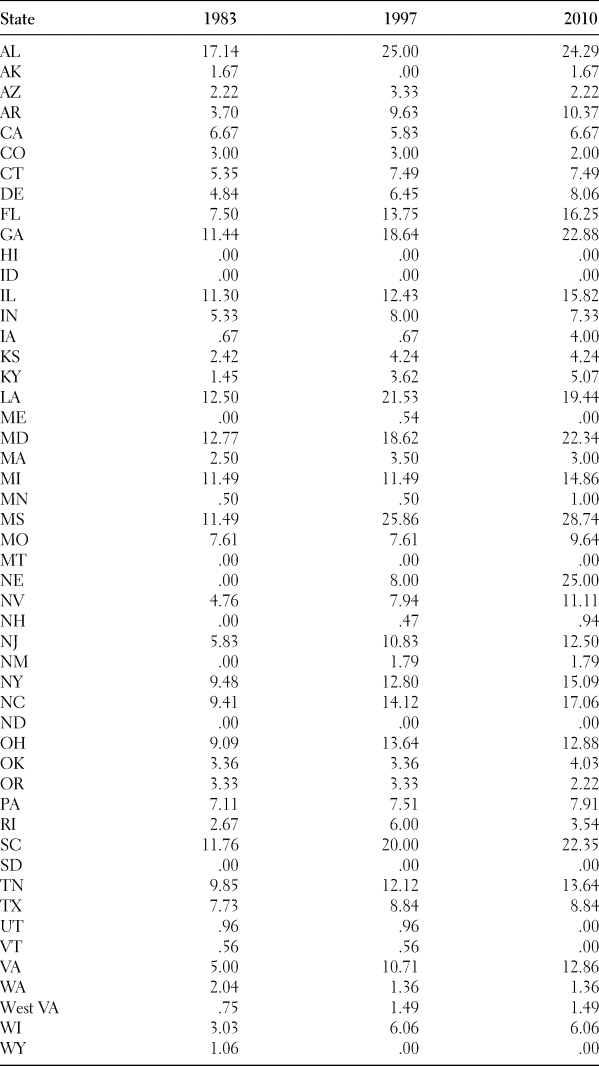
Table 1 contains the percent of legislators who are Black by state in 1983, 1997, and 2010, roughly equal time periods throughout this study. There is wide variation in this variable, as states such as MT do not have any Black legislators in these 3 years, whereas states such as GA experience a continued increase of this variable, with approximately 11, 18, and 22%, respectively, in these 3 years. Across all states, however, it appears racial diversity is growing.
Change in percent Black state legislators over time, data from the Joint Center for Political and Economic Studies and Preuhs (Reference Preuhs2006)

Xi,t −2 is a matrix of control variables most pertinent to the level of state corrections spending—partisanship of the state (governor and legislature), violent crime rate, incarceration rate, revenue per capita, and percent minority. Republican Governor is binary: 1 if the state had a Republican governor and 0 otherwise, data which come from the National Conference on State Legislatures and the Book of the States. Proportion Republican legislatorsFootnote 8 is from Carl Klarner and is the proportion of Republicans in the state legislature. In bicameral legislatures (for every state save NE), I calculate this by averaging the proportion of Republicans in the state Senate and House. Violent crime rate represents the number of violent crimes per 100,000 people, collected from the Federal Bureau of Investigation's Uniform Crime Reports. Incarceration rate comes from the Bureau of Justice Statistics and is measured as the sum of the number of adults under state jurisdiction that are incarcerated per 100,000 state population. This variable is especially important as the more inmates that are incarcerated, the higher the costs to operate prisons and jails. I control for revenue per capita, the total sum of state revenue divided by the state population. Finally, to consider the social control hypothesis I include percent minorityFootnote 9 as a proxy measure, the percent of the population that is non-White, gathered from the Census Bureau.
Finally, Equation (1) includes αi and δt, two-way fixed effects for state and year. I estimate this equation using OLS and additionally cluster the standard errors by state. I also lag Equation (1) to match the timing of budgeting cycles—corrections spending reported for year t were negotiated in year t − 1, hence why the political variables, Republican political power, percent state legislators who are Black, percent Blacks that voted, and revenue per capita, are reported for year t − 1. Although negotiating the budget in year t − 1, politicians are responding to the most recent information about demographics they have, which are from year t − 2. Therefore, all demographic and control variables are from year t − 2—percent minority, violent crime rate, and incarceration rate.
Representation, Incorporation, and Corrections Spending: Results
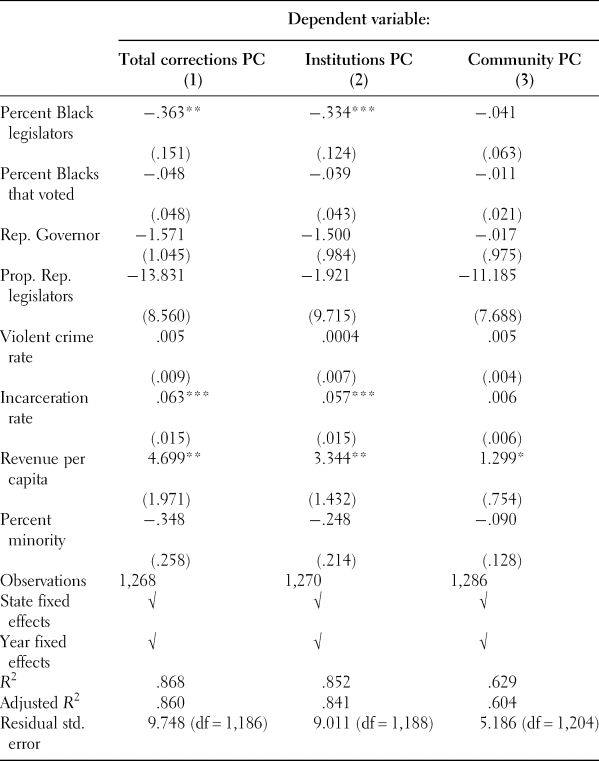
I estimate an OLS model using Equation (1) to identify the effect of both Black political and social incorporation on the three kinds of corrections spending: total, institutional, and community corrections. These results are presented in Table 2.
Descriptive and social incorporation, and corrections spending: an OLS estimation

Note: All SE's clustered by state.
*p < .1; **p < .05; ***p < .01.
Black political incorporation has a significant negative relationship with corrections spending. As the percent of Black representatives in the state legislature increases by 1%, that state will spend .363 and .334 fewer dollars per capita on total and institutional corrections, respectively. We can consider the magnitude of this effect by comparing a few states with varying populations: DE, GA, and CA. DE has a mean population of approximately 750,000 in this time period and thus spends about $272,000 and $250,000 less on total and institutional corrections as the percentage of Black legislators increases by 1%. In contrast, GA has a mean population of about 7.5 million people and as a result, spends about $2.7 and $2.5 million less on total and institutional corrections as its percentage of Black state legislators increases by one. Finally, the most populous state in the union is CA, with a mean population of over 31 million. As the percent of Black state legislators in CA increases by 1%, the state spends over $11.2 million and $10.3 million less on total and institutional corrections spending, respectively. These numbers are not a majority of the budget by any means, but represent significant shifts in the priorities of the state legislature and indicate a decreasing reliance on corrections. And, indeed, this relationship appears to influence incarceration rates in the following year, highlighting how spending can drive corrections policy: Table 19 in the Supplementary materials finds total per capita corrections spending is significantly and positively related to the incarceration rate the following year.
In contrast, social incorporation of Blacks, operationalized as the percent of Black Americans that voted, is not significantly related to spending of any type. This could be because of the coarseness of the variable and its known problems (for instance, it is only estimated every 2 years and it does not do a great job of estimating the percent of voters that are Black in states with low diversity), but it could also point to the overwhelming importance of political incorporation over social incorporation. That is, perhaps demographic shifts do not significantly contribute to variation in corrections spending over time, whereas large-scale political shifts do. It could also be attributable to the relatively low level of political engagement of community groups at the state legislative level, compared to the local level (Miller Reference Miller2008). The Supplementary appendix reports similar results with the percent of the state's population that is Black, also insignificantly related to corrections spending. Either way, it appears political incorporation is the primary mechanism by which Black interests are represented in criminal justice policy.
The results presented in Table 2 suggest that partisanship and Black political and social incorporation are not significantly associated with spending on community corrections. There could be a few reasons for these results—first, the level of expenditures is significantly lower in this category of spending, so there is less variation overall in this variable. Additionally, as previously mentioned, Democrats are typically associated with reentry programs, but some Republicans are now embracing the smart-on-crime initiative to fund reentry programs to save money on incarceration long term (Percival Reference Percival2016). It could be the case, then, that Republicans and Democrats alike (and Black and non-Black representatives) have similar spending preferences on this category which makes a null result less surprising.
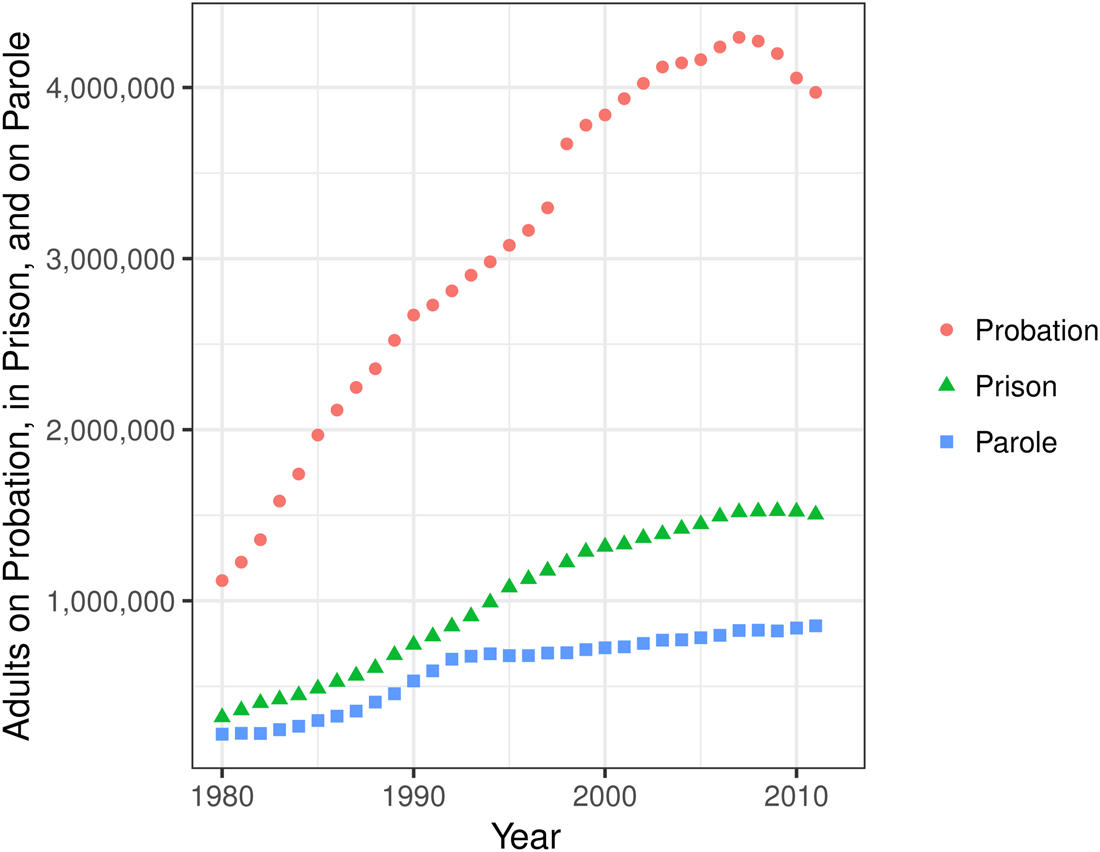
Finally, the control variables largely behave as expected. Increases in both incarceration rates and revenue per capita increase total and institutional corrections spending per capita, unsurprising results considering especially the vast increase in imprisonment over the last few decades (see Figure 2). However, neither violent crime rate nor the proportion of a state's population that is non-White significantly affects any kind of spending. These results suggest two potential conclusions. First, spending on corrections may be more of a political exercise than a utilitarian one, as changes in the violent crime rate (and likely the number of arrests for those crimes) do not predict different levels of corrections spending. Second, there is not clear support for the social control hypothesis here, as the coefficient for the percent of the population that is not White is not statistically distinguishable from zero. The partisan variables are also insignificantly related to corrections spending. Although these results may seem surprising at first blush, considering the scholarship on the effect of Republican politicians in the construction of the carceral state more generally (e.g., Beckett Reference Beckett1997), it does fit into the narrative of the complicity of both the Republican and Democratic party in pursuing punitive policies (Murakawa Reference Murakawa2014). The negative direction of the partisanship variables, however, though not significant, is surprising. This may be partially attributable to fears of voter retaliation for budget increases: Lowry, Alt, and Ferree (Reference Lowry, Alt and Ferree1998) find, for example, Republican governors are punished by voters for unanticipated increases in state expenditures. Though there is not a clear reason for this negative direction, it may suggest budget dynamics (and spending) are distinct from punitive rhetoric or policy.
Adults in prison, on parole, or on probation; 1980–2011. Data from the Bureau of Justice Statistics.

One potential concern about these results is the high R 2's reported in Table 2. I revisit the results by running a few additional tests. First, I calculate a correlation matrix between all the model variables. The matrix, shown in the Supplementary appendix, does not identify any other strong relationships. The incarceration rate and violent crime rate, notably, do not appear to significantly drive spending as the R 2 vacillates between approximately .2 and .5 for these variables. The high R 2's in the models, then, appear to be driven by the inclusion of fixed effects, not any significant multicollinearity issues. To address this, I estimate an additional set of analyses in the Supplementary materials: first, a simple bivariate OLS model with percent Black legislators and percent of Blacks that voted and spending; second, that relationship with fixed effects; third, OLS with fixed effects and the main control variables; and fourth, OLS with fixed effects and a selection of other control variables that may affect corrections spending (such as unemployment, legislative professionalism, and electoral competition). Across the models, from the bivariate to the inclusion of a set of control variables, the results are fairly consistent. The percent of Black legislators is significantly and negatively associated with total and institutional corrections spending per capita, bolstering our conclusions about the negative relationship between the percent of Black legislators and corrections expenditures. Further, even if I use a lagged dependent variable model in place of a two-way fixed effects model, reported in the Supplementary materials, I still find a significant and negative relationship between corrections spending and descriptive representation. Results do not appear to be driven by multicollinearity issues, modeling choices, or omitted variable bias.
Partisan politics and social control explanations are often considered independently, but the broader theoretical argument of social control suggests the impact of partisanship is conditioned by the size of the non-White population (Giles and Hertz Reference Giles and Hertz1994). Republican politicians transferred their own and constituents' racial fears into punitive crime policies after their “loss” in the civil rights movement (Weaver Reference Weaver2007). The behavior of Republican politicians is thus highly dependent on perceived racial threat. In the Supplementary materials, I consider this interactive effect and interact both the percent of Blacks that voted and the percent of a state's legislature that is Black with a dummy for unifiedFootnote 10 Republican government. The interactive results are not significant and Black legislators' negative and significant effect on corrections spending remains. Second, an interactive relationship could also exist between the percent of Black legislators and the partisanship of the legislature (or the legislators themselves). However, because the vast majority of Black state legislators are Democrats—nearly 99% in 2001, for example (King-Meadows and Schaller Reference King-Meadows and Schaller2007) there is simply not enough variation to conduct an interactive analysis of this type. However, based on the results of the above analysis interacting the racial demographic variables with partisanship and the overall insignificance of those variables across the main and supplementary analyses, it is unlikely that interaction would substantively change the results here.
In addition to these considerations, other concerns could be affecting these results: the choice of the dependent variable (how to measure state spending priorities); the potential nonmonotonic relationship between descriptive representation and spending; and the differences between Southern and non-Southern states. I conducted several additional analyses to address these concerns in the Supplementary appendix and the main results are robust. Black legislators are associated with decreases in both the percentage of the budget devoted to corrections and logged spending. These representatives are able to shift state priorities and deprioritize corrections spending relative to different categories of expenditures (Owens Reference Owens2005). However, Black legislators do not significantly decrease funding per prisoner, highlighting how these legislators decrease funding without substantively reducing the amount given to each inmate (and therefore, likely do not worsen prison conditions). Second, there could be a threshold effect by which Black representation in the population and in the state legislature is perhaps positively related to corrections spending at lower levels, but is negatively related at higher levels (Stucky, Heimer, and Lang Reference Stucky, Heimer and Lang2007), similar to the threshold effects theorized about women's political representation (Beckwith and Cowell-Meyers Reference Beckwith and Cowell-Meyers2007). In the Supplementary materials, I include a squared term of both percent Black legislators and percent Blacks that voted and neither are significant, suggesting there may not be a threshold effect at work in this context. Third, the results are similar across Southern and non-Southern regions, bolstering the consistent effects of Black representation across different geographic contexts.
Finally, I chose the data sample from 1983 to 2011 to reflect changing attitudes and policies in criminal justice, from the punitive character of carceral policies in the 1980s and 1990s to the more reform-oriented changes in the 2000s and beyond. However, it is possible the effect of Black legislators (and the percent of Blacks that voted) is different depending on the years considered. The Supplementary materials subset the data into two distinct periods, 1983 to 1994 (the year the punitive Violent Crime Control and Law Enforcement Act was passed at the federal level) and 1995 to 2011. The results show a consistent and negative influence of Black political representation and corrections spending. Though the coefficient in the 1983 to 1994 specification loses its significance, it retains its negative sign and that loss of significance is likely at least partially attributable to the nearly two-thirds decrease in sample size. This suggests the effect of Black representation is not significantly different across time periods, though it may be stronger in the post-Violent Crime Control and Law Enforcement Act era.
Taken all together, the main results and associated robustness checks support the paper's hypotheses. Black political incorporation counterbalances the punitive impulses of state legislatures and decreases spending on per capita total and institutional corrections.
Discussion and Conclusion
In this paper, I examined the impact of political representation on corrections spending in the underexplored policy area of corrections. I found evidence for this claim, as the percentage of Black state legislators increases, spending on total and institutional corrections decreases. Descriptive representation in the state legislature is associated with changes in corrections expenditures, whereas substantive representation (via the percentage of Blacks that vote) is not. This finding emphasizes the potential influence of state legislators on crafting budgets beneficial to their communities and the potential lack of resources Black voters and community groups alike face in state legislatures (Miller Reference Miller2008). I improved on previous studies of this kind in two ways: first, by focusing exclusively on descriptive representation, I highlighted the importance of racial diversity in state legislatures for altering outcomes important to Black constituents, namely corrections. Second, I extended the time period to consider these dynamics across three decades and provided evidence that though racial threat may have been a persuasive theory decades ago, Black political incorporation acts as an antidote for the punitive impulses of other, mainly White representatives.
The findings presented in this paper have implications for the study of the carceral state more broadly. First, the paper emphasizes the changing nature of race in the post-Civil Rights era, as political and social incorporation of people of color has grown. Black political representatives are able to move the needle on a policy area important to their constituents, suggesting that theories of social control and racial threat are time dependent. The changing nature of minority group power in the United States more broadly means that growing racial diversity may result in positive outcomes for communities of color, as representatives of color are able to leverage political institutions to their advantage and legislate on behalf of their communities (Behrens, Uggen, and Manza Reference Behrens, Uggen and Manza2003; Filindra Reference Filindra2019).
This paper implies Black political incorporation can act as a positive antidote to the punitive impulses of elected officials. As the racial diversity of state legislative bodies increases, so too does these officials' influence over policy and budgetary outcomes. Though there are certainly Black citizens and political elites alike who supported the growth of the carceral state to mitigate the effects of crime in their communities (Forman Reference Forman2017; Fortner Reference Fortner2015), the massive increases in the budget and scope of the carceral state has severely negatively impacted the Black community, and Black men in particular. Black representatives, then, provide substantive representation and reduce states' reliance on corrections and prisons more generally. This paper thus broadens our understanding of “Black interests” to include issues of corrections, and illustrates how Black representatives wield their power to mitigate the punitive impulses of other elected officials. This study cannot tease out the precise mechanisms by which descriptive representation is influencing corrections spending, but future research could tease out how other institutional characteristics, such as party or committee leadership (Preuhs Reference Preuhs2006) or district characteristics such as whether the representative has a prison in their district (though Black legislators are less likely to represent districts with prisons as they are more likely to represent urban areas; Thorpe Reference Thorpe2015), affects corrections-related outcomes. Finally, it is important to note that though these results are encouraging, significant barriers to full incorporation are still faced by Black Americans, a challenge made worse by the continued marginalization of that group in the criminal justice system (Weaver, Prowse, and Piston Reference Weaver, Prowse and Piston2020). Despite these barriers, however, growing racial diversity has the potential to counteract punitive impulses of legislators, a finding that is replicated in another minority community, Latinos (Maltby et al., Reference Maltby, Rocha, Jones and Vannetteforthcoming).
Second, this paper fits neatly into the growing literature on the complicity of both parties in the adoption and exacerbation of punitive crime policies over the last few decades (Hinton Reference Hinton2016; Murakawa Reference Murakawa2014). Results presented here suggest partisanship is not correlated with spending on prisons, jails, parole, or probation, and indicate one party was not responsible for the massive growth in corrections spending in the last 30 years. These results do not point to a conclusive reason for that increase, but future study can tease out the role of other mechanisms in this process, such as the role of inmate litigation, rural legislators, or corrections officers' unions (Gunderson Reference Gunderson2019; Page Reference Page2011; Thorpe Reference Thorpe2015).
Third, the general lack of relationship between any of the concepts under study with community corrections is remarkable. Neither Black representation within the legislature nor the size of the Black electorate appears to significantly increase or decrease these expenditures. It could be because, as previously suggested, both Republicans and Democrats alike are embracing the smart-on-crime initiatives to save money by investing in reentry rather than incarceration (Percival Reference Percival2016), but either way this spending category is not impacted by partisan factors. This finding could be normatively appealing, if those in reentry programs are able to secure funding regardless of who is in power, but it is not clear just from the budget numbers whether that is the case. Future research could illuminate this relationship by examining particular programs in reentry, to see if political context affects the diversity and type of reentry programs offered.
The diminishing effect of the social control hypothesis over time is encouraging, and suggests that at least in the context of corrections policy, descriptive representation plays a vital role. Black representatives can simultaneously act as “blockers” or facilitators for budget proposals disadvantageous or favorable to their communities (Filindra Reference Filindra2019; Yates and Fording Reference Yates and Fording2005), highlighting how important descriptive representation is in crafting corrections policy and representing the interests of a community negatively affected by the criminal justice system.
Supplementary material
The supplementary material for this article can be found at https://doi.org/10.1017/rep.2020.15.
Acknowledgments
The author thanks the editors of this special issue—Allison Harris, Laurel Eckhouse, and Hannah Walker—and the audiences at Justice and Injustice: Political Science Perspectives on Crime and Punishment at Pennsylvania State University (especially the discussants, Peter Enns and Michael J. Nelson), and Michael Leo Owens, Tom Clark, Jeffrey Staton, Zachary Peskowitz, Laura Huber, and the reviewers for advice on theorizing and modeling for this paper. All mistakes are hers alone.