Introduction
Despite more than 50 years of geological mapping of the Antarctic Peninsula there are still significant gaps in the coverage in difficult to access areas and many regions where mapping is based upon sparse or inferred field observations. This reflects the inherent limitations of undertaking geological mapping in an area that commonly requires travel over severe mountainous and glacier-covered terrain. As a result there is an uneven density of geological information that can introduce substantial uncertainties in establishing the detailed geological structure and history of the Peninsula.
Multispectral and hyperspectral remote sensing has been used extensively around the globe for lithological and mineral mapping (Hubbard Reference Hubbard2003, Rowan & Mars Reference Rowan and Mars2003, Hewson et al. Reference Hewson, Cudahy, Mizuhiko, Ueda and Mauger2005, Rowan et al. Reference Rowan, Mars and Simpson2005, Mars & Rowan Reference Mars and Rowan2006) but has not been used for these purposes on the Antarctic Peninsula. This may be a consequence of the specific challenges that the peninsula presents for satellite image analysis, which often includes the lack of rock exposure, the effects of mountain shadowing and seasonal variation in snow cover. The British Antarctic Survey has investigated the potential of remote sensing to assist geological mapping of the Antarctic Peninsula with a view to improving the coverage and overall quality of geological information. Early results of this work from the Oscar II Coast of eastern Graham Land demonstrated that spectral analysis of multispectral ASTER data is effective at discriminating a variety of rock types as well as areas of secondary hydrothermal alteration associated with silicic volcanics rocks (Haselwimmer et al. in press). This work was undertaken in a relatively well-exposed part of the Peninsula and there is now a need to investigate the effectiveness of the same techniques under more challenging conditions where outcrop is sparser and topography more severe. The remoteness of the Oscar II Coast study area has also meant that field validation of the remote sensing results was not possible. Consequently there is a need to directly validate the results of remote sensing based lithological mapping with a view to robustly establishing the effectiveness of the methods in a relatively accessible and better mapped part of the peninsula.
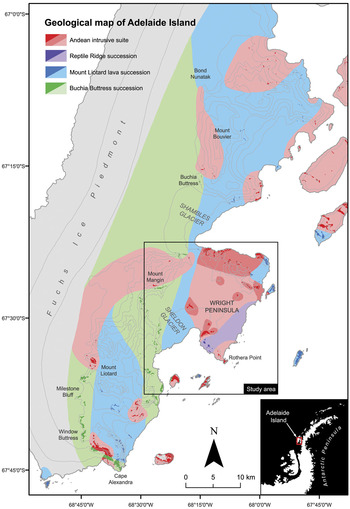
In this paper we present the results of lithological mapping of eastern Adelaide Island (Fig. 1) using ASTER multispectral data. The aim of this work was to assess the potential for discrimination of rock types exposed in the study area with reference to a recently updated 1:50 000 scale geological map (Fig. 1) and direct field observations undertaken as part of this work. The study included image processing of the reflective and thermal bands of part of one ASTER scene, which was supported by laboratory reflectance spectroscopy of rock samples from the study area. Fieldwork during the 2008/2009 summer undertook calibration/validation efforts in support of this work as well as the sampling of rocks for reflectance spectroscopy.
Geological map of Adelaide Island; solid colours represent mapped rock outcrops and tints represent inferred or extrapolated geological units; contours (250 m interval spacing) are indicated by light grey lines. Black box indicates the extents of the study area for this research.

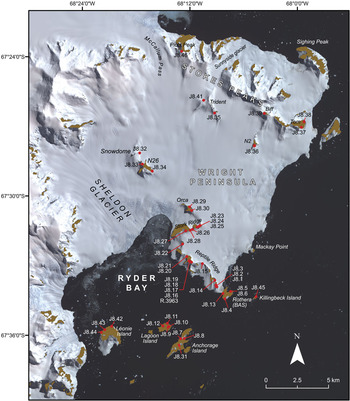
The study area for the work (Fig. 1) encompasses the Wright Peninsula located on the eastern side of Adelaide Island, which is off the west coast of the Antarctic Peninsula. This area is particularly appropriate for assessing the potential of ASTER-based lithological mapping: the geology is diverse and has been well mapped (Dewar Reference Dewar1970, Moyes et al. Reference Moyes, Willan and Thompson1994, Griffiths & Oglethorpe Reference Griffiths and Oglethorpe1998) including recent detailed field observations (localities spaced every c. 500 m where feasible), rock outcrops are readily accessible over land from the main British Antarctic Survey, Rothera research station (Figs 1 & 2), and the degree of rock exposure and rugged topography are representative of that across much of the Antarctic Peninsula.
ASTER false colour composite (RGB 3,2,1) of the study area overlain with names of local features, nunataks and locations of rock sample sites (red); rock outcrop is coloured brown.

Background
Geology
The Antarctic Peninsula represents a long-lived continental margin arc that preserves thick sequences of intermediate-silicic volcanic rocks, arc-derived sediments and major plutonism (Storey & Garrett Reference Storey and Garrett1985). The geology of Adelaide Island was first described in detail by Dewar (Reference Dewar1970) who defined two major lithological units on the island: a succession of stratified volcanic and sedimentary rocks, comprising of three mapped units (Thompson Reference Thompson1969), and an Andean intrusive suite of granitoids and gabbros. Later, Griffiths & Oglethorpe (Reference Griffiths and Oglethorpe1998) undertook detailed sedimentological and dating work of the volcanic and sedimentary rocks of Adelaide Island that was used to establish the following stratigraphy: 1) Marine Mesozoic sedimentation, 2) Early Cretaceous (c. 140 Ma) plutonism as recorded in conglomerate clasts, 3) Cretaceous volcanism, 4) Late Cretaceous–Tertiary sedimentation, 5) Early Tertiary volcanism of intermediate–acidic composition, and 6) Eocene intermediate volcanism and deposition of arc-derived conglomerates. Recent updating of the geological map of Adelaide Island has simplified this stratigraphy into two main informal units. The “Buchia Buttress Succession” (BBS) outcrops extensively along the main central escarpment of Adelaide Island from Buchia Buttress, south to Window Buttress and Cape Alexandra (Fig. 1). The succession consists of debris flow conglomerates and shallow marine sediments and volcaniclastics, punctuated by rare volcanic horizons, which have been dated to between 145–149 Ma (T.R. Riley, unpublished data). The other main succession, referred to as the “Mount Liotard Lava Succession” (MLLS), outcrops from the Sloman Glacier-Mount Liotard-Bond Nunatak (Fig. 1) and includes thickly bedded sandstones and conglomerates, but is dominated by multiple lava flows and breccias of basaltic and basaltic andesitic composition. At Bond Nunatak the volcanic rocks of the MLLS are seen to overlie the sandstones and boulder-cobble conglomerates of the BBS. Although there is no reliable age for the MLLS, they are thought to generally predate the BBS, but sedimentation and volcanism were, at least in part, contemporaneous. The Mesozoic fore-arc of the Antarctic Peninsula is best exposed, further south, on Alexander Island, where the Fossil Bluff Group has a thickness of at least 7 km and in the north of the island the rocks are boulder-cobble conglomerate turbidites and medium grained sandstones (Butterworth et al. Reference Butterworth, Crame, Howlett and Macdonald1988). The age of the northernmost sequences are Tithonian and include a greater volcanic content and they are interpreted as arc-derived material infilling a fore-arc basin, and trench-slope apron deposits. The sequences from northern Alexander Island are interpreted to be contiguous with the successions on Adelaide Island.
In the study area for this research on the Wright Peninsula (Fig. 2), the geology comprises mainly of plutonic rocks of Tertiary age (c. 48 Ma, T.R. Riley unpublished data) attributed to the Andean intrusive suite that are dominated by granodiorite, tonalite and gabbroic compositions. The Tertiary plutonic rocks are not seen to intrude the MLLS or the BBS on the Wright Peninsula, but elsewhere on Adelaide Island the gabbro-granodiorite-tonalite suite are seen to intrude both the MLLS and the BBS, with the granodiorite plutons often seen to host large (several metres) rafts of sedimentary rocks. Sedimentary and volcanic rocks are comparatively less well exposed but include outcrops of the BBS at Léonie Island, MLLS at Lagoon and Killingbeck islands as well as a sequence of potentially younger rhyolitic volcanic rocks that are exposed on Reptile Ridge (Reptile Ridge Succession, RRS) but not seen elsewhere on Adelaide Island. These rocks may represent a later phase of volcanism and be the volcanic equivalents of the Tertiary plutonism that is widespread on the Wright Peninsula.
Lithological mapping using ASTER multispectral data
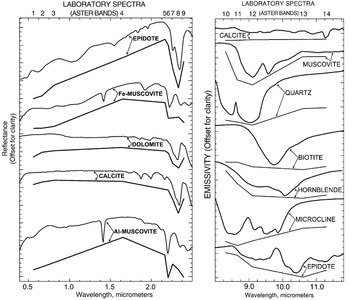
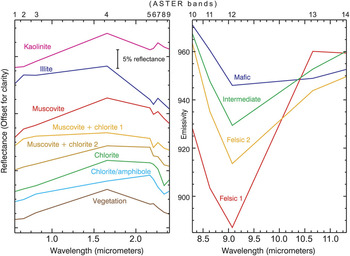
Rocks display varying spectral reflectance and emission properties related to their mineral constituents (Fig. 3), grain size and superficial weathering products that may be used as the basis for lithological discrimination using satellite multispectral data (Drury Reference Drury2001). The ASTER sensor includes three bands in the visible to near-infrared (VNIR) region that are sensitive to absorption associated with transition metals, especially iron and some rare-earth elements (REE) (Hunt et al. Reference Hunt, Salisbury and Lenhoff1972, Rowan et al. Reference Rowan, Kingston and Crowley1986). The six shortwave infrared (SWIR) bands provide information about carbonate, hydrate and hydroxide minerals, which display molecular absorption features related to overtones and combination tones (Hunt Reference Hunt1977). Although important rock-forming minerals, including quartz and feldspar, do not exhibit absorption features in the VNIR/SWIR, most of them display fundamental molecular absorption features in the thermal infrared (TIR) region (Lyon Reference Lyon1964, Hunt & Salisbury Reference Hunt and Salisbury1974, Reference Hunt and Salisbury1975, Reference Hunt and Salisbury1976) where ASTER includes five spectral bands. ASTER acquires images in the VNIR, SWIR and TIR regions at a spatial resolution of 15 m, 30 m, and 90 m respectively with a swath width of 60 km (Fujisada Reference Fujisada1995). This data has been used extensively for lithological and mineral mapping owing to the complimentary spectral lithological information that can be retrieved from the VNIR, SWIR and TIR regions (Rowan & Mars Reference Rowan and Mars2003, Ninomiya et al. Reference Ninomiya, Fu and Cudahy2005).
Laboratory reflectance and emission spectra (laboratory and ASTER convolved) of important rock forming minerals (from Rowan & Mars Reference Rowan and Mars2003).

Reflectance spectroscopy of rock samples
Spectral analysis of rock exposures in the ASTER image was complemented by the direct measurement of the reflectance properties of rocks from the study area using a reflectance spectrometer. This was used to establish the source and context of mineral absorption features in rocks and to investigate the spectral separability of different rocks using the ASTER VNIR/SWIR data.
Methods
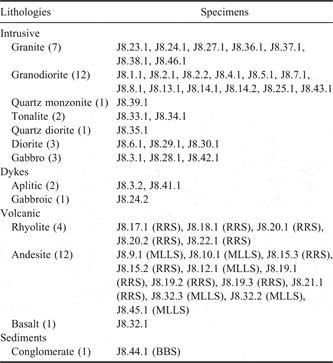
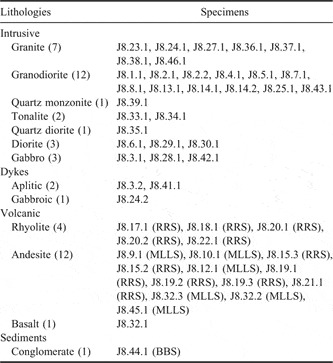
Reflectance spectra of weathered and fresh surfaces of around 50 rock specimens (Table I) from the study area (Fig. 2) were acquired using an ASD FieldSpec 3 spectrometer that records reflected light in the 0.4–2.5 μm region. The existing geological map and results of an initial analysis of the ASTER imagery were used to guide the selection of appropriate rock specimens during the fieldwork. Although vegetation is sparsely developed in the study area small patches of grass and mosses and more extensive lichen coverings are present on the islands in Ryder Bay (Fig. 2). As this may affect lithological discrimination reflectance spectra of different specimens of this vegetation were also acquired.
Summary of rock specimens from the study area analyzed using reflectance spectroscopy; localities of specimens are indicated on Fig. 2 (specimens can be related to each locality by removing the last digit of the specimen id, e.g. J8.23.1 was sampled from locality J8.23). The number of specimens for each rock type and successions assigned to volcanic and sedimentary rocks are shown in parentheses.
Processing of the results involved calculating the average spectra of weathered and fresh rock surfaces for each rock specimen and the average spectrum for specific rock types. The results were analysed by making observations of the mineral absorption features and overall reflectance (albedo) of fresh and weathered rock surfaces with reference to the United States Geological Survey (USGS) Digital Spectral Library (Clark et al. Reference Clark, Swayze, Wise, Livo, Hoefen, Kokaly and Sutley2007). Thin section petrography was used to establish the context of minerals interpreted from the spectroscopy results. A subset of the rock spectra was subsampled (convolved) to match the wavelengths of the ASTER VNIR/SWIR bands in order to investigate the potential for discrimination of the different rock types. The same procedure was applied to the vegetation spectra in support of the analysis of the ASTER data from the islands in Ryder Bay.
Interpretation of rock spectra
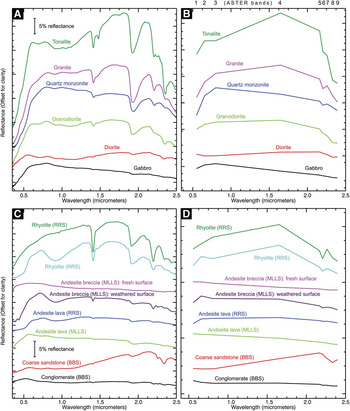
Spectra of the plutonic rocks (Fig. 4a) display differences in albedo that are consistent with the varying compositions of these lithologies: granitoids show moderate to high albedo due to their increased proportions of quartz and feldspar when compared to diorites/gabbros, which have lower reflectance due to the near absence of quartz and the increased content of mafic minerals. For most of the plutonic rocks, absorption features in the VNIR and SWIR region are attributed to mixed mineral assemblages of chlorite, amphibole, smectite, and muscovite. Analysis of thin sections indicates that these minerals represent the products of low-grade alteration of primary mineral phases. Feldspars having been altered to fine grained clays such as smectite and sericite with chlorite formed from the chloritization of primary biotites. These alteration assemblages are consistent for most intrusive rocks. The exception is tonalite (Fig. 4a) which is characterized by MgOH absorption features in the SWIR region (centred c. 2.3 μm): in thin section this rock appears less altered than most other intrusive lithologies and contains significant proportions of primary amphibole and biotite.
Reflectance spectra of rocks from the study area; plots A and B show the full resolution and ASTER-convolved spectra respectively for plutonic rocks; plots C and D show the full resolution and ASTER-convolved spectra for volcanic and sedimentary rocks. Spectra of the fresh (FS) and weathered surfaces (WS) of an andesite breccia of the MLLS (pink and purple spectra on plots C and D) show the development of superficial goethite associated with weathering.

Volcanic rocks (Fig. 4c) display generally medium to low albedo and absorption features in the VNIR region and at c. 2.2 μm associated with ferric iron and AlOH bonds. The intermediate volcanic rocks including andesitic lavas and breccias attributed to the MLLS and RRS display generally low albedo, limited SWIR absorption features, but intense ferric iron absorption (from c. 0.4–1.2 μm) on their weathered surfaces associated with the mineral goethite. The comparison of the fresh and weathered surfaces of the samples demonstrates that the ferric iron is superficial and formed from oxidation of iron minerals (e.g. pyrite). Rhyolitic volcanic rocks of the RRS display medium to high albedo and intense AlOH absorption features (c. 2.2 μm) associated with illite and muscovite, reflecting localised hydrothermal alteration to argillic grades. Some of the rhyolites of the RRS display ferric iron absorption on their weathered surfaces attributed to goethite. The presence or absence of superficial goethite is consistent with differences in the iron mineral content of these rocks that may reflect varying primary compositions or later alteration and enrichment.
Spectra of conglomerates and coarse sandstones of the BBS (Fig. 4c) display low to medium albedo and weak to moderate strength Fe/MgOH absorption features (c. 2.25 μm and 2.3 μm) attributed to chlorite. This is consistent with the green visual appearance of these rocks as observed in the field and from rock specimens. The presence of chlorite reflects low-grade metamorphism and the alteration of primary rock constituents.
ASTER-convolved rock spectra
Comparison of ASTER-convolved rock spectra (Fig. 4) suggests that some of the lithological groups should be uniquely discernible in the ASTER VNIR/SWIR bands as a result of their albedo and absorption features. Rhyolitic volcanic rocks of the RRS exhibit strong AlOH absorption features centred on ASTER band 6 and granitoids display distinctive high albedo across the VNIR/SWIR. Discrimination of the more intermediate to basic volcanic and intrusive rocks and sediments is likely to be more difficult owing to the similarity in VNIR/SWIR albedo and absorption features at ASTER wavelengths. This said, ferric iron and MgOH absorption features, centred on bands 1 and 8 respectively, are retained in the ASTER spectra of MLLS volcanics and BBS sediments that may provide a basis for the discrimination of these rocks in the ASTER image.
ASTER image processing
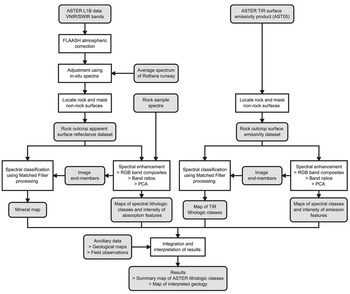
A summary of the various pre-processing, analysis and interpretation steps applied to the ASTER VNIR/SWIR and TIR bands is presented in the flow chart in Fig. 6.
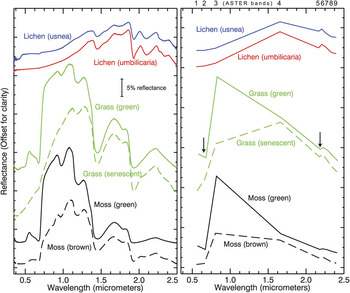
Reflectance spectra of lichens, grass and moss from the study area; left: full resolution spectra; right: ASTER-convolved spectra. Arrows indicate the main absorption features at ASTER wavelengths; the change from healthy (solid lines) to senescent and desiccated states (dashed lines) in grass and moss is manifested in a strong reduction in the reflectance contrast between ASTER bands 2 and 3.

Flowchart illustrating the processing and interpretation stages applied to ASTER VNIR/SWIR and TIR data.

Pre-processing
Pre-processing of the ASTER reflective bands (1–9 of the ASTER level 1B registered radiance at-sensor data) involved converting the data to surface reflectance to enable direct comparison of laboratory rock spectra with pixel spectra of rock outcrops in the image. This was achieved by first correcting the data for atmospheric effects such as path radiance and wavelength specific absorption using an atmospheric correction model (Fast Line-of-sight Atmospheric Analysis of Spectral Hypercube, FLAASH, Cooley et al. Reference Cooley, Anderson, Felde, Hoke, Ratkowski, Chetwynd, Gardner, Adler-Golden, Matthew, Berk, Bernstein, Acharya, Miller and Lewis2002). The atmospherically corrected data was then adjusted using field reflectance measurements of the runway at the Rothera base. A scalar was calculated by dividing the average spectrum of the runway in the ASTER data by the average in-situ runway spectrum (ASTER-convolved) that was then multiplied by the whole scene. The runway at Rothera presented a good target with which to perform this adjustment as it is a large and homogeneous surface (comprised of crushed Rothera Point monzodiorite, Moyes et al. Reference Moyes, Willan and Thompson1994) that encompasses many pixels in the 30 m resolution ASTER reflectance data.
Analysis of the ASTER thermal bands (band 10–14) was undertaken using the on-demand surface emissivity product (AST05, https://lpdaac.usgs.gov/lpdaac/products/aster_products_table/on_demand/surface_emissivity/v1/ast_05, accessed 30 October 2009) that had been preprocessed at the US Geological Survey Earth Resources Observation and Science (EROS) Data Center using the Temperature Emissivity Separation (TES) algorithm proposed by Gillespie et al. (Reference Gillespie, Rokugawa, Matsunaga, Cothern, Hook and Kahle1998). This dataset had been atmospherically corrected and the effects of temperature removed so that the variation in emission properties of land surface materials could be investigated. The use of a robust TIR surface emissivity dataset is important given the context for this work where low solar elevation angles coupled with severe topography can cause significant variations in surface temperature.
Prior to spectral analysis we applied a masking procedure to the calibrated VNIR/SWIR and TIR datasets to remove areas of snow, ice, sea and cloud so that certain image processing tasks could be restricted to just areas of rock exposure (sunlit rock in the case of the reflective data). For the ASTER surface reflectance data this involved calculating the Normalised Difference Snow Index (NDSI, Hall et al. Reference Hall, Riggs and Salomonson1995) using the following band ratio:

and then using a threshold to mask high NDSI values representing non-rock surfaces. The NDSI was developed to discriminate snow that has very high reflectance in the visible region but low reflectance in the SWIR; snow therefore produces high values in the NDSI ratio result (Hall et al. Reference Hall, Riggs and Salomonson1995). The converse is true for sunlit rock exposure that produces very low or negative NDSI values as rocks are generally less reflective in the visible than SWIR region. Areas of sea, cloud and shadowed rock produce broadly intermediate NDSI values so an appropriate threshold used to mask the NDSI result (in this case 0.4) is effective at delineating sunlit rock. For the ASTER thermal emission data rock outcrop was discriminated using a mask produced by the threshold of band 12 of the ASTER L1B thermal radiance data. In the polar context, rock exposure is much warmer than surrounding snow, ice or sea as well as overlying cloud and is readily discriminated due to its high thermal radiance values.
Spectral enhancement
Spectral analysis of the calibrated VNIR/SWIR apparent surface reflectance and TIR emission data aimed to visualise and enhance the separation of the different spectral lithological classes manifested in the ASTER image. This was initially undertaken using qualitative image processing procedures that included RGB (red, green, blue) composites, band ratios and Principal Components Analysis (PCA, Drury Reference Drury2001, Fig. 6). RGB composites are the simplest way to visualize the spectral information within a multispectral dataset and involve presenting each of the red, green and blue components of a computer display as a single band of the dataset (Drury Reference Drury2001). They are most effective when the bands selected to produce the composite coincide with notable mineral absorption and emission features. Band ratios are simple arithmetic combinations of different bands that enable the distribution and intensity of specific absorption or emission features to be investigated in a semi-quantitative way (Drury Reference Drury2001). PCA provides a means of re-expressing spectral data in terms of its variability, thereby enabling the information contained within an image to be more readily visualized using a smaller number of variables (i.e. principle components, Drury Reference Drury2001).
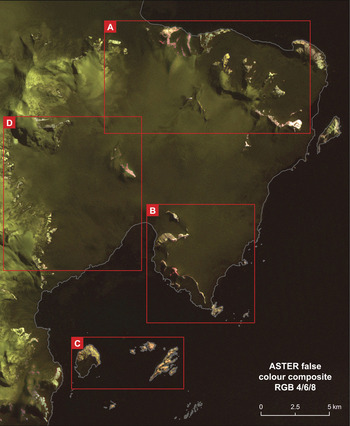
RGB composites were produced from the calibrated VNIR/SWIR reflectance and TIR emission data using both the masked rock outcrop and unmasked datasets (Fig. 7). Linear contrast enhancement was applied to these composites to improve their visual appearance that involved stretching the range of rock reflectance or emission values for each band to occupy the full dynamic range of the computer display. For the ASTER reflectance data a number of RGB composites of different VNIR and SWIR band combinations were produced. The best visual separation of spectral classes was achieved using a composite of the SWIR bands 4, 6, and 8 (Fig. 7) that is effective at discriminating minerals displaying AlOH and FeOH/MgOH absorption features (centred on ASTER bands 6 and 8 respectively) such as smectite/muscovite, and chlorite/hornblende (Fig. 4). Similarly, for the thermal emission data a variety of RGB composites of the five thermal bands were produced. The best discrimination of spectral classes was achieved using a composite of bands 10, 12 and 14. These bands record the variation in intensity and wavelength of SiO-bond emission feature (Fig. 3) that is generally associated with the transition from felsic to mafic lithologies (Drury Reference Drury2001).
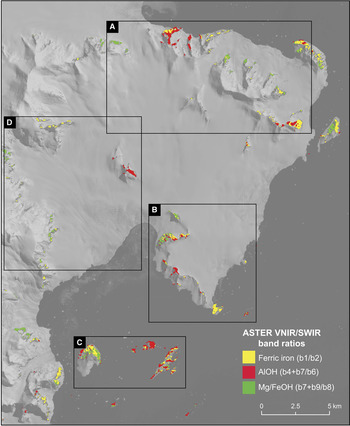
Band ratios were calculated to map the relative intensity of absorption and emission features in the ASTER data. For the VNIR/SWIR data, bands ratios for ferrous iron (Fe2+, b1/b2), ferric iron (Fe3+, b2/b1), AlOH (b4+b7/b6), and FeOH/MgOH (b7+b9/b8) absorption features were calculated from the rock outcrop surface reflectance dataset (Fig. 8). The ratio for ferrous iron records absorption in the VNIR region associated with the Fe2+ ion that is present in mafic minerals such as chlorite and epidote. The ferric iron ratio measures absorption caused by the Fe3+ ion that is associated with iron oxides and hydroxides such as hematite and goethite (Drury Reference Drury2001). The band ratio for the AlOH absorption feature centred on ASTER band 6 was used to map clay minerals and micas such as smectite, muscovite, and illite (Rowan & Mars Reference Rowan and Mars2003). The FeOH/MgOH band ratio that records the absorption feature centred on ASTER band 8 was used to discriminate minerals such as chlorite, hornblende, and epidote (Rowan & Mars Reference Rowan and Mars2003).
ASTER false colour composite (RGB 4,6,8) of the study area. In this composite outcrop displaying red/pink or yellow/green colours broadly correspond to rocks exhibiting AlOH or Mg/FeOH absorption features respectively and snow is moderate to dark green. The red boxes indicate regions discussed in detail in the text.

Results of ferric iron, AlOH and Mg/FeOH band ratios as applied to the ASTER VNIR/SWIR surface reflectance data for rock exposure. The high values corresponding to the most intense absorption features for each band ratio are shown overlain on band 1 of the unmasked ASTER data.

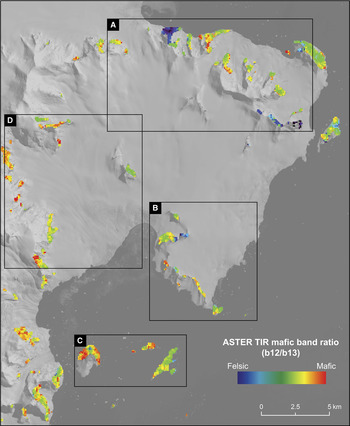
Band ratios were applied to the ASTER thermal emission data for rock outcrop to display the intensity of emission features associated with quartzose (b11/b10), felsic (b10+b13/b12), and mafic lithologies (b12/b13, Fig. 9, Rowan & Mars Reference Rowan and Mars2003). The band ratio discriminating quartz-rich lithologies records the dip in emission at ASTER band 10 caused by the shorter wavelength position of the SiO-bond emission feature within quartz (Fig. 3, Drury Reference Drury2001). The felsic band ratio records the depth of the SiO-bond emission feature centred on ASTER band 12 (Fig. 3) and is sensitive to felsic minerals such as quartz and feldspar (Drury Reference Drury2001). The mafic band ratio was used to map mafic minerals that have SiO-bond emission features at longer wavelengths than for felsic minerals (Fig. 3). In the ASTER data this causes the emission feature to be shifted to band 13 (Rowan & Mars Reference Rowan and Mars2003).
Result of mafic band ratio as applied to the ASTER thermal emissivity data for rock outcrop; the band ratio results are displayed using a pseudocolour ramp showing low values as blue/purple colours indicative of felsic lithologies and high values as red/orange colours indicating mafic rocks. The band ratio results for rock outcrop are overlain onto band 1 of the unmasked ASTER data.

PCA was applied to both the ASTER surface reflectance and thermal emission datasets for rock outcrop with the aim of visualizing subtle spectral information that may have not been obvious as a result of the other analyses. For both wavelength regions the PCA results were visualised by creating RGB composites using different combinations of the higher order principal component images (Drury Reference Drury2001).
Spectral classification
The ASTER surface reflectance and thermal emission data for rock outcrop was classified into a set of distinctive spectral reflectance and emission classes broadly corresponding to different mineral assemblages and bulk rock compositions (Rowan & Mars Reference Rowan and Mars2003). For each wavelength region the classification involved defining a set of image pixel spectra that represented distinctive reflectance and emission classes manifested in the data. These image spectra were used as reference end-members within a Matched Filter (MF) processing procedure (Harsanyi & Chang Reference Harsanyi and Chang1994) that aims to quantitatively find the best match between a set of reference spectra and each pixel spectra in an image. This approach has been applied to ASTER data for lithological and mineral mapping in a variety of studies (Rowan & Mars Reference Rowan and Mars2003, Rowan et al. Reference Rowan, Hook, Abrams and Mars2003, Reference Rowan, Mars and Simpson2005) and has been shown to increase the level of lithological information that is obtainable over band ratioing methods (Rowan & Mars Reference Rowan and Mars2003).
The selection of image end-members from the ASTER surface reflectance and thermal emission datasets was undertaken by visual analysis of RGB composites, band ratio, and PCA results by locating homogeneous areas of rock exposure with distinctive spectral responses. Pixels displaying high values in the band ratio results were of particular interest as they display the most intense absorption features and are likely to represent distinctive image end-member spectra (Rowan & Mars Reference Rowan and Mars2003). The end-members were extracted from the image by defining regions of interest for each spectrally distinctive area of rock and calculating its average image spectrum. In the case of the ASTER VNIR/SWIR data the extracted end-members (Fig. 10) were consistent with the ASTER convolved rock spectra (Fig. 4) in that a similar variety of mineral assemblages was observed. The image end-members extracted from the ASTER thermal emission data (Fig. 4) displayed varying depth and wavelength of the SiO-bond emission feature that is consistent with lithologies ranging from strongly felsic to mafic compositions.
ASTER VNIR/SWIR and TIR image end-member spectra used as reference within matched filter processing procedures as applied to the ASTER surface reflectance and TIR emission datasets for rock outcrop.

The MF processing procedure was applied to the ASTER reflectance data for rock outcrop using all nine VNIR/SWIR bands and to the ASTER emission data for rock outcrop using all five thermal bands. The MF processing results present a single image for each end-member where the degree of match between reference and image pixel spectra is indicated by linearly scaled digital numbers (DN), with higher numbers representing good matches and vice versa. Post-processing of the MF results involved selecting appropriate DN thresholds for each end-member and displaying the results as a summary class image. The thresholds were selected by inspecting the coherence of the spatial distribution of the pixels for each end-member at various DN thresholds.
ASTER results and interpretation
The interpretation of the ASTER results was undertaken by integrating the outcomes of the spectral enhancement and classification procedures with the geological map and other recent field observations (Fig. 6) with a view to assessing the potential for lithological discrimination using the ASTER data. In this section the results from specific regions of the study area (Fig. 7) are discussed in turn.
Stokes Peaks area (Region A)
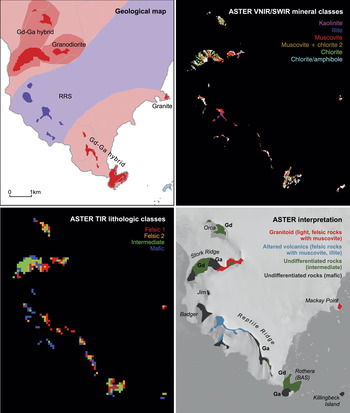
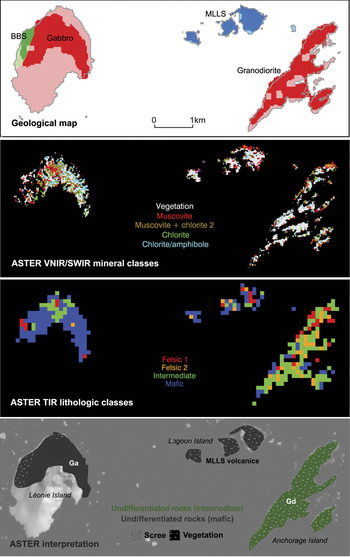
Rock exposures in the Stokes Peaks area (Region A, Fig. 7) comprise predominantly of intrusive igneous lithologies ranging from granodiorite to gabbro and minor exposures of the BBS and MLLS rocks (Fig. 11).
Summary and interpretation of ASTER results from the Stokes Peak’s area (Region A), (top left) existing geological map, (top right) results of MF processing applied to the ASTER VNIR/SWIR data for rock outcrop using image reference end-members (Fig. 10), (bottom left) results of MF processing applied to the ASTER TIR emission data for rock outcrop using image reference end-members (Fig. 10), (bottom right) summary interpretation of ASTER spectral enhancement and MF processing results. Gn = granite, Gd = granodiorite.

Granitoid rocks exposed at the western end of Stokes Peaks (Picts Peak) and on the nunataks called Biff, Tom, and N2 (Figs 2 & 11) are readily discriminated in the ASTER data due to their distinctive felsic emission properties, high albedo and absorption features in the VNIR/SWIR associated with muscovite, kaolinite and chlorite. The mineral assemblages and high reflectivity of these rocks is consistent with the lab spectra of field samples (Fig. 4). ASTER enables broad discrimination of different felsic intrusive lithologies. Granites are interpreted based upon their strongly felsic emission properties (e.g. Tom, Picts Peak) and granodiorites are mapped where the TIR emission properties are more intermediate in nature (e.g. Picts Peak). These results are generally consistent with the existing geological map but do suggest that granite is more widespread particularly towards the north-west and south-east ends of Stokes Peaks and also on the north-west side of Trident (Fig. 11). ASTER is limited in its ability to discriminate the full range of felsic lithologies, e.g. quartz monzonite exposed on Biff has similar reflectance and emission properties to granodiorite. Kaolinite and muscovite associated with granitoid rocks exposed around Picts Peak (Fig. 11) is interpreted as an area of more localised alteration and this has been confirmed from petrologic analysis of a thin section of granite from this site.
ASTER is less successful at discriminating intermediate–mafic intrusives and the BBS and MLLS rocks in the Stoke Peaks area. Exposures of diorite/quartz diorite around Sunnyside Glacier and at Trident (Fig. 11) are quite distinctive in the ASTER data and display moderate albedo and absorption features in the VNIR/SWIR associated with chlorite and amphibole. Similarly, exposures of BBS sediments on the western side of MacCallum Pass (Fig. 11) display moderate albedo and coherent absorption features in the VNIR/SWIR associated with chlorite that is reasonably distinctive in the ASTER data. Elsewhere, it is difficult to discriminate mafic intrusives and volcanic rocks of the MLLS due to a lack of coherency in the ASTER MF mapping results and the similarity of reflectance and emission properties. In the western part of Stokes Peaks ASTER is unable to delineate a mapped contact between volcanic rocks of the MLLS and the Gd-Ga hybrid intrusive suite that runs north-east to Sighing Peak (Fig. 11).
Area around Rothera, Reptile and Stork ridges (Region B)
Rocks exposed in the vicinity of the British Antarctic Survey, Rothera research station comprise of a suite of intrusive lithologies ranging in composition from granite to gabbro, volcanic rocks of intermediate to acidic composition attributed to the RRS, and intermediate–mafic volcanic rocks of the MLLS exposed on Killingbeck Island.
ASTER enables effective discrimination of granitoids exposed on Stork Ridge (east) and Mackay Point (Fig. 12) with results that are consistent with the existing geological map. These rocks display distinctive high albedo (Fig. 7) and absorption features in the VNIR/SWIR associated with muscovite as well as strongly felsic emission properties in the ASTER thermal data. The ASTER results in this case do not enable discrimination of the granites (Mackay Point) from granodiorites (Stork Ridge) as indicated on the geological map due to the comparable spectral properties of the outcrops in the ASTER image.
Summary and interpretation of ASTER results from the area around Rothera, Reptile and Stork ridges (Region B), (top left) existing geological map, (top right) results of MF processing applied to the ASTER VNIR/SWIR data for rock outcrop using image reference end-members (Fig. 10), (bottom left) results of MF processing applied to the ASTER TIR emission data for rock outcrop using image reference end-members (Fig. 10), (bottom right) summary interpretation of ASTER spectral enhancement and MF processing results. Gd = granodiorite, Ga = gabbro.

Intermediate–mafic intrusive rocks including granodiorite, diorite, and gabbro are exposed on Rothera Point, the lower parts of Reptile Ridge, Stork Ridge and Orca (Fig. 12). Similar reflectance and emission properties in the ASTER data make it difficult to differentiate these intrusive lithologies as well as to discriminate these rocks from the mafic-intermediate volcanics. When considering only exposures of intrusive rocks, the ASTER thermal bands provide sufficient information to enable broad discrimination of granodiorite/diorite and gabbro with results that are consistent with the existing geological map (Fig. 12).
Volcanic rocks of the RRS display a variety of spectral features in the ASTER image (Fig. 12). Altered rhyolites, lavas and tuffs at the northern end of Reptile Ridge are very distinctive due to intense AlOH absorption associated with muscovite and illite and strongly felsic emission properties in the ASTER data. The alteration mineral assemblage of muscovite and illite is interpreted as representing argillic grade hydrothermal alteration. Strongly felsic emission properties are consistent with the rhyolitic composition of these rocks. In the ASTER VNIR/SWIR MF processing results (Fig. 12), the distribution of muscovite and illite at the northern end of Reptile Ridge correlates closely with the different volcanic units that are exposed in the section at this locality. Field observations indicate that illite is present in light grey rhyolitic volcanic rocks whereas muscovite is associated with orange (goethite) weathered rhyolite units (Fig. 12). Other volcanic units assigned to the RRS display less notable spectral features and are harder to discriminate in the ASTER data. The more intermediate volcanic rocks of the RRS exposed on Badger Buttress and Jim Buttress (Fig. 12) display limited absorption features in the VNIR/SWIR and generally mafic emission properties that are similar to diorites/gabbros and the MLLS volcanic rocks.
Léonie, Anchorage and Lagoon islands (Region C)
Rocks exposed on the islands in Ryder Bay include granodiorite on Anchorage Island, volcanic rocks of the MLLS on Lagoon Island, and diorite, gabbro and minor exposures of BBS sediments on Léonie Island. The vegetation cover on these islands complicates lithological discrimination within the ASTER data. This includes small, meter-scale patches of grass and mosses on rock exposures as well as more uniform lichen cover (up to 80% total area on some parts of the islands) that blankets certain rock surfaces. To support our analysis of the ASTER data, reflectance spectra (Fig. 5) from different vegetation types were acquired during the fieldwork campaign and field observations were made concerning the location, extent and types of vegetation. To account for vegetation in the MF processing of ASTER VNIR/SWIR data we included a reference image end-member to encompass this particular surface type (Fig. 10).
Analysis of the ASTER VNIR/SWIR image processing results show that vegetation cover has a strong effect on the reflectance of rock exposure on the islands. In particular, vegetated areas display higher reflectance in the SWIR region and an absorption feature at ASTER band 5 (Figs 7 & 13) that is consistent with non-photosynthetically active vegetation such as lichens and senescent grass (Fig. 5). If this spectral signature were interpreted in a mineralogic context then it would suggest an assemblage containing kaolinite or alunite that would be indicative of high-grade hydrothermal alteration, which would be inconsistent with the existing mapped geology.
Summary and interpretation of ASTER results from Léonie, Anchorage and Lagoon Islands (Region C), (top left) existing geological map, (top right) results of MF processing applied to the ASTER VNIR/SWIR data for rock outcrop using image reference end-members (Fig. 10), (bottom left) results of MF processing applied to the ASTER TIR emission data for rock outcrop using image reference end-members (Fig. 10), (bottom right) Summary interpretation of ASTER spectral enhancement and MF processing results. Gd = granodiorite, Ga = gabbro.

In the VNIR/SWIR MF processing results from Anchorage and Lagoon islands the vegetation class dominates with the limited non-vegetated pixels generally mapped heterogeneously as various mineral classes (Fig. 13). The results for the non-vegetated pixels are not necessarily inconsistent with the existing mapped geology (intermediate/mafic intrusive and volcanic rocks). Spectra of rocks from these islands generally show weak mixed AlOH/MgOH absorption features that may have been mapped as muscovite or chlorite during MF processing (Fig. 4). In the VNIR/SWIR MF processing results from Léonie Island less vegetation is mapped that is consistent with the field observations. The diorite/gabbro exposed on Léonie Island is mapped heterogeneously as chlorite/amphibole and muscovite, which is in agreement with the absorption features observed from the rock spectra (Fig. 4). The vegetation that is mapped on Léonie Island is located on its western side and may have restricted the discrimination of BBS sedimentary rocks, which are exposed here (Fig. 13).
The results of analysing the ASTER thermal data provide some information with which to broadly discriminate different lithologies on the islands (Fig. 13). The ASTER TIR MF processing results (Fig. 13) map coherently rocks with intermediate emission properties on Anchorage Island, which is consistent with the granodiorite/diorite exposed here. The predominantly mafic emission properties observed from Lagoon and Léonie islands are also consistent with the MLLS volcanic rocks and diorite/gabbro that crops out on these islands respectively. Interestingly, the thermal results from Léonie Island also show an enclave of more felsic material exposed on the northern flank of the island (Fig. 13). Our field investigations as well as aerial photographs suggest that this area corresponds to an extensive scree slope, which may be of a more felsic nature than the surrounding bedrock.
The ASTER results from Léonie, Anchorage and Lagoon islands show that, although sparsely developed, lichen and vegetation cover does cause significant problems for lithological mapping using the VNIR/SWIR region. The results show that at the spatial resolution of the ASTER sensor vegetation has a strong modulating effect on rock spectral reflectance. Both the ASTER results and the field observations suggest that the lichen cover has the greatest effect. The results from the thermal region indicate that ASTER emissivity data may provide lithological information when vegetation cover prohibits the use of the VNIR/SWIR bands. Overall, it is considered that vegetation cover is a relatively minor problem for lithological mapping on the Antarctic Peninsula as a whole, but the results from the islands in Ryder Bay do show that it may need to be considered when analysing rock exposures in low-lying and sheltered maritime areas.
N26 and Sheldon Glacier region (Region D)
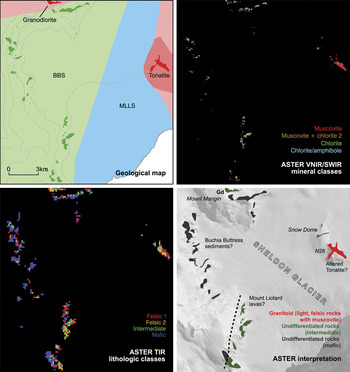
Rocks exposed on the eastern side of the Sheldon Glacier include tonalite and intermediate/basic volcanic rocks of the MLLS (Fig. 14). In the ASTER results the tonalite outcrop at N26 is readily discriminated due to its high VNIR/SWIR albedo (Fig. 7) and felsic/intermediate emission properties. This result is comparable with that for granitoids exposed in the Stokes Peaks area (Fig. 11). The tonalite outcrop displays AlOH absorption features in the SWIR region that are mapped coherently as muscovite in the MF processing results (Fig. 14). There appears to be a general increase in the intensity of AlOH absorption towards the north-west side of N26 (Fig. 7). The presence of strong AlOH absorption in the tonalite is different to that observed from lab spectra of this rock, which displayed generally strong MgOH and weak AlOH absorption features (Fig. 4). This suggests that N26 has been subject to later alteration resulting in the development of secondary smectite and muscovite, which is consistent with exposures of altered granitoid rocks around Pikes Peak (Fig. 11).
Summary and interpretation of ASTER results from N26 and the Sheldon Glacier region (Region D), (top left) existing geological map, (top right) results of MF processing applied to the ASTER VNIR/SWIR data for rock outcrop using image reference end-members (Fig. 10), (bottom left) results of MF processing applied to the ASTER TIR emission data for rock outcrop using image reference end-members (Fig. 10), (bottom right) summary interpretation of ASTER spectral enhancement and MF processing results. Gd = granodiorite.

Intermediate to basic volcanic rocks of the MLLS exposed at Snow Dome (Fig. 14) display low albedo and weak MgOH/AlOH absorption features in the VNIR/SWIR, mapped as muscovite and chlorite, as well as intermediate/mafic emission properties, as for similar volcanic rocks elsewhere in the study area.
On the western side of the Sheldon Glacier sedimentary rocks of the BBS are exposed in steep cliff sections that are tentatively mapped as overlying rocks of the MLLS in the existing geological map (Fig. 14). In this region the mapping is based upon limited field observations owing to the difficult crevassed terrain and restricted outcrop so contacts between the sedimentary units remain inferred. In the ASTER data outcrops of the BBS display VNIR/SWIR absorption features attributed to chlorite as well as mafic thermal emission properties that are consistent with other exposures of these sediments west of MacCallum Pass (Fig. 11). The ASTER results do not obviously discriminate BBS sediments from the MLLS volcanics on the western side of Sheldon Glacier. However, subtle differences in the ASTER thermal results (Fig. 14) provide some evidence for lithostratigraphic variation that may be associated with a contact between the BBS and MLLS on the south-west side of Sheldon Glacier (Fig. 14). This would imply that the contact between the two successions is located slightly further to the east than the existing geological map indicates (Fig. 14).
Granodiorite/diorite exposed on Mount Mangin is difficult to discriminate in the ASTER results, but the thermal data does suggest rocks of intermediate composition at this outcrop (Fig. 14).
Conclusions
Comparison of the results of ASTER data analysis with the recently updated geological map demonstrates that some of the main rock types from the study area may be uniquely discriminated using ASTER data, but many others are difficult to distinguish and some can only be broadly categorised as being of intermediate or mafic composition.
ASTER is most successful at identifying granitoid intrusive rocks that display high albedo and absorption features in the VNIR/SWIR as well as distinctive felsic emission properties. The results enable broad discrimination of granites from rocks with more intermediate compositions (granodiorite) but are less able to distinguish specific felsic intrusive lithologies such as tonalite and quartz monzonite due to the lack of distinctive absorption features in the VNIR/SWIR and the similarity of TIR emission properties. ASTER is successful at discriminating rhyolitic volcanic rocks of the RRS due to their strong absorption features in the SWIR region associated with alteration-related muscovite and illite.
The ASTER results are more ambiguous when it comes to discriminating rocks of more intermediate/mafic compositions including diorite/gabbro, andesite/basalt (MLLS and RRS), and the BBS sediments due to the similarity in the VNIR/SWIR and TIR spectral response of these lithologies. The ASTER results enable tentative discrimination of quartz diorite (Stokes Peaks) and BBL sediments owing to their slightly higher albedo and reasonably distinctive absorption features in the VNIR/SWIR associated with chlorite and amphibole. However, discrimination of diorite, gabbro, and intermediate/mafic volcanic rocks is not generally possible without the use of existing ground truth information. For these rocks, it is only possible to make a broad discrimination between lithologies of intermediate and mafic compositions using the ASTER thermal emission data.
The ASTER results from the islands in Ryder Bay show that, although sparsely developed, vegetation and, in particular, lichen cover has a strong effect on rock spectral reflectance and the ability to discriminate different lithologies. However, the ASTER thermal region appears to be less affected by vegetation cover and has been used in this study to provide lithological information.
Although this study primarily aimed to assess the potential of ASTER-based lithological mapping, the results have provided a number of new geological observations of the Wright Peninsula region: 1) the ASTER results suggest that granite is more extensive in the study area than shown on the existing geological map with evidence for outcrops at Pikes Peak and Trident, 2) alteration mineral assemblages of muscovite and kaolinite associated with granitoid rocks at Pikes Peak and N26 suggest that these rocks have been subject to localised alteration, which may be related to faulting along the western side of the Wright Peninsula, 3) the ASTER results provide tentative evidence of BBS sediments on the western side of Sheldon Glacier and a possible contact between these and the MLLS, which may confirm previous indirect field observations (binocular geology), and 4) argillic alteration of rhyolites of the RRS provide further evidence that the RRS is compositionally distinct from MLLS volcanic rocks.
Overall, this research has provided an important assessment of the lithological information that can be retrieved using ASTER data under a typical scenario of exposure and rock types seen on the Antarctic Peninsula. This study has shown that ASTER data are limited in their ability to discriminate uniquely different lithologies, but do provide a range of lithological information that can be used to assist geological mapping or to target areas for field investigation. In particular, the results demonstrate that when existing observations are available ASTER data analysis is useful for refining local geological mapping. For example, it can be used to validate existing inferred field observations or to extrapolate lithological units or contacts into inaccessible areas. As a result of this study we have been able to establish the rock types that can be reliably discriminated and those that are more ambiguous in the ASTER data. This is critical for future work that will extend the ASTER observations from this study area to the rest of Adelaide Island and to elsewhere on the Loubet Coast of south-east Graham Land.
Acknowledgements
This research was supported by NERC studentship NER/S/A/2006/14242. Fieldwork was funded through a British Antarctic Survey Antarctic Funding Initiative Collaborative Gearing Scheme Award (CGS 10/45). The NERC Field Spectroscopy Facility is gratefully acknowledged for loan of the ASD field spectrometer (loan no: 556.0608). We thank the field operations staff at Rothera Research Station for their support during the fieldwork. Finally, we would like to thank Colm Jordan, Henning Lorenz and Yoshiki Ninomiya for providing constructive comments that improved an earlier version of this manuscript.