Background
Throughout the past few decades, diet composition went from rich in fibres to rich in saturated fat, trans fatty acidsReference Signori, Plentz, Irigoyen and Schaan 1 and simple carbohydrates. Such changes in diet, associated with a more sedentary lifestyle, have accounted for a significant increase in prevalence of obesity both in adults and in younger individuals.Reference de Vasconcelos and da Silva 2 , Reference Barbiero, Pellanda and Cesa 3
These lifestyle changes have an impact on the lipid metabolism. The modern occidental man lives most of the days in a postprandial state. As diet sources of lipids usually exceed the organism’s real requirements, we are constantly faced with an overload of circulating lipids.Reference Cianflone, Paglialunga and Roy 4 This may lead to endothelial dysfunction,Reference Bruce, Chouinard and Tall 5 higher oxidative stressReference Patsch 6 and exaggerated inflammatory response.Reference Signori, Plentz, Irigoyen and Schaan 1 , Reference Cohen, Noakes and Benade 7 , Reference Esposito, Nappo and Giugliano 8 Evidence suggests that the type of fat consumed in the diet will directly influence the extent and duration of vascular inflammation in the postprandial phase in both health and disease.Reference Botham and Wheeler-Jones 9 Such changes may be further aggravated in the presence of overweight. Therefore, evaluation of postprandial lipaemia may be a relevant tool to identify disorders in the lipid metabolism in addition to measurements taken during fasting.Reference Perez-Martinez, Lopez-Miranda, Perez-Jimenez and Ordovas 10
The atherosclerotic process began decades before its clinical manifestations and biological alterations occured in childhood and adolescence;Reference Berenson, McMahan and Voors 11 , Reference Hayman, Meininger and Daniels 12 however, few studiesReference Couth, Isasi and Karmally 13 – Reference Aljada, Mohanty and Ghanim 15 have evaluated postprandial metabolism in younger individuals. It is of paramount importance to identify early markers of risk in this population, if we are to prevent an epidemic rise in atherosclerotic manifestations in the future.
Therefore, this study aims at describing the postprandial metabolism of lipids, carbohydrates and inflammatory response in overweight (OW) and normal-weight (NW) adolescents.
Methods
Study design and population
This is an experimental investigation comparing postprandial metabolic alterations after an oral fat tolerance test (OFTT) in two groups of adolescents: ‘Exposed’, with overweight and obesity, and a ‘control group’, with normal weight. The two groups were defined according to body mass index (BMI) percentile criteria of the World Health Organization,Reference Atlanta 16 and Centers for Disease Control and Prevention curves for children and adolescents aged 2–20 years. 17 Individuals with BMI percentiles >85 for age constituted the OW group, and adolescents with BMI percentiles <85 for age constituted the normal-weight group. For the analyses considering BMI as a continuous variable, AnthroPlus software was used to calculate BMI z-scores.
Adolescents of both genders, aged 11–18 years and selected by the Preventive Paediatric Cardiology Outpatient Clinic of IC/FUC-RS and by the Prevalence Study of Risk Factors in School-Aged Children of Porto Alegre, were included in the study.Reference Barbiero, Pellanda and Cesa 3 Exclusion criteria were: fasting triglycerides (TG) higher than 150 mg/dl; fasting blood glucose higher than 100 mg/dl; previous history of psychiatric disease, including hyperactivity or fear of blood collection; fasting period shorter than 12 h; and those that did not ingested at least 50% of the high-fat meal.
The sample was calculated to estimate a standard effect size of 0.7, α=0.05 and β=0.20, resulting in an estimate of 34 adolescents in each group. A total of 120 adolescents were screened, of whom 64 agreed to participate in the study. Of these, one patient was excluded because of hyperactivity and one because of fasting TG higher than 150 mg/dl. Thus, a total of 62 adolescents were included in the study.
All participants received an explanation about the study procedures compatible with their age group, after which both the adolescent and the parent signed an Informed Consent Term approved by the Institutional Review Board.
OFTT
The standard meal used to conduct the OFTT and to evaluate the postprandial profile was adapted from Boquist et al. Reference Boquist, Ruotolo and Tang 18 and tested by our group in a previous study.Reference de Ugarte, Portal, Dias and Schaan 19 All participants received a breakfast that consisted of 200 ml of whole milk, 30 g of chocolate powder, 4 g of refined sugar, 24 g of Brazil nut, 40 g of egg, 15 ml of soybean oil, 50 g of white bread, 12 g of cream margarine, 30 g of ham, 25 g of cheese and 15 g of sausage. The meal had 1.000 Kcal: 27.4% carbohydrates, 14.7% proteins and 57.8% lipids (30.4% saturated fatty acids, 32.7% monounsaturated fatty acids, 26.5% polyunsaturated fatty acids and 288 mg total cholesterol – TC). Diet assessment was calculated using Dietwin clinical 3.0 (Dietwin Nutritional Assessment Software®).
Data collection
Parents and adolescents completed a questionnaire that included socio-economic variables, family history of coronary artery disease, food and lifestyle habits. Anthropometric measurement was taken in fasting participants to calculate body weight (kg), height (cm), circumferences (cm) and skin fold thickness (mm). Blood sample was also collected. After the fasting period, adolescents were taken to a room where they rested for 6 h. During such period, they performed calm recreational activities coordinated by an interdisciplinary team (physicians, nutritionists, psychologists and recreational therapists), such as reading, watching movies and playing games. The activities demanded only a small expenditure of supplementary calories.
Weight was measured during fasting, with participants wearing light clothes using a digital Welmy scale with 150 kg capacity and 100 g scale. Height measurement was determined by a stadiometer attached to the scale, with 0.1 cm scale. Individuals were bare feet, standing upright with parallel feet, heels, buttocks and head against the stadiometer, and head over the horizontal plane. These data were used to calculate the BMI by dividing body weight (kg) for squared height (m), in kg/m2.
Blood pressure was evaluated by an aneroid pressure device, Premium manometer in the range 0–300 mmHg according to the Report of Second Task Force on Blood Pressure Control in Children, 20 with proper cuff for arm diameter.
Blood samples were collected on site by a trained technician, and were immediately sent to the laboratory for analysis. Blood samples were collected in all participants with 12 h fasting and 4 and 6 h after the OFTT. TC, high-density lipoprotein cholesterol (HDL-C), TG and glucose were determined using automated enzymatic method. LDL-C was calculated using Friedewald’s formula. The electrochemiluminescence method was used for insulin analysis, automated coagulometric for fibrinogen, automated count for blood count (leukocyte count) and nephelometry for high-sensitivity C-reactive protein (hs-CRP) analysis.
All the information was analyzed by the statistical software SPSS v 15.0. Student’s t-test was used for comparison between means in the baseline. The χ2 test was used to analyze baseline categorical variables. Repeated measures ANOVA was used to examine the association between weight excess and changes in postprandial metabolism and inflammatory markers, adjusting for gender. Friedman and Mann–Whitney tests were used to analyze non-parametric variables, especially CRP. We also performed analysis for the whole group using the BMI z-score as a continuous variable, including Pearson, Spearman and partial correlations. A multiple linear regression model was constructed considering as dependent variables the changes in each metabolite (δ) between fasting and 4 h after OFTT, and BMI z-score as an independent variable, adjusting for gender. α was set in 0.05 for all comparisons.
Results
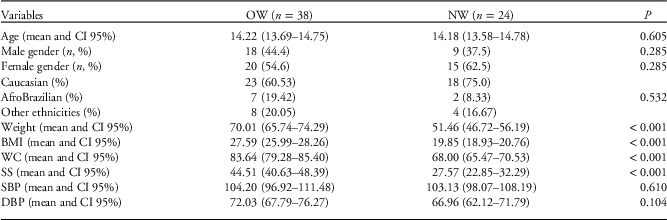
The characteristics of 62 participants (38 OW and 24 NW) are presented in Table 1. Both groups predominantly comprised women and Caucasians, and mean age was similar between the groups.
Characteristics of the adolescents studied, according to group (overweight and normal weight)

OW, overweight (kg); NW, normal weight (kg); CI, confidence interval; BMI, body mass index (kg/m2); WC, waist circumference (cm); SS, sum of skinfolds (mm); SBP, systolic blood pressure (mmHg); DBP, diastolic blood pressure (mmHg).
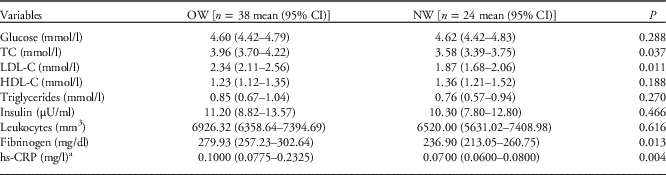
Table 2 describes fasting lipid, glucose and inflammatory profile in both groups. During fasting, TC (P=0.037), LDL-C (P=0.011), fibrinogen (P=0.013) and hs-CRP (P=0.004) levels were significantly higher in the group with OW compared with the group with NW. There were no statistical differences in glucose, HDL-C, TG, insulin and leukocytes between groups.
Fasting lipid profile, blood glucose and inflammatory markers according to group (overweight and normal weight)

95% CI, 95% confidence interval; OW, overweight group; NW, normal-weight group; TC, total cholesterol; LDL-C, low-density lipoprotein cholesterol; HDL-C, high-density lipoprotein cholesterol; hs-CRP, high-sensitivity C-reactive protein.
a Medians and 25th–75th percentiles.
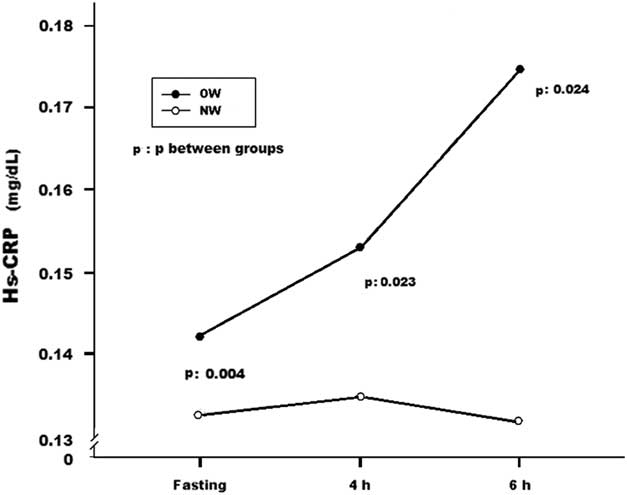
As shown in Fig. 1 and Table 3, the OW group had higher hs-CRP values when compared with the NW group in all intervals.
hs-CPR levels during fasting and 4 and 6 h after OFTT in overweight (OW) and in normal-weight (NW) groups. hs-CPR, high-sensitivity C-reactive protein; OFTT, oral fat tolerance test.

High-sensitivity C-reactive protein (hs-CRP) medians in fasting and 4 and 6 h after OFTT, according to group

OW, overweight group; NW, normal-weight group (kg); OFTT, oral fat tolerance test.
hs-CRP values described in mg/l.
* P between groups (Mann–Whitney test).
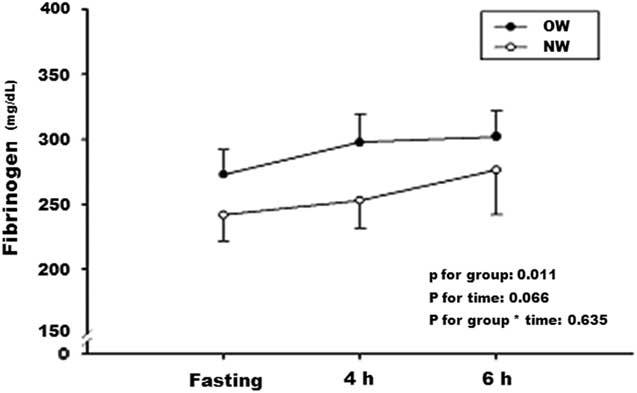
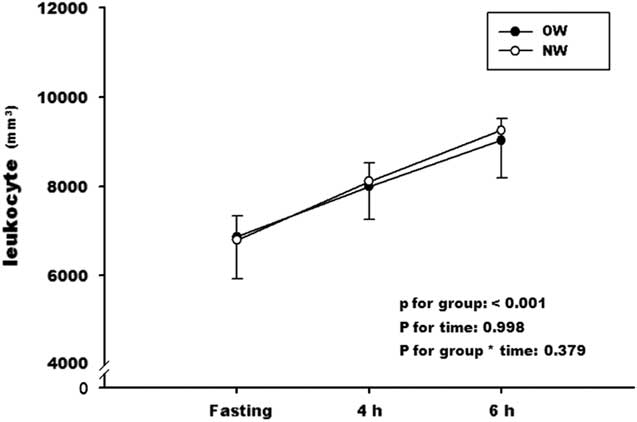
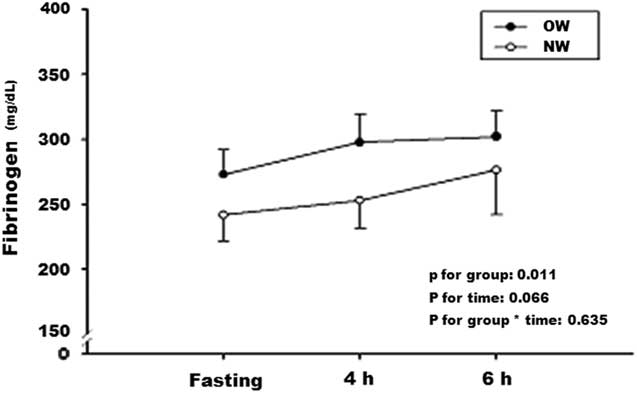
In Fig. 2, the OW group showed significantly higher mean fibrinogen levels at all intervals (P<0.011, adjusted for gender), but with no significant interaction between time and group. Figure 3 shows that there is an increase in leukocyte count throughout time in both groups, although with no statistical significance between the groups.
Fibrinogen levels during fasting and 4 and 6 h after oral fat tolerance test in overweight (OW) and in normal-weight (NW) groups.
Leukocytes during fasting and 4 and 6 h after oral fat tolerance test in overweight (OW) and in normal-weight (NW) groups.

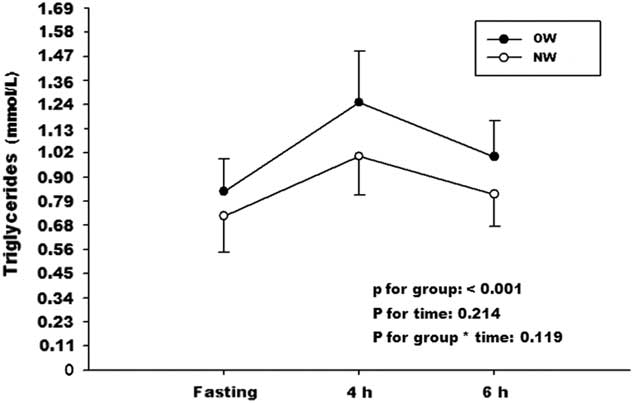
Figure 4 shows the TG response to OFTT. Although the OW group showed higher values at all intervals, such difference was not statistically significant. Both groups had significant changes in TG levels between periods, but with no interaction between time and group (P<0.001).
Triglyceride levels during fasting and 4 and 6 h after oral fat tolerance test in overweight (OW) and in normal-weight (NW) groups.

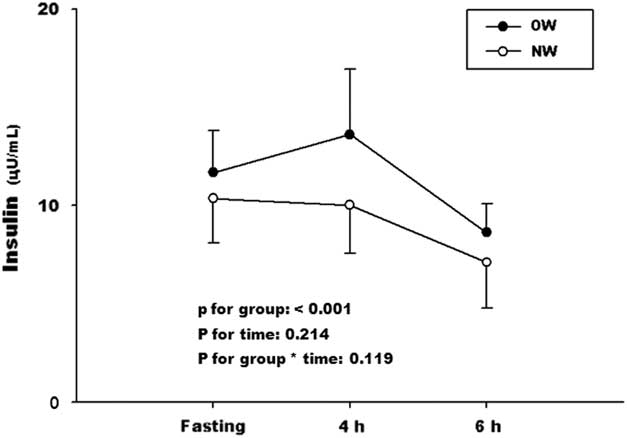
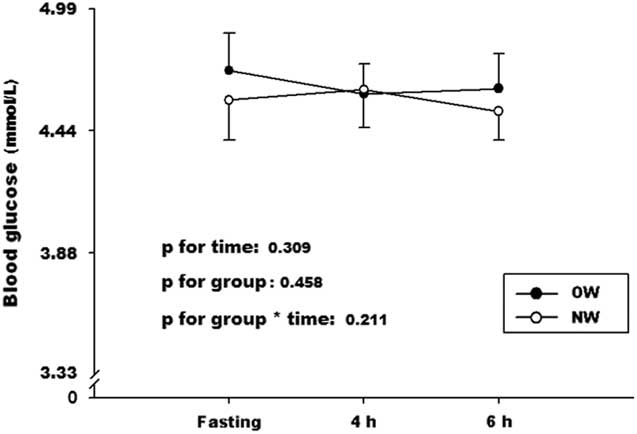
Figures 5 and 6 show the response of insulin and blood glucose metabolism, respectively, to OFTT at different intervals (4 and 6 h). There were no statistically significant differences among the different time intervals regarding insulin and glucose values. Insulin levels were more markedly increased at 4 h in the OW group, although with no statistical significance between groups and in relation to fasting. After 6 h, insulin levels fell in both groups, significantly lower than in fasting and at 4 h (P<0.001). Regarding glucose metabolism, after 4 h, glucose levels were similar between groups and after 6 h the glucose levels in the OW group were higher, but with no statistical significance.
Insulin levels during fasting and 4 and 6 h after oral fat tolerance test in overweight (OW) and in normal-weight (NW) groups.

Blood glucose levels during fasting and 4 and 6 h after oral fat tolerance test in overweight (OW) and in normal-weight (NW) groups.

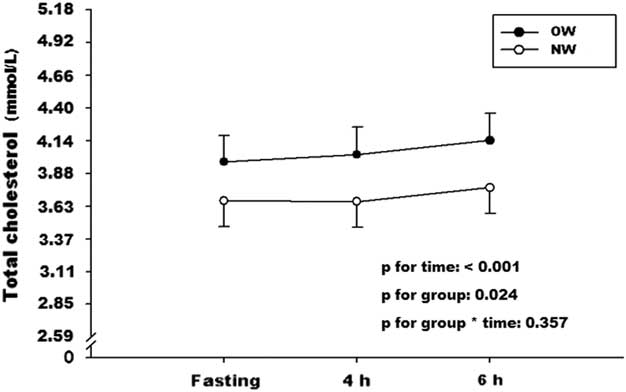
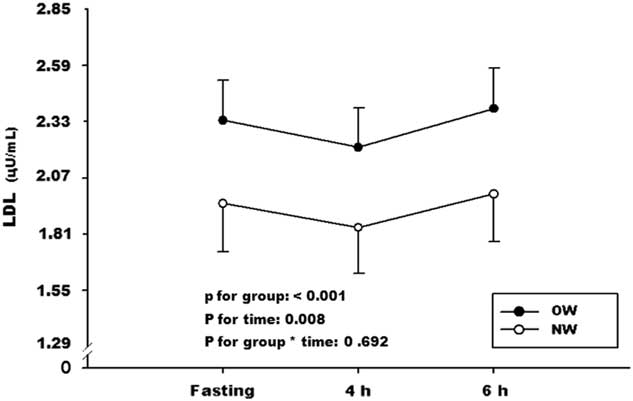
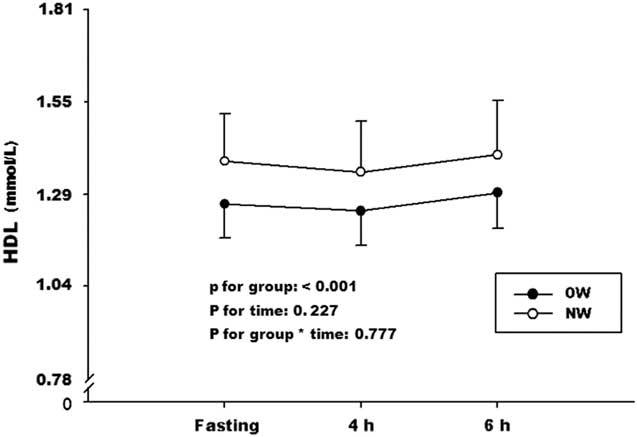
Figures 7, 8 and 9 show the postprandial response of TC, LDL-C and HDL-C, respectively. TC and LDL-C levels were significantly higher in the OW group at all intervals, but with no significant interaction between group and time.
Total cholesterol levels during fasting and 4 and 6 h after oral fat tolerance test in overweight (OW) and in normal-weight (NW) groups.

Low-density lipoprotein (LDL) cholesterol levels during fasting and 4 and 6 h after oral fat tolerance test in overweight (OW) and in normal-weight (NW) groups.

High-density lipoprotein (HDL) cholesterol levels during fasting and 4 and 6 h after oral fat tolerance test in overweight (OW) and in normal-weight (NW) groups.

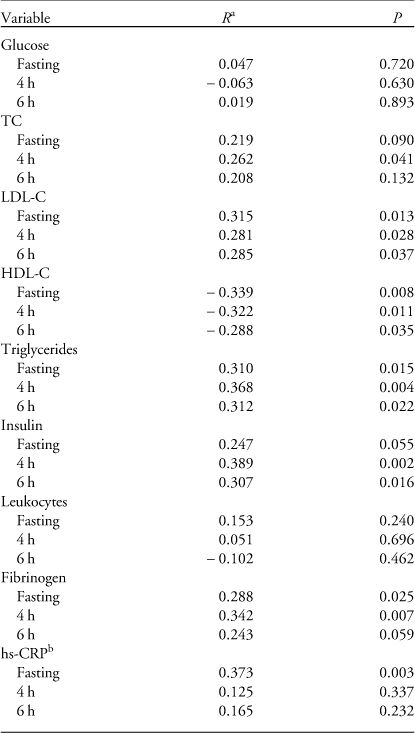
Table 4 shows the correlations between BMI z-scores and inflammatory and metabolic parameters at all intervals. There were direct and significant correlations between BMI z-score and LDL-C, TG and CRP at all intervals, and an inverse and significant correlation with HDL-C, also at all intervals. The correlation of BMI z-score and insulin was not significant at fasting, but showed significance at the 4 and 6h intervals. Fibrinogen was significant for fasting and 4-h intervals, with a P-value of 0.059 at the 6 h interval.
Correlations between body mass index z-score and lipid profile, blood glucose and inflammatory markers (fasting and 4 and 6 h after OFTT)

OFTT, oral fat tolerance test; TC, total cholesterol; LDL-C, low-density lipoprotein cholesterol; HDL-C, high-density lipoprotein cholesterol; hs-CRP, high-sensitivity C-reactive protein.
a Partial correlations adjusted for gender.
b Spearman’s correlation.
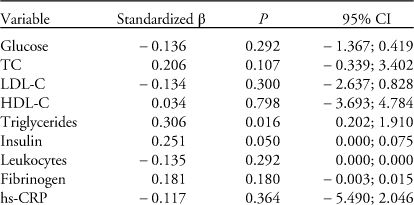
Table 5 shows the linear regression analysis considering the changes (δ) in metabolic and inflammatory parameters between fasting and the 4-h interval as continuous outcomes, adjusted for gender. In these analyses, there were associations between BMI z-scores and changes in TG (P=0.016) and insulin (P=0.05).
Linear regression between changes in metabolite concentrations and BMI z-score in fasting and 4 h after OFTT, adjusted by gender

BMI, body mass index; OFTT, oral fat tolerance test; 95% CI, 95% confidence interval; TC, total cholesterol; LDL-C, low-density lipoprotein cholesterol; HDL-C, high-density lipoprotein cholesterol; hs-CRP, high-sensitivity C-reactive protein.
Discussion
This experimental study showed that both normal and excess weight adolescents showed a noteworthy metabolic and inflammatory response to a lipid overload. Overweight adolescents showed higher fasting values of TC, LDL-C, fibrinogen and hs-CRP values in relation to normal-weight adolescents.
The greater levels of lipid and inflammatory markers in overweight adolescents and the significant correlations between these parameters and BMI z-score strengthen the evidence regarding the adverse consequences of overweight even in early life, as the pro-atherogenic lipid and inflammatory response to increased body mass is already present in this age group.
After stimulation with a lipid-rich meal, the changes in insulin and TG were correlated to BMI z-score. The TG and insulin responses of adolescents in the present study were similar to those observed in glucose-intolerant adults of a previous study on 77 adults.Reference de Ugarte, Portal, Dias and Schaan 19 In this study, we showed that individuals with impaired glucose tolerance and diabetes mellitus have a slower plasma reduction of TG after lipid overload, as well as a more pronounced insulin response, when compared to normal adults. Plasma TG did not return to baseline levels after a 6-h interval, both in diabetic and glucose-intolerant adults; we observed the same pattern both in overweight and normal adolescents in the present study.
The inflammatory response to OFTT observed in the present study is relevant to the understanding of atherogenic mechanisms in this age group. After OFTT, both groups showed increases in hs-CRP, fibrinogen and leukocyte levels. As already mentioned, hs-CRP and fibrinogen levels were already higher in the overweight adolescents during fasting. Both in fasting and after OFTT, CRP and fibrinogen were correlated to BMI z-scores when considering both groups as a whole.
Prolonged exposure to remnant lipoproteins can induce the expression of leukocyte adhesion molecules, in addition to monocytes, lymphocytes and neutrophils, facilitating recruitment of the inflammatory cells. This could possibly induce a more atherogenic response. Both in healthy adult volunteers and in patients with premature atherosclerosis, postprandial lipaemia has been described to be associated with leukocyte activation.Reference Alipour, Elte, Rietveld, van Zaanen and Castro Cabezas 21 , Reference Van Oostrom AJHHM and Verseyden 22
CRP is an important marker of the inflammatory process, and the association of hs-CRP baseline levels with overweight and obesity is extensively studied in literature. Cook et al. Reference Cook, Mendall and Whincup 23 found a strong relation between CRP concentration and ponderal index, in addition to a strong relation with fibrinogen and an inverse relation between HDL and heart rate. In 2001, Visser et al. Reference Visser, Bouter, McQuillan, Wener and Harris 24 evaluated CRP concentration in children and adolescents aged 8–16 years and observed a higher prevalence of high CRP (>2.2 mg/l) in overweight or obese individuals when compared with those with BMI percentile <85. A study by Brasil et al. Reference Brasil, Norton, Rossetti, Leão and Mendes 25 showed that hs-CRP concentrations were higher in the group of overweight or obese children and adolescents when compared with the control group. There was an increase in hs-CRP values as the BMI increased, and most individuals without overweight had hs-CRP concentrations below 2 mg/l. Similar data were found in the study by FordReference Ford 26 in 2003, who used a representative sample of American children who participated in the NHANES 1999–2000, in which BMI was the most consistent predictor of CRP in this population. In a study to evaluate oxidative stress in 6–18 years children and adolescents, overweight or obese participants showed higher levels of oxidized LDL when compared with normal-weight subjects.Reference Kelly, Jacobs and Sinaiko 14 These findings suggest that oxidative stress, measured by oxidized LDL is significantly related to excess weight and insulin resistance in children.
Thus, baseline increase in fibrinogen levels and CRP in these adolescents might suggest the presence of a mild chronic inflammatory state associated with overweight. These findings emphasize on the importance of an early evaluation of these markers in overweight children, as well as reinforces the concept that overweight in this age group already has significant metabolic and inflammatory consequences. However, there are few studies reporting the inflammatory response to a lipid overload in adolescents.
It is possible to hypothesize that the increased inflammatory levels after this overload in both eutrophic and overweight adolescents found in this study may predispose, in the future, to a state of platelet aggregation, endothelial dysfunction and changes in migration process, and proliferation of smooth muscle cells. After the triggering stimulus, there is cell activation triggering the cascade of events of the acute response. The vascular endothelium is extremely important in the communication between the inflammatory site and circulating leukocytes.Reference Santos, Pegoraro, Sandrini and Macuco 27 Increased interaction between leukocytes and the endothelium results in the migration of leukocytes into the subendothelial space, higher platelet aggregation and endothelial dysfunction.Reference Libby 28
The increase in inflammatory markers after the OFTT might also reflect the acute inflammatory stimulus of nutrition. Aljada et al. Reference Aljada, Mohanty and Ghanim 15 fed volunteers aged 29–38 years with hyper caloric McDonald’s snacks for breakfast and studied the variations in inflammatory markers. The standard meal had 910 calories, 81 g carbohydrates, 51 g fats and 32 g proteins, representing the nutritional composition for breakfast of most Americans. After that meal there was increase in oxidative stress, pro-inflammatory effects, IKKα and IKKβ expression, intranuclear NF-κB factor, and reduction in IκBα expression.Reference Aljada, Mohanty and Ghanim 15
Postprandial lipaemia response is associated with the amount of fat ingested in each meal, that is, the higher the amount of fat, the higher the TG levels.Reference Cohen, Noakes and Benade 7 Another study conducted by our group showed that glucose-intolerant and diabetic adult individuals have a slower plasmatic reduction in TG levels after a lipid overload.Reference de Ugarte, Portal, Dias and Schaan 19 Studies on children and adolescents have extensively shown that, during fasting, overweight individuals have higher levels of TC, LDL-C and TG, and reduced HDL-C.Reference Carvalho, Paiva and Melo 29 – Reference Seki, Bonamett and Matsuo 32 However, there are few studies evaluating postprandial TC, LDL-C and HDL-C levels in this age group. A study by Couth et al. Reference Couth, Isasi and Karmally 13 showed a delay in TG postprandial response in children after a fat overload associated with a combination of low HDL-C and high concentration of TG.
The presence of multiple risk factors, such as obesity, hypertension, dyslipidaemia and use of tobacco has a synergic effect on the course of atherosclerotic lesion in youths. In the Bogalusa Study, the extension of lesions in coronary arteries was 8.5 times higher in individuals with three or four risk factors compared with those without any risk factor (P=0.03). In addition, the extension of fibrous lesions in the coronary arteries was 12 times higher (P=0.006).Reference Berenson, Srinivasan and Bao 33
Thus, it is very important to consider both overweight and normal-weight children in the efforts of preventing cardiovascular disease. The meal used for the OFTT in the present study was designed to be compatible with the meals taken in daily life by this group. Given the habits of adolescents in western societies, of frequent hyperlipidic meals and high prevalence of overweight, we could hypothesize that this population could be already at risk from the effects of a chronic postprandial overload. Although both groups showed an inflammatory and metabolic response to lipid overload that may be considered targets for intervention, the accumulation of other deleterious consequences of overweight across the life course may distinguish both groups in the long term.
Some limitations of this study merit discussion. The estimated sample size, calculated to evaluate differences in lipid metabolism, may have been too small for analysis of the inflammatory variables, which showed a greater variability. Other inflammatory markers would help to draw a more complete picture of the inflammatory state in this setting. However, we intended to use the most commonly used markers that could be useful for a low cost and effective evaluation in a context of limited resources.
Conclusions
Adolescents show inflammatory and metabolic abnormalities in response to a dietary overload. Understanding the postprandial behaviour of lipid and inflammatory markers may be important for the planning of effective preventive actions in the future for this specific age group, as we spend most of our lives in a postprandial state.
Acknowledgements
The authors wish to thank the Research Unit (Unidade de Pesquisa) at Fundação Universitária de Cardiologia.
Financial Support
This study was funded by FAPERGS.
Conflicts of Interest
None.
Ethical Standards
The authors assert that all procedures contributing to this work comply with the ethical standards of the relevant national guidelines on human experimentation and with the Helsinki Declaration of 1975, as revised in 2008, and has been approved by the institutional committees of Cardiogia University Foundation of Rio Grande do Sul.