Introduction
Human food behaviour is influenced by a complex set of biological factors modulated by the external environment, including culture. From an evolutionary point of view, human populations have had little time to develop a biological adaptation to the new nutritional patterns expanded by food production that happened 10,000 years ago (Arjamaa & Vuorisalo, Reference Arjamaa and Vuorisalo2010); and even less time to adapt to the new, extremely processed industrial foods, whose consumption has been increasing in recent decades. According to some authors, this imbalance could be the basis of many chronic diseases that affect modern industrialized populations, and which are rapidly expanding in developing countries (Leonard, Reference Leonard2003).
One of the most significant challenges that some societies face is to achieve a balance between calories consumed and those spent (Leonard, Reference Leonard2003; Popkin, Reference Popkin2011). In the last decades large demographic, socioeconomic and epidemiologic changes have occurred in human societies, accompanied by changes in food consumption and physical activity, which define the idea of a nutritional transition. At a global level, the changes in food consumption associated with nutritional transition are a diet high in simple sugars (sodas, industrial food, etc.), animal proteins (meat) and saturated fat (meat products, industrial food), and a low consumption of foods rich in complex carbohydrates (tubers, bread, cereals) and fibre (Popkin, Reference Popkin2006), together with a reduction in energy expenditure in daily physical activity. This transition is influenced by factors ranging from food provision related to technology of farming systems, economic resources, demographic trends, patterns of disease, and cultural and sociological factors, e.g. the role of women and family structure, which affect the demand for, and use of, food (Popkin, Reference Popkin2007).
The speed and characteristics of these changes are different in different regions of the world. Thus, a huge heterogeneity in dietary patterns exists (Adair & Popkin, Reference Adair and Popkin2005). In developed countries, although the nutritional transition has already occurred, changes in food consumption patterns are still happening, specifically an increase in portion size together with increase in snack consumption, the replacement of water by sugar beverages (sodas) and the increased consumption of pre-elaborated or processed foods (Nielsen & Popkin, Reference Nielsen and Popkin2003). All of these endanger the nutritional status and health of human populations (Cavadini et al., Reference Cavadini, Siega-Riz and Popkin2000).
In less developed countries, where the traditional dietary pattern is characterized by a high consumption of vegetables rich in complex carbohydrates and fibre, and by a reduced consumption of products of animal origin, the nutritional transition is relatively recent, but it is occurring fast (Popkin, Reference Popkin1994): first among urban middle-aged adults, but increasingly affecting semi-urban and rural areas and younger age groups. This change in food consumption pattern and physical activity is associated with an increase in the prevalence of overweight and obesity in all populations. In countries in nutritional transition, malnutrition problems due to deficiency (avitaminosis, mineral deficiency, energy–protein deficiency), together with overweight and obesity, exist in the same populations and also in the same individuals (Aboussaleh et al., Reference Aboussaleh, Farsi, El Hioui and Ahami2009). These countries must face the negative effects of the nutritional transition and at the same time keep up the fight against hunger, undernourishment and infectious disease, coined ‘the double burden of disease’ (Prentice, Reference Prentice2006).
For some authors, the obesity epidemic observed in recent decades is not due to a failure of biological systems, but is rather a social and economic phenomenon (Drewnowski & Specter, Reference Drewnowski and Specter2004). From an intrapopulation point of view, in developed countries the prevalence of obesity is greater among less favoured goups with worse education, while in poorer countries the reverse is the case. Among populations, the increase in obesity rate is occurring faster in disadvantaged countries and poorer areas (Mokdad et al., Reference Mokdad, Ford, Bowman, Dietz, Vinicor, Bales and Marks2003).
In Morocco, the problems of malnutrition by excess and deficiency associated with the beginning of the nutritional transition co-exist, and are closely linked to, social and economic transformations and changes in behaviour and traditional lifestyles. The prevalence of obesity doubled in adult men (2%) and women (8%) in Morocco over the five-year period from 1984 to 1989. In 2003 an obesity prevalence close to 20% was observed in urban women, and a prevalence of 6.5% in rural women. At the same time the prevalences of underweight in urban and rural areas were 7% and 8%, respectively. Also, among under five-year-old children, prevalences of underweight range from 6.5% in urban to 14% in rural areas, together with stunting in 23% of children from rural and 13% of children from urban areas, respectively (Benjelloun, Reference Benjelloun2006).
Few data exist regarding the consequences of this change for the health of the Moroccan population, although preliminary studies point to an increase in health problems associated with overweight and obesity such as metabolic syndrome (El Ayachi et al., Reference El Ayachi, Mziwira, Lairon and Belahsen2008). However, it seems clear that this is not happening uniformly in all regions of the country. The geographic situation determines the extent of the transition since this largely affects food availability and access to non-traditional foods. Differences between urban and rural environments and among socioeconomic levels also exist (Montero & Loukid, Reference Montero and Loukid1992). In urban areas, families with high incomes usually have a more varied diet than poorer families and those in rural areas (Anzid et al., Reference Anzid, El Hamdani, Baali, Boëtsch, Levy, Montero and Cherkaoui2009). However, this variety does not always indicate high food quality, since many of the newly incorporated foods are not good from a nutritional point of view, since they have high quantities of simple sugars and saturated fatty acids (sodas, snacks, fast-food, etc.).
Within this context, the objectives of this study are: i) to evaluate the nutritional status of children based on anthropometric indicators, and ii) to analyse the relationship between the type of food consumed and the nutritional status with the educational attainment of parents in a sample of Moroccan adolescents from Ouarzazate, Morocco.
Methods
Sample
The sample comprises 327 students: 135 (41.3%) boys and 192 (58.7%) girls, age range 15–20 years. Data were obtained from the high schools in Ouarzazate (Morocco), a semi-urban region situated on the southern slopes of the Central Atlas with little industrial development but an important tourism sector. The total number of students enrolled in high schools in Ouarzazate in the year 2007/2008 was 4605. First, all students were considered for the study. The response rate was close to 20% (921 students returned the permission signed by their parents to participate in the research), but for the present investigation only those who completed the three 24-hour dietary recall surveys were included. The final 327 students in the sample represent 7.1% of the total population.
Anthropometric variables
Weight (kg) and height (cm) were measured and body mass index (BMI) (kg/m2) calculated for each adolescent. Also, z-score values for height/age and BMI/age and standard deviations (SD) were calculated. To assess the prevalence of underweight, overweight and obesity in the sample, BMI z-scores were classified according to World Health Organization standards (WHO, 2007a). The cut-off points for BMI proposed in this standard are as follows: severe thinness: BMI<−3SD; thinness: −3SD≤BMI<−2SD; normal weight: −2SD<BMI≤+1SD; overweight: +1SD<BMI≤+2SD; obesity: BMI>+2SD.
The software WHO AnthroPlus (WHO, 2007b) was used to calculate the distribution of height and BMI z-scores for boys and girls compared with WHO references. Since this software only includes adolescents up to 19 years of age, 20-year-old boys (n=9) and girls (n=6) were not included in these analyses. However, 20-year-old adolescents were considered in the evaluation of food consumption patterns in the sample, despite the fact that nutritional condition can only be evaluated by AnthroPlus in adolescents up to the age of 19 years.
Adolescents' heights were measured following the recommendations proposed by the International Biological Program (Weiner & Lourie, Reference Weiner and Lourie1981).
Socioeconomic indicator
Parents' educational level was registered in four categories: illiterate/Koranic school, primary school, high school and higher education. Only father's, and not mother's, educational level was used as the variable reflecting the socioeconomic status of adolescents since most mothers in this region were housewives (89.6%) and 59.0% were illiterate or attended Koranic school.
Food variables and nutrition indicators
Information on adolescents' food consumption was obtained through three 24-hour recall surveys. These surveys included an exhaustive questionnaire about the type of food and quantities consumed over three days (Friday/holiday included). The authors organized information meetings in high schools in order to explain to the students how they should complete the surveys. Those students that either did not respond to the pre-established procedures, or who didn't complete all the information in the survey, were excluded from the study.
To assess the accuracy of respondents' answers, the frequency of food consumption survey (not considered in the present study) and socioeconomic data survey were repeated two months after the first interview on a sample of twelve randomly selected households. The consistency of the data was evaluated by estimating the percentage of agreement between the answers from the two surveys. For frequency of food consumption, an agreement of 84% between the surveys was found, which indicates a good consistency considering fluctuations in food consumption due to availability by seasonal or market variations.
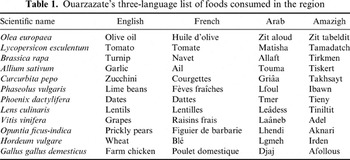
To facilitate data collection and given the multilingual nature of the studied area, a list of the 300 of the most frequently consumed foods, with their names in Amazigh, Arabic and French was prepared (Ammor et al., Reference Ammor, Baali, Hubert and Cherkaoui2003), similar to the one shown in Table 1. To evaluate the type and quantities of food intake, and the amount of energy and nutrients for a three-day period, diets were analysed using the software DIAL 1.0 (Ortega et al., Reference Ortega, López-Sobaler, Andrés, Requejo, Aparicio and Molinero2008). Typical Moroccan foods that were not provided in the program's original database were added. These foods were obtained from the food composition tables of the Food and Agricultural Organization (FAO composition tables for use in Africa, available at: http://www.fao.org/docrep/003/X6877E/X6877E00.htm). The variables analysed were the daily intake of energy (kcal), carbohydrates (g), fats (g), proteins (g) and cholesterol (g), together with information about quality of diet: energy profile (%), cholesterol (mg)/1000 kcal, fibre (g), monounsaturated fatty acids (MUFA), polyunsaturated fatty acids (PUFA) and saturated fatty acids (SFA).
Ouarzazate's three-language list of foods consumed in the region

Statistical analysis
Bivariate analyses (χ2 and t-tests) were performed. Also ANOVAs were conducted to describe differences in anthropometric indicators of nutritional status and adolescents' energy and nutrient intake, in both boys and girls according to fathers' educational level. Non-parametric post-hoc tests (Games-Howell) were used to analyse the differences between categories of fathers' educational level. All analyses were performed with the software Statistical Package for the Social Science (SPSS v.17.0).
Results
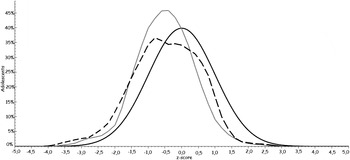
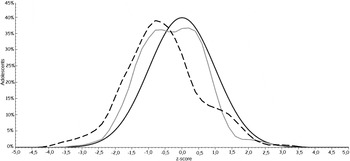
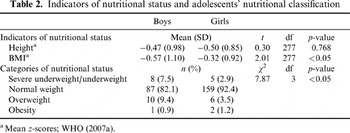
The z-score distribution curves of height/age and BMI/age in both boys and girls are shifted to negative values, lower than the WHO z-score of 0 (percentile 50) (WHO, 2007a) (Figs 1 and 2). Table 2 shows height/age and BMI/age z-scores and the nutritional classification for boys and girls, according to the BMI cut-off points proposed by WHO (WHO, 2007a). No differences are found for height/age z-scores between boys and girls, the z-score values for both sexes being lower than the reference values. Boys have lower BMI/age z-scores than girls and the co-existence of underweight together with overweight and obesity in the sample can also be observed. Boys have higher values of underweight/severe underweight (7.5%) and overweight (9.4%) than girls.
Distribution of height z-scores for boys and girls compared with WHO references. Black curve: WHO reference (WHO, 2007a); grey curve: female (n=173); discontinuous curve: male (n=107).

Distribution of BMI z-scores for boys and girls compared with WHO references. Black curve: WHO reference (WHO, 2007a); grey curve: female (n=173); discontinuous curve: male (n=107).

Indicators of nutritional status and adolescents' nutritional classification

a Mean z-scores; WHO (2007a).
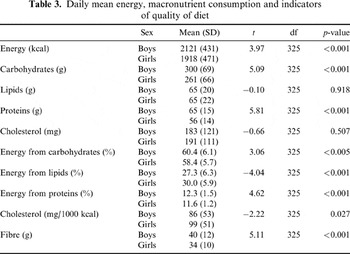
Regarding the dietary profile, boys consume higher quantities of energy, proteins and carbohydrates than girls, but no differences are observed for lipids and cholesterol (Table 3). The caloric profile fits reasonably well with WHO recommendations (55–60% of the total energy provided by carbohydrates, 30–35% by fats and 12–15% by proteins) (WHO, 1990). Cholesterol intake (recommended <100 mg/1000 kcal) and that of fibre (recommended ≈30g/day) are also adequate.
Daily mean energy, macronutrient consumption and indicators of quality of diet

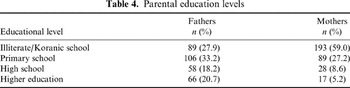
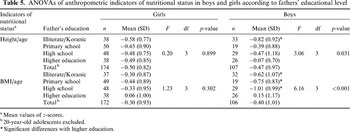
Table 4 shows the distribution of parental education. More than 50% of mothers are illiterate or attended Koranic schools, and 27% of mothers and 33% of fathers had completed primary education. The association between fathers' education and the indicators of the nutritional status of adolescents and their nutrient intake is shown in Table 5. The association between adolescents' height/age and BMI/age z-scores and fathers' educational level shows that adolescents with poorly educated fathers have lower height/age and BMI/age z-scores than those with highly educated fathers, for both boys and girls (Table 5).
Parental education levels

ANOVAs of anthropometric indicators of nutritional status in boys and girls according to fathers' educational level
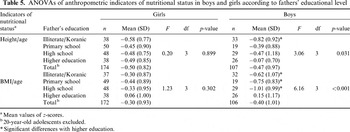
a Mean values of z-scores.
b 20-year-old adolescents excluded.
* Significant differences with higher education.
Positive z-scores for BMI/age in both boys and girls are only observed among adolescents whose fathers have higher education. However, the height/age indicator remains negative in all categories of fathers' education, although higher values are observed for boys with the most educated fathers.
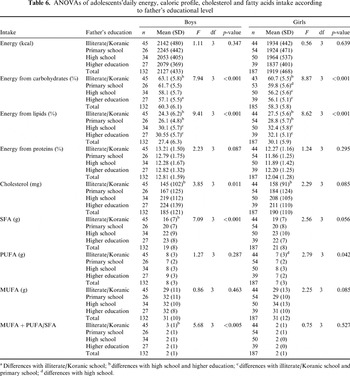
No differences are observed in total energy diary intake by fathers' educational level in either boys or girls. However, differences exist for cholesterol and SFA intake, with the highest values in those of adolescents from more affluent households (Table 6).
ANOVAs of adolescents'daily energy, caloric profile, cholesterol and fatty acids intake according to father's educational level

aDifferences with illiterate/Koranic school; bdifferences with high school and higher education; cdifferences with illiterate/Koranic school and primary school; ddifferences with high school.
Also, the dietary caloric profile varies with fathers' education. The contribution of carbohydrates to total energy intake is higher among adolescents with less educated fathers. The energy provided by lipids is higher in adolescents whose fathers have high educational attainment. No differences are observed for protein contribution by fathers' educational level, but no distinction was made between protein of animal and vegetable origin, the latter being found in great proportion in wheat, which is a basic food for this population.
Fathers' education is also related to the type of fat consumed. Both boys and girls with highly educated fathers consume more SFA. The quality of fats – described by the proportion MUFA+PUFA/SFA – is better among boys with less educated fathers (Table 6), but no differences are observed for girls.
Discussion
In a review of studies on the dietary intake and nutritional status of children and adolescents in Europe, Lambert et al. (Reference Lambert, Agostoni, Elmadfa, Hulshof, Krause and Livingstone2004) defined criteria for the exclusion of studies whose surveys, among others, had too broad age categories (e.g. 2–24 years), mixed the genders of children over 12 years of age, and very small sample sizes (n=10–25). The sample size in the present study fits reasonably well with similar surveys based on local populations (Lambert et al., Reference Lambert, Agostoni, Elmadfa, Hulshof, Krause and Livingstone2004), which indicates the appropriateness of the sample size and supports the robustness of the present study.
The results of this study agree with those obtained for other populations in the process of nutritional transition. In this sample the co-existence of malnutrition by deficiency and excess and overweight and obesity is observed (Popkin et al., Reference Popkin, Richards and Montiero1996; Benjelloun, Reference Benjelloun2002; Du et al., Reference Du, Lu, Zhai and Popkin2002; Lee et al., Reference Lee, Popkin and Kim2002; Doak et al., Reference Doak, Adair, Bentley, Monteiro and Popkin2005; Mendez et al., Reference Mendez, Monteiro and Popkin2005; Leatherman et al., Reference Leatherman, Goodman and Stillman2010). Most adolescents are of normal weight when considering BMI z-score, despite the negative values observed, compared with the references provided by the World Health Organization. However, the frequency of overweight showed a trend already observed in other populations undergoing the process of nutritional transition, i.e. an increase in overweight and obesity in adolescents (Popkin, Reference Popkin2001; Batista & Rissin, Reference Batista and Rissin2003; Ramírez-Mayans et al., Reference Ramírez-Mayans, García-Campos, Cervantes, Mata, Zárate, Mason and Villareal2003; Doak et al., Reference Doak, Adair, Bentley, Monteiro and Popkin2005; Popkin, Reference Popkin2006). On the other hand, the height values obtained suggest a growth retardment.
The present study also includes information on the relationship between food intake and the nutritional status of adolescents with parents' education. The results stress the importance of a combination of these factors in the context of the Moroccan nutritional transition. As in other populations undergoing the process of nutritional transition, the presence of overweight is clearer in high socioeconomic groups (Misra & Khurana, Reference Misra and Khurana2008). Therefore, a gradual transition might be occurring from undernutrition to normal weight, and later to overweight and obesity, especially in high social strata.
The daily energy intake in this sample is slightly lower than the recommended intake for this age group (WHO, 1985; Serra-Majem & Aranceta, Reference Serra and Aranceta2006) and no relation is observed between total energy intake and the socioeconomic level of the family. However, as in other populations, a clear higher intake of SFA is observed in adolescents living in high sociocultural environments (Orden et al., Reference Orden, Torres, Luis, Cesani, Quinter and Oyhenart2005; Prentice, Reference Prentice2006; Misra & Khurana, Reference Misra and Khurana2008; Molina et al., Reference Molina, Montero, Faria, Cade and Zandonade2010). Preliminary results indicate a relationship between socieconomic level and diet variety; the richest consumed a wider variety of foods, but most of these were sodas and industrial origin foods rich in SFA, and not interesting from a nutritional point of view (Anzid et al., Reference Anzid, El Hamdani, Baali, Boëtsch, Levy, Montero and Cherkaoui2009).
The high prevalence of overweight and obesity in boys seems contradictory to what is observed in the adult population, where it is women that show a significant prevalence of these problems. The high prevalence of overweight and obesity observed in Morocco in younger women could be due, among other factors, to differences in lifestyles between men and women, influenced by sociocultural conditions related to gender position, which determine a higher physical activity in men (Batnitzky, Reference Batnitzky2008). At the same time, in this society a large body size is associated with beauty and affluence. A lack of social pressure to be thin and a high level of body satisfaction and obesity acceptance, especially in middle-aged women, might be an added risk for present female adolescents turning into obese women in the future. In this sense, in Morocco, a very small percentage of the female population expressed a desire to lose weight (Rguibi & Belahsen, Reference Rguibi and Belahsen2004).
The results of this study reinforce the need to activate prevention programmes for overweight and obesity in adolescence in Morocco, adapted to the specific sociocultural characteristics of this population. These should focus on controlling the increase in type II diabetes mellitus (DMII), which is probably one of the most serious challenges to health, especially in developing countries with large populations like India and China (WHO, 2003). Morocco also has this problem, as shown by results, especially for adult women, published in recent years (Rguibi & Belahsen, Reference Rguibi and Belahsen2004; El Ayachi et al., Reference El Ayachi, Mziwira, Lairon and Belahsen2008; Benjelloun et al., Reference Benjelloun, Bader and Razès2011).
Acknowledgment
The authors would like to thank the Agencia Española de Cooperación Internacional y Desarrollo (AECID) for funding this project Ref: A/016317/08.