Implications
Life-cycle assessment (LCA) is a well-established method for analysing the environmental impact of agricultural production systems and in recent years it has been increasingly used for calculations of life cycle greenhouse gas emissions of meat, milk and eggs. There are large uncertainties associated with models used for emission estimates of nitrous oxide from soils and for carbon fluxes and emissions from land use and land use change. Improving emission estimates is absolutely essential to achieve better assessments of the many mitigation options suggested to reduce the livestock sector's impact on global warming.
Introduction
The rapidly growing global demand for meat and milk is garnering increased attention in the media and public discourse. The FAO report ‘Livestock's Long Shadow’ (Steinfeld et al., Reference Steinfeld, Gerber, Wassenaar, Castel, Rosales and de Haan2006) highlighted the greenhouse gas (GHG) emissions associated with animal production, estimating these at close to 18% of global GHG emissions. About 38% of the global land area is used for agriculture; around two-thirds of this is used for livestock feed, mostly pastures but also feed crops on arable land (Foley et al., Reference Foley, Ramankutty, Brauman, Cassidy, Gerber, Johnston, Mueller, O'Connell, Ray, West, Balzer, Bennett, Carpenter, Hill, Monfreda, Polasky, Rockström, Sheehan, Siebert, Tilman and Zaks D P2011). Losses of nitrogen (N) and phosphorus (P) lead to severe eutrophication problems in many regions of the world; livestock production systems generally have lower nutrient efficiency than crop systems. Half the annual global N surplus (the input less the uptake in crops and grazing) is emitted as reactive N (ammonia and nitrate), while half is denitrified (Bouwman et al., Reference Bouwman, Beusen and Billen2009). This implies that the animal sector is responsible for a major proportion of emitted reactive N. Several studies have highlighted the environmental impacts of the fast-growing global livestock sector (e.g. Steinfeld et al., Reference Steinfeld, Gerber, Wassenaar, Castel, Rosales and de Haan2006; Pelletier and Tyedmers, Reference Pelletier and Tyedmers2010). Dietary shifts in high-income countries – a reduction of overall intake of animal products – are increasingly discussed as a necessary mitigation option, cf. Foley et al., Reference Foley, Ramankutty, Brauman, Cassidy, Gerber, Johnston, Mueller, O'Connell, Ray, West, Balzer, Bennett, Carpenter, Hill, Monfreda, Polasky, Rockström, Sheehan, Siebert, Tilman and Zaks D P2011; Garnett, Reference Garnett2011; Wirsenius et al., Reference Wirsenius, Hedenus and Mohlin2011; Cederberg et al., Reference Cederberg, Hedenus, Wirsenius and Sonesson2013.
Calculating and assessing the numerous environmental impacts from livestock production requires a holistic approach. Life-cycle assessment (LCA) is a well-established method for analysing the environmental impact caused by a product or a service. The basic principle is to follow a product through its entire life cycle, that is, to have a whole supply-chain perspective. The product system studied is delimited from the surrounding environment by a system boundary. The energy and material flows crossing the boundary are accounted for as input related (e.g. resources) and output related (e.g. emissions to water and air). LCA is now standardized according to ISO 14040 and 14044 (ISO 2006a and 2006b). The first LCAs were carried out in the 1970s from energy analyses. For example, Coca Cola investigated the consequences of switching from glass bottles to aluminium cans (Baumann and Tillman, Reference Baumann and Tillman2004). In the 1990s, LCA started to be used in analysing agricultural systems, a European Union project to harmonize methodology was carried out (Audsley et al., Reference Audsley, Alber, Clift, Cowell, Crettaz, Gaillard, Hausheer, Jolliet, Kleijn, Mortensen, Pearce, Roger, Teuleon, Weidema and van Zejts1997).
In recent years, different GHG accounting methods have emerged. In the product-based perspective, these methods yield the product carbon footprint (CF), including the product's life-cycle GHG emissions. When calculating a CF, the principles of LCA are used, but the focus is on one major impact: the product's contribution to global warming. CFs of milk, meat and eggs are typically dominated by estimates of nitrous oxide and methane – with much greater uncertainty than estimates of carbon dioxide emissions from fossil fuels (Rypdal and Winiwater, Reference Rypdal and Winiwarter2001) – and emissions associated with land use.
Here we give an overview of methods for estimating GHG emissions presently used in LCA/CF studies of animal products. We discuss where methods and data availability for GHGs and N compounds most urgently need to be improved in order to produce more accurate environmental assessments of livestock production.
Emission profiles
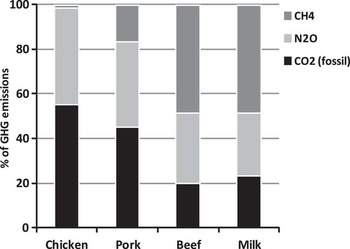
GHG emissions from land use change (LUC) have been included in LCA/CF studies of agricultural products only in recent years because of lack of uniform methodology as well as emissions from land use (LU), for example, effects of different soil management methods. Setting aside GHG emissions from land use and land use change (LULUC), which we will discuss later, nitrous oxide (N2O) and methane (CH4) originating from biological processes in soils, manure and livestock dominate the emissions profile of animal products. Figure 1 shows a typical distribution of GHGs emitted from primary production (cradle to farm gate) of poultry meat, pork, beef and milk in the developed world, here exemplified by average EU-27 production according to Weiss and Leip (Reference Weiss and Leip2012) not including land-related emissions.
Typical distribution of greenhouse gases (%) in meat and milk production in developed regions (average EU-27) based on a study conducted by Weiss and Leip (Reference Weiss and Leip2012). N.B. emissions from land use and land use change (LULUC) are not included.

Poultry production (chicken meat and eggs) is the only sector that has relatively low emissions of methane, whereas carbon dioxide (CO2) from the use of fossil fuels represents a significant GHG flux as well as N2O from soils. Feed production (including fertilizer use and production) and barn heating are important sources of these emissions. The CF of pork production is dominated by N2O from manure application, loss of reactive N and synthetic N fertilizer production and use, and CO2 from fossil fuels. Cattle production, resulting in milk and beef products, is dominated by CH4 from enteric fermentation, typically representing around half of total emissions in primary production (Figure 1).
Findings on emissions from animal production in one system/climate cannot simply be generalized to others. In milk production in New Zealand, an outdoor pasture system as opposed to an indoor system with pronounced use of concentrate feed (which is typical for north European milk production), the CH4 share is greater (>60%), while the N2O share of the CF is similar to North European systems (Flysjö et al., Reference Flysjö, Henriksson, Cederberg, Ledgard and Englund2011). This is explained by a lower milk yield per cow in New Zealand, leading to higher emissions from enteric fermentation per kilogram milk but, on the other hand, lower emissions from fossil fuels because of the pasture-based feeding strategy. Thoma et al. (Reference Thoma, Popp, Shonnard, Nutter, Matlock, Ulrich, Kellogg, Kim, Neiderman, Kemper, Adom and East2012) estimated emissions from dairy farms in five US regions; their findings indicate that CH4 from manure management represents a significantly higher share of the CF in the Midwest and Southwest because of the adoption of anaerobic lagoons and higher temperatures. Comparing a pasture-based beef system in South America with beef systems in western Europe reveals that CH4 from enteric fermentation dominates the emission profile of South American production even more than demonstrated in Figure 1 – up to 75% of total emissions – whereas CO2 from energy use stands for a minimal share of the CF of beef (Cederberg et al., Reference Cederberg, Persson, Neovius, Molander and Clift2011).
Livestock and manure
Ruminant enteric fermentation
Enteric CH4 is produced as a by-product of microbial fermentation in the rumen and large intestine of ruminants. When billons of rumen microbes break down cellulose into volatile fatty acids, hydrogen ions are released. To neutralize these ions, methanogenic bacteria form CH4. The amount of CH4 production is regulated by several parameters, for example, feed intake and structure, as well as nutrient composition. CH4 production also leads to a loss of about 6.5% of the cattle's gross energy intake (IPCC, 2006). Numerous studies have been carried out to find dietary strategies to reduce CH4 generation and energy loss while maintaining livestock productivity; the most promising alternatives appear to be adding fat to the diet, diets with higher starch content and use of some feed additives (Grainger and Beauchemin, Reference Grainger and Beauchemin2011). Diets with a high share of forage imply more CH4, but this also depends on forage digestibility (Patel et al., Reference Patel, Wredle, Börjesson, Danielsson, Iwaasa, Spörndly and Bertilsson2011).
Several models predict enteric CH4, from simple regression equations where CH4 is linked to one variable (e.g. gross energy intake in IPCC Tier 2; IPCC, 2006) or several variables (e.g. Kirchgessner, Reference Kirchgessner, Windish and Müller1995) to more complex mechanistic and stochiometric models that require significantly more detailed data (e.g feed data like digestion rate and content of soluble carbohydrates (Legesse et al., Reference Legesse, Small, Scott, Crow, Block, Alemu, Robins and Kebreab2011)). Simple regression equations are more user-friendly and included in many whole-farm models for calculating GHG emissions as well as used in LCA/CF studies.
Developing models that enable good predictions of enteric CH4 emissions seems difficult. Although current detailed mechanistic and stochiometric models generally perform better than simpler regression equations, they should be used with care when creating and evaluating different mitigation strategies (Alemu et al., Reference Alemu, Dijkstra, Bannink, France and Kebreab2011). Estimates of CH4 vary from model to model, so the choice of model is fundamental to the final GHG estimate for milk and beef. According to Ellis et al. (Reference Ellis, Bannink, France, Kebreab and Dijkstra2010), predictions by simple regression equations are generally poor, although they can be improved when some important dietary characteristics are included. Regression equations are mostly based on empirical studies of measured CH4 emissions and can include older data from production systems, animal genetics and feed ingredients that are not currently used today, for example, dried forage instead of silage, cf. Jentsch et al. (Reference Jentsch, Schweigel, Weissbach, Scholze, Pitroff and Derno2007).
The accuracy of emission models determines how well enteric CH4 is calculated in LCA/CF studies of ruminant production. There is obviously a conflict in combining good predictive power with user-friendly models that are the first choice for most LCA researchers. Using LCA methodology to compare GHG emissions from different dietary or management scenarios requires models that can finely resolve the CH4 differences among these. However, using mechanistic models requires detailed animal and feed data and the ability to run and evaluate a more complex model. Experts on ruminant diet and researchers working with environmental assessments of ruminant production systems need to collaborate closely to improve CH4 analyses which otherwise risk of leading to invalid mitigation strategies.
Manure
Manure contributes not only to release of GHGs but also to eutrophying and acidifying compounds. Reliable data on N excretion rates are important when calculating manure emissions, since both N2O and ammonia (NH3) loss are modelled starting from N production in excreted faeces and urine. In LCA/CF studies, national excreted N values can be used, but preferably these input data should be calculated from the actual N in feed intake and in products that would improve emission estimates of NH3 and N2O from manure. Determining feed intake and thus N-excretion rates is a special challenge in ruminant production where grass silage with varying dry matter and N content is often the major feed ingredient. Further difficulties are associated with estimating intake from grazing animals. The EU project REDNEX is developing a model that can facilitate accurate predictions of quantities of N excreted by dairy herds with a standardized methodology in EU countries (www.rednex.fp7.eu). The model will separately predict faecal and urinary N excreted, have a database on N content of several feed ingredients, and be accessible on the Internet. This is good example of a tool that will simplify emission estimates from the manure of ruminants; such a tool would be useful for other livestock categories.
NH3 emissions from manure are generally calculated with a mass flow approach following excreted N flow at different stages in the manure system: first divided between indoor maintenance/outdoor grazing, and, when excreted indoors, following the N flow further to storage and finally to manure application in the field (EMEP/EEA, 2010). NH3 emission factors (EFs) are developed, mostly for European conditions, for different stages, manure types and application techniques. However, there are data gaps for some EFs, and for some world regions, there are no or very few background experiments supporting EFs for the specific manure systems and climate in that region. For example, very few data are available on ammonia loss from urine and dung in pastures under tropical conditions despite the fact that grazing is the major feeding system in beef production, which is rapidly growing in South America (Cederberg et al., Reference Cederberg, Meyer and Flysjö2009). A few studies indicate high NH3 loss from urine applied on bare soils and Brachiaria grasses in Brazil (Boddey et al., Reference Boddey, Macedo, Tarré, Ferreira, de Oliveira, Rezende, Cantarutti, Pereira, Alves and Urquiaga2004), considerably higher than what EFs of manure from pasture in temperate conditions indicate. Even in well-developed nations surprisingly little research on NH3 emissions is published. Faulkner and Shaw (Reference Faulkner and Shaw2008) conducted a review of NH3, EFs for animal agriculture in the United States, showing that many of the factors used were based on European literature that originated in studies of animal production systems with climate and techniques unlike those in the United States. The review found an urgent need for region-specific NH3 EFs for US agriculture so that the impact of different NH3 volatilization mitigation techniques can be accurately evaluated.
CH4 emitted from slurry storage is a significant source of GHG from dairy and pork production. These emissions are typically calculated with Tier 2 models suggested by IPCC guidelines, including parameters for manure production (as volatile solids), a factor for the CH4 producing capacity of different manure types, and a methane conversion factor (MCF) that is given as a default value for different manure systems and specific annual average temperatures in the range 10°C to 28°C. However, country-specific values are recommended to improve estimates. Recent investigations of CH4 emissions from pig and cattle slurry storage in Mid Sweden (average annual temperature 8°C) showed MCF to be considerably lower, only 3% (Rodhe et al., Reference Rodhe, Abubaker, Ascue, Pell and Nordberg2012), which implies a substantially lower manure storage emissions estimate than the IPCC suggested default value of 10% yields. Anaerobic digestion is considered to be one of the most promising mitigation techniques in agriculture, therefore it is important to have reasonably accurate parameter data for calculating GHG emissions from manure storage. If the emissions are not so high in colder climate zones because of lower methane formation in the manure, as indicated by this recent research, biogas production is not necessarily an effective measure for cutting livestock production's overall GHG emissions.
Nitrous oxide
Direct soil emissions
The main source of N2O emitted from soils is denitrification. The biological processes in soils that form and release N2O are complex, and emission levels depend on local conditions, such as climate and soil properties, but also on farming practices, for example, N-fertilizer rates and regimes. Soil N2O loss is characterized by large spatial and temporal variations that are difficult to predict. A recent compilation of European field experiments in arable land and grassland showed emission levels ranging from 0.04 to 21.2 kg N2O-N/ha and year (Rees et al., Reference Rees, Augustin, Alberti, Ball, Boeckx, Cantarel, Castaldi, Chirinda, Chojnicki, Giebels, Gordon, Grosz, Horvath, Juszczak, Klemedtsson, Klemedtsson, Medinets, Machon, Mapanda, Nyamangara, Olesen, Reay, Sanchez, Sanz Cobena, Smith, Sowerby, Sommer, Soussana, Stenberg, Topp, van Cleemput, Vallejo, Watson and Wuta2012). N2O soil emissions represent a large share of the total GHG emissions in feed crop cultivation (van der Middelaar et al., Reference Van der Middelaar, Cederberg, Vellinga, Van der Werff and Boer2013). N2O is a very potent GHG, with a global warming potential (GWP) 300 times that of CO2 over a 100-year timeframe, therefore even a few kilogram emitted in crop cultivation may lead to higher GHG emissions in the feed's life cycle than important production inputs such as fossil energy and synthetic N fertilizers. The great variability in N2O emission levels and the uncertainty in emission estimates contribute to much of the uncertainty in GHG estimates of feed products.
Besides being a potent GHG, N2O also contributes to ozone depletion. Emissions of other anthropogenic ozone-depleting substances, for example, chlorine- and bromine-containing halocarbons, are steadily declining and have dropped significantly since the 1980s, whereas the levels of N2O emission are more stable (IPCC, 2007; Ravishankara et al., Reference Ravishankara, Daniel and Portmann2009). Today, N2O is the single most important substance among anthropogenic ozone-depletion emissions and will dominate in the future as ozone-depleting halocarbons are exhausted (Ravishankara et al., Reference Ravishankara, Daniel and Portmann2009). N2O is rarely included in assessments of the ozone-depletion potential in LCA, but the importance of considering N2O has been recognized (Lane and Lant, Reference Lane and Lant2012).
Simplified equations for calculating soil N2O loss are generally used in LCA/CF studies, predominantly the IPCC Tier 1 model (IPCC, 2006), according to which N2O emissions from managed soils are calculated from universal EFs multiplied by N input to soils via fertilizers, manure and crop residues, so-called direct N2O emissions, and emissions of reactive N (ammonia and nitrate), so-called indirect N2O emissions, respectively. These equations are simple to use, and the required input data are generally available. The disadvantage is that they fail to reflect any parameter other than N input, and they are not intended to be used at the field level to evaluate different management practices, for example, varying manure application techniques. In practice, the relation between N input and N2O emissions may be weak. The LCA community acknowledges the weaknesses of this simplified approach, and efforts are made to better estimate soil N2O emissions. For example, national adopted EFs have been used in LCA studies of feed and crop production (e.g. Biswas et al., Reference Biswas, Barton and Carter2008; van der Middelaar et al., Reference Van der Middelaar, Cederberg, Vellinga, Van der Werff and Boer2013) and of milk products (e.g. Flysjö et al., Reference Flysjö, Henriksson, Cederberg, Ledgard and Englund2011).
There are several process-based models for simulating soil N2O emissions, for example, the COUP model, DNDC (DeNitrification-DeComposition), DAYCENT (Daily Century Model) and CERES-EGC (Colorado State University, 2012; INRA, 2012; KTH, 2012; University of New Hampshire, 2012). CERES-EGC has been used to model N2O emissions in LCAs of fava bean and cereals (Goglio et al., Reference Goglio, Colnenne-David, Di Bene, Bosco, Laville, Roche, Ragaglini, Doré, Mazzoncini, Gabrielle and Bonari2012). The drawback of these advanced models is that they require detailed data on climate, soil and plant properties, and cultivation practices, and such detailed data are rarely attainable with reasonable effort in LCA studies.
LCA/CF studies of feed crop production would greatly benefit from better estimates of soil N2O emissions, for example, via collaborations among professional users of advanced emission models and LCA modellers. The probable shortage of input data, for example, detailed data from weather stations and on soil properties, poses a challenge. In addition, site-specific conditions may be of less interest in LCA/CF studies as these often intend to assess characteristic cultivation systems in a region/district rather than crops from specific fields. Another alternative is to develop user-friendly and widely accepted models that include more aspects than merely N input, preferably parameters that are associated with agricultural management practices. Since the purpose of many LCA/CFs is to assess potential differences in environmental performance among management practices, cropping systems, and fertilization regimes, it would be advantageous if models were to predict the probable average emissions from the system studied rather than reproducing the emissions in a single year because of the particular weather conditions that year.
Indirect N2O emissions
N2O is also produced indirectly through volatilization of NH3 and nitrate (NO3−) leaching. Consequently, good predictions of NH3 loss in the whole manure-handling chain are of importance since as much as 20% to 30% of excreted N can be lost as NH3. NO3− leaching is closely associated with feed crop cultivation, and the formation of N2O from this leaching can contribute significantly to a feed product's CF. Van der Middelaar et al. (Reference Van der Middelaar, Cederberg, Vellinga, Van der Werff and Boer2013) evaluated methods and data sources for a feed's CF investigating six major feed ingredients with LCA data from three European countries. There was no consensus on models used for estimating NO3− leaching, which increased the uncertainty when comparing a feed's CF between the three countries. According to IPCC guidelines, a simplified method assumes that a fixed fraction of applied fertilizer and manure is lost. This is very far from the actual complex situation in which many factors determine the leaching. Here, the LCA researchers are in real need of improved methods.
LULUC
Soil carbon changes
Cumulatively since the pre-agricultural era, soils have lost 150 to 330 Gt CO2 globally because of cultivation and disturbance (Smith, Reference Smith2012). This is largely an effect of LUCs and poor management methods in agriculture. A meta-analysis indicates that soil C stocks decline (i.e. CO2 is emitted) after LUC from pasture to forest plantation (−10%), native forest to forest plantation (−13%), native forest to crop (−42%) and pasture to crop (−59%). C stocks instead increase through soil C sequestration in conjunction with LUC when converting from native forest to pasture (+8%), crop to pasture (+19%), crop to forest plantation (+18%) and crop to secondary forest (+53%) (Guo and Gifford, Reference Guo and Gifford2002). A reasonable summary is that when ecosystems based on perennial vegetation such as pasture and forests are converted into annual crops, this leads to loss of soil organic carbon (SOC) and thus CO2 emissions.
Effects of soil carbon changes (negative = CO2 emissions; positive = soil C sequestration) because of LULUC are very rarely included in LCA/CF studies of agrifood products. Models for assessing soil organic matter dynamics are needed to provide reliable predictions of the size and change of soil C stocks for different soil types with varying management practices, for example, tillage practices, crop rotations, manure and fertilizer application and climate regimes. A number of models are available, but further development is needed in this dynamic research area. For example, soil structure should be incorporated in models, SOC content up to 1 m down should be modelled (most models only include top soils), and management factors, such as tillage, that influence crop residue and SOC depth distribution should be included (Stockmann et al., Reference Stockmann, Adams, Crawford, Field, Henakaarchchi, Jenkins, Budiman, McBratney, de Remy de Courcelles, Singh, Wheelera, Abbott, Angers, Baldock, Birde, Brookes, Chenu, Jastrow, Lal, Lehmann, O'Donnell, Parton, Whitehead and Zimmermann2013).
Vellinga and Hoving (Reference Vellinga and Hoving2011) investigated the effect of dairy cattle feed by replacing pasture and grass silage with maize silage of high digestibility to reduce enteric CH4 emissions. They modelled soil C changes when ploughing grassland for converting it into annual silage maize cropping to produce a feed with higher digestibility. However, when accounting for SOC changes because of decreasing soil C stocks when converting grassland into cropland and the loss of grassland's sequestration potential, CO2 emissions were much larger than the annual mitigation from feeding more maize. LCA/CF studies of poultry and pork production have underestimated GHG emissions since mono-gastric production systems heavily depend on annual crops (grain and pulses) often grown in monoculture and annual cropping systems. However, ruminant production systems, where a large share of the feed base is pasture, have not been credited the C sequestration potential in permanent grassland; thus their emissions have been overestimated, at least relative to systems that rely more on annual crops. There is a now a strong interest in including SOC in LCA/CF studies. As is the case with estimates of N2O from soils and CH4 from enteric fermentation, it is very much a question of choosing a model that is reasonably user-friendly when it comes to the balance of data requirement and sufficient accuracy.
Deforestation
At present, global carbon emissions from LUC are estimated at 3.7 (±1.8) Gton CO2 per year averaged for the decade 2002 to 2011, corresponding to 9% of total CO2 emissions in 2011 (www.globalcarbon.com). These large amounts of GHGs have historically not been included in LCA/CF studies of animal products. In recent years, studies have been published that test and demonstrate different methods for attributing LUC-based emissions to meat and milk production systems, (e.g. Gerber et al., Reference Gerber, Vellinga, Opio, Henderson and Steinfeld2010; Cederberg et al., Reference Cederberg, Persson, Neovius, Molander and Clift2011; Ponsionen and Blonk, 2012; Weiss and Leip, Reference Weiss and Leip2012). Owing to the great complexity of the link between LU and deforestation, there is still no established consensus methodology on how to account for these impacts. Moreover, data gaps and uncertainties thwart robust estimates.
When a natural ecosystem, for example, a tropical rainforest, is transformed into new agricultural land, carbon is typically emitted in conjunction with forest burning, biomass decay and decreased soil carbon stocks. Forest carbon stock estimates have high variability. For example, investigations in Mato Grosso, Brazil, found a variability of more than two-fold in stock estimates (Morton et al., Reference Morton, Sales, Souza and Griscom2011). A review of studies estimating indirect LUC (iLUCs) associated with biofuel production found a large variation in estimates of forest carbon stocks among studies, contributing to the uncertainty in iLUC accounting (DG; Energy, 2010). The size of the deforested area is another source of uncertainty. Brazil is considered to have one of the best monitoring programmes for deforestation, yet a 20% uncertainty in annual deforestation rate was found in the Mato Grosso study (Morton et al., Reference Morton, Sales, Souza and Griscom2011). Increased knowledge of LU after deforestation is vital as carbon losses for cropland are potentially higher than for pasture, perennial plantation or secondary forests (Morton et al., Reference Morton, DeFries, Shimabukuro, Anderson, Arai, del Bon Espirito-Santo, Freitas and Morisette2006). This is important not only when calculating emissions but also for improving our understanding of forces driving deforestation.
In addition to problems with the data, methodology issues need to be sorted out. If indeed we have a decent estimate of GHG emissions caused by a deforestation event, the emissions should be distributed over time and products. Allocation over time, over an ‘amortisation period,’ distributes the calculated emissions over, typically, 20 years of production. Beyond that, emissions from the deforestation event no longer burden the products from the deforested land. Allocation over products means distributing the emissions over the commercial products that are the result of the deforestation and produced on the converted land. Selected logging of valuable trees is often practised before the forest is burned. So far, only a few studies have considered timber outtake when distributing LUC emissions over products (Cederberg et al., Reference Cederberg, Persson, Neovius, Molander and Clift2011; Ponsionen and Blonk, 2012), instead allocating all emissions to agricultural products (e.g. Gerber et al., Reference Gerber, Vellinga, Opio, Henderson and Steinfeld2010; Weiss and Leip, Reference Weiss and Leip2012).
Presently, various methods for including LUC emissions in LCA/CF studies of food products are presented in the scientific literature. Basically, there are now two quite opposite approaches: a product-based and a land-based approach. The product-based approach puts an LUC factor on product(s) that are directly responsible for deforestation based on area expansion over a given time period, (cf. Gerber et al., Reference Gerber, Vellinga, Opio, Henderson and Steinfeld2010; Cederberg et al., Reference Cederberg, Persson, Neovius, Molander and Clift2011; Weiss and Leip, Reference Weiss and Leip2012) which entails that soybeans and beef produced in South America have quite high LUC emissions (since soybeans and pasture for beef have led to expanding agricultural land) while European produced cereal crops have no LUC emissions (as cropland does not expand in Europe). The argument for a land-based approach is that any occupation of an area of land is responsible for deforestation, no matter if it takes place in Brazil or Europe, and therefore a general LUC factor should be put on land in agricultural production (Schmidt et al., Reference Schmidt, Reinhard and Weidema2012).
Applying these two approaches can give very different results in LCA/CF studies as exemplified by Flysjö et al. (Reference Flysjö, Cederberg, Henriksson and Ledgard2012) comparing GHG emissions from conventional and organic milk including LUC emissions. Organic milk showed a lower CF (compared with a high-yielding conventional system) when LUC-factors for soymeal were included, as less soy per kilogram milk was used in the organic system. However, when assuming that all land occupation is responsible for LUC (land-based approach), the organic system had a higher CF (compared with the high-yielding conventional system), as more land is required to produce organic milk. Owing to the lack of a consensus methodology and research work in progress in testing methods, it is important that emissions associated with LUC are presented separately from the other GHGs and that underlying assumptions and methods are explained transparently.
Fossil fuels
Calculating GHG emissions from fossil fuels, most importantly diesel fuel and synthetic fertilizers, is a relatively simple operation as there are reliable and relatively certain data on emissions associated with production and use of these inputs. However, difficulties arise in how to get accurate input data on the quantities used in different animal production systems, where feed production, processing and transports are highly dependent on fossil fuels. When GHG emissions are reported in national inventories, use of energy in the agriculture sector is listed in the energy sector, making it difficult to separate the agricultural sector's use and emissions with high certainty. In most LCA/CF studies, farm energy use is modeled and a critical review of the accuracy of input data is important. In a Danish study, which measured actual diesel fuel use on commercial farms to validate a farm energy model, Dalgaard et al. (Reference Dalgaard, Halberg and Porter2001) found a systematic underestimate of energy used for transportation and handling of roughage crops and manure in present models of livestock farms.
Production of synthetic N fertilizer represents a major energy cost and GHG emission source in feed crop cultivation. The data on process-based emissions are relatively reliable compared with the state of knowledge of N fertilizer rates at commercial farms. Henriksson et al. (Reference Henriksson, Flysjö, Cederberg and Swensson2011) analysed variations in production parameters in Swedish milk production using data from more than 900 dairy farms, showing a variation in N fertilizer rates between 0 and 250 kg N/ha. Higher livestock density means greater access to manure, and therefore lower need for N fertilizers, but they found no correlation between N fertilizer rate and livestock density.
Trade of animal products, as well as cereals and oilseed for feed, has increased significantly over the last two decades. This development is projected to continue (Guyomard et al., Reference Guyomard, Manceron and Peyrand2013). Increased trade implies increased transports and processing of feedstuff; there is an obvious need for research on the effect on overall energy use in animal production, most importantly for pork and poultry.
Conclusions
The last decade has seen an increase in environmental systems analysis of livestock production, resulting in a significant number of studies with a holistic approach often based on LCAs. The growing public interest in global warming has added to this development; guidelines for CF accounting have been developed, including for GHG accounting of animal products. The growing literature on the environmental impact of livestock production has contributed significantly to improved knowledge of emissions and resource use in different production systems, environmental hot-spots in the animal food chain, and where improvements are most urgent.
We are entering a new phase in the use of environmental systems analysis in agricultural production. The past 10 years have given us a general broad understanding of the ‘big picture’ of GHG emissions from the livestock sector. We now need to deepen our understanding of biological processes in soil, manure and livestock and to implement this knowledge in models that more accurately describe processes and emissions. Improving our emission estimates is absolutely essential to achieve better assessments of the many mitigation options suggested in the livestock sector. Policy makers need such assessments to develop appropriate policies, for example, when choosing technologies to support or designing tax policy for GHG emissions from the agriculture sector. Consumers and business-to-business communications increasingly rely on CF information.
We believe that the top priority is to improve models for N fluxes and emissions from soils and to implement soil carbon change models in LCA/CF studies of animal products. The rough models generally used to estimate soil N2O (mostly the IPCC guidelines Tier 1) fail to accurately distinguish the mitigation potentials of N management alternatives in crop production systems. In addition, loss of reactive N in the form of ammonia and nitrate is extensive from many animal production systems, causing environmental impacts that are far-reaching. Implementing adequate measures to decrease these impacts requires increasing our understanding of N emissions from soils and manure. Enteric CH4 is a major GHG from global animal agriculture, however we believe that emissions models used are less uncertain and better with respect to CH4 than the ones estimating reactive N. Estimates of CO2 from LULUC is obviously a very dynamic research field, fueled by interest in assessing biofuel production, and also of great interest for LCA/CF studies of animal products.
Industrialized nations are over-represented in studies of GHG emissions from agriculture, biasing global estimates. Climate, soils, management techniques and other factors that affect emissions differ significantly among regions. There is a great need for more and better data on fundamental farm management (e.g. manure handling methods, feed rations) in developing countries as well as more studies measuring emissions from soils, manure and livestock beyond industrialized nations. Future growth in agricultural production is predicted to take place in the developing world, and better basic knowledge of farm management methods and nutrients and GHG emissions is vital here.
Even if we manage to improve GHG and N emission models in agriculture, we will never fully succeed to include the overall complexity that is inherent in biological systems in soils and livestock. Further uncertainties and variation in production data from livestock systems cannot be fully avoided since agricultural production often takes place on many small production sites (farms) as opposed to industrial production. We need to use more statistical analysis in LCA/CF studies of agricultural production to handle the uncertainty and variations, and those who interpret and use the results must better understand that LCA/CF studies cannot deliver ‘exact’ numbers on environmental impacts; estimate ranges need to be interpreted and understood when results are presented.
We are convinced that more cooperation among LCA/CF modellers and specialist agriculture/livestock researchers is essential to further improve the holistic understanding of the environmental impact of agriculture. We need to recognize that LCA/CF methodology, software and databases have developed extensively over the past year.
Finally, despite the large uncertainties associated with estimates of biogenic GHG emissions (N2O, CH4 and non-fossil CO2), there is robust, consistent information from the many LCA/CF studies published so far on how to reduce the environmental impact from livestock production: 1. Reduce and stop deforestation associated with expansion of agricultural land for feed crops and pasture as this is associated with large GHG emissions and also considerable biodiversity loss; 2. Improve N management to significantly reduce reactive N emissions and input of synthetic fertilizers that result in GHG emissions and also eutrophication problems; and 3. Reduce the use and dependency of fossil fuels in feed cultivation, processing and transports to reduce CO2 emissions and the extraction of fossil resources.
Acknowledgement
We want to acknowledge the help with language editing from Paulina Essunger.
This paper was published as part of a supplement to animal, publication of which was supported by the Greenhouse Gases & Animal Agriculture Conference 2013. The papers included in this supplement were invited by the Guest Editors and have undergone the standard journal formal review process. They may be cited. The Guest Editors appointed to this supplement are R. J. Dewhurst, D. R. Chadwick, E. Charmley, N. M. Holden, D. A. Kenny, G. Lanigan, D. Moran, C. J. Newbold, P. O'Kiely, and T. Yan. The Guest Editors declare no conflict of interest.