

INTRODUCTION
Phosphorus and nitrogen supply limit primary production in many natural and agricultural ecosystems (Schlesinger Reference SCHLESINGER1997). Broadly speaking, ecosystems in the temperate zone are more likely to be limited by N and have stores of weatherable P in rock, whereas ecosystems on older soils in the wet tropics often are richer in N but depleted in P (Vitousek & Howarth Reference VITOUSEK and HOWARTH1991, Vitousek et al. Reference VITOUSEK, PORDER, HOULTON and CHADWICK2010). The cycles of N and P are not independent – biological activity substantially (but imperfectly) brings them into alignment (Houlton et al. Reference HOULTON, WANG, VITOUSEK and FIELD2008, Vitousek Reference VITOUSEK2004). Understanding where and how organisms bridge these cycles contributes to understanding global patterns of nutrient limitation.
Organisms can serve as bridges between the P and N cycles, and biological N fixation is one such bridge. Natural variation in P availability has been shown to influence N-fixation rates (Reed et al. Reference REED, CLEVELAND and TOWNSEND2008), while additions of P to ecosystems often stimulate the growth and activity of N-fixing organisms (Crews Reference CREWS1993, Eisele et al. Reference EISELE, SCHIMEL, KAPSUTKA and PARTON1989, Reed et al. Reference REED, SEASTEDT, MANN, SUDING, TOWNSEND and CHERWIN2007a, Schindler Reference SCHINDLER1977, Smith Reference SMITH1992, Vitousek Reference VITOUSEK1999). In such sites, potential N fixers may be limited by the supply of P, while most other organisms are limited by N (Houlton et al. Reference HOULTON, WANG, VITOUSEK and FIELD2008, Menge & Hedin Reference MENGE and HEDIN2009, Vitousek & Field Reference VITOUSEK and FIELD1999, Vitousek & Howarth Reference VITOUSEK and HOWARTH1991). Additions of P could stimulate the fixation of atmospheric N2 in at least three ways (not mutually exclusive): (1) by increasing the overall population size of N fixers (assuming that they are actively fixing N), (2) by increasing the rate of N-fixation per individual, and (3) by shifting community composition from species that fix at low rates to those that fix at high rates, without any change in the overall number of N fixers or individual fixation rates (Reed et al. Reference REED, TOWNSEND, CLEVELAND and NEMERGUT2010). Also, P additions could have little or no effect on N-fixation, as has been observed in some studies (Reed et al. Reference REED, CLEVELAND and TOWNSEND2007b).
Nitrogen-fixing lichens (cyanolichens, a symbiosis between fungi and cyanobacteria (usually Nostoc spp. but Scytonema spp. in some lichen genera)) may be particularly tractable for understanding the mechanisms underlying increased N fixation in response to P additions. Cyanolichen populations can respond relatively quickly to an increase in P supply (Benner & Vitousek Reference BENNER and VITOUSEK2007), and species can be identified and individual lichen fixation rates measured relatively straightforwardly. In a long-term fertilization experiment in a montane Hawaiian forest, additions of P to the forest floor led to substantial increases in the population size of epiphytic N-fixing lichens (Benner & Vitousek Reference BENNER and VITOUSEK2007). P-fertilization also caused a shift in cyanolichen community composition, from dominance by crustose lichens in the genera Parmeliella and Coccocarpia in unfertilized forest to dominance by large, leafy lichens in the family Lobariaceae (mainly Pseudocyphellaria and Sticta species) with added P.
In this study, we ask whether additions of P cause meaningful increases in N inputs to the forest by the cyanolichen community. We test the following hypotheses: (1) The cyanolichens are fixing N. (2) N fixation rates vary across species, with the shift in community composition to large, leafy lichens influencing N inputs to the forest independent of overall increases in cyanolichen abundance. (3) The very high P levels in the canopy stimulate fixation rates of individual cyanolichens in the community. (4) The additions of P increase overall N inputs to the ecosystem.
METHODS
Site description
We used a fertilization experiment in montane forest at 1134 m asl on the island of Kaua'i, the oldest island in the Hawaiian chain. The forest is dominated by Metrosideros polymorpha Gaud. (Myrtaceae), which comprises 88% of the basal area and has a mean canopy height of 13.7 m (Crews et al. Reference CREWS, KITAYAMA, FOWNES, RILEY, HERBERT, MUELLER-DOMBOIS and VITOUSEK1995). Mean annual precipitation is ~2500 mm and is roughly evenly distributed throughout the year. The soil is a highly weathered Oxisol derived from volcanic tephra approximately 4.1 million y old (Crews et al. Reference CREWS, KITAYAMA, FOWNES, RILEY, HERBERT, MUELLER-DOMBOIS and VITOUSEK1995). Since 1991, 15 × 15-m plots have been fertilized with N, P at a rate of 100 kg P ha−1 y−1, and other essential plant nutrients (the ‘total’ treatment, T, including sulphur, cations and micronutrients but not N or P) in a factorial replicated block design (Herbert & Fownes Reference HERBERT and FOWNES1995), and measurements of tree growth have demonstrated that P represents the primary limitation to forest productivity (Harrington et al. Reference HARRINGTON, FOWNES and VITOUSEK2001, Herbert & Fownes Reference HERBERT and FOWNES1995).
Acetylene reduction measurements of lichens from P-fertilized forest
To test whether lichens from P-fertilized forest were actively fixing N, we collected lichens in the field and assayed them for acetylene reduction activity (ARA, Hardy Reference HARDY, HOLSTEN, JACKSON and BURNS1968) in a laboratory in Volcano, Hawaii, in July 2006. We collected seven individuals of each of the 14 most common cyanolichen species from the upper branches of the P-fertilized forest canopy, climbing the trees using arborist double-rope technique (Dial & Tobin Reference DIAL and TOBIN1994). For all species but two, samples were collected from trees in all three P-fertilized plots (Pannaria lurida and Leptogium denticulatum were collected from trees in only two plots). Lichens were stored in ventilated plastic containers in the shade during sample collection, then transported in coolers to the laboratory. Within 10 h of collecting the first lichen, all lichens were placed in 130-ml glass jars, saturated with deionized water to greater than 400% water content, and allowed to sit overnight outside in the dark at a temperature of 13.5 °C.
Five samples for each species were injected with high-purity acetylene to 10% volume, vented to atmospheric pressure and placed outside to incubate in low light. Two additional samples per species were used as controls for ethylene production and consumption, as either endogenous production or consumption of ethylene by the lichens would affect our estimates of acetylene conversion to ethylene by nitrogenase (the basis of the ARA assay). To control for ethylene production, we incubated a lichen in a jar without acetylene, and to control for ethylene consumption we injected a known quantity of ethylene (and no acetylene) into a jar. No species produced or consumed ethylene.
The temperature during the incubations was 17 °C. After 3 h, 6 ml of gas was withdrawn from the jars and immediately analysed for ethylene content on a Shimadzu GC-8A gas chromatograph (Shimadzu Corporation, Columbia, Maryland, USA) with a flame ionization detector and Poropak N column (Waters Associates, Framingham, Massachusetts, USA). Rates of ethylene produced were standardized to the surface area of each lichen incubated, which was estimated by measuring the two major axes of each lichen and calculating the area of either a rectangle or ellipse, depending on the shape of the sample.
15N calibrations of acetylene reduction measurements
Acetylene reduction rates were converted to rates of N fixation by measuring 15N2 fixation and calculating the ratio of acetylene reduced to 15N2 fixed (Burris Reference BURRIS and Quispel1974). Four foliose species (N = 5 for Sticta beauvoisii, Lobariella crenulata and Leptogium denticulatum; N = 10 for Pseudocyphellaria crocata) were chosen to provide a representative selection from the epiphyte community, as well as for ease in separation from bark. For each of the 30 lichen species found in the canopy of P-fertilized forest, we assigned one of these four 15N2 calibration species, and used its N2/AR ratio to calibrate the acetylene reduction rates. The assignment was based on similarity of morphology – L. denticulatum for all ‘jelly lichens’ (Collema and Leptogium species), L. crenulata for tripartite lichens (L. crenulata and Pseudocyphellaria aurata), P. crocata for P. crocata and Pseudocyphellaria argyracea, and S. beauvoisii for all other species.
Each 15N2 lichen sample was incubated for 3 h in a 15N-rich atmosphere: jars were evacuated to 50.7 kPa of pressure, and then injected with a mixture of 20% (by volume) oxygen and 80% 99 atom per cent 15N2 gas (Icon Isotopes, Summit, New Jersey) to 101.3 k Pa of pressure. After 3 h, the jars were uncapped and then injected with acetylene along with the rest of the ARA samples. After the AR incubations, the 15N-incubated samples were dried at 65 °C for 3 d, weighed, and ground to a powder in a ball mill. δ15N for these samples was determined on a stable isotope ratio mass spectrometer in the Carnegie Department of Global Ecology in Stanford, CA, USA.
15N natural abundance
While the laboratory AR and 15N2 assays provided a measure of potential to fix N, they do not necessarily indicate the extent to which cyanolichens rely on N-fixation in the field. In an attempt to determine the source of N to cyanolichens, we measured the δ15N of cyanolichens and non-N-fixing epiphytes in the fertilization experiment. Under some conditions, the natural abundance of N isotopes can be used to determine how much N is acquired by fixation (Shearer & Kohl Reference SHEARER and KOHL1986), with organisms relying strictly on fixation having δ15N signatures close to 0‰ (the δ15N of atmospheric N2). Consequently, we expected that cyanolichens would have δ15N signatures closer to 0 than non-N-fixing epiphytes, whose 15N signatures should reflect that of atmospheric deposition and leaching from host tree tissues. However, we do not have a clear idea of what these other end-members (atmospheric deposition and host tree leaching) are, so these measures are exploratory.
In July 2006, we collected five specimens each of the cyanolichens S. beauvoisii, L. denticulatum, L. crenulata and P. crocata from the upper canopy of P-fertilized M. polymorpha. Two species of bryophyte (N = 7 overall) were collected from the upper canopy of M. polymorpha in the control plots of the fertilizer experiment. Lichens with a green algal symbiont (chlorolichens) generally did not occur in control-plot M. polymorpha, and so we collected them from the subcanopy trees Melicope clusiifolia (A. Gray) T.G. Hartley & B.C. Stone, Psychotria sp. and Wikstroemia oahuensis (A. Gray) Rock in the control plots (seven species, N = 7 for each). All bryophytes and chlorolichens were collected from trees that did not host cyanolichens to exclude the possibility that their 15N signatures were influenced by cyanolichen-fixed N that had leached into stemflow. In addition, we collected three specimens of the chlorolichen Usnea sp. (growing on M. polymorpha) from a cloud-bathed cliff edge 1 km away from the fertilization site, because we expected its δ15N would most closely reflect that of atmospheric deposition.
Acetylene reduction assay of lichens from a reference forest
To investigate whether the N fixation rates of P-fertilized forest lichens were stimulated by the very high canopy P availability, we measured ARA of cyanolichens collected from nearby unfertilized forest. We identified a site approximately 0.6 km from the fertilized forest that had many of the same species as those in the P-fertilized forest; we could not use the control plots of the fertilization experiment because few cyanolichen species occurred there. A previous study showed that ARA rates of P. crocata were severely depressed in the control plots (Benner et al. Reference BENNER, CONROY, LUNCH, TOYODA and VITOUSEK2007), but other species are too sparse to collect. The unfertilized reference forest we used is similar in most respects – forest structure, composition, elevation and age – to the ones receiving fertilizer treatments, but it has higher (and more variable) foliar P than the experimental site, and more cyanolichens (Benner Reference BENNER2011). Mean canopy openness at this site (measured at the base of each tree from which we collected cyanolichens, N = 16) was 18% ± 1.0%, as compared with 17% ± 0.5% in the P-fertilized forest (Benner Reference BENNER2011, Benner & Vitousek Reference BENNER and VITOUSEK2007), and the canopy was shorter than at the P-fertilized site (mean canopy height of 6.4 ± 0.4 m). Trees from which cyanolichens were collected at this site had foliar P concentrations ranging from 0.061% to 0.139%, with a mean of 0.085% ± 0.007% (Benner Reference BENNER2011) – versus a mean of 0.055% ± 0.002% for foliar P in control plots of the fertilized forest. In November 2006, we collected all cyanolichen species for which we had ARA measurements from P-fertilized forest – 10 out of the 14 species. For each species, five replicates were collected from the upper-canopy branches of a different tree (except for L. crenulata and Sticta tomentosa, for which two of the five samples came from the same tree). All lichens were stored, transported and assayed for ARA as described above. The conditions during the assays were identical as for the P-fertilized lichens, except that the temperature during the incubations was 15 °C.
Calculating annual N inputs from cyanolichens to P-fertilized forest
To calculate N inputs to the P-fertilized forest from the cyanolichen community we used a simple equation: Annual N input = (Lichen surface area) × (N fixation rate per unit area) × (Fraction of year spent fixing). To determine the surface area covered by each species in P-fertilized forest, we used abundance data from Benner & Vitousek (Reference BENNER and VITOUSEK2007), in which we measured per cent cover of all cyanolichen species on eight canopy M. polymorpha trees per treatment. We then converted per cent cover values to bark surface area covered by multiplying them by the total M. polymorpha surface area per unit stand area, calculated as described in Benner et al. (Reference BENNER, CONROY, LUNCH, TOYODA and VITOUSEK2007).
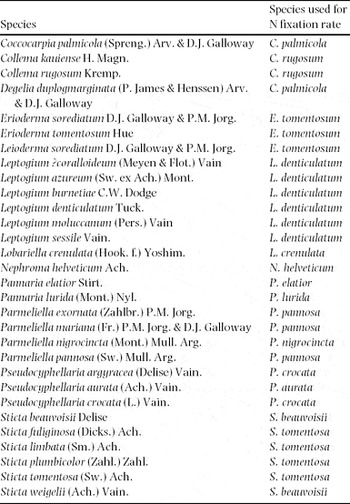
We multiplied these surface areas for each species in the community by either the 15N-calibrated fixation rate measured by ARA (14 species) or that of the most similar species for which we did measure ARA (16 species, Table 2). For these 16 species, we chose the most similar species (phylogenetically); in nearly all cases it was possible to use ARA rates from a member of the same genus. We assumed that the rates measured in laboratory incubations also apply to wet lichens in the field. This assumption is questionable as temperature, light and thallus water content all affect fixation rates (Antoine Reference ANTOINE2004, Kershaw Reference KERSHAW1985, Kurina & Vitousek Reference KURINA and VITOUSEK2001), but we suspect it is a conservative assumption here. Fixation rates are known to decline at night in some species as carbon reserves are depleted and not replaced by photosynthesis (Kershaw et al. Reference KERSHAW, MACFARLANE and TYSIACZNY1977, MacFarlane et al. Reference MACFARLANE, MAIKAWA, KERSHAW and OAKS1976). The lichens in our laboratory assays had spent the preceding 24–30 h moist and in darkness, and so the measured rates are likely lower than average rates throughout the year. Because they were still fixing at the time of the assays, we assume in our calculations that lichens fix N at night in the field (Antoine Reference ANTOINE2004, Denison Reference DENISON, Gordon, Wheeler and Perry1979).
We estimated the proportion of time lichens would be wet (and so fixing N) using a rain gauge approximately 3.5 km leeward of the site, where mean annual rainfall is approximately 1750 mm (Giambelluca et al. Reference GIAMBELLUCA, NULLET and SCHROEDER1986). Assuming that every rain event is sufficient to wet the lichens completely, and that lichens remain wet (and so physiologically active) for 1 h after the end of each event (Antoine Reference ANTOINE2004), we calculated the time a lichen would spend wet for each of the 6 y from 2000 to 2005, the years for which the rain gauge record is most complete. These values ranged from 11.5% to 23.2%, with a mean of 16.5% ± 1.6% of the year being sufficiently wet for N fixation. We adjusted these results to the experimental site, which has a wetter mean annual precipitation of 2500 mm, by multiplying the value at the rain gauge (16.5%) by 1.4 (2500 mm/1750 mm) to yield 23.5%. While we do not know how the additional 750 mm of rain at the fertilization site is distributed, we use 23.5% as our best estimate of the fraction of a year a lichen would be wet at this site. We calculated fluxes to P-fertilized forest assuming lichens were fixing 16.5%, 23.5% and 50% of the time – assuming 50% provides an upper bound for N inputs by the cyanolichen community. We suspect the actual value may be between 23.5% and 50%, as cloud-water deposition represents an increasingly important fraction of both total water input and time in wetter sites within Hawaiian montane forest (Carrillo et al. Reference CARRILLO, HASTINGS, SIGMAN and HUEBERT2002). We also calculated flux estimates to control plots of the fertilization experiment using the same method.
Statistics
Nitrogen fixation rates were compared across all 14 species from P-fertilized forest using one-way ANOVA followed by a Tukey HSD post hoc test, to determine if there were differences among species in fixation rates. For the 10 species for which we had specimens from both control and P-fertilized forest, we compared fixation rates between the control and P-fertilized samples using unpaired t-tests. δ15N natural abundance signatures were compared among the three functional groups (cyanolichens, chlorolichens and bryophytes) using one-way ANOVA. All analyses were done using the program R (http://www.R-project.org); the significance level for all tests was P < 0.05.
RESULTS
N fixation rates for P-fertilized lichens
The ratio of acetylene reduced to N fixed was 9.3 ± 2.4 for L. denticulatum, 5.9 ± 0.5 for L. crenulata, 6.5 ± 0.3 for S. beauvoisii and 2.4 ± 0.4 for P. crocata.
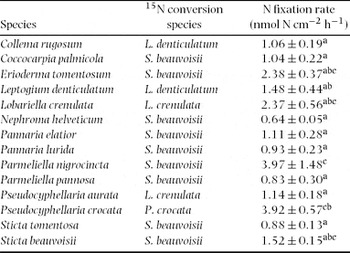
All lichen species assayed had positive rates of N fixation (reported here as ARA corrected by 15N2 fixation) (Table 1). One-way ANOVA yielded significant differences among fixation rates of P-fertilized lichens, ranging from 0.64 ± 0.5 nmol N cm−2 h−1 in Nephroma helveticum to 3.97 nmol N cm−2 h−1 in Parmeliella nigrocincta (mean = 1.66 ± 0.10, P < 0.001), driven by high fixation rates in Parmeliella nigrocincta and Pseudocyphellaria crocata. Aside from these two species, the remaining 12 species from P-fertilized forest did not differ significantly in fixation rates (Table 1).
N fixation rates of the 14 most common cyanolichen species (see Table 2 for species authorities) from the canopy of P-fertilized forest, Koke'e (N = 5 per species). Also shown are which of the four 15N calibration species were used to convert acetylene reduction rates to N fixation rates. Letters denote significant differences in a Tukey's HSD post hoc test (P < 0.05).

Cyanolichen species in the canopy of P-fertilized forest on Kauai, and which species’ N fixation rate was used for calculating N inputs to the ecosystem. All species are foliose in morphology except for Coccocarpia and Parmeliella spp., which are closely appressed/crustose.

15N natural abundance patterns
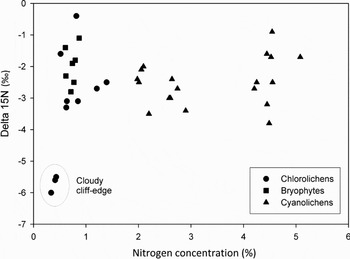
We did not observe substantial differences in δ15N among cyanolichens, chlorolichens and bryophytes (Figure 1). The mean δ15N of cyanolichens was −2.5‰ ± 0.2‰, whereas that of bryophytes and chlorolichens was −2.0‰ ± 0.2‰ and −2.5‰ ± 0.4‰, respectively. The δ15N values of the three Usnea lichens from the cloudy cliff edge are between −5‰ and −6‰.
δ15N natural abundance of epiphytic cyanolichens, chlorolichens and bryophytes in Kauai montane forest plotted versus their N concentration (% N by mass). Cyanolichens were collected from the canopy of phosphorus-fertilized forest. There were no significant differences between the three groups (P = 0.72) in δ15N. The three chlorolichens with depleted 15N signatures were collected 1 km away from the fertilization site on a cliff-edge that experiences frequent cloud.

Comparison of P-fertilized N-fixation rates to reference N-fixation rates
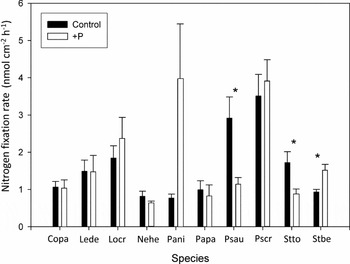
The reference-forest lichens did not have significantly lower fixation rates than the P-fertilized ones (Figure 2). For one species, Sticta beauvosii, the P-fertilized samples had higher fixation rates, while for two other species (P. aurata and Sticta tomentosa), the unfertilized fixation rates were higher.
Nitrogen fixation rates per lichen area of the 10 species that occurred in both phosphorus-fertilized forest in the fertilization experiment and the unfertilized forest where species were collected for reference rates. There are no consistent differences between the two groups – phosphorus-fertilized lichen rates are higher than control rates for only one species (S. beauvoisii, P < 0.05), and for two species (Pseudocyphellaria aurata and Sticta tomentosa), reference lichen rates are higher (P < 0.05). Copa – Coccocarpia palmicola, Lede – Leptogium denticulatum, Locr – Lobariella crenulata, Nehe – Nephroma helveticum, Pani – Parmeliella nigrocincta, Papa – Parmeliella pannosa, Psau – Pseudocyphellaria aurata, Pscr – Pseudocyphellaria crocata, Stto – Sticta tomentosa, Stbe – Sticta beauvoisii.

Estimate of N inputs to the forest by cyanolichens
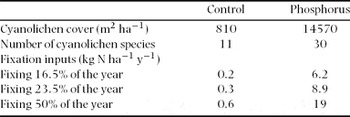
Our best estimate of fixation inputs by cyanolichens in P-fertilized forest is 9 kg N ha−1 y−1 (Table 3). This estimate assumes that the lichens are wet and fixing at the measured rates 23.5% of the year. Assuming lichens are fixing 16.5% and 50% of the year yields fluxes of 6 and 19 kg ha−1 y−1, respectively.
Annual N inputs to P-fertilized forests at Kauai site by cyanolichens. Flux estimates are presented assuming that lichens are wet 16.5% of the year, 23.5% and 50%. Calculated fluxes are also shown for the control plots of the fertilization experiment for comparison – N fixation rates of P-fertilized forest lichens were used for this calculation.

DISCUSSION
All cyanolichens assayed from P-fertilized forest fixed N in the laboratory assays. Most of the 14 species assayed had very similar fixation rates, suggesting that the shift in community composition with P-fertilization from crustose to leafy species is not an important factor determining N inputs to the forest by the cyanolichen community. Given that the fixation rates were calculated on a per-area basis, the similarity across species suggests that the closely appressed species (Parmeliella and Coccocarpia), which have low biomass relative to the foliose, three-dimensional species, are fixing at high rates on a per-mass basis. These crustose-type species have rarely been included in studies of the ecosystem importance of cyanolichens (although see Cusack et al. Reference CUSACK, SILVER and McDOWELL2009), but their contribution to N inputs could be substantial – these two crustose genera comprised 31% of the total lichen area and contributed 19% of N inputs in P-fertilized forest. Potential shifts in community composition – for example, to a community dominated by the high-fixing P. crocata or Parmeliella nigrocincta, or the low-fixing Nephroma helveticum – would lead to either increased or decreased ecosystem N inputs. However, the main effect we documented here is an abundance-mediated shift – greater cover of cyanolichens, more N inputs.
Contrary to our expectations, the extremely high P supply in P-fertilized forest did not stimulate individual N-fixation rates above those in the reference forest. Cyanolichens in the moderately P-rich reference forest appeared healthy and vibrant, in strong contrast to those few in control plots of the fertilization experiment, which have discoloured, stunted thalli, as well as very depressed fixation rates (Benner et al. Reference BENNER, CONROY, LUNCH, TOYODA and VITOUSEK2007). Phosphorus availability may be too low in the control plots for cyanolichens to grow – but once P availability is above the threshold necessary for growth, variation in canopy P supply appears not to have a strong influence on fixation rates. Phosphorus fertilization did lead to higher N inputs to the ecosystem – because higher P availability causes a bloom in population size of cyanolichens, the amount of newly fixed N entering the forest is dramatically increased. Assuming that cyanolichens fix at the laboratory rates in the field, our best estimate is that cyanolichens contribute 9 kg N ha−1 y−1 to P-fertilized forest, an increase of nearly 30-fold over adjacent control plots (Table 3). This estimate is slightly greater than all other N inputs to these forests combined – atmospheric N deposition via rain and cloudwater and free-living N-fixing bacteria are thought to contribute 7.2 kg N ha−1 y−1 to unfertilized forest on Kauai (Carrillo et al. Reference CARRILLO, HASTINGS, SIGMAN and HUEBERT2002, Crews et al. Reference CREWS, FARRINGTON and VITOUSEK2000, Vitousek Reference VITOUSEK2004). It is also comparable to estimates of N fixation inputs by cyanolichens to other forests worldwide, which can be as high as 16.5 kg N ha−1 y−1 in Pacific Northwest Douglas fir forests where the tripartite cyanolichen Lobaria oregana is abundant (Antoine Reference ANTOINE2004, Sollins et al. Reference SOLLINS, GRIER, MCCORISON, CROMACK and FOGEL1980). There are few studies for comparison from tropical montane forests; estimates range from very low (Cusack et al. Reference CUSACK, SILVER and McDOWELL2009, Matzek & Vitousek Reference MATZEK and VITOUSEK2003) up to 8 kg N ha−1 y−1 (Forman Reference FORMAN1975).
As a check on the realism of these assumptions, we calculated the percentage of current N content derived from N fixation for each lichen assayed if each fixed 23.5% of the year for P-fertilized plots. We calculated that the lichens would fix from 6.0% to 52.2% (mean 19.9% ± 3.7%) of their current N content in 1 y. This estimate means that if all tissue were 1 y old or less, on average fixation would contribute 20% of the tissue N. Actual growth rates are likely less (Sillet & McCune 1998), so this estimate seems reasonable, given that the lichens may derive some of their N nutrition from atmospheric deposition and leaching from host trees.
It should be pointed out here that there is significant uncertainty associated with our estimate of N inputs to the forest. Not only do we estimate per cent of the year that lichens are wet (and so fixing), but there is also uncertainty associated with several other measures – ARA is inherently variable, the conversion from ARA to N fixed has error associated with it, as well as our measures for per cent cover of the 30 different species and the surface area of M. polymorpha in a stand (Benner & Vitousek Reference BENNER and VITOUSEK2007, Benner et al. Reference BENNER, CONROY, LUNCH, TOYODA and VITOUSEK2007). These uncertainties mean that our estimate of 9 kg N ha−1 y−1 should be taken as just that, our best estimate, and that there is significant variability among all the measures used to calculate that estimate.
One useful contribution of our study is the addition of more 15N calibration values (the ratio of acetylene reduced to N fixed) to the literature. Although there is significant variability in the values we found (from 2.4 to 9.3), they are well within the range measured for cyanolichens in other studies (Menge & Hedin Reference MENGE and HEDIN2009, Millbank Reference MILLBANK1981, Vitousek Reference VITOUSEK1994), and provide valuable indicators for future studies, particularly the P. crocata value of 2.4 ± 0.4, as we had 10 replicates of that species.
In our study, 15N natural abundance could not be used to determine contribution of fixation to total N content. The natural abundance δ15N values of the chlorolichens, bryophytes and cyanolichens were not significantly different from each other, meaning that the natural abundance technique could not be used to calculate per cent of N fixed by cyanolichens in this study. However, the δ15N of the Usnea samples were relatively depleted; if these values are representative of atmospheric N sources, then the signatures of epiphytes from the fertilization site may reflect a mixture of atmospheric N and more enriched N sources – either fixation or host tree leachate (Hietz et al. Reference HIETZ, WANEK, WANIA and NADKARNI2002).
Our estimate of N input is for P-fertilized forest – how relevant is our estimate for unfertilized forests? Above a minimum P threshold necessary for cyanolichens to grow, fixation rates do not seem to depend on forest P status, and so we can assume that (at least in Hawaiian montane forests) ecosystem N inputs scale with cyanolichen abundance. In Kauai montane forests, cyanolichen abundance is patchy – outside of fertilized forest, cyanolichens rarely occur on low-P trees growing on stable, highly weathered soils (on ridgetops and plateaux), but can be much more abundant on P-rich trees growing on currently eroding, P-rich soils, including steep slopes and stream valleys (Benner Reference BENNER2011, Porder et al. Reference PORDER, ASNER and VITOUSEK2005, Vitousek et al. Reference VITOUSEK, CHADWICK, MATSON, ALLISON, DERRY, KETTLEY, LUERS, MECKING, MONASTRA and PORDER2003). In these P-rich, cyanolichen-rich sites, N inputs may be locally large. Cyanolichens can be abundant in unpolluted, moist and cool forests in both temperate zones and tropical zones, where they are found predominantly in montane forests (Goward & Arsenault Reference GOWARD and ARSENAULT2000, Zotz Reference ZOTZ1999). Within this climatic envelope, our results suggest that local abundance of cyanolichens may be determined by variations in P availability. Thus, we can expect cyanolichen N inputs to be locally important, as determined by climate and potentially, P availability.
CONCLUSION
We demonstrate that additions of P cause an increase in N inputs via biological N fixation by cyanolichens in a montane Hawaiian forest. The increase in P supply leads to both a bloom in cyanolichen populations and a shift in community composition, but because differences in fixation rates among species were small, the shift in community composition is of minor importance compared with the overall increases in cyanolichen abundance. Elevated P supply (above the minimum threshold needed for growth) did not stimulate individual N fixation rates in this study, again suggesting that the main mechanism by which P increases N inputs to this forest is by increasing N-fixer abundances. If our flux estimate is accurate the amount of new N entering the forest from the P additions is equivalent to or greater than all other N inputs to the forest combined.
ACKNOWLEDGEMENTS
Dr Cliff Smith helped with the identification of lichens for the community composition study. Thanks to Heraldo Farrington, Elizabeth Callaway, Amelia Wolf, Kathryn Amatangelo, Rebecca Goldman and Doug Turner for help with field work and laboratory analyses. Many thanks to Jai Ranganathan for writing a program to analyse the rainfall data, and thanks to the National Weather Service for making their rain-gauge data available on-line. Larry Giles generously provided the isotope data, and Ben Houlton, Noel Gurwick, Jennifer Funk and two anonymous reviewers provided comments that greatly improved the manuscript. We are grateful to the Division of Forestry and Wildlife of the State of Hawaii for allowing access to field sites, and the Joseph Souza Center at Koke'e State Park for facilitating our research. This research was supported by an NSF Graduate Research Fellowship to J.W.B. and NSF Doctoral Dissertation Improvement Grant DEB-0108492.