Introduction
The pollution of soils and water by potentially toxic elements (PTEs: Ag, As, Cd, Co, Cr, Cu, Li, Mn, Mo, Ni, Pb, Se, Sn, V, and Zn) and radionuclides (Po, U, Th, and Ra) poses a growing global threat to ecosystems and public health (Khan et al., Reference Khan, Naushad, Lima, Zhang, Shaheen and Rinklebe2021; Adeola et al., Reference Adeola, Iwuozor, Akpomie, Adegoke, Oyedotun, Ighalo, Amaku, Olisah and Conradie2023). These contaminants, originating from industrial, mining, and nuclear activities, tend to persist in the environment, bioaccumulate in living organisms, and generate long-term risks (Novikau and Lujaniene, Reference Novikau and Lujaniene2022). Among the natural materials considered for mitigation, clay minerals, particularly montmorillonite, Ghassoul clay (stevensite), and kaolin, are used widely due to their low permeability, large cation-exchange capacity (CEC), and ability to delay contaminant migration in both engineered and natural barriers (Singh and Um, Reference Singh and Um2023; Yang et al., Reference Yang, Zhou, Hu, Zheng, Zhao, Lv and Liao2024).
Clay-based adsorbents have demonstrated good efficiency in terms of removing metals and radionuclides. For example, Spanish and Romanian bentonites removed >90% of Hg2+, Cd2+, and Pb2+ (Alvarez-Ayuso and Garcia-Sanchez, Reference Alvarez-Ayuso and Garcia-Sanchez2003; Fernández-Nava et al., Reference Fernández-Nava, Ulmanu, Anger, Marañón and Castrillón2011), whereas Egyptian bentonite removed up to 93% of U(VI) at pH 6–8 (Burham and Sayed, Reference Burham and Sayed2016). Kaolin from different regions was also effective in adsorbing Cu2+, Cd2+, Zn2+, and other metal ions (Yavuz et al., Reference Yavuz, Altunkaynak and Güzel2003; Srivastava et al., Reference Srivastava, Singh and Angove2005; Matłok et al., Reference Matłok, Petrus and Warchoł2015; Chai et al., Reference Chai, Au, Mubarak, Khalid, Ng, Jagadish, Walvekar and Abdullah2020).
Morocco holds significant reserves of bentonite, Ghassoul clay, and kaolin. Bentonite, dominated primarily by montmorillonite, is particularly effective at adsorbing metal ions due to its swelling capacity, large surface area, and strong surface reactivity (Segad et al., Reference Segad, Jonsson, Åkesson and Cabane2010). Its large CEC makes it suitable for the retention of uranium and thorium at near-neutral pH (Bachmaf et al., Reference Bachmaf, Planer-Friedrich and Merkel2008; Khouya et al., Reference Khouya, Legrouri, Fakhi and Hannache2010; Seliman et al., Reference Seliman, Lasheen, Youssief, Abo-Aly and Shehata2014; Harrou et al., Reference Harrou, Ouahabi, Fagel, Barba-Lobo, Pérez-Moreno, Bolívar and Gharibi2024). Bentonite adsorbs Pb2+ ions at pH 5 effectively via ion exchange and surface complexation, with adsorption capacity increasing at higher pH values (Ait Hmeid et al., Reference Ait Hmeid, Akodad, Baghour, Moumen, Skalli, Azizi, Gueddari, Maach, Aalaoul, Anjjar and Daoudi2021).
Although natural kaolin generally showed less reactivity because of its smaller surface area and limited exchange sites, some studies have confirmed its ability to retain metal ions. For instance, in Morocco, illitic and kaolinitic clays from Salé were shown to adsorb Cu2+ effectively (Es-sahbany et al., Reference Es-sahbany, Berradi, Belfakir and El Youbi2016). In addition, raw clay from Marrakech mostly retained Cd2+, Cu2+, and Pb2+ (Abbou et al., Reference Abbou, Lebkiri, Ouaddari, Kadiri, Ouass, Habssaoui, Lebkiri and Rifi2021). Clays from northern Morocco also exhibited good Ni2+-removal capacities (Bentahar et al., Reference Bentahar, Hurel, Draoui, Khairoun and Marmier2016; Loutfi et al., Reference Loutfi, Mariouch, Belfaquir and Elyoubi2021).
Ghassoul, a smectite-rich clay found in the Middle Atlas Mountains, showed strong potential for contaminant removal under different pH conditions. It was demonstrated that Ghassoul/alginate beads achieved efficient Cd2+ removal, with adsorption described by Langmuir isotherms and pseudo-second order kinetics (Achchatar et al., Reference Achchatar, Valange, Kherbeche, Gallard and Draoui2025). In addition, the uptake of Hg2+ and Cr6+ by natural Moroccan stevensite has been confirmed under acidic to neutral pH conditions (Benhammou et al., Reference Benhammou, Yaacoubi, Nibou and Tanouti2005).
Ghassoul is found only in Morocco. However, stevensite-rich clay deposits do exist in other parts of the world, such as the Amargosa Desert (USA), the Mediterranean Madrid Basin (Spain), and Neogene magnesian clays in Anatolia (Turkey) (Eberl et al., Reference Eberl, Jones and Khoury1982; Yeniyol, Reference Yeniyol2014; Herranz and Pozo, Reference Herranz and Pozo2022). While smectite-rich soils from Anatolia have been investigated through single and competitive batch sorption experiments, revealing preferential adsorption of Pb2+ and Cu2+ relative to Cd2+ and Zn2+, the desorption behavior of these metals was not examined (Keçeci et al., Reference Keçeci, Usta and Uygur2020).
While the adsorption capacity of these clays was documented, few studies have assessed their behavior under environmental conditions, particularly regarding the potential remobilization of toxic elements from raw and unmodified clays. Most previous works have focused on controlled wastewater-treatment scenarios involving chemically or structurally modified clays. Comparative environmental assessment of raw clays has scarcely been discussed.
To assess the geochemical enrichment and potential environmental risks of raw clays, the present study employed a suite of indices, i.e. single-element indices, multi-element/integrated indices, and a potential ecological risk assessment. Furthermore, a standardized batch-leaching protocol (EN 12457-4, 2002) was applied. The test provides an operational definition of release under water-saturated conditions and allows for direct benchmarking against the EU Waste Acceptance Criteria (European Council, 2003). This procedure offers insights into the degree of metal pollution, of natural versus anthropogenic contributions (Ghosh et al., Reference Ghosh, Bakshi, Kumar, Ramanathan, Biswas, Bhattacharyya, Chaudhuri, Shaheen and Rinklebe2019; Shaheen et al., Reference Shaheen, Abdelrazek, Elthoth, Moghanm, Mohamed, Hamza, El-Habashi, Wang and Rinklebe2019; Mensah et al., Reference Mensah, Marschner, Shaheen, Wang, Wang and Rinklebe2020). In addition, a human-health risk-assessment index was employed to evaluate potential non-carcinogenic and carcinogenic risks linked to exposure to potentially toxic elements (USEPA, 2001; ATSDR, 2012).
The present study compared and characterized the pollution and risk profiles of the Mnt-, Kln-, and Stv-rich clays from Moroccan deposits, thereby providing a better understanding of their suitability for environmental and industrial applications.
Materials and methods
Sampling
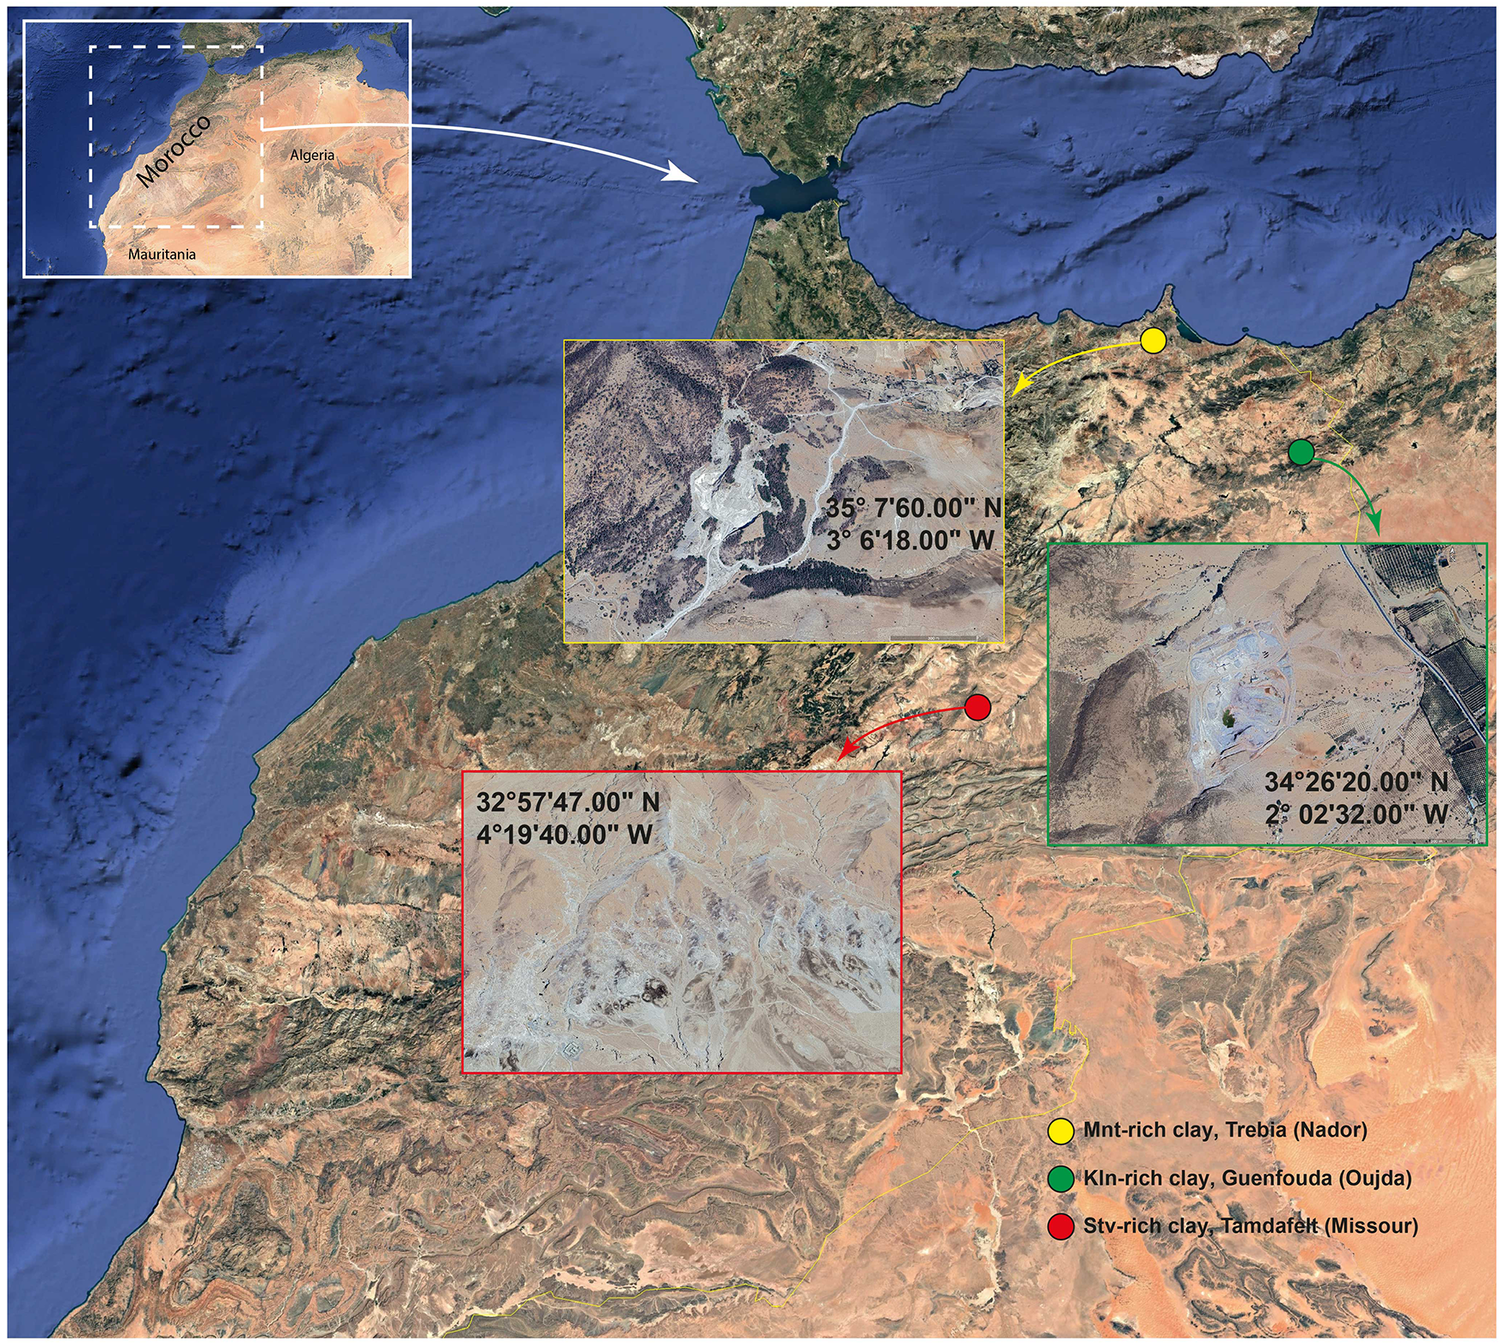
A satellite image shows the geographic locations of the three clay deposits selected for the present study because of their industrial relevance and geological significance (Fig. 1). The sampling sites include bentonite from the Trebia deposit near Nador (35°7′60′′N; 3°6′18′′W), kaolin from the Guenfouda deposit south of Oujda (34°26′20′′N; 2°02′32′′W), and Ghassoul (a smectite-rich clay) from the Tamdefelt deposit in Jbel Ghassoul near Missour (32°57′47′′N; 4°19′40′′W).
Satellite image showing the locations of the Mnt-rich clay (bentonite), the Kln-rich clay (kaolin), and the Stv-rich clay (Ghassoul) deposits in the study area. The inset map shows the location of the study area within Morocco. The colored boxes indicate the clay deposits studied and the sampling sites corresponding to the Mnt-rich clay (yellow), Kln-rich clay (green), and Stv-rich clay (red).

Figure 1. Long description
A satellite map of Morocco features a small inset map in the top-left corner showing Morocco’s location in North Africa, bordered by Algeria to the East and Mauritania to the South. An arrow points from this inset to the main regional map. Three specific sampling sites are marked with colored circles and corresponding detailed inset boxes.
* The first site, marked with a yellow circle in the North near the coast, is M n t-rich clay at Trebia (Nador). An arrow points to a yellow-bordered inset showing mountainous terrain at 35 degrees 7 minutes 60.00 seconds North, 3 degrees 6 minutes 18.00 seconds West.
* The second site, marked with a green circle further inland to the Southeast, is K l n-rich clay at Guenfouda (Oujda). An arrow points to a green-bordered inset showing an open-pit area at 34 degrees 26 minutes 20.00 seconds North, 2 degrees 2 minutes 32.00 seconds West.
* The third site, marked with a red circle in the central-east region, is S t v-rich clay at Tamdafelt (Missour). An arrow points to a red-bordered inset showing arid, light-colored clay deposits at 32 degrees 57 minutes 47.00 seconds North, 4 degrees 19 minutes 40.00 seconds West.
A legend in the bottom-right corner identifies the yellow circle as M n t-rich clay, the green circle as K l n-rich clay, and the red circle as S t v-rich clay.
Based on XRD analysis, these samples are referred to hereafter as the Mnt-rich clay (bentonite), the Kln-rich clay (kaolin), and the Stv-rich clay (Ghassoul) according to their dominant mineralogical composition.
For each site, three surface samples (0–30 cm depth) were collected. Samples were air-dried for 24 h in a laboratory oven, ground using an electric mill, and sieved through a 250 μm mesh to obtain fine fractions suitable for analysis. The samples were analyzed for mineralogical, chemical, and leaching analyses to evaluate their composition and the potential mobility of toxic elements (Ag, As, Cd, Co, Cr, Cu, Li, Mn, Mo, Ni, Pb, Se, Sn, V, and Zn) and radionuclides (Po, U, Th, and Ra).
Physical, chemical, and mineralogical characterization
The clay samples were characterized to determine their mineralogical composition, bulk chemical composition, and microstructural features using XRD, XRF, ICP-OES, and scanning electron microscopy (SEM).
The specific surface areas (SSA) of the Mnt- and Stv-rich clays were determined using the methylene blue (MB) adsorption method, following procedures described widely in the literature (e.g. Ghosh and Bhattacharyya, Reference Ghosh and Bhattacharyya2002; Madejová et al., Reference Madejová, Kečkéš, Pálková and Komadel2002). However, the applicability of the MB method to the Kln-rich clay is limited, as kaolinite is a non-expanding mineral with no permanent layer charge, which may lead to less reliable surface-area estimation using cationic dye adsorption (Kahr and Madsen, Reference Kahr and Madsen1995; Bujdák, Reference Bujdák2023). This method is based on the progressive adsorption of MB onto the surface of clay particles until saturation is reached. The amount of dye adsorbed at the saturation was then used to calculate the SSA according to Eqn (1) (Bestani et al., Reference Bestani, Benderdouche, Benstaali, Belhakem and Addou2008; Dira et al., Reference Dira, Elmouwahidi, Khouja, Boufetacha, Barakat, Tayibi and Gharibi2024):

where Q m denotes the maximum adsorption capacity, NA is Avogadro’s number, M BM represents the molecular weight of methylene blue, and A BM is the area occupied by a single methylene blue molecule, estimated to be 1.3×10⁻¹⁸ m2.
Nitrogen adsorption measurements based on the Brunauer-Emmett-Teller (BET) method were also conducted to determine the SSA of Kln-rich clay. Measurements were carried out using a Micromeritics Gemini VII version 5.03 surface area analyzer. Approximately 300 mg of each dried sample was used for analysis. Prior to measurement, samples were degassed under vacuum at 100°C for 12 h to remove adsorbed moisture and volatile components (Kaufhold et al., Reference Kaufhold, Dohrmann, Klinkenberg, Siegesmund and Ufer2010). Surface area values were calculated using a five-point BET approach over the appropriate relative pressure range.
The surface-charge properties of the Mnt-, Kln-, and Stv-rich clays were evaluated through zeta potential measurements over a pH range of 2–12. Measurements were performed using a Malvern Zetasizer Nano ZS90 (Malvern Instruments Ltd, Worcestershire, UK). Clay suspensions were prepared at a concentration of 0.1 wt.% using deionized water. Prior to analysis, the samples were ground gently and sieved to ensure particle-size compatibility with the instrument requirements. For pH-dependent measurements, 40 mL of each suspension was adjusted to the desired pH using 0.01 M HCl or 0.01 M NaOH and stirred for ~5 min to allow stabilization before analysis. Zeta potential values were determined from electrophoretic mobility using the Smoluchowski model. Each measurement was performed in triplicate, and the results are reported as mean values with standard deviations. The experimental approach was adapted from procedures described by Ettoumi et al. (Reference Ettoumi, Jouini, El-Bahi, Bergani, Taha, Khalil and Benzaazoua2025).
The CEC values of the three raw clays were determined using the cobalt hexamine method, following the French standard NF X 31-130 (AFNOR, 1999). This method is based on the ability of the clay to retain Co(NH3)63+ cations to balance its negative charge. The CEC values are estimated by measuring the amount of cobalt remaining in the solution.
Major chemical elements of the raw clays were determined on pellets by XRF using an ARL PERFORM′X 4200 instrument. The clay samples were ground, sieved to 250 μm and heated to 1000°C for 4 h to quantify the loss-on-ignition (LOI). For total elemental analysis, ~0.2 g of each dried and homogenized clay sample was acid digested in Teflon vessels. The digestion protocol involved a sequential addition of HNO3 (6 mL), HCl (2 mL), and HF (2 mL), followed by heating at 150°C for 6 h. After cooling, the samples were evaporated to near dryness, and the residues were re-dissolved in 2% HNO3 and diluted to a final volume of 50 mL. This method achieves dissolution of silicate matrices, enabling accurate determination of total elemental concentrations. An inductively coupled plasma-atomic emission spectrometer (ICP-AES, Jobin Yvon Ultima 2 instrument) was used to determine the concentrations of PTEs in the leachates obtained from the clay samples. Inductively coupled plasma-mass spectrometry (ICP-MS, HP4500®) was used for determining the trace-element concentrations in the clay samples.
Alpha-particle spectrometry was performed using an EG&G Ortec alpha-particle spectrometer system consisting of eight chambers, equipped with a 450 mm2 ion-implanted semiconductor detector (PIPS type), which provides an efficiency of ~25%. U isotopes, Th isotopes, and 210Po were isolated radiochemically and quantified via alpha spectrometry with PIPS type Si detectors (REF) (Gázquez et al., Reference Gázquez, Gómez, Alonso, Pérez-Moreno, Ramos-Lerate, Casas-Ruiz and Bolívar2023). Radionuclide concentrations in solid samples were determined by gamma spectrometry using a high-purity germanium (HPGe) detector (model GCW3023), following the methodologies detailed by Barba-Lobo et al. (Reference Barba-Lobo, Expósito-Suárez, Suárez-Navarro and Bolívar2024).
X-ray diffraction was performed using a Shimadzu 6100 diffractometer, equipped with CuKα radiation (λ=1.54 Å), in the range 2–70°2θ with a step size of 0.004°2θ. Mineral-phase identification was carried out using HighScore Plus software (version 4.9) supplied with the Crystallography Open Database (COD).
SEM was conducted using a Quanta 200 instrument with a resolution of 3.5 nm, coupled with energy dispersive X-ray spectroscopy (EDS) providing energy resolution of 133 eV. The analyses were performed on carbon-coated clay samples to examine surface morphology and elemental composition.
Geochemical and ecological risk-assessment indices
Several indices quantify the degree of PTE pollution and aid in identifying the ecological impacts of elements, distinguishing between natural and anthropogenic sources (Li et al., Reference Li, Lin, Cheng, Duan and Lei2015; Gope et al., Reference Gope, Masto, George, Hoque and Balachandran2017; Rinklebe et al., Reference Rinklebe, Antoniadis, Shaheen, Rosche and Altermann2019; Shaheen et al., Reference Shaheen, Antoniadis, Kwon, Song, Wang, Hseu and Rinklebe2020).
The contamination factor (CF) is a fundamental index defined as the ratio between the concentration of PTEs in the clay sample (C S) and its corresponding background or reference concentration (C RefS) (Eqn (2)) (Kabata-Pendias, Reference Kabata-Pendias2011):

The CF is used widely for initial, element-specific screening and is classified as: low (CF<1), moderate (1≤CF<3), considerable (3≤CF<6), or very high (CF≥6) (Antoniadis et al., Reference Antoniadis, Golia, Shaheen and Rinklebe2017; Ghosh et al., Reference Ghosh, Bakshi, Kumar, Ramanathan, Biswas, Bhattacharyya, Chaudhuri, Shaheen and Rinklebe2019; Mensah et al., Reference Mensah, Marschner, Shaheen, Wang, Wang and Rinklebe2020).
The enrichment factor (EF) is utilized to distinguish between anthropogenic and geogenic sources of PTEs by normalizing the element’s concentration against a conservative reference element (Eqn (3)), such as Al in the present study (Leharne et al., Reference Leharne, Charlesworth and Chowdhry1992; Zoller et al., Reference Zoller, Gladney and Duce1974). This normalization corrects for natural variations in the matrix composition:

where C(Al)s is the concentration of the reference element (Al) in the studied clays, and C(Al) is the worldwide average concentration of Al in clays (Kabata-Pendias, Reference Kabata-Pendias2011). The EF is interpreted as follows: EF<1 (no enrichment/depletion), 1≤EF<3 (minor enrichment), 3≤EF<5 (moderate enrichment), 5≤EF<10 (moderately severe enrichment), 10≤EF<25 (severe enrichment), 25≤EF<50 (very severe enrichment), and EF>50 (extremely severe enrichment) (Shaheen et al., Reference Shaheen, Abdelrazek, Elthoth, Moghanm, Mohamed, Hamza, El-Habashi, Wang and Rinklebe2019; Khanam et al., Reference Khanam, Kumar, Nayak, Shahid, Tripathi, Vijayakumar, Bhaduri, Kumar, Mohanty, Panneerselvam and Chatterjee2020).
The geo-accumulation index (I geo), developed by Müller (Reference Müller1969), compares the current PTE concentration with a pre-industrial background level (Eqn (4)). A factor of 1.5 is incorporated to account for natural fluctuations in the background data:

The classification system is: I geo≤0 (uncontaminated), 0<I geo≤1 (uncontaminated to moderately contaminated), 1<I geo≤2 (moderately contaminated), 2<I geo≤3 (moderately to heavily contaminated), 3<I geo≤4 (heavily contaminated), 4< I geo≤5 (heavily to extremely contaminated), and I geo>5 (extremely contaminated).
The pollution load index (PLI), proposed by Tomlinson et al. (Reference Tomlinson, Wilson, Harris and Jeffrey1980), provides a comparative measure for the overall toxicity of a sample by integrating the contamination levels of multiple PTEs. It is calculated as the n th root of the product of the contamination factors (CF i) for n elements, according to Eqn (5). PLI =1 indicates baseline/background; PLI >1 indicates pollution; larger values indicate greater cumulative pollution (Kowalska et al., Reference Kowalska, Mazurek, Gąsiorek and Zaleski2018). Values of <1 indicate no overall pollution load:

The degree of contamination (C deg) is the sum of all contamination factors (Cfi) for all elements studied (Eqn (6)). The modified degree of contamination (mC d) is the average of the contamination factors (Eqn (7)). The classification for mC d is typically: low (mC d<1), moderate (1≤mC d<2), high (2≤ mC d<4), and very high (mCd≥4) (Kowalska et al., Reference Kowalska, Mazurek, Gąsiorek and Zaleski2018):


The Nemerow Pollution Index (P N) balances the average contamination with the maximum contamination, emphasizing the element with the greatest contamination level (Eqn (8)) (Weissmannová and Pavlovský, Reference Weissmannová and Pavlovský2017; Kowalska et al., Reference Kowalska, Mazurek, Gąsiorek and Zaleski2018). The interpretation is as follows: uncontaminated (P N≤0.7), warning limit (0.7<P N≤1), slightly polluted (1<P N≤2), moderately polluted (2<P N≤3), and heavily polluted (P N>3) (Kowalska et al., Reference Kowalska, Mazurek, Gąsiorek and Zaleski2018):

The potential ecological risk index (RI), proposed by Hakanson (Reference Hakanson1980), is a widely adopted method for assessing the ecological risk of PTEs in environmental matrices. The method incorporates the toxicity to provide a more realistic assessment of potential harm.
The single element ecological risk factor (E ri) is calculated according to Eqn (9):

where T ri is the toxic response factor for the element I, and CF i is the contamination factor for the element i. The potential ecological risk index (RI) is the sum of the individual risk factors (Eqn (10)):

The RI is classified as: low ecological risk (RI<150), moderate ecological risk (150≤RI<300), considerable ecological risk (300≤RI<600), and very high ecological risk (RI≥600) (Hakanson, Reference Hakanson1980).
Leaching experiments
Leaching tests were conducted following the EN 12457-4 (2002) standard using clay samples previously dried and sieved to retain <250 μm particles. A fixed mass of each sample was mixed with demineralized water at a liquid-to-solid ratio (L/S) of 10, and the mixtures were agitated continuously for 24 h on a rotary shaker to ensure homogeneous contact. After leaching, the suspensions were filtered through 0.45 μm membrane filters, and the resulting filtrates were analyzed by ICP-MS to quantify the concentrations of PTEs and radionuclides. Each test was performed in triplicate under identical conditions to ensure consistency and reproducibility. Leaching tests were conducted on the Mnt- and Stv-rich clays because of their greater total concentrations of PTEs and their widespread use in applications with potential water contact. The Kln-rich clay, exhibiting PTE concentrations consistently at or below typical geochemical backgrounds levels for clay materials (Kabata-Pendias, Reference Kabata-Pendias2011), was considered to present a lower inherent leaching risk and was therefore excluded from this phase of the leaching assessment.
The mobility rate (%M) (Li et al., Reference Li, Wu, Bao, Liu, Xu, Zhao, Liu and Yu2017; Behbahani et al., Reference Behbahani, Ryan and McKenzie2020; Lu et al., Reference Lu, Xia, Yan and Wang2025), which expresses the mobility of PTEs from raw clays into deionized water under controlled conditions, was calculated following Eqn (11):

where C L is the concentration/activity in the leachate (mg L–1), V water is the volume (L) of distilled water collected after leaching, C S is the concentration/activity in the solid phase prior to leaching (mg kg–1), and M clay is the mass (kg) of the Mnt- and Stv-rich clay.
Results and Discussion
Mineralogical and physical-chemical characterization of the raw clays
The XRD patterns of Mnt-, Kln-, and Stv-rich clays confirmed the mineralogical composition of the three clays (Fig. S1, Supplementary material). The Mnt-rich clay was mainly composed of both Ca-Mnt (CaMnt) and Na-Mnt (NaMnt), defined according to the dominant interlayer exchangeable cations, along with kaolinite (Kln), potassium feldspar (KFs), sodium feldspar (NaFs), and anorthite (An). The Kln-rich clay consisted primarily of kaolinite (Kln), with muscovite (Ms), pyrophyllite (Prl), topaz (Tpz), and quartz (Qz). The Stv-rich clay was characterized by the presence of stevensite (Stv), gypsum (Gp), potassium feldspar (KFs), calcite (Cal), quartz (Qz), and dolomite (Dol). The pronounced stevensitic character of the material sourced from Jbel Ghassoul is well documented and has been established in previous research, supporting its classification as a Mg-rich, trioctahedral smectite. This specific mineralogical identity has been confirmed by previous studies (Benhammou et al., Reference Benhammou, Tanouti, Nibou, Yaacoubi and Bonnet2009; Amakrane et al., Reference Amakrane, El Hammouti, Azdimousa, El Halim, El Ouahabi, Lamouri and Fagel2018).
The XRF results showed SiO2/Al2O3 ratios of 2.09 for Mnt-rich clay, 1.45 for Kln-rich clay, and 5.17 for Stv-rich clay (Table S1, Supplementary material). The ratio observed in the Mnt-rich clay sample is consistent with the presence of Mnt, as confirmed by XRD analysis, and aligns with values reported in previous studies on the same deposit (Bounab et al., Reference Bounab, Draoui, Ahrouch, Hadri, Bouchta and Barhoun2017). The SiO2/Al2O3 ratio of 1.45 obtained for Kln-rich clay falls within the range reported by Dahmani et al. (Reference Dahmani, Jadid, El Hammouti, Talbi and El Ouahabi2019) for similar samples from the same site (0.88–4.8), with the closest match (0.88) corresponding to the pyrophyllite-bearing zone. For Stv-rich clay, the ratio of 5.17 is consistent with the value of 6.41 reported previously by Moussout et al. (Reference Moussout, Ahlafi, Aazza, Chfaira and Mounir2020).
These mineralogical contrasts correlate with the physicochemical properties, particularly the specific surface area (SSA) and cation exchange capacity (CEC) of the clays (Table S1). The Stv-rich clay exhibited the largest SSA (104 m2 g–1), followed by Mnt-rich clay (74 m2 g–1), while Kln-rich clay presented a much lower value (6.3 m2 g–1). The trend indicates that Stv-rich clay provides the greatest surface availability for adsorption processes, whereas the Kln-rich clay offers minimal active surface sites. In terms of CEC, both the Stv-rich clay (85 meq 100 g–1) and the Mnt-rich clay (89 meq 100 g–1) displayed similarly high values, typical of expandable 2:1 phyllosilicates, highlighting strong potential for ion-exchange applications and indicating their distinct retention responses. Conversely, the Kln-rich clay showed a markedly lower CEC (7.62 meq 100 g–1), consistent with its 1:1 non-swelling structure. These results are consistent with data reported in the literature. The SSA for Trebia-Nador Mnt-rich clay ranges from 70 to 90 m2 g–1 and CEC from 60 to 90 meq 100 g–1 (Ait Hmeid et al., Reference Ait Hmeid, Akodad, Baghour, Moumen, Skalli, Azizi, Gueddari, Maach, Aalaoul, Anjjar and Daoudi2021). The SSA for Jerada Kln-rich clay ranges from 6 to 15 m2 g–1 and CEC from 3 to 15 meq 100 g–1 (Dahmani et al., Reference Dahmani, Jadid, El Hammouti, Talbi and El Ouahabi2019) and the SSA for Stv-rich clay ranges from 130 to 146 m2 g–1 and the CEC from 75 to 85 meq 100 g–1 (Benhammou et al., Reference Benhammou, Tanouti, Nibou, Yaacoubi and Bonnet2009). These differences in SSA and CEC strongly influence the retention and leaching behavior of PTEs. The Stv-rich clay, with its exceptionally high SSA and elevated CEC, provides many active sorption sites and interlayer spaces, favoring strong adsorption of cationic PTEs (Pb2+, Cd2+, and Cu2+). This characteristic reduces the mobility and leachability of metals, suggesting a significant immobilization potential under environmental conditions.
Microstructure characterization
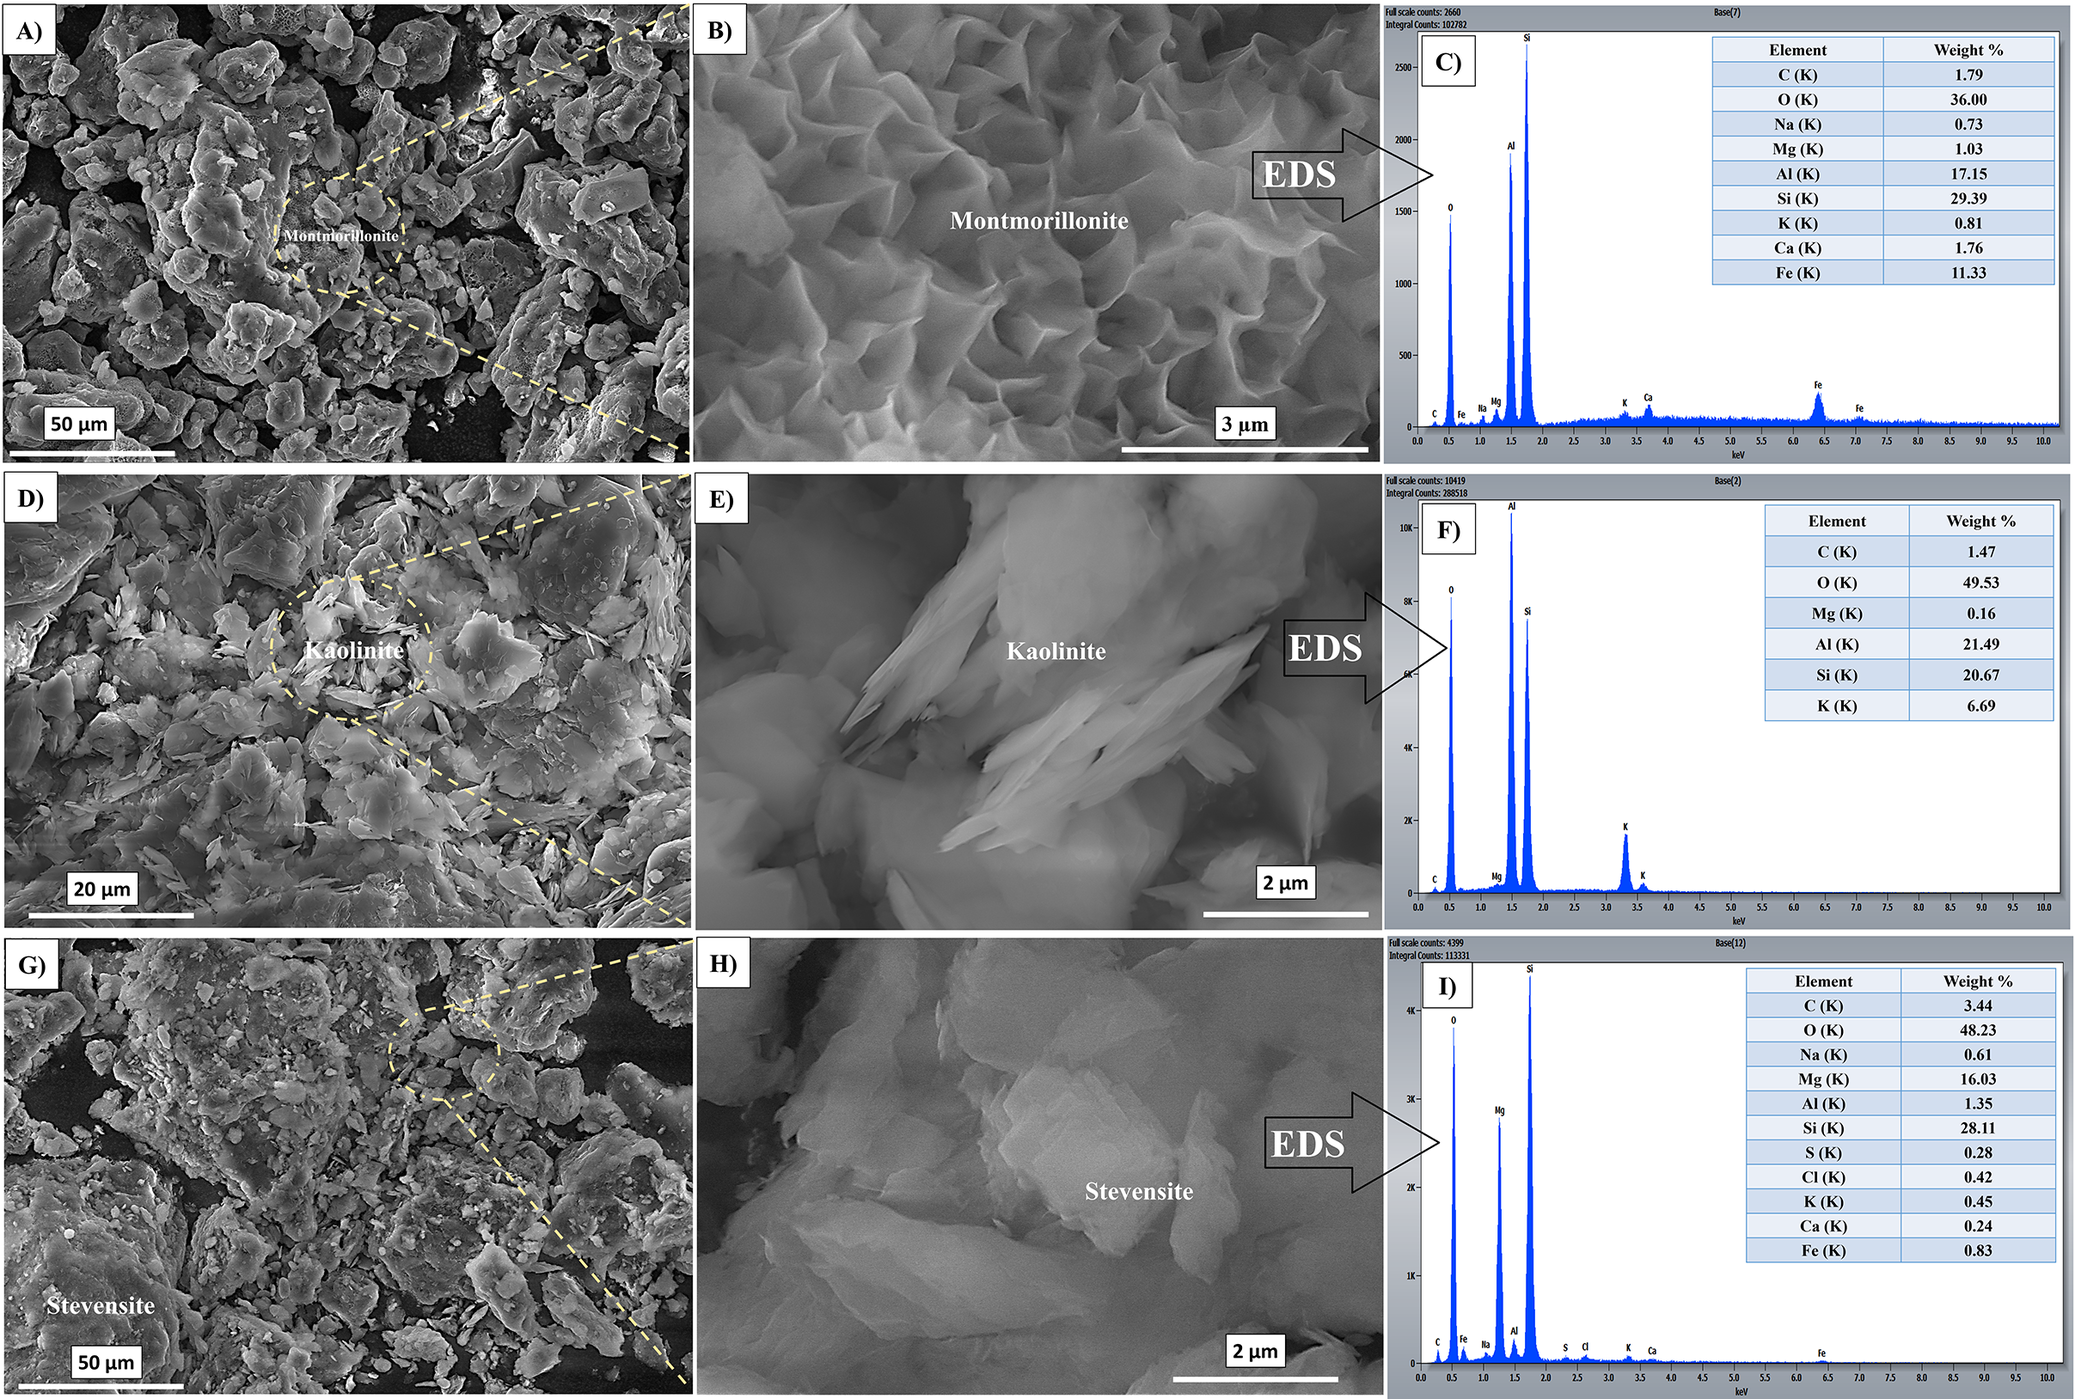
Analysis by SEM revealed the morphological characteristics of each clay type (Fig. 2). The Mnt-rich clay exhibited a porous, sponge-like morphology formed by irregular, loosely packed layers (Fig. 2A,B). The structure is characteristic of Mnt and is associated with a large surface area and cation exchange capacity, supporting widespread use in drilling fluids, pollutant adsorption, and soil stabilization because of its notable swelling and water-retention properties (Gu et al., Reference Gu, Cheng, Zhang, Zhang, Chen, Ma and Zhang2017; Dong et al., Reference Dong, Li, Fan, Ma, Sun, Wang, Gao and Dong2020; Pei et al., Reference Pei, Xu, Zheng, Liang, Sun, Lin and Wang2021). The kaolinite-rich clay exhibited a stratified morphology composed of hexagonal platelets arranged in book-like stacks, with an average particle size of ~2 μm (Fig. 2D,E). This structure is mainly associated with the kaolinite and muscovite phases confirmed by XRD (Fig. S1). Despite its limited specific surface area (6.3 m2 g–1) and low CEC (7.6 meq 100 g–1), this pseudo-hexagonal platelet structure offers reactive edge and basal -OH sites that enable effective adsorption of heavy metals (Maged et al., Reference Maged, Ismael, Kharbish, Sarkar, Peräniemi and Bhatnagar2020; Tian et al., Reference Tian, Fu, Chen, Yao and Bian2022).
Microstructure of raw clays. SEM images of Mnt-rich clay (A,B), Kln-rich clay (D,E), and Stv-rich clay (G,H), with panels B, E, and H showing enlargements of panels A, D, and G, respectively. The corresponding EDS spectra are presented in panels C (Mnt-rich clay), F (Kln-rich clay), and I (Stv-rich clay).

Figure 2. Long description
The figure consists of nine panels arranged in a three-by-three grid.
Top Row: Montmorillonite-rich clay.
Panel A is an S E M micrograph at a 50 micrometer scale showing a cluster of irregular mineral grains. Yellow dashed lines indicate an area of interest labeled Montmorillonite.
Panel B is a 3 micrometer scale enlargement of the area in A, revealing a cornflake-like or wavy, foliated texture.
Panel C is an E D S spectrum with an arrow pointing from panel B. The x-axis is energy in k e V and the y-axis is intensity. Major peaks occur for Oxygen, Aluminum, and Silicon. An inset table lists weight percentages: C 1.79, O 36.00, Na 0.73, Mg 1.03, Al 17.15, Si 29.39, K 0.81, Ca 1.76, and Fe 11.33.
Middle Row: Kaolinite-rich clay.
Panel D is an S E M micrograph at a 20 micrometer scale showing dense, platy mineral structures. A dashed circle highlights a region labeled Kaolinite.
Panel E is a 2 micrometer scale enlargement showing stacked, hexagonal-like plates.
Panel F is an E D S spectrum with major peaks for Oxygen, Aluminum, and Silicon. The inset table lists weight percentages: C 1.47, O 49.53, Mg 0.16, Al 21.49, Si 20.67, and K 6.69.
Bottom Row: Stevensite-rich clay.
Panel G is an S E M micrograph at a 50 micrometer scale showing a more granular and fragmented texture. A dashed circle highlights a region labeled Stevensite.
Panel H is a 2 micrometer scale enlargement showing thin, filmy, and overlapping flakes.
Panel I is an E D S spectrum with major peaks for Oxygen, Magnesium, and Silicon. The inset table lists weight percentages: C 3.44, O 48.23, Na 0.61, Mg 16.03, Al 1.35, Si 28.11, S 0.28, Cl 0.42, K 0.45, Ca 0.24, and Fe 0.83.
The Stv-rich clay, on the other hand, showed a morphology formed by thin, flexible flakes arranged in loosely stacked layers (Fig. 2G,H). The texture is typical of stevensite that enhances its ability to absorb water and oils. The smooth, lamellar structure observed by SEM aligns with known performance in cosmetic and surface-treatment products, where mild exfoliation and efficient adsorption are desirable features (Benhammou et al., Reference Benhammou, Yaacoubi, Nibou and Tanouti2005; Gubitosa et al., Reference Gubitosa, Rizzi, Fini and Cosma2019).
The EDS analysis revealed distinct elemental profiles. The Mnt-rich clay showed high levels of Si (29.4%) and Al (17.2%), with minor Ca, Na, K, and Fe (Fig. 2C). Its Si/Al ratio of 1.73 aligns with the XRF-derived value (2.09; Table S1), confirming the presence of smectite. The Kln-rich clay presented quasi-equal proportions of Al (21.5%) and Si (20.7%), with low Mg (0.16%) and moderate K (6.7%) contents (Fig. 2F). The Si/Al ratio of 0.98 was consistent with the 1:1 layer structure of Kln and supported the presence of muscovite. In contrast, the Stv-rich clay was rich in Si (28.1%) and Mg (16.0%) but low in Al (1.35%) (Fig. 2I), indicating a Stv-dominant phase with a trioctahedral smectite structure. These compositional differences reflect the mineralogical diversity of the clays and help explain distinct environmental behaviors.
Trace-element composition
Table S2 (Supplementary material) presents the metal composition of the Mnt-, Kln- and Stv-rich clays, compared with average values for argillaceous rocks (Kabata-Pendias, Reference Kabata-Pendias2011), the continental crust (Kabata-Pendias, Reference Kabata-Pendias2011), and the recommended composition of the bulk continental crust (RCBCC) (Rudnick and Gao, Reference Rudnick, Gao and Turekian2010). According to the data in Table S2 and the compilations for the Upper Continental Crust (Rudnick and Gao, Reference Rudnick and Gao2003), the Mnt-rich clay shows low levels of PTEs. The arsenic content is ~3.52 mg kg–1, which is slightly above upper crust values but remains below the range of 5–13 mg kg–1 often reported for argillaceous rocks. The Cd content is ~0.36 mg kg–1, near the high end of natural background levels for clays. The zinc content is ~113.3 mg kg–1, falling within the 80–120 mg kg–1 interval for argillaceous rocks. Other cations occur at minor levels. In contrast, the Stv-rich clay is enriched in several PTEs, with concentrations of Mn at 668, V at 149, Zn at 167, Cu at 85, Pb at 32, Co at 14, Cd at 2.4, and Ni at 10 mg kg–1. The Kln-rich clay is low in PTEs, consistent with an inert geochemical profile. These PTEs are recognized for their harmful effects on the environment and human health (Naja and Volesky, Reference Naja and Volesky2017). Cadmium, which is particularly elevated in Stv-rich clay, tends to accumulate in plants and is linked to kidney dysfunction and an increased risk of cancer (Tchounwou et al., Reference Tchounwou, Yedjou, Patlolla, Sutton and Luch2012). Arsenic, found in the Mnt-rich clay, is a known carcinogen associated with several types of cancer and chronic health problems (Smith et al., Reference Smith, Lingas and Rahman2000; Naujokas et al., Reference Naujokas, Anderson, Ahsan, Aposhian, Graziano, Thompson and Suk2013). Exposure to Pb and Cd can result in renal and respiratory issues (Patrick, Reference Patrick2006; Tchounwou et al., Reference Tchounwou, Yedjou, Patlolla, Sutton and Luch2012). Although Zn is essential in trace amounts, it becomes toxic at elevated concentrations and may disrupt soil microbial activity, affect plant growth, and contaminate aquatic ecosystems; excessive exposure in humans may lead to anemia and neurological disorders (Plum et al., Reference Plum, Rink and Haase2010; Nagajyoti et al., Reference Nagajyoti, Lee and Sreekanth2010; Alloway, Reference Alloway2012). These findings highlight the need for careful evaluation of PTE contents in clays, because contamination of the Mnt- and Stv-rich clays, commonly used in industrial or commercial products such as cosmetics and pharmaceuticals, may pose regulatory challenges and direct risks to human health (Alloway, Reference Alloway2012).
The rare earth elements (REEs) patterns differ strongly between the clays. The Mnt- and Stv-rich clays are REE-enriched relative to upper-crust/bulk-crust references. In the Mnt- and Stv-rich clays, Ce reaches 95 mg kg–1 and 79 mg kg–1, respectively, above representative crustal means. Light REEs levels are significant, with La at 49 and Nd at 35 mg kg–1 in the Mnt-rich clay, and with La at 39 and Nd at 33 mg kg-1 in the Stv-rich clay. Heavy REEs (Dy, Er, Yb, and Lu) are a little greater than crustal values. The Kln-rich clay contains fewer REEs (Ce at 20, La 12, and Nd at 6.7 mg kg–1), indicating slight enrichment. The elevated REE levels in the Mnt- and Stv-rich clays suggest that their parent materials were probably enriched in these elements, potentially due to specific mineralogical sources or geochemical processes such as hydrothermal activity, which tend to concentrate REEs (Migdisov et al., Reference Migdisov, Williams-Jones, Brugger and Caporuscio2016).
Radioactivity analysis
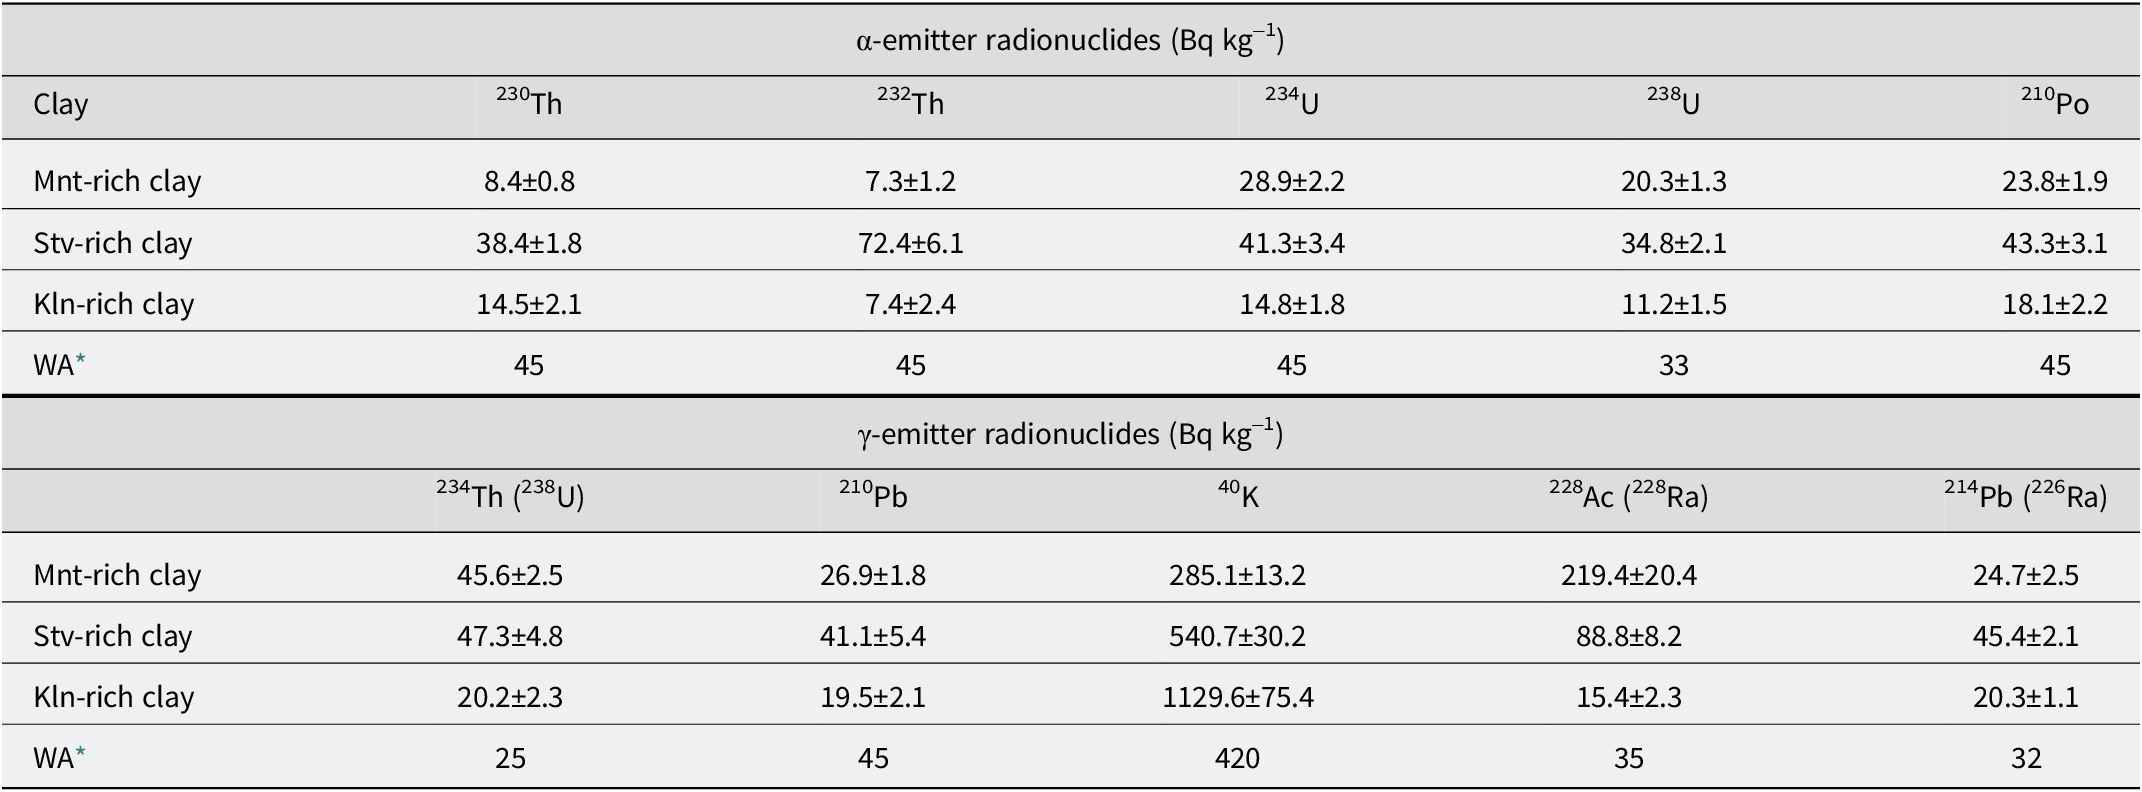
The natural radioactivity of the clays revealed clear contrasts in the solid fractions. Radionuclide activity concentrations for the Mnt-, Kln- and Stv-rich clays are presented in Table 1. The Stv-rich clay exhibited greater activity concentrations for several natural radionuclides. The activity of 232Th for the Mnt-rich clay (7.3 Bq kg–1) and the Kln-rich clay (7.40 Bq kg–1) did not exceed the worldwide average of 45 Bq kg–1 (UNSCEAR, 2008), while Stv-rich clay had a value of 72.4 Bq kg–1 which was nearly twice as high. The activity of 238U was 20, 35, and 11 Bq kg–1 for the Mnt-, Stv-, and Kln-rich clays, respectively, all below or close to the average of 33 Bq kg–1 (UNSCEAR, 2008). The concentrations of 210Po in the Mnt-, Stv-, and Kln-rich clays were 24, 43, and 18 Bq kg–1, respectively, falling within the typical range of 20–240 Bq kg–1 for various soils (Persson and Holm, Reference Persson and Holm2011). The activity of 210Pb in the Stv-rich clay was 41 Bq kg–1, nearly twice that of the Mnt-rich clay (27 Bq kg–1) and the Kln-rich clay (20 Bq kg–1), and slightly above the typical activity level of 25 Bq kg–1 in unperturbed soil (Mihailović et al., Reference Mihailović, Vasić, Todorović, Hansman, Vasin and Krmar2014).
α and γ emissions of the Mnt-rich, Kln-rich, and Stv-rich clays

Table 1. Long description
The table is divided into two main horizontal sections.
Section 1: alpha-emitter radionuclides in Bq per kg.
Columns list Thorium 230, Thorium 232, Uranium 234, Uranium 238, and Polonium 210.
* Mnt-rich clay: 8.4 plus or minus 0.8, 7.3 plus or minus 1.2, 28.9 plus or minus 2.2, 20.3 plus or minus 1.3, 23.8 plus or minus 1.9.
* Stv-rich clay: 38.4 plus or minus 1.8, 72.4 plus or minus 6.1, 41.3 plus or minus 3.4, 34.8 plus or minus 2.1, 43.3 plus or minus 3.1.
* Kln-rich clay: 14.5 plus or minus 2.1, 7.4 plus or minus 2.4, 14.8 plus or minus 1.8, 11.2 plus or minus 1.5, 18.1 plus or minus 2.2.
* W A (Worldwide Average): 45, 45, 45, 33, 45.
Section 2: gamma-emitter radionuclides in Bq per kg.
Columns list Thorium 234 (Uranium 238), Lead 210, Potassium 40, Actinium 228 (Radium 228), and Lead 214 (Radium 226).
* Mnt-rich clay: 45.6 plus or minus 2.5, 26.9 plus or minus 1.8, 285.1 plus or minus 13.2, 219.4 plus or minus 20.4, 24.7 plus or minus 2.5.
* Stv-rich clay: 47.3 plus or minus 4.8, 41.1 plus or minus 5.4, 540.7 plus or minus 30.2, 88.8 plus or minus 8.2, 45.4 plus or minus 2.1.
* Kln-rich clay: 20.2 plus or minus 2.3, 19.5 plus or minus 2.1, 1129.6 plus or minus 75.4, 15.4 plus or minus 2.3, 20.3 plus or minus 1.1.
* W A (Worldwide Average): 25, 45, 420, 35, 32.
* WA: worldwide average according to UNSCEAR (2008).
The activity of 234Th was measured at 46 Bq kg–1 in the Mnt-rich clay, at 47 Bq kg–1 in the Stv-rich clay, and at 20 Bq kg–1 in the Kln-rich clay. The Kln-rich clay falls below the average gamma radiometric background of 25 Bq kg–1 typically reported for agricultural soils, whereas the 234Th activity in the Stv- and Mnt-rich clays is nearly twice this reference value (Ramos-Lerate et al., Reference Ramos-Lerate, Lozano-Bermejo, Burneo, Armijos, Piñero, Bolívar and Gázquez2024). 214Pb, a decay product of 226Ra, showed activities of 25 Bq kg–1 in the Mnt-rich clay, 45 Bq kg–1 in the Stv-rich clay, and 20 Bq kg–1 in the Kln-rich clay, slightly exceeding the average of 32 Bq kg–1 for undisturbed soils for the Stv-rich clay. In contrast, 228Ac (228Ra), associated with the 232Th decay series, showed significant activity in the Mnt-rich clay (219 Bq kg–1) and the Stv-rich clay (89 Bq kg–1), consistent with their high Th concentrations measured by ICP-OES as 47.7 mg kg–1 for the Mnt-rich clay and 20.3 mg kg–1 for the Stv-rich clay (Table S1). Maximum 40K activity was obtained in the Kln-rich clay (1130 Bq kg–1), followed by the Stv-rich clay (541 Bq kg–1) and the Mnt-rich clay (285 Bq kg–1), whereas the activity concentration of 40K in unperturbed soils is ~420 Bq kg–1 (UNSCEAR, 2008). This observation is consistent with XRF-derived K2O contents, which were greatest in the Kln-rich clay (3.9%), moderate in the Stv-rich clay (2.0%), and lowest in the Mnt-rich clay (0.8%) (Table S1).
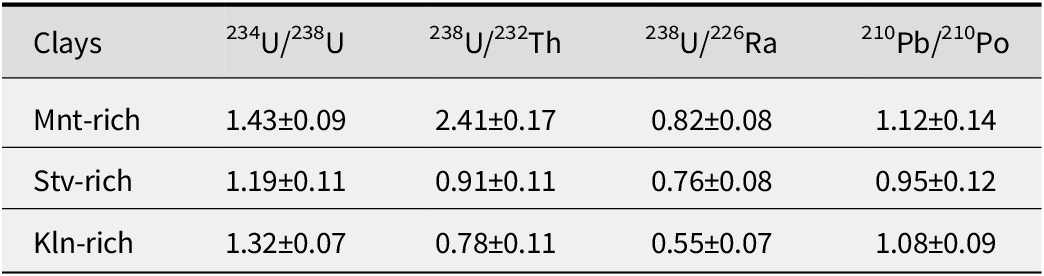
Regarding U and Th series equilibrium, the 234U/238U and 238U/226Ra ratios in the Stv-rich clay are close to unity, indicating that radioelements in the 238U decay chain are in secular equilibrium (Table 2). For the Mnt- and Kln-rich clays, these ratios are far from unity, indicating disequilibrium. The 238U/232Th ratios of the Mnt-, Stv-, and Kln-rich clays are 2.87, 0.91, and 0.78, respectively, demonstrating disequilibrium between U and Th decay chains. By comparing the 210Pb/210Po ratios, all three clays are near unity, implying secular equilibrium between these two isotopes. The elevated activities of members of the 232Th and 238U decay series in the Stv-rich solid clay phase warrant careful consideration, particularly for its use in construction. To evaluate their potential use in building materials, the activity concentration index (ACI), as defined by the European Council (2013) Directive Annex VIII, provides an appropriate regulatory screening tool for 226Ra, 232Th, and 40K (UNSCEAR, 2000). Although a full ACI calculation was beyond the scope of the present work, the elevated 232Th activity of 72.4 Bq kg–1 suggests that the Stv-rich clay might approach or exceed regulatory exemption levels for large-scale use in buildings, whereas the Mnt- and Kln-rich clays present significantly lower radiological concerns (European Council, 2013).
Activity ratios in Mnt-, Kln-, and Stv-rich clays

Table 2. Long description
The table consists of five columns and four rows including the header.
Column headers from left to right are: Clays, 234 U super / 238 U, 238 U super / 232 T h, 238 U super / 226 R a, and 210 P b super / 210 P o.
Row 1: Mnt-rich clays. Values are 1.43 plus or minus 0.09, 2.41 plus or minus 0.17, 0.82 plus or minus 0.08, and 1.12 plus or minus 0.14.
Row 2: Stv-rich clays. Values are 1.19 plus or minus 0.11, 0.91 plus or minus 0.11, 0.76 plus or minus 0.08, and 0.95 plus or minus 0.12.
Row 3: Kln-rich clays. Values are 1.32 plus or minus 0.07, 0.78 plus or minus 0.11, 0.55 plus or minus 0.07, and 1.08 plus or minus 0.09.
Contamination assessment
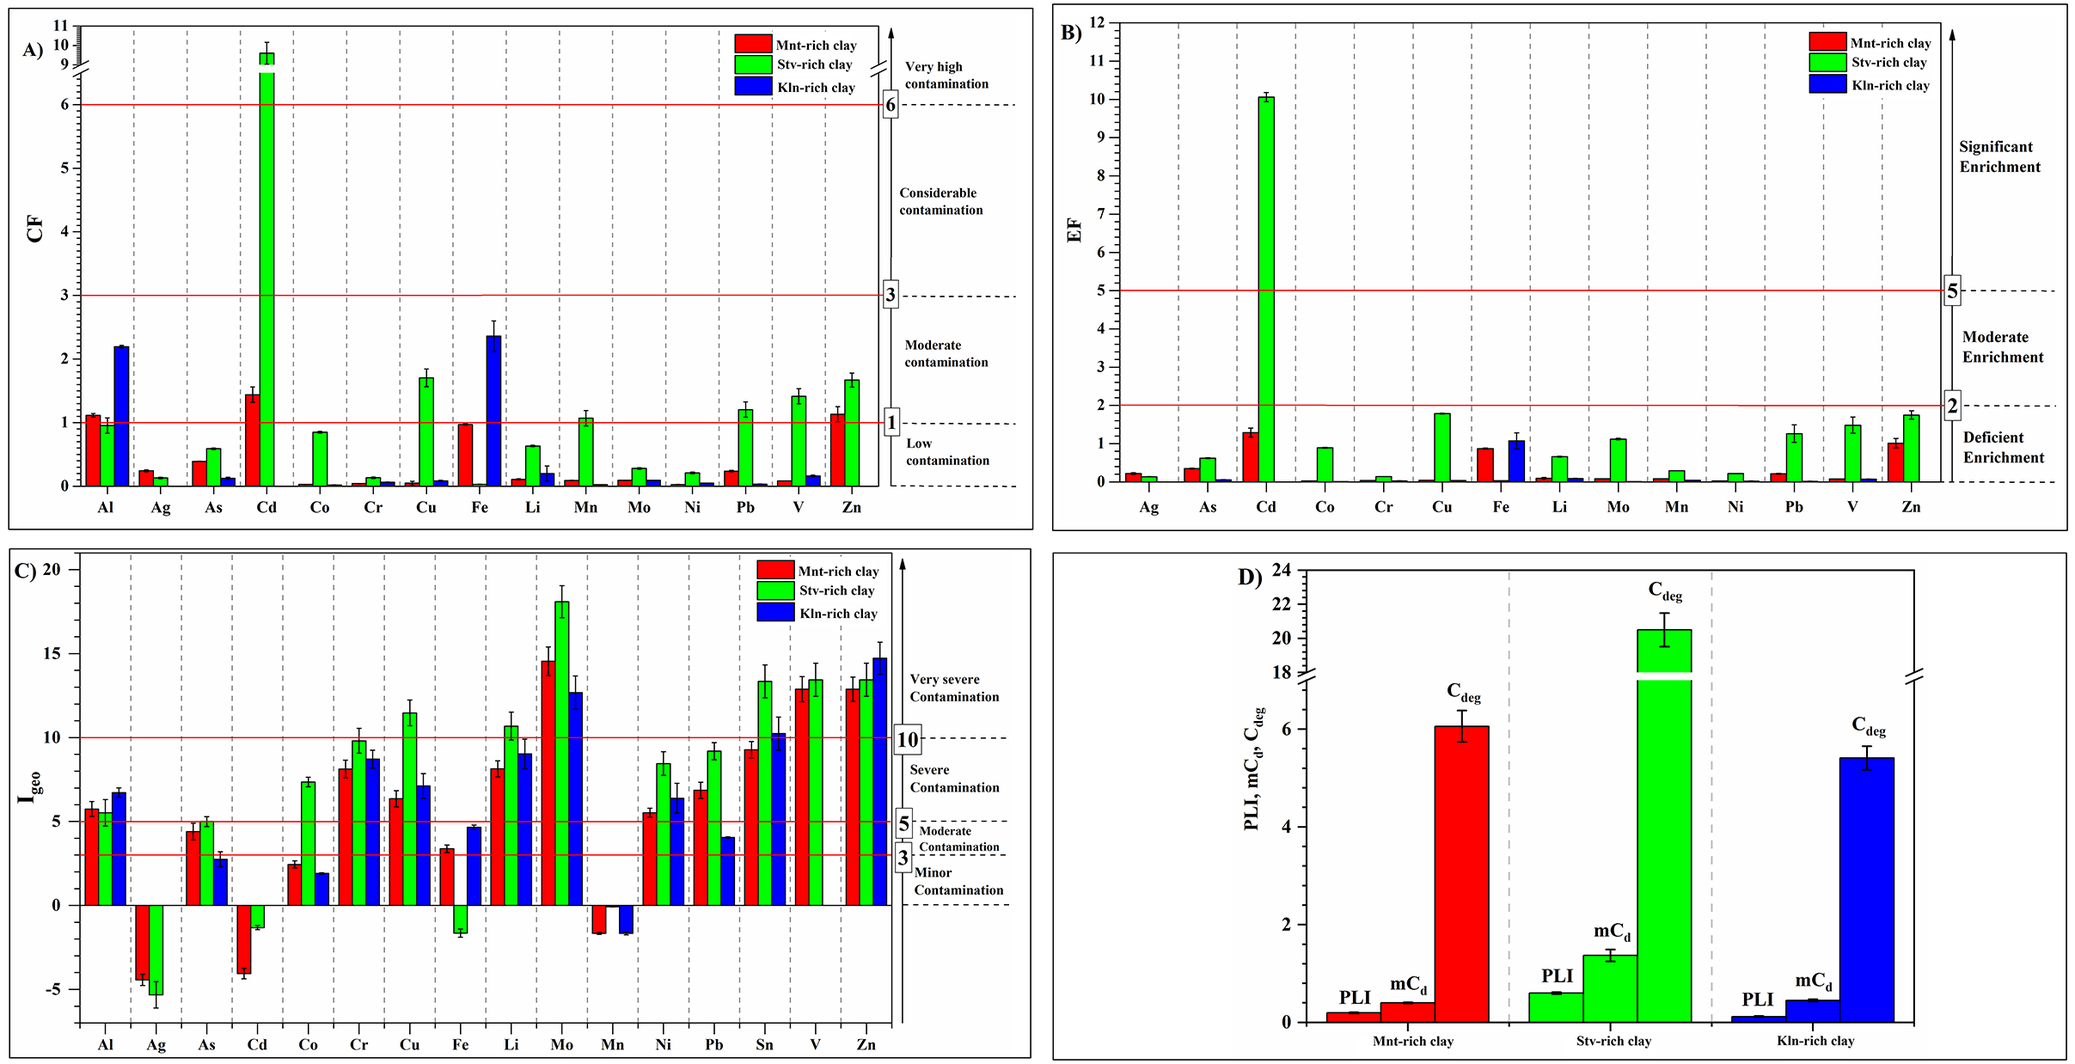
The assessment of the contamination levels of the Mnt-, Kln-, and Stv-rich clays was made by comparing their elemental concentrations to those reported for typical clay rocks (Kabata-Pendias, Reference Kabata-Pendias2011). The resulting contamination indices (CF, PLI, Cdeg, mCd, EF, and I geo) for the three clay types are shown in Fig. 3.
Contamination assessment indices: CF (A), EF (B), I geo (C) and PLI, mC d (D) for Mnt-rich clay (shown in red), Stv-rich clay (green), and Kln-rich clay (blue).

Figure 3. Long description
A multi-panel figure with four charts labeled A through D. Each chart compares Mnt-rich clay in red, Stv-rich clay in green, and Kln-rich clay in blue.
* Panel A: Bar chart of C F values for 15 elements from A l to Z n. The y-axis ranges from 0 to 10. Horizontal red lines indicate thresholds at 1 (low contamination), 3 (moderate), and 6 (considerable). Stv-rich clay shows a massive peak for C d exceeding 9, indicating very high contamination.
* Panel B: Bar chart of E F values for 13 elements. The y-axis ranges from 0 to 12. Thresholds are set at 2 (deficient enrichment) and 5 (moderate enrichment). Stv-rich clay shows a significant enrichment peak for C d at approximately 10.
* Panel C: Bar chart of I geo values. The y-axis ranges from -5 to 20. Thresholds are at 3 (minor), 5 (moderate), and 10 (severe). Most elements show positive values, with M o and Z n reaching the highest levels between 12 and 18, indicating very severe contamination.
* Panel D: Bar chart for P L I, m C sub d, and C sub d e g grouped by clay type. Mnt-rich clay and Kln-rich clay show C sub d e g values around 5 to 6. Stv-rich clay shows a significantly higher C sub d e g value exceeding 20, while P L I and m C sub d remain below 2 for all groups.
The contamination factor (CF) analysis, calculated using Eqn (2), was employed to distinguish the materials at a bulk elemental level and revealed distinct contamination signatures across the three clay types (Fig. 3A). The Mnt-rich clay exhibited moderate contamination for Cd (CF Cd=1.44), Zn (CF Zn=1.13), and Al (CFAl=1.12), while other elements remained at low contamination levels (CF<1). The Stv-rich clay demonstrated the highest contamination burden, dominated by a very high CF Cd=9.60. This is accompanied by moderate enrichments of Cu ( CF Cu=1.70), Zn (CF Zn=1.67), V (CF V=1.41), Pb (CF Pb=1.21), and Mn (CF Mn=1.07). In contrast, the Kln-rich clay generally appeared uncontaminated, showing only moderate CFs for Fe (CF Fe=2.36) and Al (CF Al=2.19), with the majority of PTEs falling below unity. The resulting contamination hierarchy is: Stv-rich clay≫Mnt-rich clay>Kln-rich clay, primarily driven by the significant Cd anomaly in the Stv-rich clay. The elevated CF Cd in the Stv-rich clay is of particular concern because of the significant mobility, toxicity, and strong bioaccumulation potential of Cd (WHO, 2010; ATSDR, 2012).
To investigate the origin of the elemental enrichments, the enrichment factor (EF), calculated using Eqn (3) with Al as the reference element, and the geo-accumulation index (I geo), calculated using Eqn (4), were applied. The EF values (Fig. 3B) support a natural origin for most PTEs, with all three clays showing minimal enrichment (EF<2) for most elements, except Cd (EF Cd=10), classified as severe enrichment and strongly suggests potential anthropogenic influence. The EF of Fe in Kln-rich clay (EF Fe=2.47) is attributable to the mineralogy of the clay rather than any anthropogenic input. The I geo provides a contrasting perspective (Fig. 3C), with some elements exhibiting large values. However, these readings are highly sensitive to the choice of background, as using global upper-crust baselines can over-flag lithologies that are naturally enriched (Agyeman et al., Reference Agyeman, John, Kebonye, Ahado, Borůvka, Němeček and Vašát2022). Given that the PLI remains low (PLI<1) for all clays, large I geo values probably reflect the natural geochemical composition of the deposits rather than widespread anthropogenic contamination. The EF Cd in Stv-rich clay is the primary exception, warranting further investigation. EF values can depend on the choice of background reference concentrations and the normalization element; therefore, EF results should be interpreted in conjunction with CF and PLI data and, most critically, alongside evidence of elemental mobility (Xu et al., Reference Xu, Peng, Su, Gao, Gao and Li2018).
To obtain an integrated measure of overall contamination, integrated indices such as the pollution load index (PLI), degree of contamination (C deg), and modified degree of contamination (mC d) were calculated using Eqns (4–6) (Fig. 3D). The calculated PLI values for all three clays are below the critical threshold of 1 (Kln-rich clay = 0.12, Mnt-rich clay = 0.20, Stv-rich clay = 0.60), indicating that they are unpolluted on a composite basis and suggesting a low overall contaminant loading despite element-specific anomalies. This aligns with low PLI contexts reported globally (Basha and Issa, Reference Basha and Issa2025). The mC d reinforces this conclusion, with all values falling in the low contamination category (mC d<1.5). However, these integrated indices are considered alongside element-specific metrics (CFs), as they can mask hazards from individual elements such as the high CF Cd in Stv-rich clay.
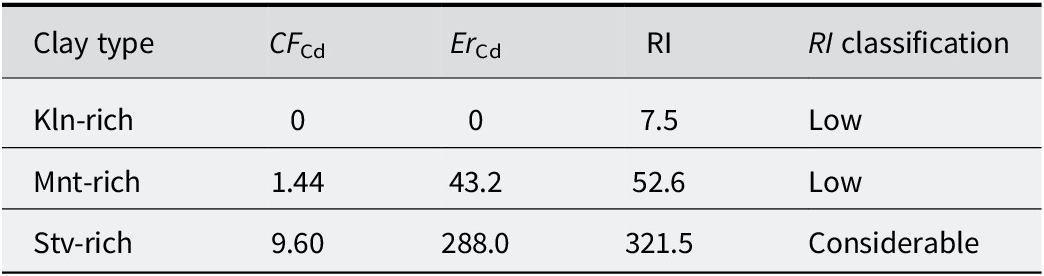
The potential ecological risk index (RI), calculated with Eqn (10), incorporates toxicity response factors (T ri) from Hakanson (Reference Hakanson1980) to provide an ecologically relevant perspective (Table S1). The RI values indicate that the Kln-rich clay and the Mnt-rich clay pose a low ecological risk (RI<150). However, the Stv-rich clay sample registers a considerable ecological risk (300≤RI<600), with the individual ecological risk factor for Cd (Er Cd=288), calculated using Eqn (9) representing the dominant contribution (Table 3). The results confirm that the Cd contamination in the Stv-rich clay is not only a geochemical anomaly but also a significant ecological concern.
Potential ecological risk factor (Er i) and index (RI) for the clays studied

Table 3. Long description
The table consists of five columns: Clay type, C F sub C d, E r sub C d, R I, and R I classification.
* Row 1: K l n-rich clay has a C F sub C d of 0, an E r sub C d of 0, an R I of 7.5, and a Low R I classification.
* Row 2: M n t-rich clay has a C F sub C d of 1.44, an E r sub C d of 43.2, an R I of 52.6, and a Low R I classification.
* Row 3: S t v-rich clay has a C F sub C d of 9.60, an E r sub C d of 288.0, an R I of 321.5, and a Considerable R I classification.
A footnote specifies that C F equals contamination factor.
CF = contamination factor.
Based on the integrated assessment, which confirmed elevated contamination factor (CF Cd), enrichment factor ( EF Cd), and a considerable ecological risk (RI=319.5) for Cd in the Stv-rich clay deposit through multi-variate analysis, this site was identified as the primary hotspot requiring immediate follow-up. Consequently, it was prioritized for bioaccessibility testing using the EN 12457-2 leaching protocol (EN 12457-2, 2002) to quantify cadmium mobility under standardized conditions, enabling direct comparison with European Waste Acceptance Criteria (WACs) (European Council, 2003).
To elucidate geochemical relationships and classify the three clay samples, multi-variate statistical techniques were employed based on their concentrations of 15 trace elements (Al, Ag, As, Cd, Co, Cr, Cu, Fe, Li, Mn, Mo, Ni, Pb, V, and Zn). Principal component analysis (PCA) revealed distinct elemental fingerprints, allowing for unambiguous differentiation. The first two principal components, F1 and F2, explained 100% of the total variance, with F1 accounting for 82.9% and F2 for 17.1%. The correlation circle (Fig. S2, Supplementary material) showed that Cd, Pb, Mn, Co, Mo, V, Cu, Ni, Li, Cr, As, and Zn were strongly and positively correlated with F1, while Al and Fe were negatively correlated. The projection of observations onto the F1–F2 plane (Fig. S2) clearly differentiated the three clays. The Stv-rich clay was positioned at the extreme positive end of F1, associated with the group of trace elements. The Kln-rich clay was located on the negative side of F1 and F2, associated with higher relative concentrations of Al. The Mnt-rich clay was uniquely distinguished by its high positive score on F2, driven by its Ag and Zn content. The resulting HCA dendrogram, using Euclidean distance and Ward’s method, corroborated the PCA findings, yielding three distinct clusters corresponding to the three clay types. The Stv-rich clay was separated at a high linkage distance, highlighting its pronounced geochemical distinctiveness. The synergistic application of PCA and HCA demonstrates that the three clays possess statistically distinct chemical compositions. The Stv-rich clay is distinguished by its uniquely large trace elements contents, e.g. Cd, V, Mn, Cu, and Pb. The Kln-rich clay is characterized as an alumina-rich clay with low levels of these trace elements. The Mnt-rich clay holds an intermediate position but is uniquely identified by its enrichment in zinc and silver.
Leaching behavior
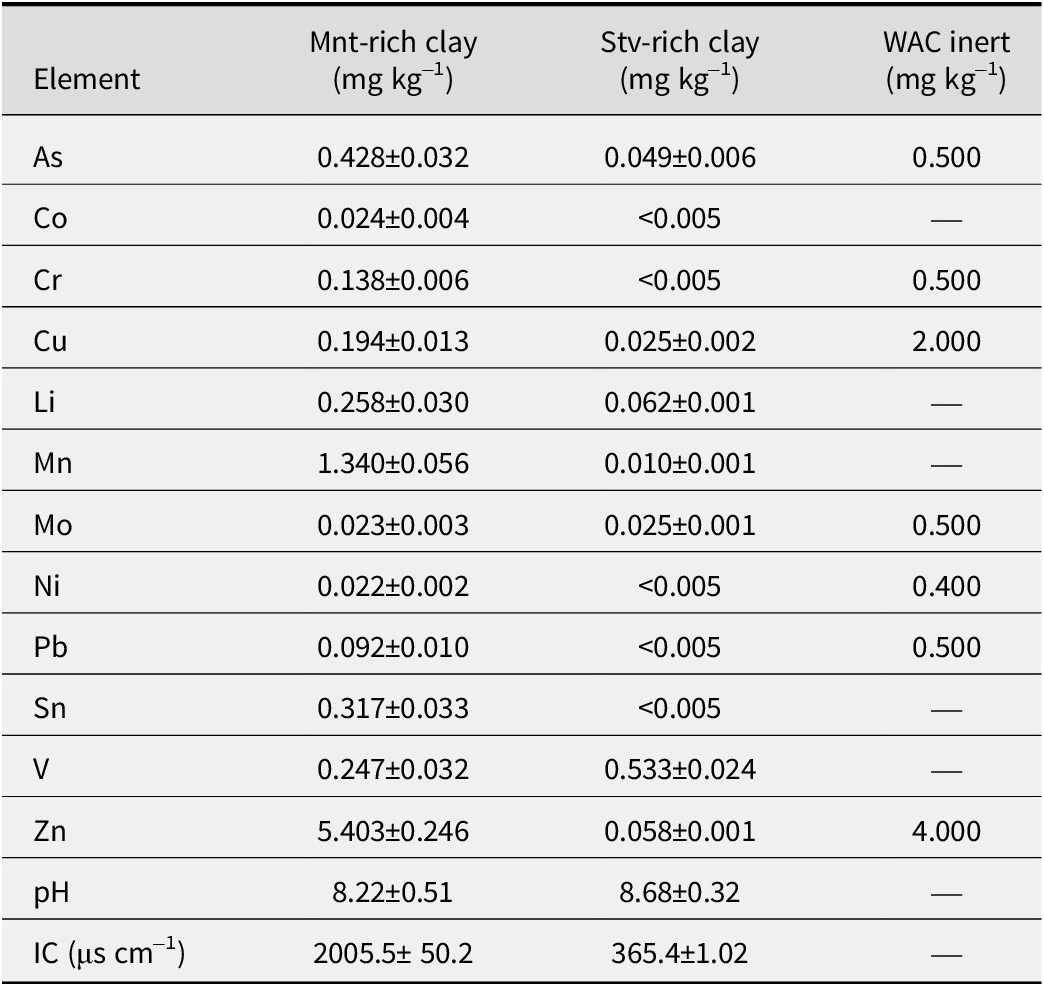
To assess the effective mobility of contaminants, standardized leaching tests were conducted according to EN 12457-4, 2002. The leached concentrations from the test (L/S=10) for the Mnt-rich clay and the Stv-rich clay is shown in Table 4. At the measured pH values (8.2 for the Mnt-rich clay; 8.7 for the Stv-rich clay) and with contrasting ionic conductivities (2005 μS cm–1 and 365 μS cm–1, respectively), the Mnt-rich clay exhibited significantly higher releases of several cations, notably Zn=5.4 mg kg–1 and Mn=1.3 mg kg–1.
Comparison of leached concentrations (mg kg–1) with WAC criteria (L/S=10)

Table 4. Long description
The table contains 14 rows of data across four columns: Element, Mnt-rich clay (mg kg sub -1), Stv-rich clay (mg kg sub -1), and W A C inert (mg kg sub -1).
* A s: Mnt 0.428 plus or minus 0.032, Stv 0.049 plus or minus 0.006, W A C 0.500.
* C o: Mnt 0.024 plus or minus 0.004, Stv less than 0.005, W A C not listed.
* C r: Mnt 0.138 plus or minus 0.006, Stv less than 0.005, W A C 0.500.
* C u: Mnt 0.194 plus or minus 0.013, Stv 0.025 plus or minus 0.002, W A C 2.000.
* L i: Mnt 0.258 plus or minus 0.030, Stv 0.062 plus or minus 0.001, W A C not listed.
* M n: Mnt 1.340 plus or minus 0.056, Stv 0.010 plus or minus 0.001, W A C not listed.
* M o: Mnt 0.023 plus or minus 0.003, Stv 0.025 plus or minus 0.001, W A C 0.500.
* N i: Mnt 0.022 plus or minus 0.002, Stv less than 0.005, W A C 0.400.
* P b: Mnt 0.092 plus or minus 0.010, Stv less than 0.005, W A C 0.500.
* S n: Mnt 0.317 plus or minus 0.033, Stv less than 0.005, W A C not listed.
* V: Mnt 0.247 plus or minus 0.032, Stv 0.533 plus or minus 0.024, W A C not listed.
* Z n: Mnt 5.403 plus or minus 0.246, Stv 0.058 plus or minus 0.001, W A C 4.000.
* p H: Mnt 8.22 plus or minus 0.51, Stv 8.68 plus or minus 0.32, W A C not listed.
* I C (mu s cm sub -1): Mnt plus or minus 50.2, Stv 365.4 plus or minus 1.02, W A C not listed.
WAC = waste acceptance criteria (European Council, 2003). L/S = liquid to solid ratio.
In contrast, the Stv-rich clay showed at or below detection levels for Co, Cr, Ni, Pb, and Sn (<0.005 mg kg-1), but higher values for oxyanions such as V=0.53 mg kg–1 and Mo=0.02 mg kg–1. The asymmetry reflects the high CEC of both smectites, which favors cation retention, and the decrease in oxyanion adsorption (molybdate, vanadate, arsenate) under neutral-to-alkaline conditions, especially where Fe/Al-oxide surface sites are scarce (Dzombak and Morel, Reference Dzombak and Morel1991; Goldberg et al., Reference Goldberg, Forster and Godfrey1996). The mineralogy of the Stv-rich clay, dominated by Mg-rich stevensite often associated with dolomite, contributes to its slightly higher eluate pH and the reduced density of Fe/Al-oxide sorbents. The much greater IC of the Mnt-rich clay eluate pH further indicates greater ionic release, consistent with the desorption of exchangeable cations (Na+, Ca2+, Mg2+). When converted to mg kg–1 at L/S=10 for direct comparability with the WAC set by the European Council (2003), the Stv-rich clay sample met all thresholds for inert waste for As, Cr, Cu, Ni, Pb, Zn, and Mo. The Mnt-rich clay sample exceeded the inert waste limit only for zinc (5.40 mg kg–1 vs a limit of 4 mg kg–1) but remained far below the established limit for non-hazardous waste (50 mg kg-1).
In addition to the dominant smectite phases, feldspars (K-feldspar, Na-feldspar, and anorthite) present in the Mnt-rich clay may influence leaching through partial dissolution reactions. Under mildly alkaline conditions, feldspar hydrolysis releases alkali and alkaline-earth cations (Na+, K+, Ca2+) into solution, thereby increasing ionic strength and electrical conductivity (Blume et al., Reference Blume, Brümmer, Fleige, Horn, Kandeler, Kögel-Knabner, Kretzschmar, Stahr and Wilke2015; Collin et al., Reference Collin, Fournier, Charpentier, Moskura and Gin2018; Thanooja et al., Reference Thanooja, Arun, Rahman, Silpa, Manu and Naveena2025). Elevated ionic strength promotes competitive cation exchange on smectite surfaces, which can enhance the desorption of exchangeable trace metals such as Zn2+ and Mn2+, consistent with the high conductivity (2005 μS cm-1) and elevated Zn and Mn concentrations measured in the Mnt-rich clay eluate.
In the Stv-rich clay, carbonate minerals (calcite and dolomite) probably controlled the leachate pH through dissolution and buffering reactions, maintaining mildly alkaline conditions (pH 8.68). Carbonate buffering at alkaline pH is known to reduce the sorption affinity of mineral surfaces for oxyanions and to stabilize molybdate (MoO42–) and vanadate (VO43–) species in solution (Vorlicek and Helz, Reference Vorlicek and Helz2002; Hiemstra and Lützenkirchen, Reference Hiemstra and Lützenkirchen2025). The mechanism is consistent with the greater vanadium release observed (0.533 mg kg-1). In addition, gypsum dissolution may contribute Ca2+ and SO42- to the eluate, modifying ionic composition and influencing trace-element speciation. In summary, leaching behavior is controlled by the interplay between smectite properties, associated mineral phases, and geochemical factors such as pH and redox conditions, which regulate element speciation and desorption (Schoonheydt and Johnston, Reference Schoonheydt, Johnston, Bergaya, Theng and Lagaly2006).
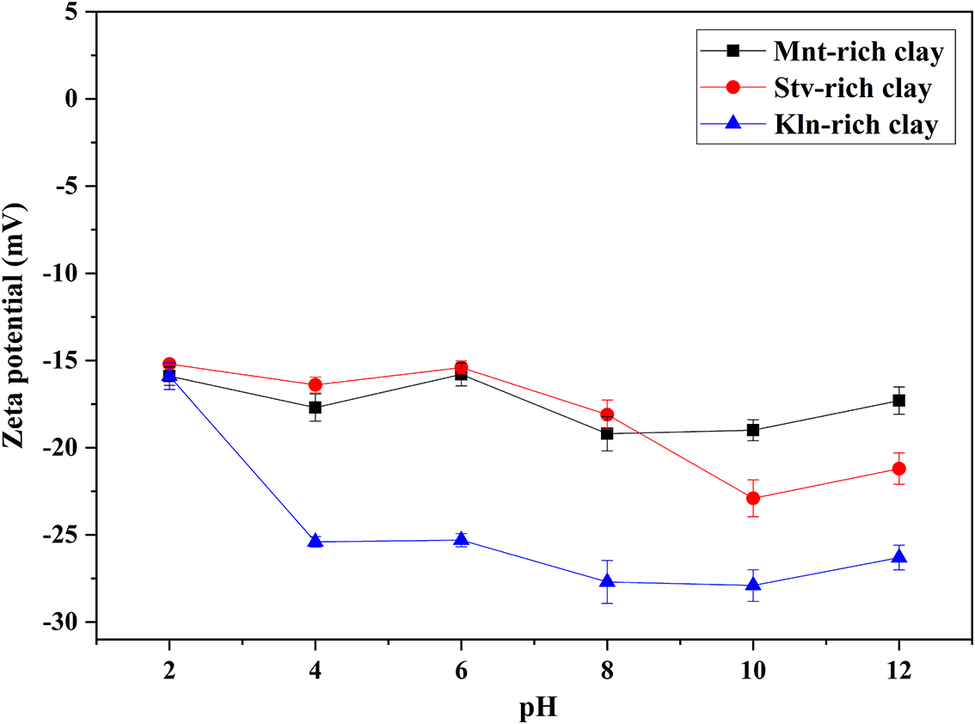
Zeta potential measurements performed over a wide pH range (2–12) confirmed that all three clays maintain a negative surface charge across the investigated conditions (Fig. 4). No isoelectric point was observed. The Mnt-rich clay exhibited zeta potentials ranging from –15.9 to –19.2 mV, the Stv-rich clay from –15.2 to –22.9 mV, and the Kln-rich clay from –15.9 to –27.9 mV. The increasingly negative surface charge under alkaline conditions supports electrostatic repulsion of negatively charged oxyanions such as molybdate and vanadate. These results provide direct experimental support for the proposed mechanism explaining the enhanced mobility of Mo in the Stv-rich clay at mildly alkaline pH.
Zeta potential measurements for Mnt-rich clay, Kln-rich clay, and Stv-rich clay.

Figure 4. Long description
The X-axis represents p H ranging from 2 to 12 in increments of 2. The Y-axis represents Zeta potential in m V ranging from negative 30 to 5. A legend in the top right identifies three data series.
* M n t-rich clay (black squares): Starts at approximately minus 16 m V at p H 2, fluctuates slightly between minus15 and minus 19 m V, and ends at minus 17 m V at p H 12.
* S t v-rich clay (red circles): Starts at minus 15 m V at p H 2, remains relatively stable until p H 6, then drops to a minimum of minus 23 m V at p H 10 before rising to minus 21 m V at p H 12.
* K l n-rich clay (blue triangles): Shows the most significant drop, starting at minus 16 m V at p H 2 and falling sharply to approximately minus 25 m V at p H 4. It remains the most negative series, reaching a low of minus 28 m V at p H 10 and ending at minus 26 m V at p H 12.
All data points include vertical error bars indicating measurement variance.
Mobility of PTEs
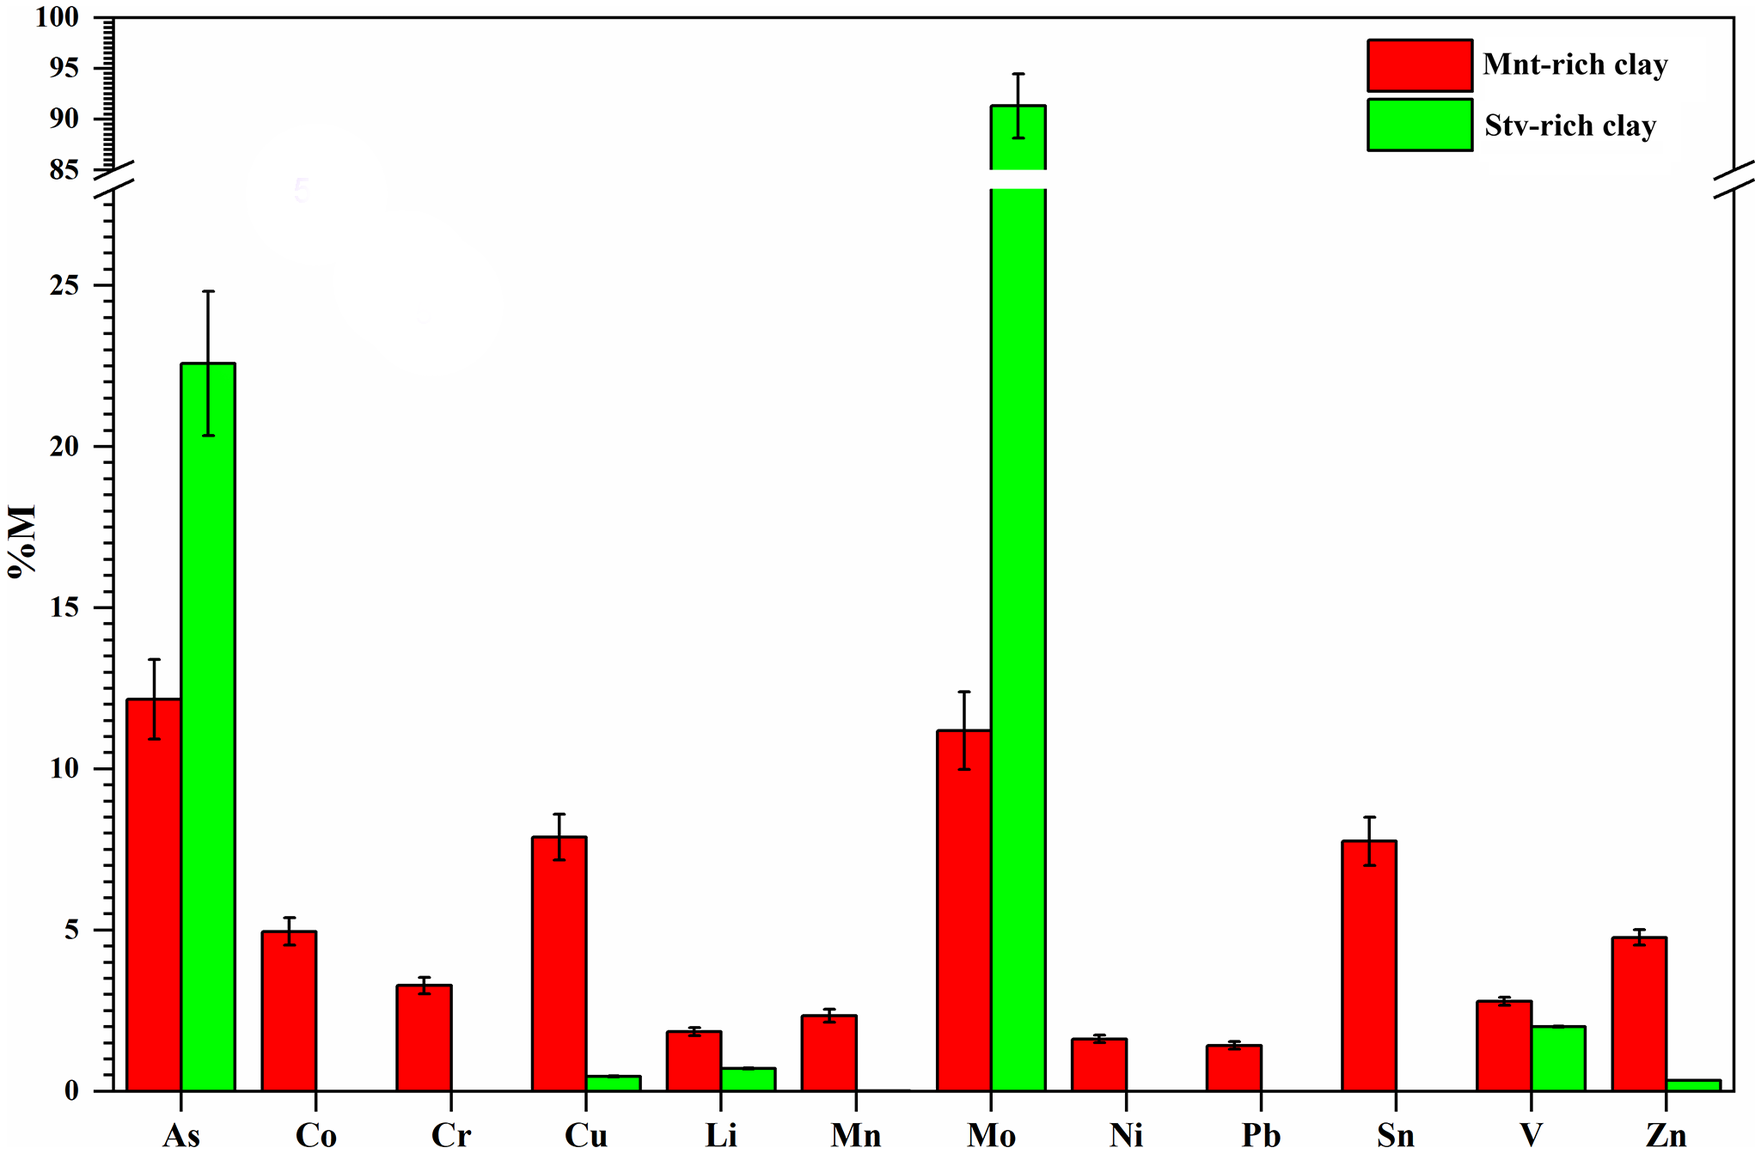
To gain a sharper mechanistic understanding, the leaching data were expressed as normalized mobilities (%M) using Eqn (11) (Fig. 5). The Mnt-rich clay showed a broad range of releases with the largest mobilities for As (12%) and Mo (11%), followed by Cu (7.9%), Co (5.0 %), and Zn (4.8%). The Stv-rich clay displayed a highly selective leaching pattern dominated by oxyanions: Mo release was exceptionally high at 91% and As release was significant at 22.6%, whereas other elements remained low (V=2%, other PTEs <1% or <LOD). Using a risk assessment classification scheme where mobilities >50% are very high, 11–30% are moderate, and 1–10% are low (Ahirvar et al., Reference Ahirvar, Das, Srivastava and Kumar2023), the mobility of Mo in the Stv-rich clay is very high, and As is moderate. The majority of elements in both clays fell into low- or very low-mobility categories.
Mobility of PTEs of Mnt-rich (red) and Stv-rich (green) clays.

Figure 5. Long description
The Y-axis is labeled percent M and ranges from 0 to 100 with a scale break between 25 and 85. The X-axis lists 12 chemical elements. A legend in the top right identifies red bars as M n t-rich clay and green bars as S t v-rich clay. Each bar includes an error bar indicating variability.
From left to right, the data shows:
* A s: M n t-rich is approximately 12 percent while S t v-rich is significantly higher at 23 percent.
* C o: M n t-rich is 5 percent. S t v-rich is negligible.
* C r: M n t-rich is 3 percent. S t v-rich is negligible.
* C u: M n t-rich is 8 percent. S t v-rich is less than 1 percent.
* L i: M n t-rich is 2 percent. S t v-rich is 1 percent.
* M n: M n t-rich is 2.5 percent. S t v-rich is negligible.
* M o: M n t-rich is 11 percent. S t v-rich shows a massive peak reaching approximately 92 percent.
* N i: M n t-rich is 2 percent. S t v-rich is negligible.
* P b: M n t-rich is 1.5 percent. S t v-rich is negligible.
* S n: M n t-rich is 8 percent. S t v-rich is negligible.
* V: M n t-rich is 3 percent. S t v-rich is 2 percent.
* Z n: M n t-rich is 5 percent. S t v-rich is less than 1 percent.
These contrasting leaching patterns are consistent with the distinct mineralogy of the clays. The mobility of oxyanions such as molybdate (MoO42–) is controlled by adsorption onto Fe and Al (oxyhydr) oxides. At the mildly alkaline pH (8.7 for the Stv-rich clay), these oxide surfaces carry a net negative charge, causing electrostatic repulsion and decreased sorption of negatively charged anions, a trend confirmed by recent studies (Zhang et al., Reference Zhang, Coker, Mosselmans and Shaw2022; Kersten, Reference Kersten2024). The inherent scarcity of Al and Fe oxide sorption sites in the Stv matrix of the Stv-rich clay drastically limits its capacity to retain these anions. This effect is compounded by the chemical speciation of arsenic; at pH 8–9, arsenite exists mainly as the neutral H3AsO3 species (pKa1=9.2), which is less strongly adsorbed than its anionic arsenate counterpart (Bowell, Reference Bowell1994; Smedley and Kinniburgh, Reference Smedley and Kinniburgh2002). In contrast, the Mnt structure contains a greater abundance of associated Al and Fe phases, offering more sites for oxyanion retention and explaining their lower mobility. Furthermore, the high ionic conductivity of the Mnt-rich clay eluate (2005 μS cm–1) versus that of the Stv-rich clay (365 μS cm–1) indicates significant release of exchangeable cations such as Na+ and Ca2+ from the interlayers of the Mnt-rich clay, a process that can promote the co-release of trace cations such as Zn2+ (Bradl, Reference Bradl2004).
Mobility of radionuclides
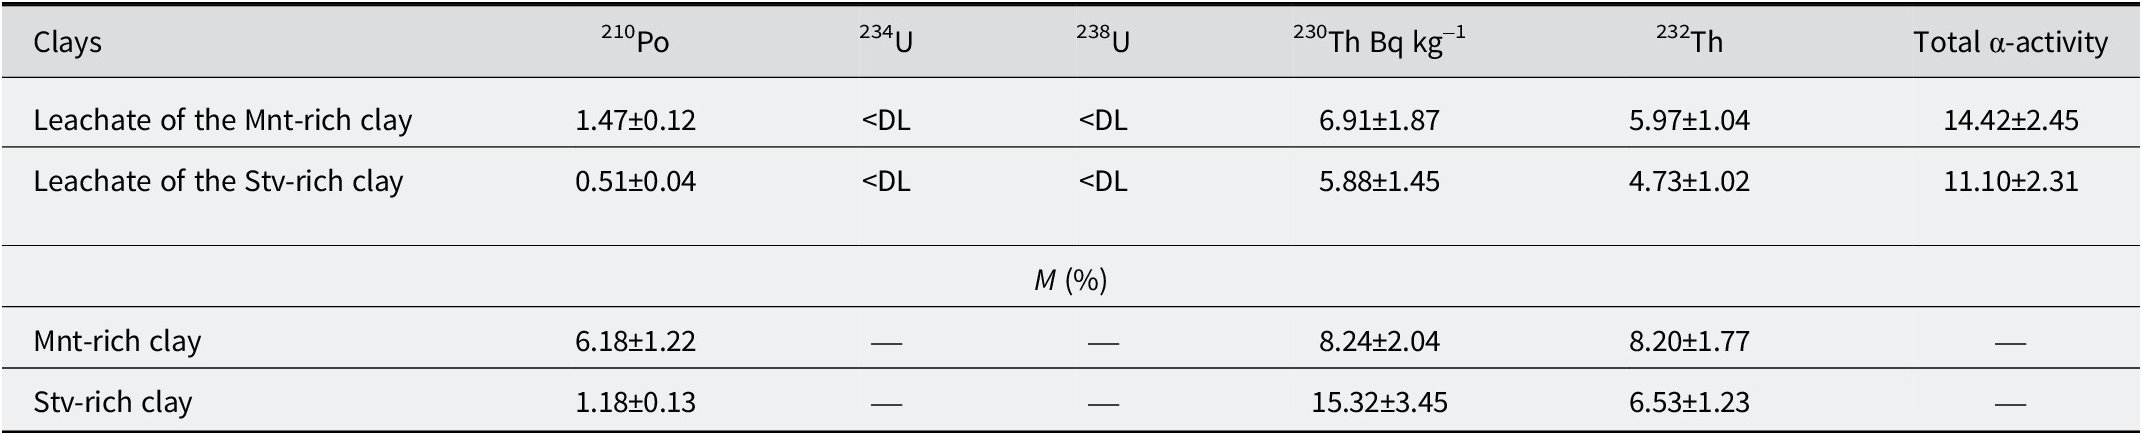
The radionuclides released into demineralized water were 210Po, 230Th, and 232Th (Table 5). In the Mnt-rich clay leachate, α-activity levels reached 1.5, 6.9, and 8.0 Bq kg–1 for 210Po, 230Th, and 232Th, corresponding to mobilities of 6–8%. For the Stv-rich clay leachate, α-activity levels were 0.50, 5.9, and 4.7 Bq kg–1 with mobilities of 1.2%, 15%, and 6.5% for 210Po, 230Th and 232Th, respectively. The total α-activity of the Mnt-rich clay leachate (14 Bq kg–1) was slightly higher than in the Stv-rich clay (11 Bq kg–1). The results indicate an overall limited release but highlight a greater mobility of 230Th in the Stv-rich clay, which is critical for applications involving contact with aqueous solutions, as prolonged exposure may increase leaching and potential radiological risks (Du and Huang, Reference Du and Huang2008).
α-Activity of leachates of the Mnt- and Stv-rich clays

Table 5. Long description
The table is organized into seven columns. The first column lists the clay types, followed by five columns for specific isotopes: 210 P o, 234 U, 238 U, 230 T h, and 232 T h. The final column shows Total alpha-activity. All activity values are measured in B q k g super -1.
Section 1: Leachate Activity
* Leachate of the M n t-rich clay: 210 P o is 1.47 plus or minus 0.12. 234 U and 238 U are both less than D L. 230 T h is 6.91 plus or minus 1.87. 232 T h is 5.97 plus or minus 1.04. Total alpha-activity is 14.42 plus or minus 2.45.
* Leachate of the S t v-rich clay: 210 P o is 0.51 plus or minus 0.04. 234 U and 238 U are both less than D L. 230 T h is 5.88 plus or minus 1.45. 232 T h is 4.73 plus or minus 1.02. Total alpha-activity is 11.10 plus or minus 2.31.
Section 2: M percentage values
* M n t-rich clay: 210 P o is 6.18 plus or minus 1.22. 230 T h is 8.24 plus or minus 2.04. 232 T h is 8.20 plus or minus 1.77. Uranium columns and total activity are blank.
* S t v-rich clay: 210 P o is 1.18 plus or minus 0.13. 230 T h is 15.32 plus or minus 3.45. 232 T h is 6.53 plus or minus 1.23. Uranium columns and total activity are blank.
Note: D L stands for detection limit.
DL = detection limit.
The observed mobility of 230Th in the Stv-rich clay (15.3%) is high, as Th(IV) is generally characterized by extremely low solubility and strong sorption. Several hypotheses may explain this unexpected mobility. First, the presence of dolomite (CaMg(CO3)2) in the Stv-rich clay can generate carbonate ions that form soluble and highly mobile thorium-carbonate complexes (e.g. Th(CO3)56–). Second, colloid-facilitated transport, where thorium is adsorbed onto fine Stv particles dispersed during the test and passed through the 0.45 μm filter, could act as a mobile carrier. A third hypothesis involves the presence of natural organic matter, which can form strong, soluble organo-thorium complexes, enhancing mobilization. The finding underscores that measuring total solid-phase activity alone is an insufficient predictor of radionuclide release and highlights a crucial area for further mechanistic investigation.
Conclusions
The present study established a direct link between the mineralogy of three Moroccan clays and their corresponding environmental risk profiles, creating a hierarchy of usability. The Stv-rich clay presents significant geochemical and radiological risks. Its mineralogical composition, dominated by magnesium-rich Stv with low Fe-Al oxide phases, fosters an environment that promotes the mobility of hazardous oxyanions, particularly As and Mo (Mo = 91% leached), under alkaline conditions. The effect is compounded by a severe solid-phase Cd enrichment (CF=9.6) and elevated natural radioactivity, with activity concentrations for 232Th reaching ~72 Bq kg–1.
In contrast, the Mnt-rich clay exhibited moderate contamination but more stable environmental behavior. Its montmorillonitic mineralogy confers a high cation exchange capacity (CEC = 89 meq 100 g–1), which effectively immobilizes potentially toxic cationic elements. Nevertheless, its leachate is cation rich, and it contained a substantial total reservoir of zinc, causing its leachate to exceed the EU inert waste limit for Zn (5.4 mg kg–1) and classifying it as non-hazardous waste for disposal purposes. The Kln-rich clay stands as the benchmark for safety and purity. Its kaolinitic composition, chemical inertness, and low contaminant mobility resulted in PTE concentrations generally at or below natural background levels, positioning it as the preferred material for high-purity pharmaceutical, food, and cosmetic applications.
The findings demonstrate that total elemental concentration is an insufficient predictor of environmental risk; instead, leaching behavior governed by mineral-specific surface chemistry is the primary controlling factor. To develop a predictive understanding of long-term performance, future investigations must progress beyond single-batch tests. A comprehensive, multi-faceted approach is required, incorporating pH-static leaching tests (e.g. CEN/TS 14429) to delineate the pH-dependent mobility of both cations and oxyanions, and kinetic column leaching experiments (e.g. EN 14405) to evaluate cumulative release rates over time. Furthermore, applying sequential extraction procedures would provide invaluable insight into the geochemical partitioning and potential bioavailability of contaminants. Finally, the experimental validation of targeted stabilization strategies, such as amending the Stv-rich clay with Fe/Mn-(hydr)oxides to sequester mobile oxyanions, represents a crucial next step towards mitigating the identified risks and enabling the safe and sustainable use of this material.
Supplementary material
The supplementary material for this article can be found at http://doi.org/10.1017/cmn.2026.10042.
Acknowledgments
The authors gratefully acknowledge the Department of Chemistry, Faculty of Sciences, Mohamed First University (Oujda, Morocco) for institutional support and access to laboratory facilities. They also thank Professor Juan Pedro Bolívar Raya (and the Center on Natural Resources, Health and the Environment (RENSMA), University of Huelva, Spain, for performing the radioactivity measurements and for helpful scientific discussions. Finally, we are indebted to Dr Erwan-Nicolas Paineau (Laboratoire de Physique des Solides, Université Paris-Saclay, Orsay, France) for his careful reading of the manuscript and insightful comments that improved the clarity and rigor of this work.
Data availability statement
Data will be made available on request.
Author contributions
Conceptualization: H. A., M. J., E. G.; Formal analysis: H. A.; Funding acquisition: H. A., E. G.; Methodology: H. A., M. J.; Project administration: J. P. B. R., N. F., M. E. O., E. G.; Resources: A. E., J. P. B. R., N. F., M. E. O., E. G.; Review: J. P. B. R., N. F., M. E. O.; Supervision: N. F., M. E. O., E. G.; Writing – original draft: H. A.; Writing – review & editing: H. A., A. D., M. J., A. E., E. G.
Financial support
This research received no specific grant from any funding agency, commercial, or not-for-profit sectors.
Competing interests
The authors declare that they have no known competing financial interests or personal relationships that could have appeared to influence the work reported in this paper.