





1 Introduction
Over the past few decades, technological advancements such as Q-switching[
Reference McClung and Hellwarth1], mode locking[
Reference Hargrove, Fork and Pollack2] and chirped pulse amplification[
Reference Stricklan and Mourou3] have enabled a remarkable escalation in laser peak power, from gigawatts (
${10}^9$
 W) to multi-petawatts (
${10}^{15}$
 W)[
Reference Wang, Liu, Shen, Zhang, Teng and Wei4–
Reference Zeng, Zhou, Zuo, Zhu, Su, Wang, Wang, Huang, Jiang, Jiang, Guo, Xie, Zhou, Wu, Mu, Peng and Jing7]. Such extreme lasers have become powerful tools for investigating particle acceleration[
Reference Esarey, Schroeder and Leemans8], laboratory astrophysics[
Reference Zhong, Li, Wang, Wang, Dong, Xiao, Wang, Liu, Zhang, An, Wang, Zhu, Gu, He, Zhao and Zhang9] and attosecond pulse generation[
Reference Krausz and Ivanov10]. However, the damage of optical elements caused by laser-induced ionization and the limitation on obtaining large devices have hindered further improvement of laser intensity. While current technologies, such as coherent beam combining[
Reference Klenke, Muller, Stark, Kienel, Jauregui, Tunnermann and Limpert11] and coherent Ti:sapphire tiling[
Reference Liu, Leng, Lu, Xu and Wang12,
Reference Liu, Liu, Li, Leng and Li13], can achieve peak powers of hundreds of petawatts, these approaches have not fundamentally addressed the limitations of increasing laser intensity. Plasma-based optical elements have demonstrated the ability to withstand at least five orders of magnitude greater than traditional materials[
Reference Edwards and Michel14,
Reference Edwards, Munirov, Singh, Fasano, Kur, Lemos, Mikhailova, Wurtele and Michel15], reaching up to
${10}^{17}$
 W/cm2. This positions plasma-based optics as a promising avenue to advance into the realms of ultra-relativistic optics or even nonlinear quantum electrodynamics (QED)[
Reference Mourou, Fisch, Malkin, Toroker, Khazanov, Sergeev, Tajima and Le Garrec16].
Plasma-based amplifiers mainly include Brillouin amplification, which employs ion acoustic waves for energy transfer, and Raman amplification, which relies on electron plasma waves[ Reference Milroy, Capjack and James17]. For the former, the narrow bandwidth of the ion response constrains the amplified pulse duration to the picosecond regime. Nevertheless, the small wavelength difference between the seed and pump pulses facilitates experimental implementation, as evidenced by the demonstrated efficient joule-scale picosecond pulse amplification[ Reference Marquès, Lancia, Gangolf, Blecher, Bolaños, Fuchs, Willi, Amiranoff, Berger, Chiaramello, Weber and Riconda18]. In contrast, the electron response in the Raman process is intrinsically broadband, enabling the amplification of seed pulses as short as tens of femtoseconds[ Reference Malkin, Shvets and Fisch19]. The frequency-matching condition in Raman amplification necessitates a finite wavelength difference between the seed and pump, thereby enabling energy transfer from a long, intense short-wavelength pump to a short long-wavelength seed, albeit potentially requiring a seed at a specific wavelength. Compared to forward Raman amplification, backward Raman amplification (BRA) exhibits a greater resonant growth rate and, in the nonlinear regime, a self-compression mechanism that integrates amplification and compression into a single process. Consequently, BRA is regarded as possessing greater potential for the realization of ultrashort, ultra-intense pulse amplification and compression.
Theoretical predictions suggest that BRA can boost the laser intensity by up to six orders of magnitude and support the output pulses with few-cycle durations[ Reference Malkin, Tsidulko and Fisch20]. Experimentally, with the continuous improvement of uniform plasma generation[ Reference Ping, Cheng, Suckewer, Clark and Fisch21] and the proposal of the novel double-pass BRA method[ Reference Ren, Cheng, Li and Suckewer22, Reference Ren, Li, Morozov, Suckewer, Yampolsky, Malkin and Fisch23], amplification has progressed from the linear to the nonlinear stage[ Reference Cheng, Avitzour, Ping, Suckewer, Fisch, Hur and Wurtele24], achieving over four orders of magnitude improvement in intensity, a 10-fold increase in the pulse compression ratio and energy conversion efficiency of 6.4%[ Reference Ren, Cheng, Li and Suckewer22]. In addition, the linear growth rate of backward Raman scattering is proportional to the plasma density within a certain range, so that a high plasma density leads to a high energy conversion efficiency[ Reference Trines, Fiúza, Bingham, Fonseca, Silva, Cairns and Norreys25, Reference Lei, Sheng, Weng, Chen and Zhang26]. However, as noted in Refs. [Reference Ren, Cheng, Li and Suckewer22,Reference Trines, Fiúza, Bingham, Fonseca, Silva, Cairns and Norreys25,Reference Li, Peng, Zuo, Su and Yang27], laser filamentation and forward Raman scattering have been identified as factors that cause premature saturation of amplification and compromise seed focusability, which is contrary to the goal of achieving higher peak intensity. Consequently, to preserve the practical performance of the amplified laser pulse, BRA is typically confined to low-gain regimes characterized by low plasma density, low pump intensity or short interaction length. To enhance the conversion efficiency of BRA, previous studies have explored various approaches, including using incoherent pump pulses[ Reference Edwards, Qu, Mikhailova and Fisch28], applying intense seed pulse[ Reference Li, Wang, Wang, Zhang, Li and Wei29] and operating with pump intensities beyond the Langmuir wave-breaking threshold[ Reference Toroker, Malkin and Fisch30– Reference Clark and Fisch32]. Moreover, the uniformity of plasma density critically influences the frequency-matching conditions in BRA. Frequency detuning introduced through density-gradient plasmas has been shown to suppress noise scattering[ Reference Malkin, Shvets and Fisch33, Reference Clark and Fisch34]. Nevertheless, effective strategies for suppressing laser self-focusing and filamentation remain limited. Previous studies have investigated the self-compression mechanism of intense laser pulses in plasmas near one-quarter critical density, demonstrating that periodic density distributions can effectively modulate pulse propagation and thereby suppress filamentation instabilities[ Reference Shorokhov, Pukhov and Kostyukov35, Reference Li, Xue, Wang, Wang, Li, Li, Zhao and Wei36]. Transverse effects such as filamentation constitute a principal obstacle to extending BRA into the high-gain regime. The application of periodic density distributions to BRA may enable the pulse to maintain high spatial quality throughout the amplification process, thereby improving both the energy conversion efficiency and the practical performance of the scheme.
In this work, we present a scheme for suppressing laser self-focusing and filamentation in plasma-based BRA with the use of structured plasma. The diffraction effect inherent in the quasi-vacuum environment can to some extent balance the self-focusing of intense laser pulses in the plasma, thus mitigating intensity-induced self-focusing or filamentation. This approach addresses the limitations imposed by plasma density in high-density BRA configurations, where the appearance of hot spots and reduced focusing ability after amplification pose significant challenges. Finally, the incorporation of structured plasma not only improves energy conversion efficiency but also maintains excellent output focusability. Consequently, this approach facilitates the extension of BRA into the high-gain regime. It advances research into femtosecond ultra-intense laser amplification, offering an important guideline for improving the practicability of BRA.
2 The concept of backward Raman amplification in structured plasma
In intense laser–plasma interaction, the transverse intensity profile of a Gaussian pulse increases the relativistic factor
$\gamma$
 of electrons in the central region. Concurrently, the ponderomotive force
${F}_\mathrm{p}$
 pushes electrons away from the center, enhancing the refractive index at the plasma center and thereby influencing laser pulse propagation. Ignoring the effect of the ponderomotive force, the threshold power for relativistic self-focusing is given by
${P}_\mathrm{c}=17.4{\left({\omega}_0/{\omega}_\mathrm{p}\right)}^2$
 [GW]; otherwise, it reduces to
${P}_\mathrm{c}=16.2{\left({\omega}_0/{\omega}_\mathrm{p}\right)}^2$
 [GW][
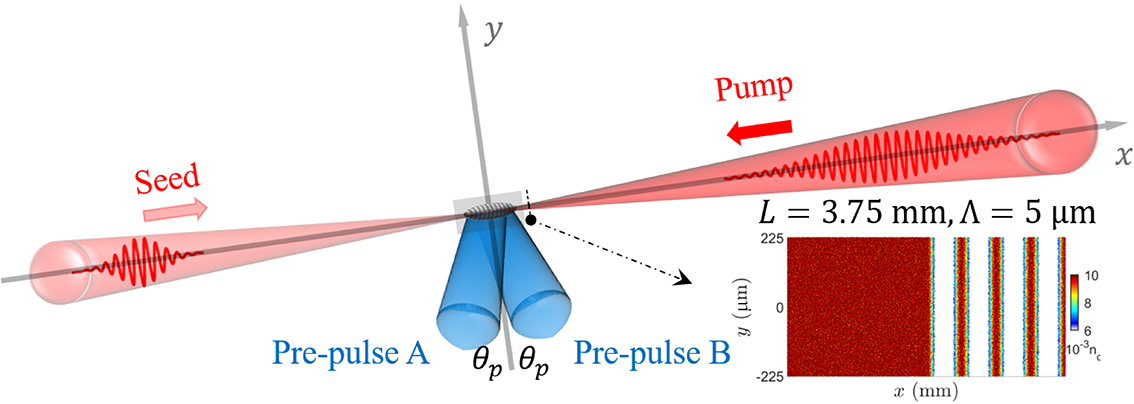
Reference Sun, Ott, Lee and Guzdar37]. Laser beams exceeding this threshold power undergo self-focusing in the plasma. In this paper, we propose a method to suppress self-focusing and filamentation of intense laser pulses in BRA by employing a structured plasma, as illustrated in Figure 1. Firstly, two pre-pump laser beams of equal power are incident on the plasma at a small angle
${\theta}_\mathrm{p}$
 along the
$y$
 -axis. Their interference generates a periodic intensity modulation with a spatial period of
$\Lambda ={\lambda}_0/2\sin \left({\theta}_\mathrm{p}\right)$
 [
Reference Edwards and Michel14,
Reference Li, Xue, Wang, Wang, Li, Li, Zhao and Wei36]. This intensity distribution redistributes the electrons, establishing a space charge field. Subsequently, the field drives ion motion, generating a structured plasma with periodic distributions in high-density and extremely low-density regions (referred to as quasi-vacuum regions here), with picosecond persistence. The period of this structure can be controlled by adjusting the parameters of the pre-pump pulses. The particle-in-cell (PIC) simulation uses a plasma length
$L$
 of 3.75 mm and is set to a structured plasma after 1.6 mm, where
$\Lambda$
 is
$5\;\mu \mathrm{m}$
 . The preset structured plasma in this work can be obtained by using two pre-pulses with a wavelength of 800 nm, an intensity of
$1\times {10}^{16}$
 W/cm
${}^2$
 and a pulse width of 600 fs at an angle of
$2\theta =9.2{}^{\circ}$
 , resulting in a periodic density distribution with a persistence of 20–30 ps. The heating of the plasma by the pre-pulses leads to a slight increase in its temperature. As the laser pulse propagates through this structured plasma, diffraction in the quasi-vacuum layers balances the self-focusing induced by the plasma layers. With this dynamic balance in place, the size of the laser spot remains constant. In BRA, the structured plasma is positioned appropriately by comparing the amplified seed with the self-focusing threshold. It is anticipated that this approach will effectively suppress self-focusing and filamentation, push the amplification to the region of high plasma density and improve the energy conversion efficiency without destroying the laser focusability.
Schematic of BRA in structured plasma. Two pump laser pulses propagate along the
$y$
 -axis through the plasma, generating a plasma periodic structure after 1.6 mm. Following a picosecond delay, the pump and seed pulses counter-propagate and interact within the plasma.

Figure 1 Long description
The diagram is set on a three-dimensional Cartesian coordinate system with x and y axes.
* Along the x-axis, two red conical laser beams counter-propagate. From the left, a Seed pulse moves in the positive x direction. From the right, a Pump pulse moves in the negative x direction. Both pulses contain oscillating wave patterns within their conical envelopes.
* At the origin where the beams intersect, two blue conical beams labeled Pre-pulse A and Pre-pulse B converge from below the x-axis. Each blue beam is angled at theta sub p relative to the vertical y-axis.
* The intersection point contains a small gray rectangular region representing the structured plasma.
* A dashed arrow points from this plasma region to an inset plot in the bottom-right.
* The inset plot is a heat map with a vertical color scale bar ranging from 6 to 10 times 10 super minus 3 n sub c. The x-axis of the inset is in millimeters and the y-axis is in micrometers ranging from minus 225 to 225. The plot shows a solid red region on the left followed by four distinct vertical red bands on the right, separated by white space.
* Above the inset, text reads L = 3.75 mm, Lambda = 5 micrometers.
3 Nonlinear equation solution for laser propagation in structured plasma
Under the paraxial and slow-varying envelope approximations, we investigated the propagation of intense laser pulses in plasmas with different structures, with particular emphasis on the evolution of the laser spot size. The background is assumed to be either a fully ionized plasma or a periodic structure consisting of alternating layers of fully ionized plasma and vacuum. Accordingly, terms related to ionization loss and plasma absorption are neglected; the form of the three-dimensional nonlinear envelope equation is as follows[ Reference Mlejnek, Wright and Moloney38]:

The first term on the right-hand side of Equation (1) describes the diffraction effect arising from the transverse
$\left(x,y\right)$
 intensity distribution during laser propagation. Here,
${\nabla}_{\perp}^2$
 denotes the transverse Laplacian operator, and
${k}_0=2\pi /{\lambda}_0$
 is the wave number in vacuum. In the absence of external perturbations, this term leads to beam divergence in free space. The second term describes the phase modulation of the optical field and the alteration of laser propagation due to intensity-dependent refractive index changes. In plasma, such changes include contributions from both the plasma background and the Kerr nonlinearity, expressed as
$\Delta {n}_\mathrm{plasma}$
 and
${n}_2I$
 , respectively, where
${n}_2$
 is the Kerr nonlinearity coefficient and
$I$
 is the laser intensity. The dispersion relation of the laser in the plasma is given by
$k\left(\omega \right)=\left(\omega /c\right)\sqrt{1-{\omega}_\mathrm{p}^2/{\omega}^2}$
 , and the group velocity dispersion coefficient in the plasma can be derived from the second derivative at the center frequency:

where
${\omega}_\mathrm{p}=\sqrt{\frac{n_\mathrm{e}{e}^2}{\epsilon_0{m}_\mathrm{e}}}$
 is the plasma frequency,
${\omega}_0$
 is the central angular frequency of the laser,
$c$
 is the speed of light,
${n}_\mathrm{e}$
 is the electron density,
$e$
 is the electron charge,
${m}_\mathrm{e}$
 is the electron mass and
${\epsilon}_0$
 represents the vacuum permittivity. In the plasma layer, the total refractive index becomes positive and increases when the refractive index change due to the plasma itself (
$\Delta {n}_\mathrm{plasma}$
 ) is weaker than the refractive index change (
${n}_2I$
 ) caused by the Kerr lens. The refractive index change caused by the plasma itself is
$\Delta {n}_\mathrm{plasma}\approx -\frac{n_\mathrm{e}{e}^2}{2{\epsilon}_0{m}_\mathrm{e}{\omega}^2}$
 , while the Kerr coefficient in the plasma is expressed as
${n}_2\approx \frac{n_\mathrm{e}{e}^4}{2{\epsilon}_0^2{m}_\mathrm{e}^3{\omega}^4{c}^3}$
 [
Reference Tajima and Dawson39,
Reference Kruer40]. In the quasi-vacuum region, only the diffraction term is active, causing the laser pulse to diverge.
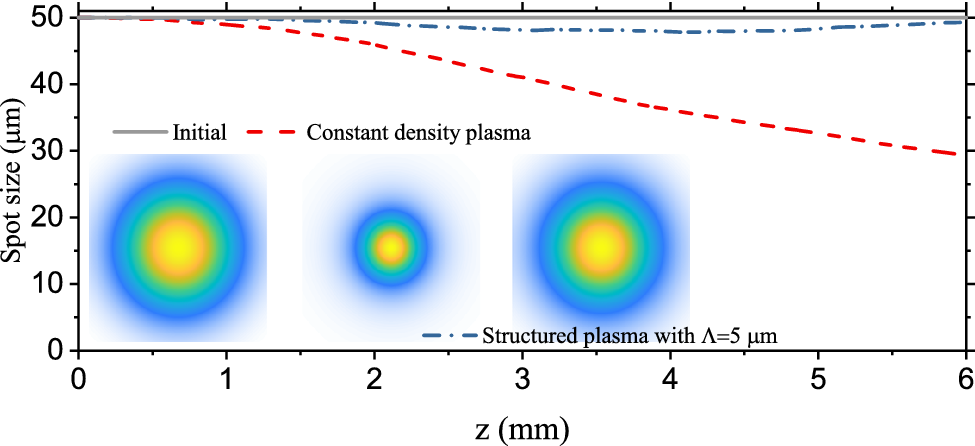
Spot size evolution of laser propagation in plasma with different structures. The insets show the transverse intensity distribution of the laser at the initial time, after passing through a constant-density plasma, and after passing through a structured plasma, respectively.

Figure 2 Long description
A line graph plots Spot size in micrometers on the y-axis from 0 to 50 against distance z in millimeters on the x-axis from 0 to 6.
Three data series are shown:
- Initial: A solid grey horizontal line remains constant at 50 micrometers.
- Structured plasma with Lambda = 5 micrometers: A blue dash-dot line starts at 50, dips slightly to approximately 48, and remains relatively stable across the distance.
- Constant density plasma: A red dashed line starts at 50 and shows a significant linear decrease, reaching approximately 30 micrometers at z = 6 millimeters.
Three square insets below the lines show transverse intensity distributions as concentric colored circles (yellow core, green middle, blue outer):
- The left inset (Initial) shows a large, broad distribution.
- The middle inset (Constant density) shows a significantly smaller, more concentrated spot.
- The right inset (Structured plasma) shows a spot size nearly identical to the initial state, maintaining its breadth.
Consider an intense laser pulse with a wavelength of
$\lambda =800$
 nm, a duration of
$\tau =30$
 fs and a peak intensity of
${I}_\mathrm{peak}=1\times {10}^{18}$
 W/cm
${}^2$
 propagating through either a constant-density plasma or a structured plasma consisting of periodically alternating 2.5-μm-thick plasma and vacuum layers. The electron density is
${n}_\mathrm{e}=0.01{n}_\mathrm{c}$
 , that is,
$1.74\times {10}^{19}$
 cm
${}^{-3}$
 , and the plasma length in Figure 2 is 6 mm. Substituting these parameters into Equation (2) yields a group velocity dispersion coefficient of
${\beta}_2=-14.308$
 fs
${}^2$
 /mm and a second-order dispersion of
$-85.848$
 fs
${}^2$
 , which barely affects the pulse duration of the incident laser. Therefore, the
$-\frac{i{\beta}_2}{2}\frac{\partial^2E}{\partial {t}^2}$
 term is ignored when solving Equation (1). Figure 2 illustrates the evolution of the laser spot size (measured at the full width at half maximum) during propagation in the two plasma configurations starting from an initial spot size of 50 μm. In the case of constant-density plasma (red dashed curve in Figure 2), the spot size decreases from 50 μm to about 29.3 μm, because the self-focusing induced by the plasma’s Kerr nonlinearity is stronger than the divergence brought by the diffraction effect and the plasma itself. In contrast, for the structured plasma with a 5 μm period (blue dash-dot line), diffraction in the vacuum layers compensates for the self-focusing, limiting the spot size reduction to only 49.3 μm, demonstrating effective suppression of self-focusing. The insets in Figure 2 show the spatial intensity distribution of the laser pulse initially and after propagation through constant-density and structured plasmas, respectively. These results confirm that introducing a structured plasma into BRA can mitigate laser self-focusing and filamentation, thereby preventing mode mismatch and avoiding focusability degradation. This is the key for efficient amplification in high-density plasma. However, the evolution of the pulse in structured plasmas is complicated by variations in seed pulse intensity and temporal shape and nonlinear coupling during the BRA. Therefore, in the following sections, we employ PIC simulations to further investigate the influence of structured plasmas on the BRA process.
4 Particle-in-cell simulation results
To verify BRA in structured plasmas and its effect on laser self-focusing and filamentation, two-dimensional (2D) simulations are performed using the fully relativistic PIC simulation code EPOCH[
Reference Arber, Bennett, Brady, Lawrence-Douglas, Ramsay, Sircombe, Gillies, Evans, Schmitz, Bell and Ridgers41]. The simulation box size is 3870 μm
$(x)\times$
 450 μm, with 10 cells per laser wavelength longitudinally, 11 cells per plasma wavelength transversely and 20 particles per cell. A 60 μm vacuum region is allocated at both ends of the
$x$
 -axis. The incident pump pulse has a top-hat temporal shape with
${\lambda}_0=800$
 nm (
${\omega}_0=2\pi \times 375$
 THz) and an intensity of
$7.5\times {10}^{14}$
 W/cm
${}^2$
 , consistent with previous experimental and simulation studies. This intensity avoids wavebreaking and forward Raman scattering, and weakens pre-depletion induced by spontaneous backward Raman scattering, while achieving higher amplified pulse intensities[
Reference Trines, Fiúza, Bingham, Fonseca, Silva, Cairns and Norreys25]. A Gaussian seed pulse with a peak intensity of
$1\times {10}^{16}$
 W/cm
${}^2$
 and an initial pulse duration of 50 fs enters the plasma from the left-hand side of the simulation box. To enhance mode matching and energy transfer efficiency, both the large-aperture seed and pump beams have a spot size of 150 μm at full width at half maximum. For plasma densities of
${n}_{\mathrm{e}1}=0.00258{n}_\mathrm{c}$
 and
${n}_{\mathrm{e}2}=0.01{n}_\mathrm{c}$
 , two wavelengths of seed pulses were selected to satisfy the resonance matching conditions,
${\lambda}_{\mathrm{l}1}=842.8$
 nm and
${\lambda}_{\mathrm{l}2}=888.9$
 nm, corresponding to the optical frequencies
${\omega}_{\mathrm{l}1}=2\pi \times 355.95$
 THz and
${\omega}_{\mathrm{l}2}=2\pi \times 337.5$
 THz, respectively. Here,
${n}_\mathrm{c}=1.74\times {10}^{21}$
 cm
${}^{-3}$
 is the critical density for
$\lambda =800$
 nm. If a finite angle exists between the pump and seed pulses, the wavevector phase-matching condition changes from
${k}_\mathrm{pe}^2={k}_\mathrm{S}^2+{k}_\mathrm{P}^2-2{k}_\mathrm{S}{k}_\mathrm{P}$
 to
${k}_\mathrm{pe}^2={k}_\mathrm{S}^2+{k}_\mathrm{P}^2+2{k}_\mathrm{S}{k}_\mathrm{P}\cos \left({\theta}_\mathrm{p}\right)$
 and the corrected frequency-matching condition becomes
${\omega}_\mathrm{S}-{\omega}_\mathrm{P}=\sqrt{\omega_\mathrm{pe}^2+12{k}^2{v}_\mathrm{th}^2{\cos}^2\left({\theta}_\mathrm{p}/2\right)}$
 , where
${v}_\mathrm{th}$
 is the electron thermal velocity. The initial electron and ion temperatures are set to
${T}_\mathrm{e}=100$
 eV and
${T}_\mathrm{i}=10$
 eV. For the plasma density and temperature considered here, the electron–ion collision frequency is much lower than the plasma frequency, so the collision effect is ignored. However, for higher densities, it may become necessary.
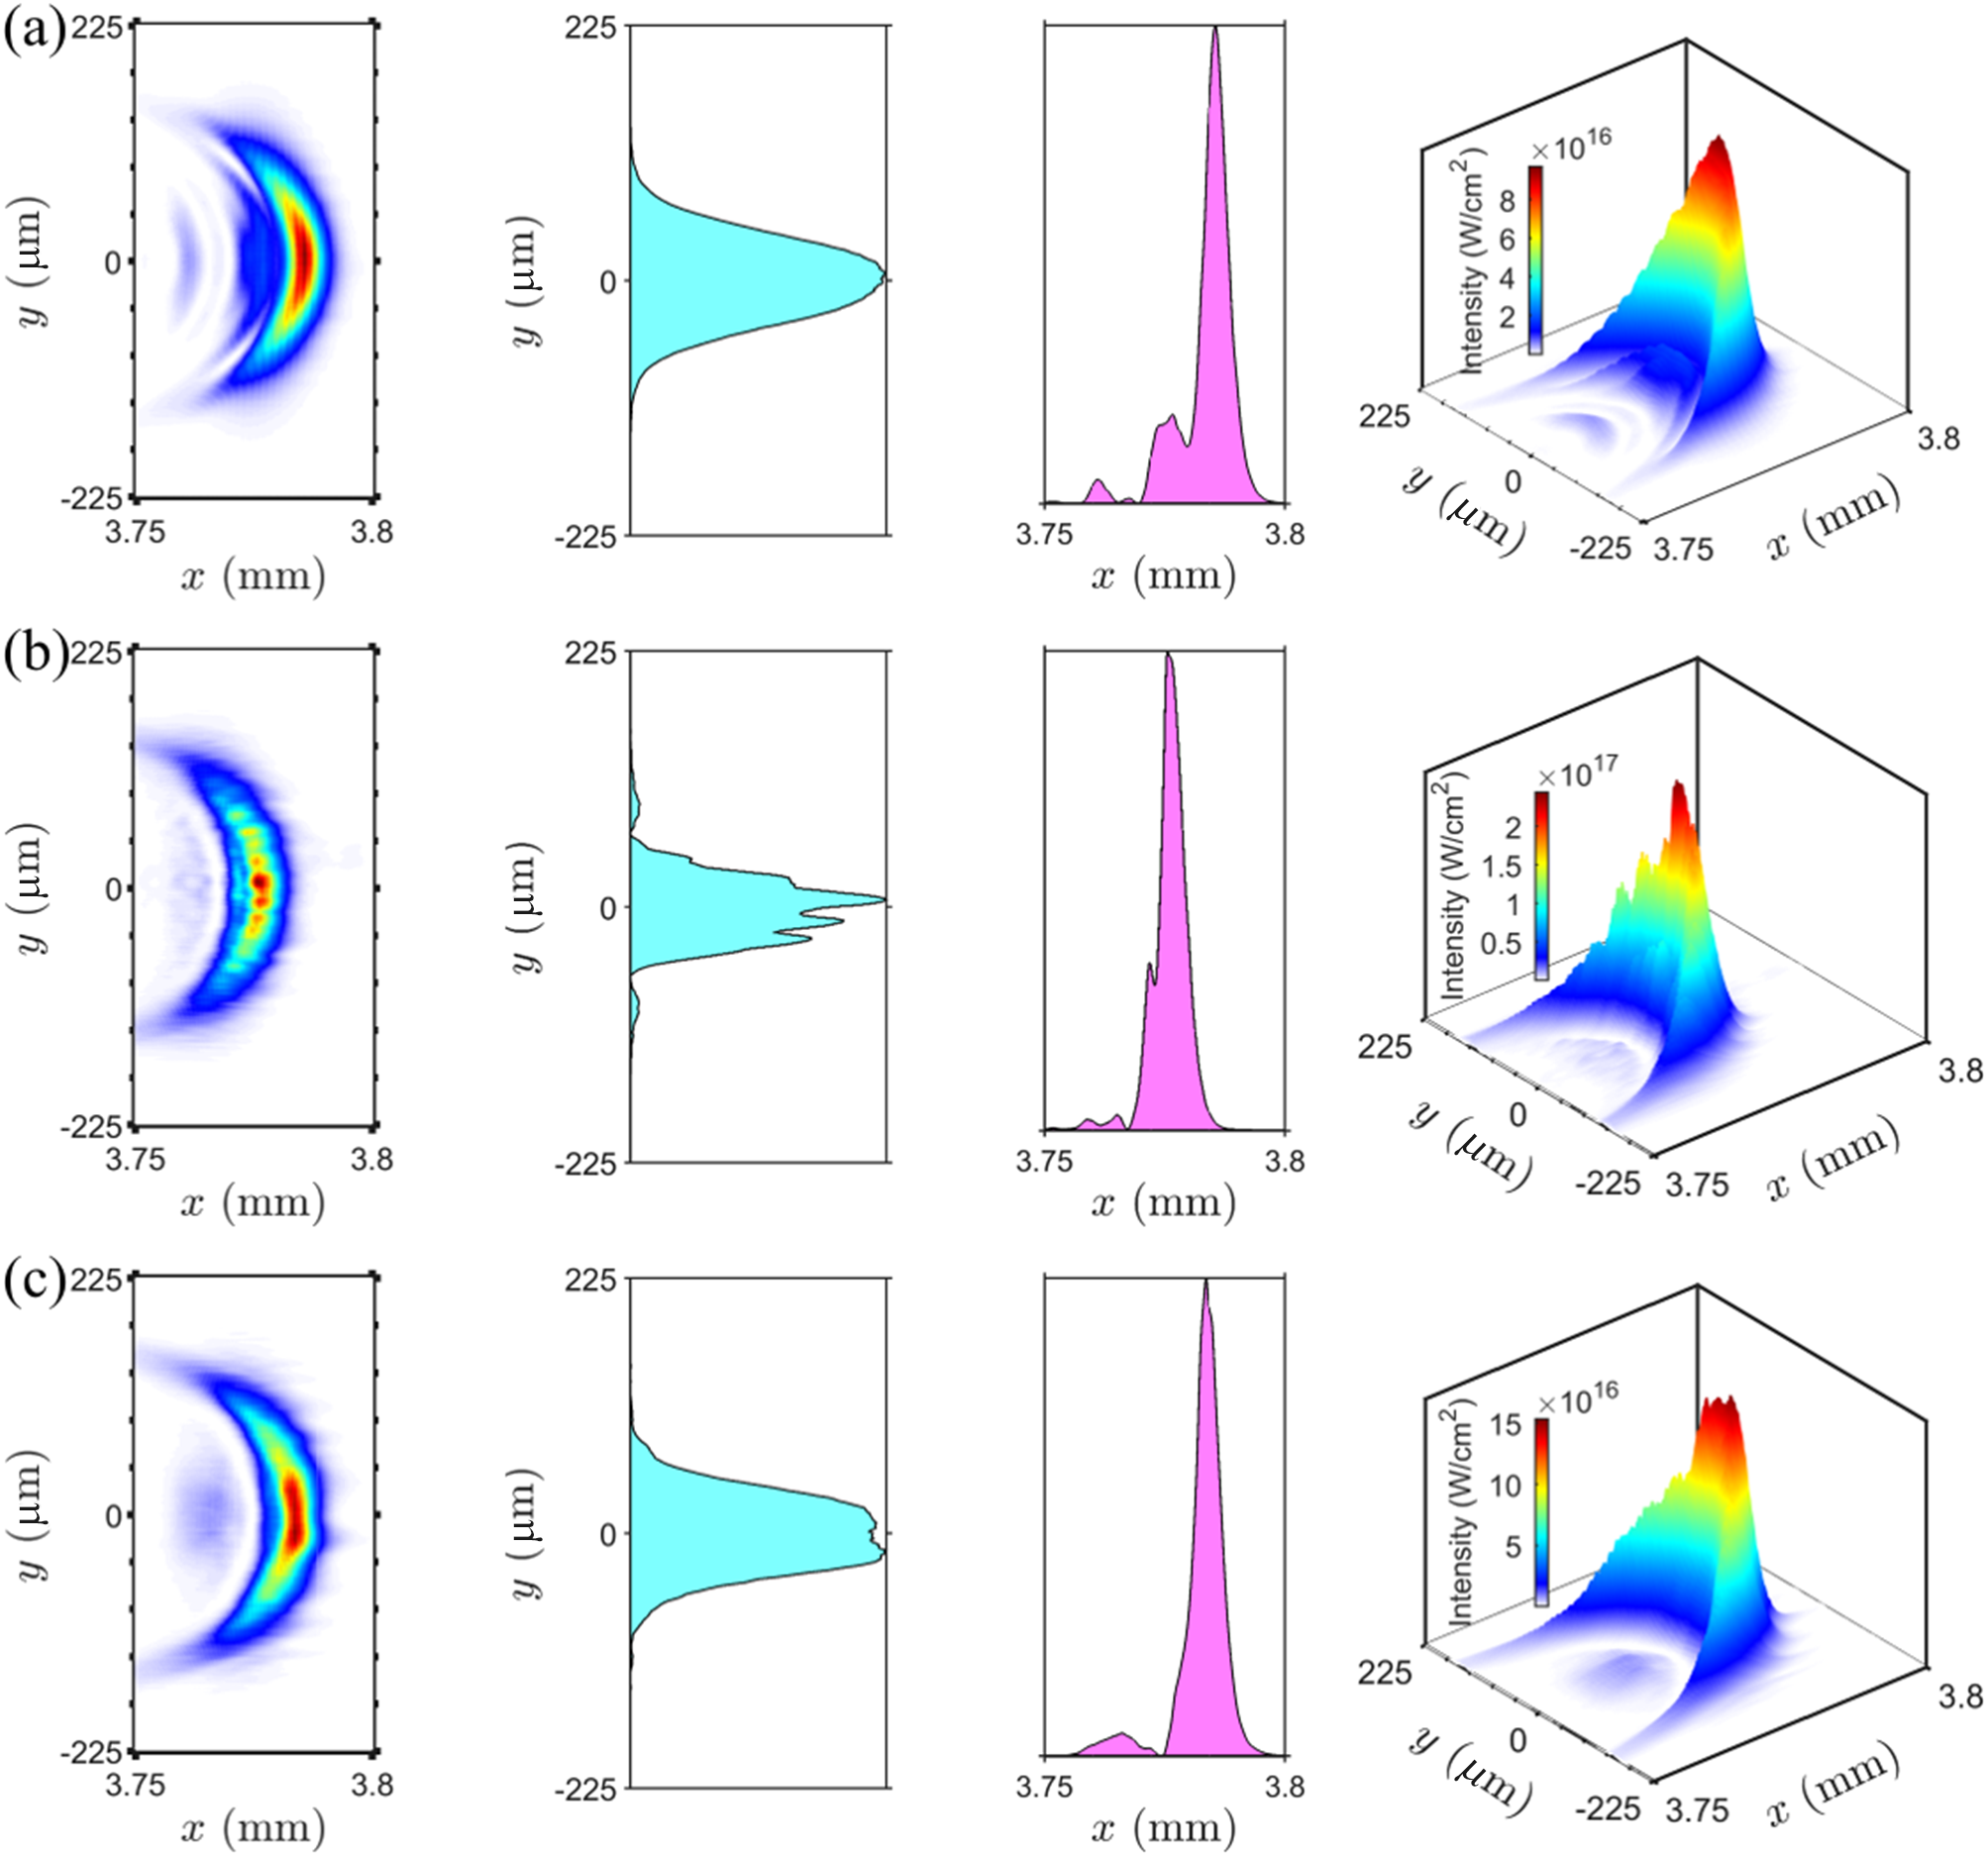
Comparison of backward Raman amplification for three different parameter configurations, to demonstrate the suppression of the amplified seed filamentation by the structured plasma. Raman amplification of a seed pulse with
$\lambda =842.8$
 nm (a) in a low-density plasma,
$\lambda =888.9$
 nm (b) in a high-density plasma and
$\lambda =888.9$
 nm (c) in a structured plasma. The transverse light intensity distribution, the intensity profile at the location of the peak intensity, the pulse duration on the
$x$
 -axis and the overall pulse morphology of the final laser pulse are shown.

Figure 3 Long description
The figure consists of three rows of plots labeled a, b, and c.
Row a (Low-density plasma, 842.8 nm):
* The first panel is a 2D heat map of intensity on the x-axis (3.75 to 3.8 mm) and y-axis (-225 to 225 micrometers), showing a smooth, crescent-shaped pulse with a central red peak.
* The second panel shows a cyan-filled transverse intensity profile along the y-axis, displaying a smooth Gaussian-like curve centered at zero.
* The third panel shows a magenta-filled longitudinal intensity profile along the x-axis, featuring a sharp peak near 3.79 mm with minor trailing oscillations.
* The fourth panel is a 3D surface plot with a color scale reaching 8 times 10 super 16 Watts per square centimeter, showing a single coherent peak.
Row b (High-density plasma, 888.9 nm):
* The 2D map shows a fragmented crescent with multiple hot spots, indicating filamentation.
* The transverse profile (cyan) is jagged and irregular compared to row a.
* The longitudinal profile (magenta) shows a narrower, more intense peak.
* The 3D plot uses a scale up to 2.5 times 10 super 17 Watts per square centimeter, revealing a highly spiked and unstable pulse structure.
Row c (Structured plasma, 888.9 nm):
* The 2D map shows a restored, smooth crescent shape similar to row a but with higher intensity.
* The transverse profile (cyan) is broad and smooth with a flat-top characteristic.
* The longitudinal profile (magenta) shows a very clean, high-amplitude peak.
* The 3D plot uses a scale up to 15 times 10 super 16 Watts per square centimeter, demonstrating a suppressed filamentation and a stable, high-intensity pulse morphology.
To investigate the effect of the structured plasma on BRA, we conduct three sets of PIC simulations with different plasma structures, as previously outlined. Figures 3(a) and 3(b) demonstrate the Raman amplification results for laser pulses with wavelengths of
$\lambda =842.8$
 nm and
$\lambda =888.9$
 nm in low-density plasma (
${n}_\mathrm{e}=0.00258{n}_\mathrm{c}$
 ) and high-density plasma (
${n}_\mathrm{e}=0.01{n}_\mathrm{c}$
 ), respectively. In contrast, Figure 3(c) illustrates the amplification under the same conditions as Figure 3(b), but within a structured plasma. In Figure 3, the transverse light intensity distribution, the intensity profile at the peak intensity location, the pulse duration along the
$x$
 -axis and the overall pulse morphology of the final laser pulse are shown in each column. In low-density plasma, the pump pulse continuously transfers energy to the seed pulse; however, the energy conversion efficiency remains limited due to the relatively low growth rate of backward Raman scattering, given by
$\gamma =\left({\omega}_0{a}_0/2\right)\sqrt{\omega_\mathrm{p}/{\omega}_0}$
 , which scales with the resonance frequency
${\omega}_\mathrm{p}$
 . As a result, the amplified seed intensity reaches only about
$1\times {10}^{17}$
 W/cm
${}^2$
 . A notable advantage is that the lower intensity of the amplified pulse accumulates less nonlinearity as it propagates through the low-density plasma. Consequently, the pulse transverse distribution remains Gaussian, and there is no self-focusing or filamentation within the pulse in Figure 3(a). With increased plasma density, the growth rate
$\gamma$
 rises, leading to higher amplified pulse intensity and improved energy conversion efficiency. However, stronger nonlinearities associated with both laser intensity and plasma density induce undesirable phenomena. As shown in Figure 3(b), these include filamentation, manifested as multiple localized high-intensity spots in the transverse profile. This filamentation, combined with mode mismatch between the seed and pump pulses during amplification, degrades the output beam quality and compromises focusability, thereby affecting the practicability of BRA technology. Since our earlier results from the nonlinear envelope equation indicate that the plasma periodic structure could suppress laser self-focusing, we introduce such a structure in the high-density simulation of Figure 3(c) once the seed intensity exceeds the self-focusing threshold (
$x>1.6$
 mm). Each period consists of a 2.5 μm plasma region and a 2.5 μm quasi-vacuum region. It can be observed from the pulse intensity distribution in Figure 3(c) that the hotspots disappear and the envelope becomes smooth, confirming that structured plasmas effectively inhibit filamentation of the amplified seed pulse in BRA. Furthermore, across all simulations, the final pulse duration remains nearly constant at approximately 24 fs, corresponding to the
$\pi$
 -pulse solutions form[
Reference Malkin, Shvets and Fisch42]. Across the cases presented in Figure 3, the 2D intensity distributions of the amplified seed pulse exhibit a consistent wavefront bending. This distortion arises from the spatially nonuniform gain experienced by different longitudinal positions within the pulse during the nonlinear stage of BRA. In the nonlinear amplification regime, the pulse peak moves with a superluminous speed[
Reference Malkin, Shvets and Fisch19], gradually shifting from the center toward the leading edge relative to the pulse envelope. For a Gaussian-profile pulse, the on-axis intensity (
$y=0$
 ) is maximal, yielding the most pronounced BRA effect and thus the largest relative shift; toward the wings, the intensity decreases, resulting in weaker amplification and a concomitantly smaller shift. The resultant transverse gradient in the relative shift produces the observed bending of the 2D intensity distribution. Furthermore, the seed pulse in a high-density plasma exhibits a higher intensity growth rate than in a low-density plasma, engendering a more pronounced forward shift of the pulse peak. Therefore, the curvature of the intensity distributions in Figures 3(b) and 3(c) exceeds that in Figure 3(a). We emphasize that this bending reflects a deformation of the intensity profile rather than the equiphase surfaces, leaving the phase front unaffected.
The spectral intensity profile of the amplified pulse is obtained via the Fourier transform method
$I\left({k}_y\right)={\left| \mathrm{FFT}\left[E(y)\right]\left({k}_y\right)\right|}^2$
 , where FFT denotes the fast Fourier transform[
Reference Lauterborn and Kurz43]. The pulse intensity distribution on the focal plane can be derived without considering the spatial phase, that is, the focused spot profile. The relationship between spectral and spatial coordinates in the focal plane is given by
$y=\lambda {fk}_y$
 , with
$\lambda$
 being the laser wavelength and
$f$
 the focal length. Using this method, we calculate the focal-plane intensity envelopes for the three cases presented in Figure 3, assuming a lens focal length of
$f=500$
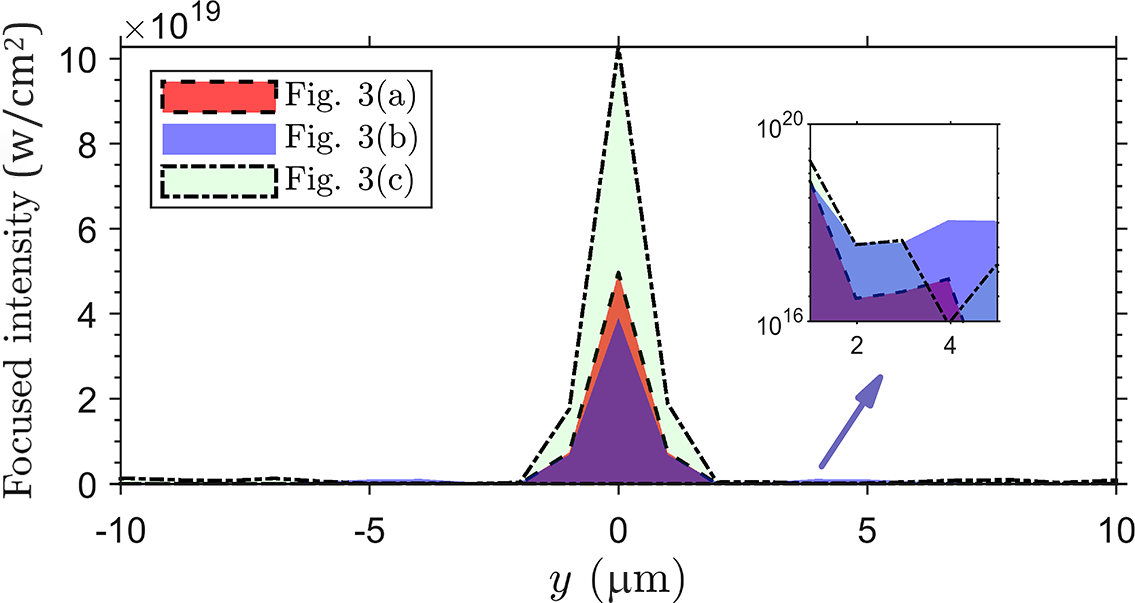
 mm, and the results are shown in Figure 4. In the low-density plasma case, the focused output pulse (red curve) exhibits a well-concentrated intensity profile with no significant extension to the sides. By contrast, although the pulse amplified in the high-density plasma (blue curve) attains more than twice the peak intensity of the low-density case, filamentation degrades its focal quality, leading to a broader and less intense focal spot. The inset in Figure 4 displays the sidelobe intensity in logarithmic scale, revealing a minor peak around 4 μm in the blue curve – a clear signature of degraded focusability. The structured plasma scheme effectively balances high peak intensity with preserved focusability. As shown by the green curve in Figure 4, the focal intensity distribution is markedly improved over the high-density case, confirming that transverse nonlinear effects are suppressed.
The focused (
$f=500$
 mm) intensity envelopes after amplification with three sets in Figure 3; the inset shows the intensity of the sidelobes in logarithmic coordinates.

Figure 4 Long description
A line graph with a horizontal x-axis labeled y in micrometers ranging from -10 to 10 and a vertical y-axis labeled Focused intensity with a multiplier of 10 super 19 ranging from 0 to 10.
Three data series are plotted as filled area envelopes:
- Fig. 3 a is represented by a red area with a dashed border, reaching a peak intensity of approximately 5 at y equals 0.
- Fig. 3 b is represented by a blue area with a solid border, reaching a peak intensity of approximately 4 at y equals 0.
- Fig. 3 c is represented by a light green area with a dash-dot border, reaching the highest peak intensity of approximately 10 at y equals 0.
All three series show a sharp, narrow peak centered at 0 micrometers and remain near the zero baseline for all other values of y.
An inset graph in the upper right, indicated by a purple arrow pointing from the baseline at y equals 5, shows the sidelobe intensity on a logarithmic scale. The inset y-axis ranges from 10 super 16 to 10 super 20, and the x-axis ranges from 1 to 5. It displays the fluctuating low-level intensity patterns of the three series in logarithmic detail.
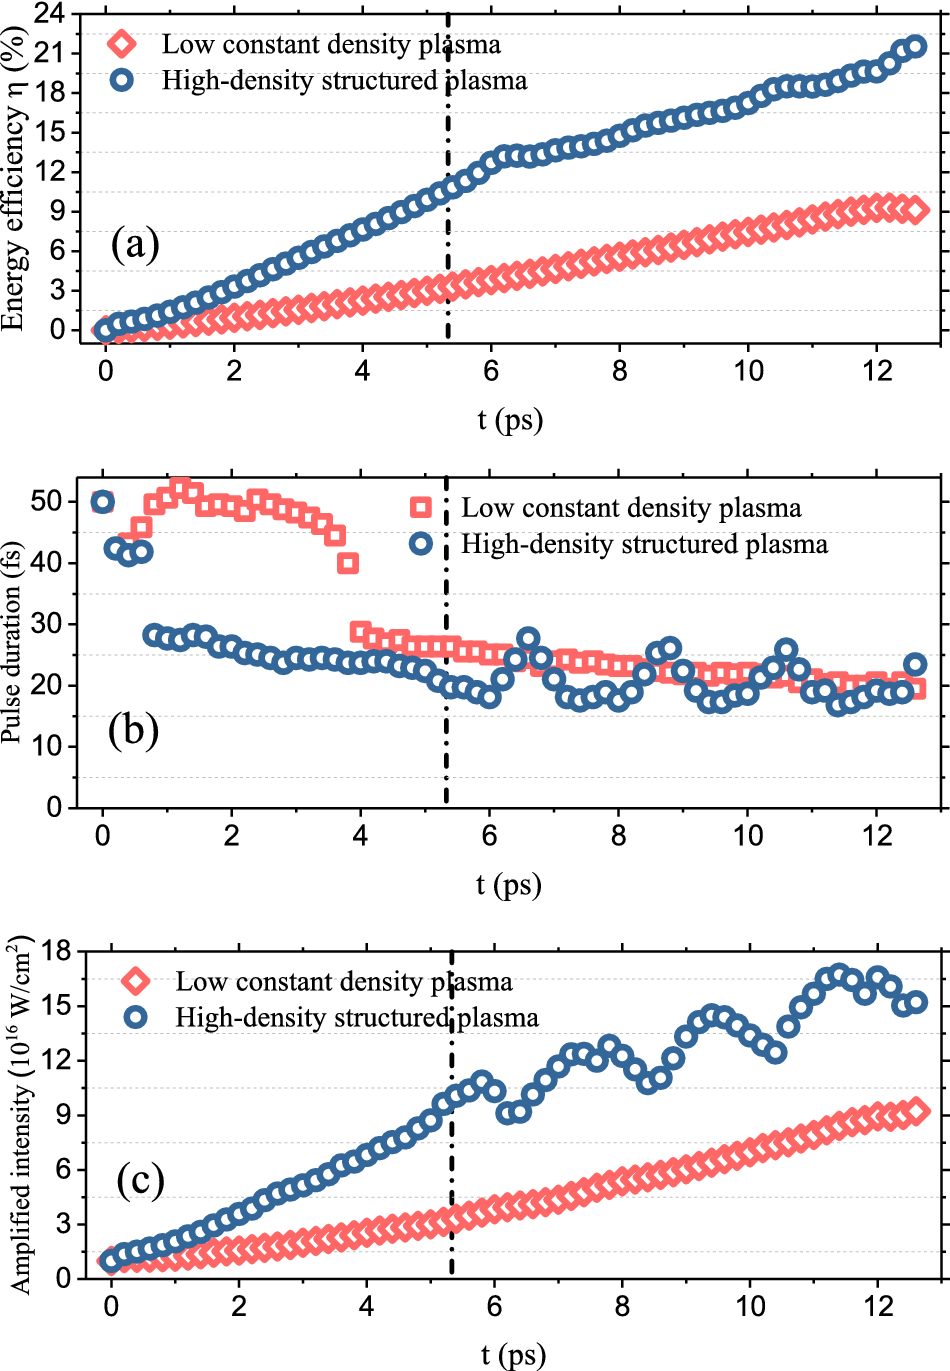
As previously noted, amplification in high-density plasmas creates problems such as filamentation and degradation of laser focusability, which reduce the feasibility and practicality of BRA. For this reason, only results obtained in low-density and structured plasmas are shown in the following analysis. Figures 5(a)–5(c) illustrate the evolution of energy conversion efficiency, pulse duration and amplified pulse intensity, respectively, in different plasma configurations. The slope of the energy conversion efficiency curve in Figure 5(a) reflects the intensity growth rate, which exhibits a clear positive correlation with plasma density. However, after the time indicated by the dash-dot line, the introduction of quasi-vacuum layers in the periodic plasma structure reduces the effective interaction length, resulting in a decrease in the slope. In the nonlinear regime of BRA, its broadband response enables the broad-spectrum seed pulse to be amplified even within the periodic region. In Figure 5(b), the enhanced nonlinear amplification in the high-density plasma accelerates
$\pi$
 -pulse formation, thereby inducing an abrupt shortening of the pulse duration. Nevertheless, the final pulse duration only depends on the pump pulse intensity and the interaction length, yielding comparable output durations in both configurations. The higher growth rate in the high-density plasma produces a sharper rising peak intensity, as shown in Figure 5(c). A distinctive feature in the structured plasma case is the periodic oscillation in both pulse duration and peak intensity, due to the pulse being at different positions within the periodic structure during measurement. In high-density structured plasma, the total output pulse energy reaches 1.2 J, corresponding to an energy conversion efficiency of 21%, which is much higher than the 9% efficiency in low-density plasma. This marked improvement demonstrates the benefit of the periodic structure for enhancing energy transfer. The output pulse features a peak intensity
${I}_\mathrm{p}$
 of
$1.54\times {10}^{17}$
 W/cm
${}^2$
 , a duration
$\tau$
 of 24 fs and minimal variation in spot size w. Based on the relation
$E=\left({I}_\mathrm{P}\pi {w}^2\tau \right)/1.88$
 , the energy contained in the main pulse is estimated to be about 1 J, accounting for 83.3% of the total energy.
Evolution of laser pulse parameters in low constant-density plasma and structured plasma with high density. (a) Energy conversion efficiency. (b) Laser pulse duration. (c) Laser pulse intensity.

Figure 5 Long description
The figure consists of three vertically stacked line graphs sharing a common x-axis of time t in p s from 0 to 13. A vertical dashed line at t equals 5.3 p s marks a transition point in all panels.
Panel a: Energy efficiency eta in percent on the y-axis from 0 to 24. Low constant density plasma (red diamonds) shows a linear increase reaching approximately 9 percent. High-density structured plasma (blue circles) shows a steeper, slightly non-linear increase reaching approximately 22 percent.
Panel b: Pulse duration in f s on the y-axis from 0 to 50. Low constant density plasma starts at 45 f s, peaks at 50 f s, then drops sharply at t equals 4 p s to 30 f s, gradually decreasing to 20 f s. High-density structured plasma starts at 50 f s, drops immediately to 30 f s, and then oscillates between 15 and 28 f s after the 5.3 p s mark.
Panel c: Amplified intensity in 10 super 16 W forward slash c m squared on the y-axis from 0 to 18. Low constant density plasma shows a steady linear rise to 9. High-density structured plasma shows a much steeper rise with significant oscillations after 6 p s, peaking at approximately 17.
5 Conclusion
In conclusion, we have shown that structured plasmas effectively suppress self-focusing and filamentation of intense laser pulses in BRA. The pulse evolution in plasmas with different structures is realized via nonlinear envelope equations. The propagation model of laser pulses in structured plasmas is constructed, and the influence of periodic structure on pulse self-focusing is demonstrated. The PIC simulations suggest that laser filamentation induced by high density is prevented in BRA employing structured plasmas, while preserving excellent pulse focusability. Through this approach, we achieved a total amplified pulse energy of 1.2 J and an energy conversion efficiency of 21%, which is much higher than the 9% efficiency in the low-density plasma case. It is proven that the use of structured plasma avoids the transverse effect in BRA and improves focusability. Different from the previous methods that improve BRA conversion efficiency through parameter optimization, this scheme successfully extends amplification into the high-gain regime, thereby achieving a significant boost in energy conversion efficiency relative to the low-density case. This development opens a route for plasma-based Raman amplifiers to operate in the high-gain regions using high densities and extended interaction lengths, which are instrumental in achieving further enhancements in laser intensity.
Acknowledgements
This work was supported by the National Natural Science Foundation of China (Grant Nos. 12304385 and 62335004), the CAS Project for Young Scientists in Basic Research (Grant No. YSBR-065), the National Key R&D Program of China (Grant No. 2023YFA1608501) and the Synergetic Extreme Condition User Facility (SECUF, https://cstr.cn/31123.02.SECUF). All numerical calculations in this paper were done at Beijing Super Cloud Computing.





 Open access

