Introduction
Cholesteatoma formation in the middle ear happens as a consequence of keratin accumulation within a retraction pocket, which can aggressively progress to erode adjacent bones and middle-ear ossicles. This can lead to conductive hearing loss and other intra-temporal complications such as facial nerve palsy and sensorineural hearing loss, and intracranial complications including meningitis and abscess formation.
Cholesteatoma can be congenital or acquired. Acquired cholesteatoma occurs in two variations related to the site of its formation: a more common pars flaccida version and a less common pars tensa version.Reference Rosito, Netto, Teixeira and Da Costa1 Treatment is usually surgical, but there is a low risk of recurrence and when this occurs it is usually within the first two years post-operatively with approximately 60 per cent of recurrences occurring within the first post-operative year.Reference Schwartz, Lane, Bolster and Neff2 Post-operative recurrence is identified by clinical examination, examination under anaesthesia or second-look surgery if clinical examination is difficult or inconclusive.Reference Crowson, Ramprasad, Chapurin, Cunningham and Kaylie3
Several articles published in the literature are now advocating the use of magnetic resonance imaging (MRI) with non-echo planar diffusion-weighted imaging to detect primary cholesteatoma and post-operative recurrence because it has been shown to have a high specificity and sensitivity.Reference Muzaffar, Metcalfe, Colley and Coulson4,Reference De Foer, Vercruysse, Bernaerts, Meersschaert, Kenis and Pouillon7 A current radiological dilemma for the diagnosis of cholesteatoma on non-echo planar diffusion-weighted imaging is the indeterminate high signal at the site of concern, with various suggestions in the literature to help with making a diagnosis, such as using apparent diffusion coefficient map images and T1-weighted images.Reference Russo, Elefante, Di Lullo, Carotenuto, D'Amico and Cavaliere5,Reference Fukuda, Morita, Harada, Fujiwara, Hoshino and Nakamaru6,Reference Lingam, Khatri, Hughes and Singh8
Pixel-based signal intensity threshold technique for diffusion-weighted imaging has been used to assess prognosis in stroke patients by measuring a ratio between the area of restricted diffusion and another region of normal tissue in an attempt to quantify the degree of restricted diffusion.Reference De Foer, Vercruysse, Bernaerts, Meersschaert, Kenis and Pouillon7 Our study attempted to use the same technique with the aim of quantifying the degree of restricted diffusion within middle-ear lesions and assess its statistical significance.
Materials and methods
We performed a retrospective data collection for all patients with a clinical request questioning the presence of a primary or recurrent cholesteatoma who had non-echoplanar diffusion-weighted imaging MRI as part of MRI of the brain or internal auditory meatus between 1 January 2010 and 31 December 2016. CareStreamTM PACS imaging software search function was used to review clinical requests.
Recorded data included demographic information, MRI findings, clinical examination or operative findings, interval between MRI and surgical intervention (if performed), and correlation between MRI and clinical or surgical findings. We excluded any patient who did not have clinical or surgical follow up.
MRI was performed on either Siemens AvantoTM or SymphonyTM 1.5t MRI scanners with a cholesteatoma protocol that included: axial T2-weighted MRI scan of the brain, high-resolution volumetric T2-weighted MRI of the base of the skull, coronal T1-weighted MRI of the temporomastoid bone, coronal T2-weighted MRI of temporomastoid bone and coronal MRI of the temporomastoid bone with b1000 non-echo planar HasteTM diffusion-weighted imaging.
Sensitivity, specificity, positive predictive value, negative predictive value and accuracy were calculated using a contingency table.
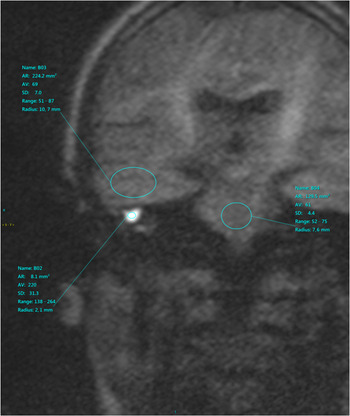
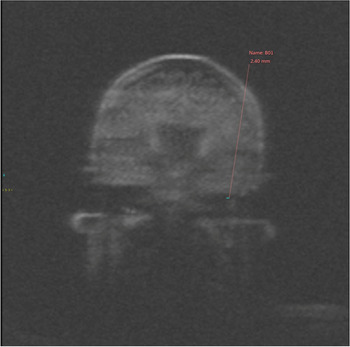
Pixel-based signal intensity threshold was calculated as the average between grey-scale pixel value on non-echo planar diffusion-weighted imaging in the middle-ear lesion, pons and ipsilateral temporal lobe using the CareStream elliptical region-of-interest tool, circling the entire ipsilateral temporal lobe, pons and the high signal middle-ear lesion (Figure 1). We excluded lesions that were smaller than 3 mm because these cannot be adequately assessed using the region-of-interest tool (Figure 2).
Non-echo planar diffusion-weighted coronal image at the level of the middle-ear cleft showing the temporal lobes, pons and the middle-ear lesion. The middle-ear lesion, ipsilateral temporal lobe and pons were encircled using the region-of-interest tool in CareStream PACS software to obtain the average grey-scale value (AV) with standard deviation (SD) at these areas (AR). Region-of-interest radius measured across the temporal lobe and the pons were consistent in all cases whereas the middle-ear lesion region-of-interest radius depends on the size of the lesion itself.

Example of a middle-ear cleft lesion on coronal non-echo planar diffusion-weighted imaging which was smaller than 3 mm and therefore excluded from the study.

Statistical analysis was performed on the average grey-scale pixel value ratio between the lesion and ipsilateral temporal lobe and between the lesion and pons with the Mann–Whitney U test using SPSS® statistical software (version 19). Receiver operating characteristic curve analysis was performed with the aim to identify a cut-off point in the ratio measured to confidently diagnose cholesteatoma. Patients with no lesion to measure were excluded from the statistical analysis.
Results
We identified 107 patients who had a non-echo planar diffusion-weighted MRI in the study period with a clinical question regarding the presence of primary or recurrent cholesteatoma on the clinical request card.
We excluded 8 patients: 7 had a middle-ear lesion of less than 3 mm on non-echo planar diffusion-weighted imaging MRI and 1 patient did not have clinical or surgical follow up after the MRI results.
Average age was 44 years (± standard deviation (SD), 22 years). There were 40 patients (40 per cent) who were imaged after having a previous cholesteatoma surgical treatment, with 27 of these patients (27 per cent) having had the surgical intervention more than 2 years prior to performing the MRI study and with the remaining patients having had the surgical intervention between 6 months and 1 year, 6 months prior to the study.
Using the contingency table (Figure 3), sensitivity was measured at 86 per cent, specificity was measured at 98 per cent, positive predictive value was 97 per cent, negative predictive value was 93 per cent and accuracy was measured at 94 per cent.
Contingency table showing the true condition as the surgical or clinical diagnosis of cholesteatoma while the radiological diagnosis of cholesteatoma was considered as the predicted condition; the true positives and negatives and false positives and negatives are shown accordingly. Specificity, sensitivity, accuracy and predictive values were calculated from this contingency table.

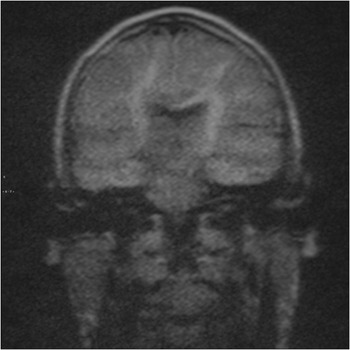
Pixel-based signal intensity threshold analysis was performed on 49 patients with measurable lesions as remaining patients had no measurable lesions on non-echo planar diffusion-weighted imaging (Figure 4). A total of 46 patients had concordant clinical and radiological diagnosis of the presence or absence of cholesteatoma.
Example of normal appearance of the middle-ear cleft on coronal non-echo planar diffusion-weighted imaging in which there was no lesion present to measure.
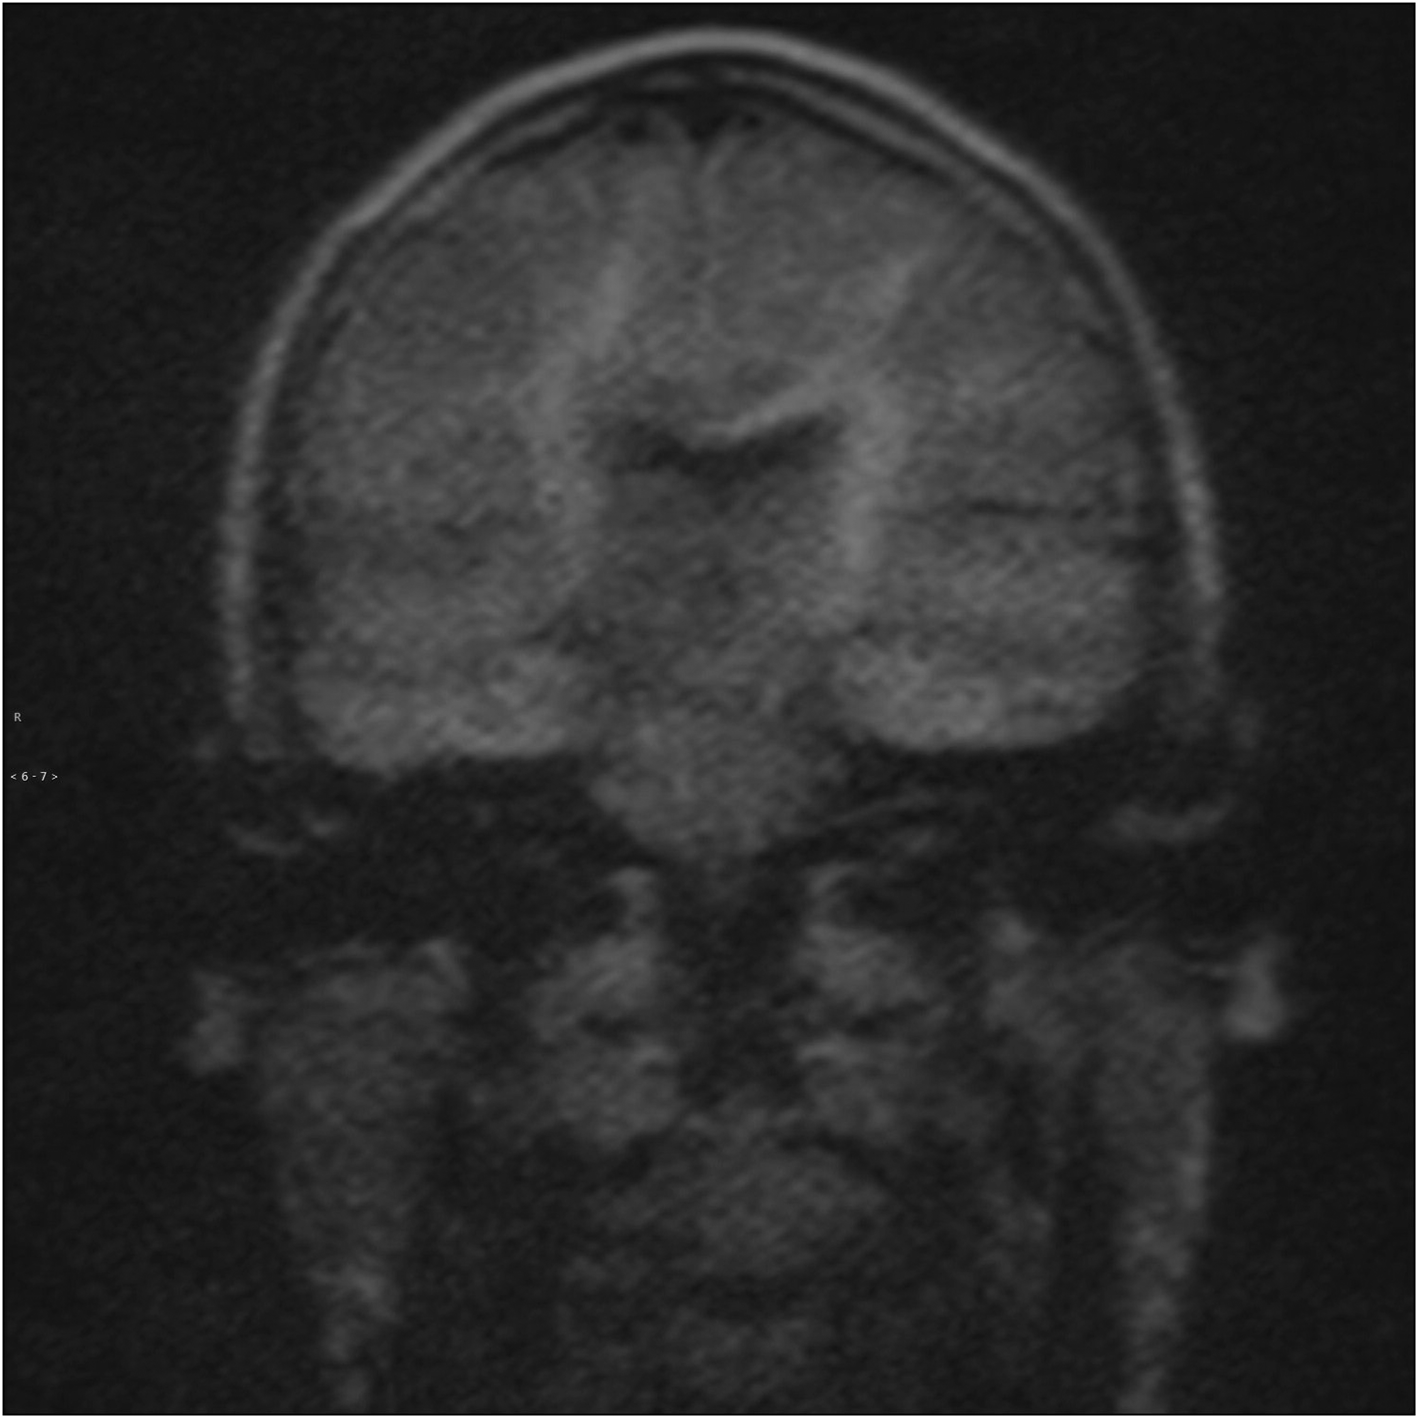
Measurements of the ipsilateral temporal lobe and pons pixel-based intensity were very similar, and we elected to use the ipsilateral temporal lobe values to calculate the ratio for statistical analysis.
The Mann–Whitney U test was performed on the 46 patients with concordant surgical and radiological results (31 patients with a positive diagnosis of cholesteatoma and 15 patients with no cholesteatoma diagnosed), and a statistically significant difference was found in the means of the pixel-based signal intensity ratio of the lesion and the ipsilateral temporal lobe between the positive and negative diagnosis of cholesteatoma with p < 0.05 (95 per cent confidence interval (CI), −2.1278 to −1.0322 with equal variances assumed; Figure 5).
Bar chart of independent samples Mann–Whitney U test showing the number of cases with concordant radiological and surgical diagnosis for cholesteatoma divided into two groups. Group 0 shows negative diagnosis and group 1 shows positive diagnosis with their respective ratio values of average grey-scale pixel intensity between the middle-ear cleft lesion and the ipsilateral temporal lobe (vertical axis) and the number of occurrences at these values (horizontal axis). Note the high ratio values in the positive group when compared with the negative group, with the difference in the ratio means between the two groups being statistically significant (p < 0.05).

Further analysis for the surgical cholesteatoma diagnosis subgroup of 49 patients (33 patients with positive diagnosis of cholesteatoma and 16 patients with no cholesteatoma diagnosed) also showed a statistically significant difference in the pixel-based intensity ratio with p < 0.05 (95 per cent CI, −1.9938 to −0.8624; Figure 6).
Bar chart of independent samples Mann–Whitney U test showing the number of cases with surgical diagnosis for cholesteatoma divided into two groups. Group 0 shows negative diagnosis and group 1 shows positive diagnosis with their respective ratio values of average grey-scale pixel intensity between the middle-ear cleft lesion and the ipsilateral temporal lobe (vertical axis) and the number of occurrences at these values (horizontal axis). Note the high ratio values in the positive group when compared with the negative group, with the difference in the ratio means between the two groups being statistically significant (p < 0.05).

Further analysis of the radiological cholesteatoma diagnosis subgroup of 49 patients (32 patients with positive diagnosis of cholesteatoma and 17 patients with no cholesteatoma diagnosed) also showed a statistically significant difference in the pixel-based intensity ratio with p < 0.05 (95 per cent CI, −2.1002 to −1.0726; Figure 7).
Bar chart of independent samples Mann–Whitney U test showing the number of the cases with radiological diagnosis for cholesteatoma divided into two groups. Group 0 shows negative diagnosis and group 1 shows positive diagnosis with their respective ratio values of average grey-scale pixel intensity between the middle-ear cleft lesion and the ipsilateral temporal lobe (vertical axis) and the number of occurrences at these values (horizontal axis). Note the high ratio values in the positive group when compared with the negative group, with the difference in the ratio means between the two groups being statistically significant (p < 0.05).

Receiver operating characteristic curve analysis was performed to assess a cut-off point in the ratio values for a surgical and radiological concordant diagnosis of cholesteatoma, and the ratio value found was 1.45 at 84 per cent sensitivity and 98 per cent specificity with the area under the curve corresponding to 0.915 (95 per cent CI, 0.832 to 0.998). However, there was at least one tie between the positive and negative groups which biased the statistical analysis (Figure 8).
Receiver operating characteristic curve chart with area under the curve corresponding to 0.915 (95 per cent confidence interval was 0.832 to 0.998) showing the cut-off level at 84 per cent sensitivity (red line) for the positive diagnosis of cholesteatoma which corresponds to an average grey-scale ratio value of 1.45 between the middle-ear cleft lesion and the ipsilateral temporal lobe. Note that the blocky curve is because of the small sample size which would bias the results.

Discussion
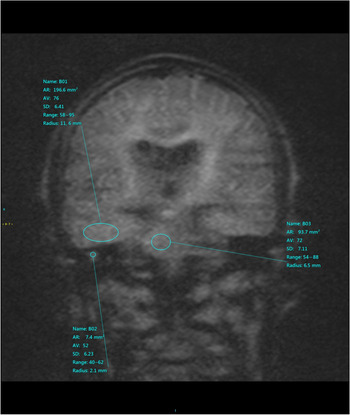
Our study echoes other studies and meta-analyses published in the literature with comparable sensitivity and specificity.Reference Muzaffar, Metcalfe, Colley and Coulson4,Reference Fukuda, Morita, Harada, Fujiwara, Hoshino and Nakamaru6,Reference De Foer, Vercruysse, Bernaerts, Meersschaert, Kenis and Pouillon7,Reference She and Zhang10,Reference Cavaliere, Di Lullo, Cantone, Scala, Elefante and Russo11 Although other studies attempted to resolve the issues with indeterminate findings on diffusion-weighted images using other sequences like T1-weighted images and apparent diffusion coefficient map,Reference Russo, Elefante, Di Lullo, Carotenuto, D'Amico and Cavaliere5,Reference Fukuda, Morita, Harada, Fujiwara, Hoshino and Nakamaru6 our study aimed to utilise the same sequence to interpret the findings (Figure 9). This was because acquiring an additional b0 value for a non-echo planar diffusion-weighted imaging sequence (to extrapolate an apparent diffusion coefficient map) would slightly increase the overall acquisition time of the study when there was no sufficient data in the literature at the period of our study data collection to suggest a significant unbiased statistical diagnostic value to obtain these sequences.Reference De Foer, Vercruysse, Bernaerts, Meersschaert, Kenis and Pouillon7,Reference Lingam, Khatri, Hughes and Singh8
Example of equivocal middle-ear cleft lesion signal intensity on coronal non-echo planar diffusion-weighted imaging that we are attempting to address with the aim of providing a way to identify which intensity is likely to represent a positive diagnosis for cholesteatoma. AV = average grey-scale value; SD = standard deviation; AR = areas

Our study is limited by the low number of cases with a measurable lesion and an inherent bias of retrospective data collection for patients who had equivocal clinical and radiological findings which prompted an MRI scan. Despite this, the statistical analysis performed was conclusive with a cut-off point of the pixel-based intensity ratio between the measurable lesion in the middle ear and the ipsilateral temporal lobe at 1.45 to be suggestive of cholesteatoma formation. It is safe to assume that when the lesion identified in the middle-ear cleft on non-echo planar diffusion-weighted imaging is generally of higher signal intensity when compared with the ipsilateral temporal lobe or the pons, there is a high statistical probability to diagnose cholesteatoma. There were cases within the ratio region value between 1 and 1.9 with overlapping certainty of the radiological diagnosis of cholesteatoma which were either augmented by using a concurrent computed tomography (CT) scan or subsequently a decision whether to proceed with surgery based on the degree of clinical suspicion. In the majority of cases, those who went on to have surgery were confirmed to have cholesteatoma. One patient had surgery but did not have a cholesteatoma. Similarly, of those who were assessed clinically to be unlikely to have cholesteatoma, only one went on to have surgery at a later date for clinical reasons and subsequent non-echo planar diffusion-weighted imaging MRI confirmed cholesteatoma.
• Non-echo planar diffusion-weighted imaging has high sensitivity, specificity and accuracy to detect cholesteatoma formation
• Assessing the degree of diffusion restriction can be difficult in equivocal cases
• Higher diffusion restriction ratio of the middle-ear lesion to the temporal lobe is suggestive of cholesteatoma formation
Out of 49 patients with measurable lesions, only 3 cases had discrepancy between the surgical and radiological diagnosis of cholesteatoma. Surgical intervention was performed more than six months after the MRI scan was performed in two of these cases, and only one case was a true false positive where adhesions and inflammatory tissue were found during surgery.
There is a certain learning curve for both the radiology department and the reporting radiologist in both reporting and performing these MRI studies with continued refinement of the scanning protocol. There was also an increase in confidence of the reporting radiologist over time, which was noted at our institute and while performing this retrospective study.Reference Garcia-Iza, Guisasola, Ugarte, Navarro, Goiburu and Altuna12
Despite the current radiological workforce shortages in the UK as well as MRI capacity issues in most radiology departments, it would be more feasible to use MRI as an adjunct to clinical assessment rather than second-look surgery when CT imaging is equivocal. Consideration needs to be made with regard to the cost and impact of second-look surgery on ENT departments to meet their other needs, and finding a balance between these two approaches would be the most appropriate way to assess cholesteatoma patients in the foreseeable future.Reference Crowson, Ramprasad, Chapurin, Cunningham and Kaylie3,Reference Laske, Roth, Barath, Schuknecht, Huber and Roosli13
Conclusion
Non-echo planar diffusion-weighted imaging MRI is a powerful and accurate tool to assess cholesteatoma when clinical findings or CT imaging are inconclusive or when recurrence is suspected.
Pixel-based signal intensity threshold analysis may play a role in equivocal cases as our study demonstrated that if the lesion in the middle-ear cleft has higher signal intensity when compared with the ipsilateral temporal lobe, there is high statistical probability of cholesteatoma diagnosis.
Competing interests
None declared