Introduction
A first and important aspect of experimental design is deciding on the level of detail required to address a relevant scientific question. With limited time to collect data, there is an inherent trade-off between the level of detail per sample and the overall breadth of the study. An experimental design can suffer from too little detail collected per sample, resulting in a lack of resolution needed to adequately address a particular hypothesis. Alternatively, a lack of breadth will lead to a study that is narrow in terms of its taxonomic, environmental, geographic, or temporal interest. Obviously, these choices depend on the hypotheses being addressed, but examining how the detail of the data collected relates to the detection of signals or patterns can better assess these a priori choices in experimental design.
This issue is especially prevalent in the quantification of morphology in which the approximation of body features and overall form can vary from gross estimations to highly detailed and textured three-dimensional models. Choices in methodology to quantify morphology such as the use of landmarks, outlines, GIS, traditional measurements, discrete characters, and three-dimensional models all have their applications and in some cases have been shown to produce similar evolutionary patterns (Villier and Eble Reference Villier and Eble2004; Hetherington et al. Reference Hetherington, Sherratt, Ruta, Wilkinson, Deline and Donoghue2015). These methods can vary in effort and time commitment such that the choice of one technique may limit the broadness of a study. Even within methods, the addition of detail can dramatically change the scope of a study. Expanding an analysis in terms of the number of landmarks, detail of an outline, or an increase in the volume of characters can all significantly increase the time per sample and limit the scale of a study.
Previous investigations have examined other factors that have an influence on the result of studies of morphological diversity such as choice of metric (Ciampaglio et al. Reference Ciampaglio, Kemp and McShea2001), taxonomic or geographic scale (Butler et al. Reference Butler, Brusatte, Andres and Benson2012; Deline et al. Reference Deline, Ausich and Brett2012), taphonomy (Webster and Hughes Reference Webster and Hughes1999), environmental distribution (Hopkins Reference Hopkins2014), analysis of features compared with the whole organism (M. Hopkins personal communication 2016), and community structure (Deline Reference Deline2009). These studies strongly suggest that the choice of metric and organism to include in a study can potentially alter results and, therefore, the robustness and repeatability of the quantification of morphology should also be examined.
One method commonly used to quantify morphology that may be particularly prone to these issues of detail versus breadth is the use of discrete characters, which is often the metric used to examine trends in disparity at higher taxonomic levels (Briggs et al. Reference Briggs, Fortey and Wills1992; Foote Reference Foote1992a; Wagner Reference Wagner1997; Wills Reference Wills1998; Ciampaglio Reference Ciampaglio2004; Deline Reference Deline2015; see also reviews by Foote Reference Foote1997; Erwin Reference Erwin2007; Hughes et al. Reference Hughes, Gerber and Wills2013). As is also the case in phylogenetic studies (as seen through the practice of bootstrap or jackknife resampling of characters, e.g., Felsenstein Reference Felsenstein1985; Lanyon Reference Lanyon1985), the number of characters and the choice of particular characters likely alters the resolution and perceived patterns. In addition, an overemphasis or focus on one body region because of taphonomy, preconceived notions of evolution, or ecological significance may or may not skew results in a particular direction. However, the degree to which choices in the number and types of characters can affect the quantification of morphology is understudied. To explore this we examined how common metrics describing morphology changed with different subsets of a newly constructed character matrix for early Paleozoic crinoids.
Materials and Methods
Echinoderms, specifically crinoids, have multiple attributes that make them ideal in the study of morphological disparity. With few exceptions (e.g., Kammer and Ausich Reference Kammer and Ausich2007; Ausich et al. Reference Ausich, Bartels and Kammer2013), crinoid external morphology is skeletonized such that even minor morphological features can be preserved. Crinoids were diverse taxonomically and ecologically during the early Paleozoic (Holterhoff Reference Holterhoff1997; Ausich and Peters Reference Ausich and Peters2005; Peters and Ausich Reference Peters and Ausich2008) and have a wide array of easily characterizable morphological features. Even though individuals of this class disarticulate quickly after death, the patterns of disarticulation are well studied and predictable (Meyer et al. Reference Meyer, Ausich and Terry1989; Donovan Reference Donovan1991; Brett et al. Reference Brett, Moffat and Taylor1997), and in some cases crinoids can be identified based on isolated ossicles (Meyer et al. Reference Meyer, Miller, Holland and Dattilo2002; Hunter and Zonneveld Reference Hunter and Zonneveld2008). Finally, crinoid diversity and morphology has been intensely studied during the early Paleozoic, including studies focused on the patterns of crinoid disparity through time (Foote Reference Foote1994, Reference Foote1999; Deline and Ausich Reference Deline and Ausich2011), taxonomic richness (Ausich and Peters Reference Ausich and Peters2005; Peters and Ausich Reference Peters and Ausich2008), ecological abundance and rarity (Deline Reference Deline2009), developmental patterns (Ciampaglio Reference Ciampaglio2002), morphological integration (Gerber Reference Gerber2013), and the effects of community changes and extinction on disparity (Ausich and Deline Reference Ausich and Deline2012).
Crinoid morphology is fairly complicated because their multielement skeletons can be composed of thousands of individual ossicles. However, breaking the organism into different body regions, such as the pelma, the calyx, the periproct, the oral region, and the feeding appendages, can simplify crinoid morphology to some degree. The pelma can consist of an attachment structure as well as a stem composed of stacked columnals that elevate the body above the seafloor. A crinoid calyx consists of a basal cup constructed with two (monocyclic), three (dicyclic), or rarely four (tricyclic) offset circlets of plates with the top circlet (radials) in line with the arms. Above the radials there may be additional fixed plates that enlarge the calyx, which is most common in camerates and flexibles. The peristome and periproct are located on the top surface of the calyx, and the morphology associated with these features can vary significantly. The peristome frame can be constructed with large oral plates, decalcified such that it is not preserved, or covered by a rigidly plated tegmen. The periproct can consist of either a simple anal pyramid or an elevated structure originating from the oral surface (e.g., disparids and cladids) or a tegmen (e.g., camerates). Finally, crinoids have large feeding structures (arms) that vary in number as well as branching patterns. The major groups of crinoids are largely defined by the characteristics of the calyx. Camerates commonly contain many fixed plates in the calyx above the cup, whereas these fixed plates are largely lacking in the disparids and cladids. The number of cup circlets is also taxonomically important with monobathrid camerates and disparids having only two circlets (monocyclic), while cladids and diplobathrids have three (dicyclic). The designation of these major groups as clades depends on the phylogenetic analysis (e.g., Ausich et al. Reference Ausich, Kammer, Rhenberg and Wright2015), and it is likely that one or more of these groups are paraphyletic. Therefore, the term “group” will be used rather than clade to avoid any phylogenetic connotation.
A new discrete morphological character set was constructed as part of the Assembling the Echinoderm Tree of Life Project (AEToL). This character set significantly differs from the crinoid character set constructed by Foote (Reference Foote1999) and later modified by Deline (Reference Deline2009) and Deline and Ausich (Reference Deline and Ausich2011). The modified Foote data set (Deline Reference Deline2009) differed largely from the original (Foote Reference Foote1999) with the addition of characters to accommodate the unusual morphology of protocrinids (Guensburg and Sprinkle Reference Guensburg and Sprinkle2003). The new AEToL data set was substantially expanded compared with that of the modified Foote data set, increasing the number of characters by ~80% from 92 to 178. The addition of characters altered the nature of the character suite in two primary ways. First, characters describing the oral surface that were overlooked in previous analyses were included based on the universal elemental homology model (Sumrall and Waters Reference Sumrall and Waters2012; Kammer et al. Reference Kammer, Sumrall, Zamora, Ausich and Deline2013). Second, the new character set changes the number of characters and, therefore, the emphasis on different body regions. Unintentionally, the arms and infrabasal series were deemphasized in the AEToL data set compared with the Foote data set, whereas the anal series, anal structures, and oral region were coded more thoroughly (Table 1). The reduction of arm characters is largely the result of combining characters and eliminating characters linked with those in other body regions, such as the cup (e.g., separation between arms).
Specimens included along with character and character state volumes (total and for different body regions) for the morphological character suites used in the study.

The full AEToL data set was also split to examine camerate and noncamerate crinoids. In each case, this reduced the size of the character set by 54 and 21 characters, respectively, as characters that describe morphology exclusively within one of the groups were excluded in the other. The number of noncamerate characters is greater largely because of the number of characters that describe the unique morphology within the calceocrinids. In total, 198 crinoids were coded using the AEToL data set (192 of which were previously coded using the modified Foote data set) based on examination of museum specimens and published descriptions. The crinoids included all of the major subgroups of early Paleozoic Laurentian crinoids (monobathrids, diplobathrids, cladids, disparids, hybocrinids, and protocrinids) from various echinoderm taphofacies.
In each of the data sets, characters were coded as a given character state (including absent), missing (unknown or unpreserved), or nonapplicable. These data sets were analyzed following the methods of Deline (Reference Deline2009) and Deline and Ausich (Reference Deline and Ausich2011) using principal coordinates analysis (PCO) with Gower’s similarity coefficient (Gower Reference Gower1971). Gower’s similarity coefficient is defined as the number of shared applicable characters divided by the number of characters in which at least one of the organisms being compared is applicable, which results in values between 0 and 1. This methodology allows the analysis of data sets with significant amounts of missing data along with meaningfully and mathematically distinguishing between nonapplicable and missing data (Deline and Ausich Reference Deline and Ausich2011). This methodology can potentially create triangle inequalities within multidimensional space, but a small value is added to zero distances to prevent this issue (Cailliez Reference Cailliez1983). Based on the similarity matrices, each PCO analysis produces a unique morphospace with axes that can differ in the direction and the amount of variation explained. Therefore, the absolute distances within a morphospace do not necessarily contain the same amount or type of morphological information as one produced with a similar though not identical data set. This is not an issue when comparing the distribution of taxa or relative distances within a single morphospace. With this under consideration, comparing distance metrics between separate PCO analyses in conjunction with the underlying similarity matrix can be useful in understanding the degree of similarity between distinctive morphospaces and how the differences in characters included can manifest within ordination space.
To examine how disparity and other morphological metrics changed with smaller character suites, a rarefaction analysis was conducted on the characters. Rarefaction is a method developed by Sanders (Reference Sanders1968) to examine sample size differences in measures of taxonomic richness. This method has been used in several studies (e.g., Foote Reference Foote1992b; Deline Reference Deline2009) to examine how sample size or community richness influences measures of disparity. The current study instead uses rarefaction analysis on the characters, rather than taxa, to assess how the volume of characters affects differences in measurements of disparity. This was done by randomly subsampling between 5 and 178 characters in the full AEToL data set (or 5–154/124 for analyses of noncamerate and camerate data sets) without replacement 1000 times and calculating multiple metrics. Often in cases of low subsampling (<10), characters were selected in which multiple taxa had exclusively missing character states; in these cases a distance of 0 was applied, because the two taxa could not be differentiated given the data presented. This only occurred with subsets of low character volume, such that this choice did not influence the presented results. In the instances in which metrics were compared with the full data set, such as correlation, the polarity of ordination scores along an axis is important and was, therefore, kept uniform with that of the full data set. In other words, independent ordinations may produce mirror images in morphospace, which does not change the distribution of taxa but will alter the correlation values.
Morphologic properties were then calculated from the random subsets of character suites generated by character rarefaction. These properties included the average and variance in pair wise Gower’s similarity coefficients along with the disparity of the entire data set calculated as the average squared distance between individuals in morphospace. Disparity can also be calculated as the area of a convex hull that encompassed all of the individuals, but this metric resulted in similar patterns as the average squared distance such that only the latter is presented. These two metrics provide distinctive aspects of disparity (range compared with density), but they often follow similar patterns (Ciampaglio et al. Reference Ciampaglio, Kemp and McShea2001). The scores along the first axis were correlated with the ordination scores using the full character set. In addition, a Mantel statistic was calculated between the subsampled and full data set. This statistic compares the structures of the two data sets in terms of the distances between individuals. The relative properties of different groups within the morphospaces were also compared. In the full data set, the properties of noncamerates and camerates were contrasted, whereas monobathrids versus diplobathrids and cladids versus disparids were compared with the lower taxonomic-level analyses. The relative disparities of the subgroups were compared, as was the ability to statistically differentiate the subgroups using Hotelling’s T-squared test, which is a multivariate test used to differentiate sample means.
To visualize the morphospaces generated by the smaller rarified character suites, a rarefaction analysis was conducted from 15 to 160 characters at 25-character intervals with 500 replicates at each stage. At each sampling level the overall disparity was calculated and the morphospace of the median subsample was examined. This was done to obtain a morphospace with properties close to the averages presented in the previous analyses and to prevent the inclusion of an outlier. Although individual distances in the morphospaces are not directly comparable, the relative position, spread, and distribution of the groups within morphospace are useful in understanding how the results change with character volume.
To examine the effect of changing the emphasis on particular body regions, the character set was split into characters describing the oral system (i.e., oral opening, oral plates, tegmen, and arms), calyx (i.e., cup and fixed brachials), periproct system (i.e., anal opening, plates, interarea, tube, and sac), and pelma (i.e., column and holdfast). The different body regions varied in their amount of missing data such that the data set was culled to exclude taxa or characters that had higher than 15% missing data (i.e., not preserved). This threshold was selected to keep a robust selection of taxa and characters and a uniform level of missing data between body regions. This resulted in an analysis of 105 crinoids with 136 characters. A rarefaction analysis was conducted for each body region in which all of the characters from one region were maintained while progressively smaller subsets of characters from other regions were sampled without replacement. Relative disparity, calculated as the average squared distance between organisms in morphospace of one group divided by that of another, was then calculated for the different ratios of crinoids (Camerata/Cladida, Camerata/Disparida, Disparida/Cladida) with 1000 replicate subsamples from 100% to 0% of the characters from other body regions at 10% intervals. Therefore, as the analysis progresses toward smaller character suites, one body region progressively represents a larger proportion of the characters in the data set, and the results can be compared with those from the earlier rarefaction analyses. For instance, the oral surface is characterized with 26 morphological characters and represents 14.6% of the overall characters in the AEToL data set. At the 90% rarefaction level, the 26 oral surface characters are retained, and 137 out of 152 of the characters from other body regions are randomly selected, thereby increasing oral surface characters to 16% rather than 14.6% of the total number of characters.
All analyses and statistics were conducted using R, Version 3.11 (R Core Team 2014) with the cluster (Maechler et al. Reference Maechler, Rousseeuw, Struyf, Huburt and Hornik2014), Hotelling (Curran Reference Curran2013), and splancs (Rowlingson and Diggle Reference Rowlingson and Diggle2013) packages.
Results
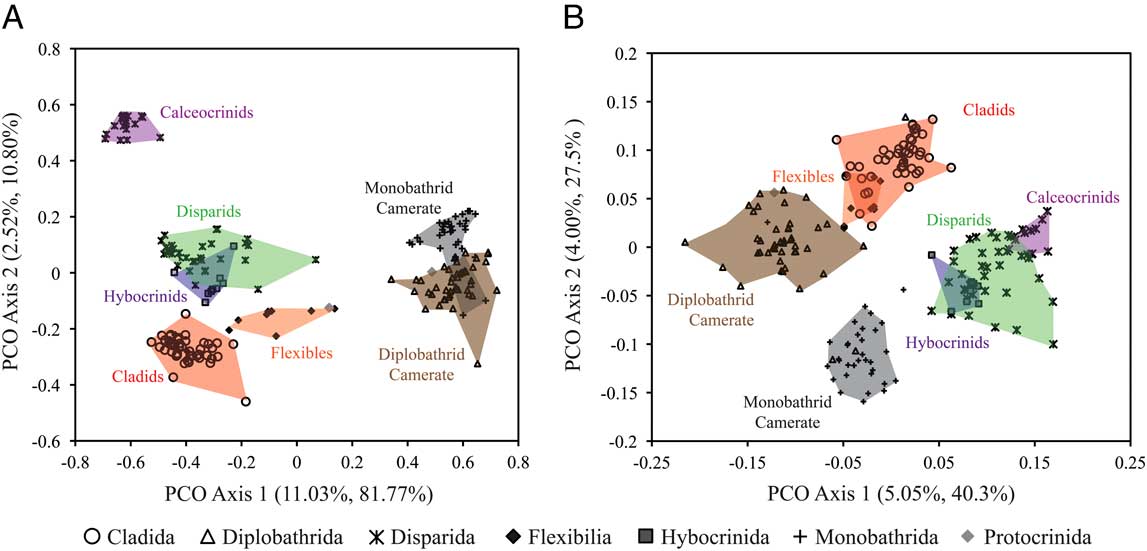
As was demonstrated in previous studies (Deline and Ausich Reference Deline and Ausich2011; Ausich and Deline Reference Ausich and Deline2012), the modified Foote character suite produces a morphospace (Fig. 1B) that distinguishes the four major early Paleozoic crinoid groups (Cladida, Disparida, Monobathrida, and Diplobathrida) with the smaller groups nested within (Flexibilia within the Cladida and the Hybocrinida within the Disparida). Each of the groups occupies roughly an equivalent area within morphospace, and characters associated with the complexity of the cup and the presence or absence of an infrabasal circlet drive the separation between groups. The expanded AEToL character suite retained the four major groups as expected (Fig. 1A) but greatly reduced the separation based on the infrabasal circlet, while expanding the distance between camerates and noncamerates. Hybocrinids shift from within the disparid area in morphospace to an intermediate position between disparids and cladids. Also, the morphologically distinctive and bilaterally symmetrical calceocrinids plot as morphologically unique from all other crinoids included in the study.
A, Morphospace of 197 Ordovician to early Silurian crinoids coded using the AEToL data set. B, Morphospace of 191 Ordovician to early Silurian crinoids coded using the modified Foote character set. The proportion of variance explained by each axis is given with and without Cailliez correction.

Even with the large increase in characters and the shift in emphasis in body regions in the two character suites, the morphological structures are statistically similar in terms of the individual ordination scores on the primary axes (Spearman’s rho axis one, −0.784, and two, −0.728, p<0.001), and the distances between taxa within the two morphospaces are consistent (Mantel test, p=0.001).
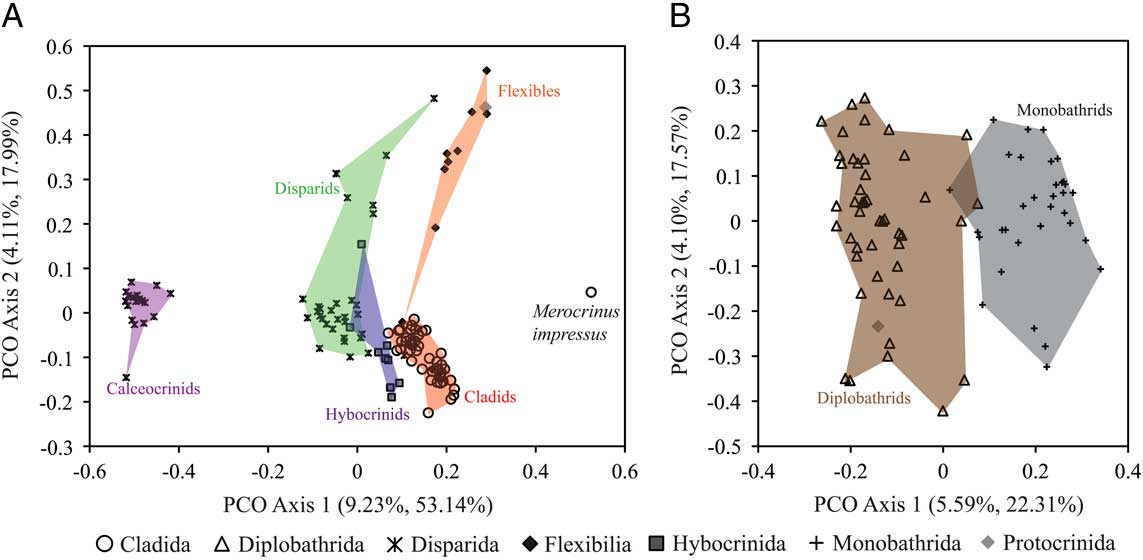
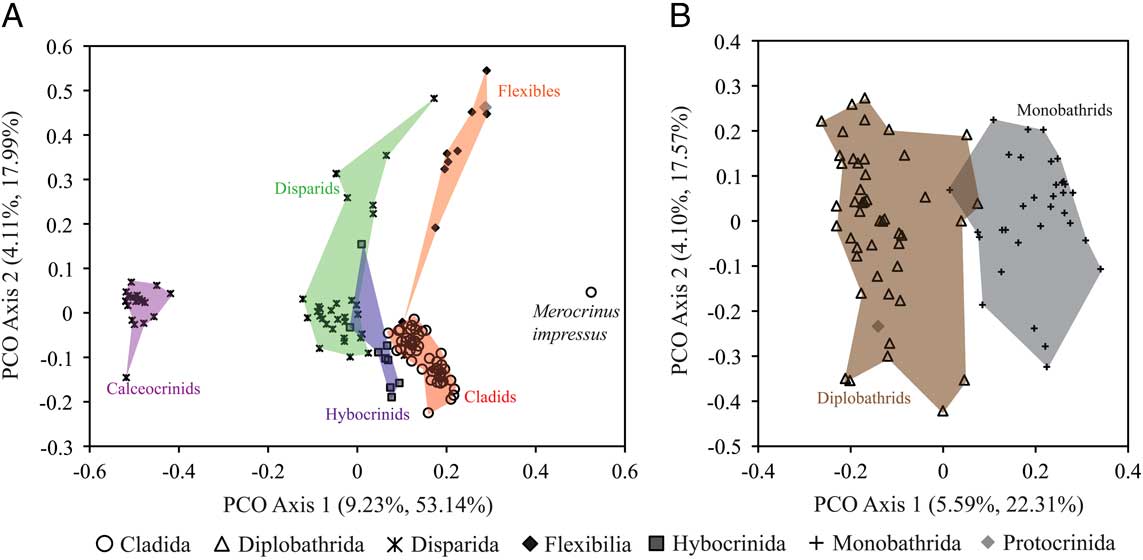
An independent analysis of the two major groups in the AEToL analyses shows further details of the morphological patterns of the character suite. The noncamerate morphospace (Fig. 2A) has a disparid, hybocrinid, cladid gradient with the distinctive calceocrinoids along the primary axes, as in Figure 1. The cladid outlier (Merocrinus impressus, labeled in Fig. 2A) is distinctive due to a combination of poor preservation and a slightly unusual cup construction. The second axis correlates with the presence of fixed brachials within the cup, most notably within the flexibles. The camerate morphospace (Fig. 2B) is much more uniform, with a gradation along axis 1 between the monobathrid and diplobathrids. Axis 2 correlates with the character distribution of features associated with the organization and shape of the tegmen such that convex and radially plated tegmens plot positively on the second axis.
Morphospaces constructed by independent ordination of taxonomic subsets of the AEToL data set. A, A set of 117 noncamerate crinoids including Cladida, Disparid, Flexibilia, Hybocrinida, and a single primitive crinoid tentatively assigned to Cladida (Apketocrinus). B, A set of 80 camerate crinoids (Monobathrida and Diplobathrida) and a Protocrinoida that more closely aligns morphologically with Camerata (Glenocrinus). The proportion of variance explained by each axis is given with and without Cailliez correction
These three data sets (AEToL all crinoids, camerates, and noncamerates) were then subjected to character rarefaction analyses. Regardless of the details of the morphospaces and their relevance to crinoid morphology, they differ in their primary structure in terms of the distinctiveness of the clusters of taxa within the multidimensional space. This allows the exploration of how different morphological data structures relate to patterns in character rarefaction. The full data set (Fig. 1A) shows a significant distance between the two groups, with few intermediate taxa. The noncamerate morphospace (Fig. 2A) has a smaller separation between the two major groups, with one of those groups containing a very morphologically distinctive group (calceocrinids). The camerate morphospace (Fig. 2B) has distinctive though overlapping clusters of individuals.
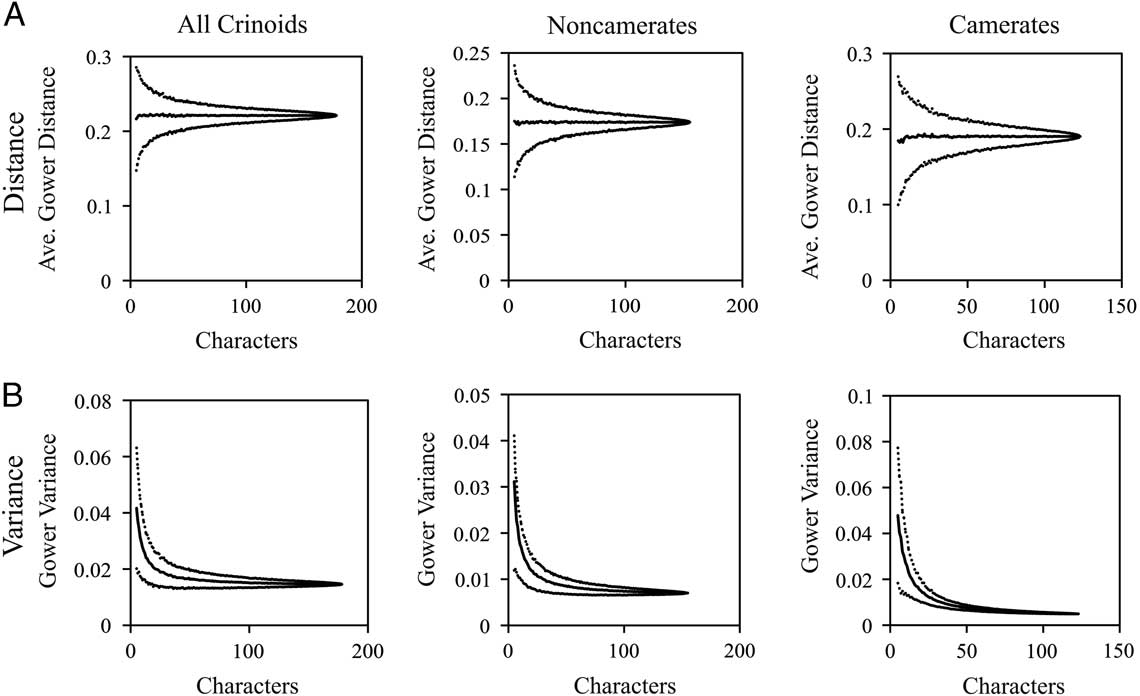
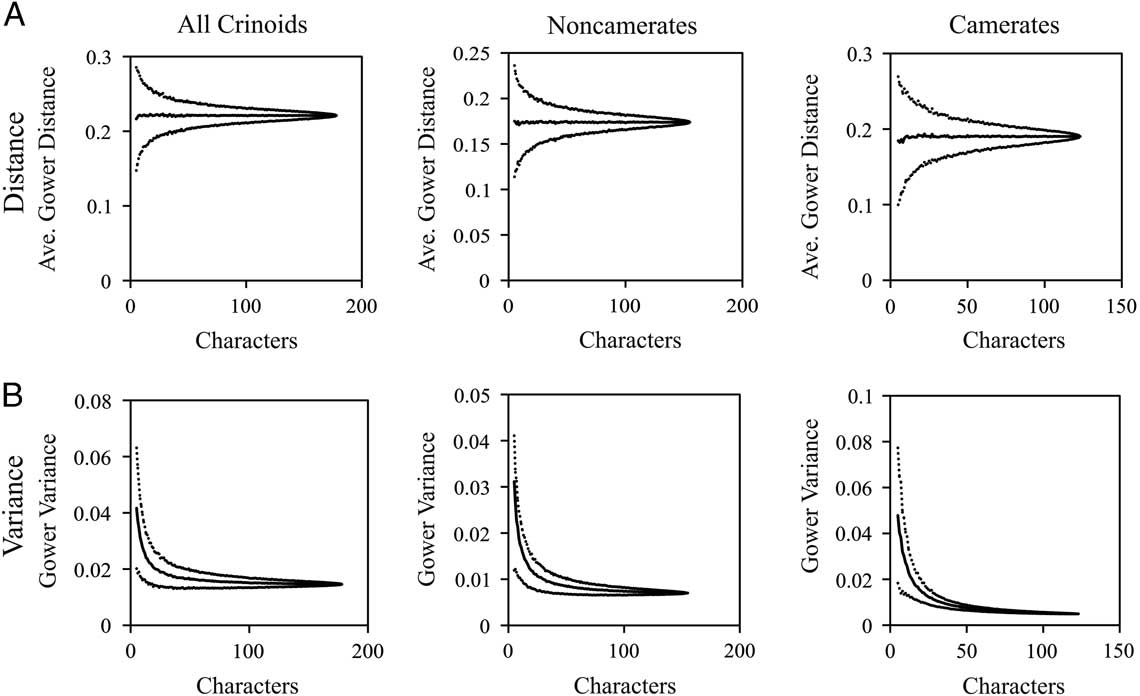
Character rarefaction trends in the Gower’s similarity matrix are similar for the three different crinoid data sets (Fig. 3). The average pairwise Gower similarity is stable regardless of the number of characters included in the analysis (Fig. 3A). There is a large decrease in the variability of the average pairwise similarity determined by the standard error, but it is unlikely any of the patterns in this study are the result of changes in the average similarity. However, variance in the pairwise Gower similarity changes dramatically (Fig. 3B). In all three data sets, the variance decreases at approximately 30 characters and then stabilizes. At low volume of subsampled characters, it is likely that two crinoids either share all or no character states of the randomly selected characters, which results in very different similarity coefficients. At approximately 30 characters, both the average distance and the variance of the distances within the matrix stabilizes such that independent ordinations of these data should be closely related even in the sense of the meaning of absolute distances.
Character-level rarefaction curves of the three subsets of the AEToL character set (crinoids, non-Camerata, and Camerata) examining how Gower’s similarity coefficient changes with varying numbers of characters. Character sets were subsampled 1000 times including different numbers of characters from two to the complete data set. A, Average Gower’s similarity coefficient between individuals in the data set. B, Variance in Gower’s similarity coefficient between individuals in the data set. Error envelopes are calculated based on the standard error of the 1000 replicate samples.
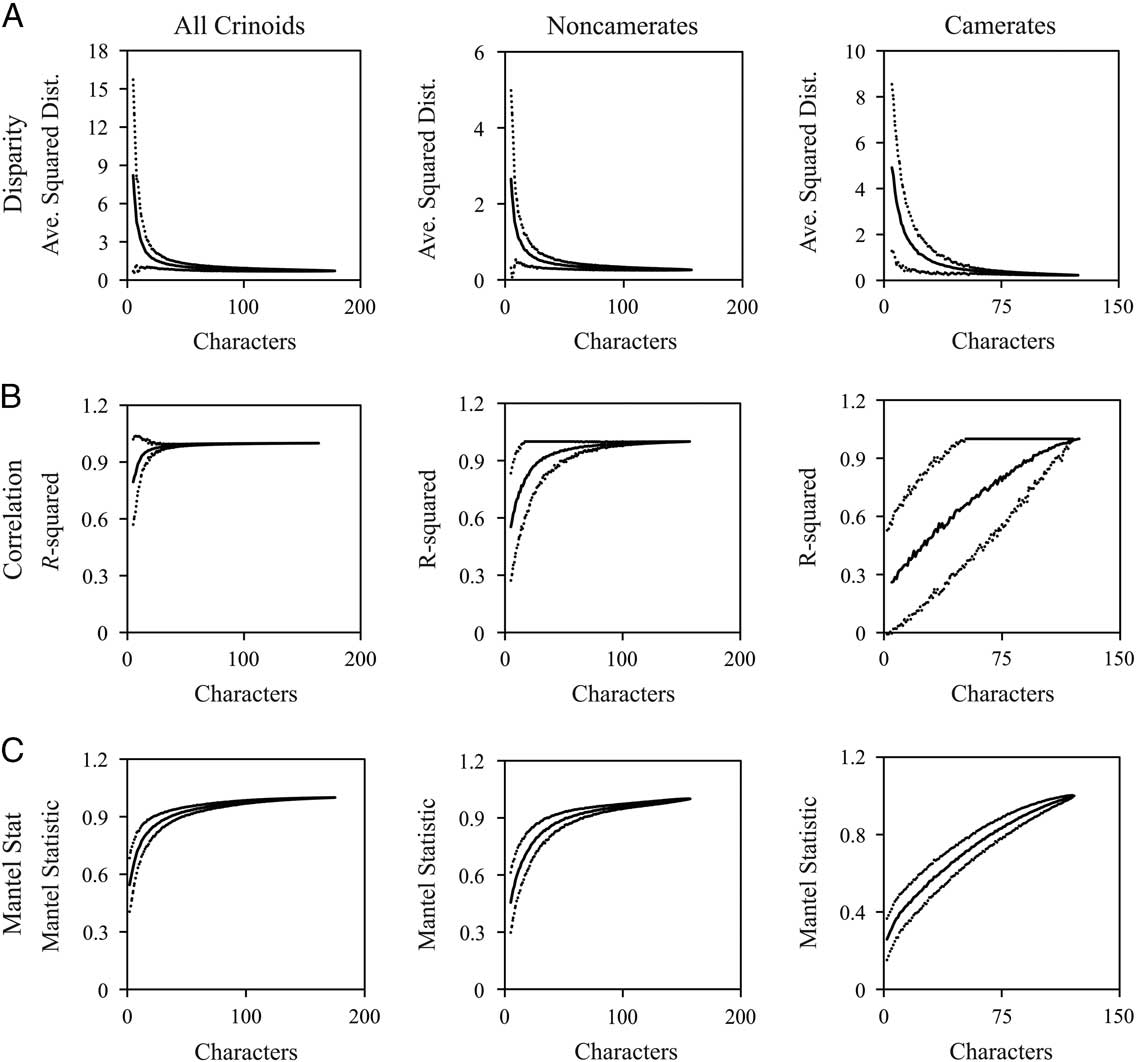
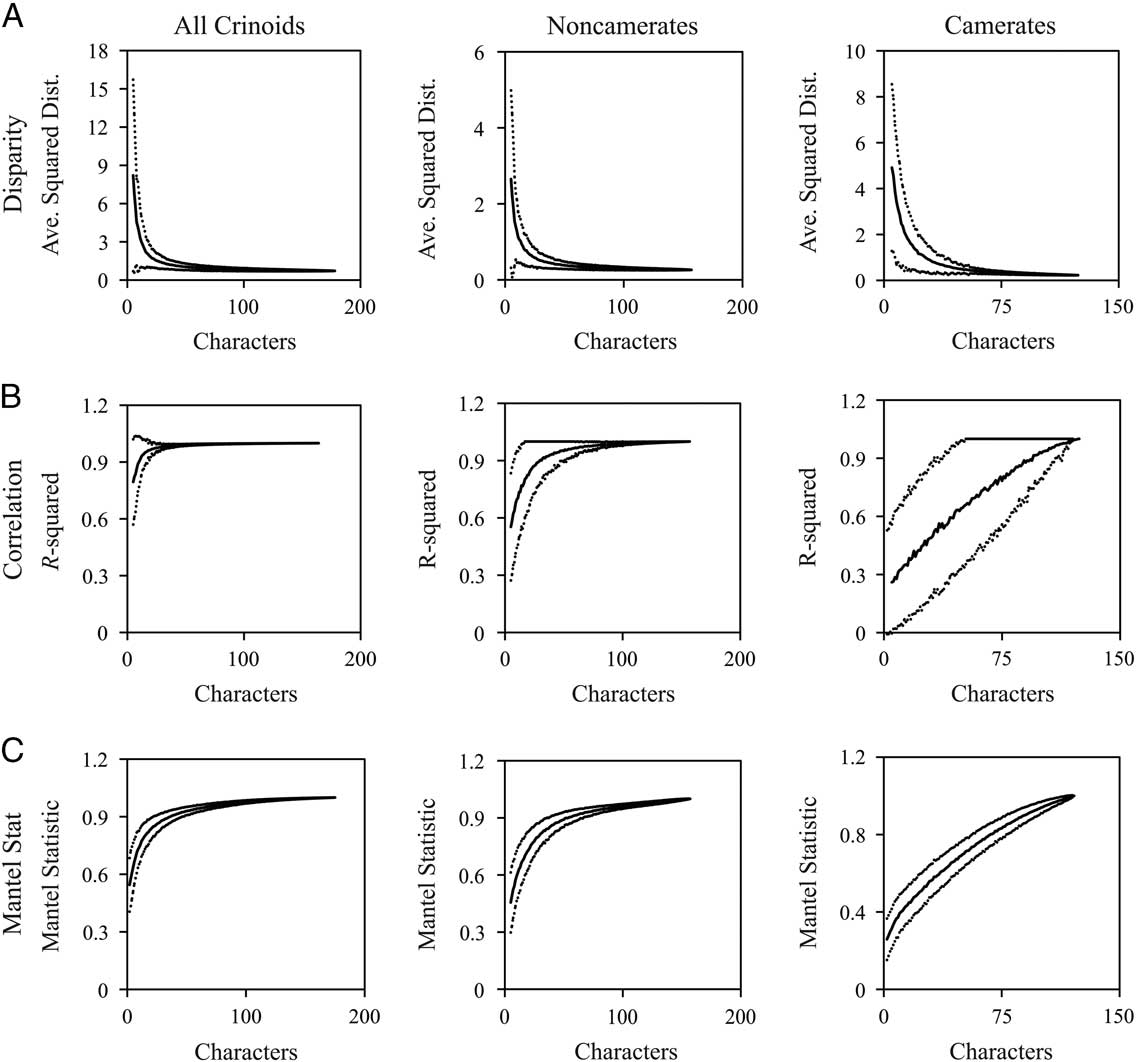
Character rarefaction curves of disparity trends calculated as the average squared distance between taxa in morphospace are similar with the three difference analyses (Fig. 4A). In each case, disparity decreases and then stabilizes at approximately 30 characters, with slightly more error associated with the camerates. This closely mimics the patterns in variance within the similarity matrix, which is likely the controlling factor in the disparity pattern. Rarefaction curves comparing the subsamples statistically to the full data set in terms of the correlation of individual ordination scores on the first axes (Fig. 4B) and the Mantel statistic (Fig. 4C) had results similar to the earlier analyses, flattening out at approximately 30 characters (for the full and noncamerate analyses). However, camerate rarefaction showed a steady rise in both the correlation and Mantel statistic, indicating a significant change in the structure of the morphospace with fewer characters.
Character-level rarefaction curves of the three subsets of the AEToL character set comparing different morphological metrics. Character sets were subsampled 1000 times including different numbers of characters from two to the full character set. A, Disparity, which is calculated as the average squared distance between individuals in morphospace. B, Correlation, calculated as the R-squared value between the first axis of the subsampled data set and the full data set. C, Mantel statistic, calculated between the subsampled morphospace and that constructed with the full data set.
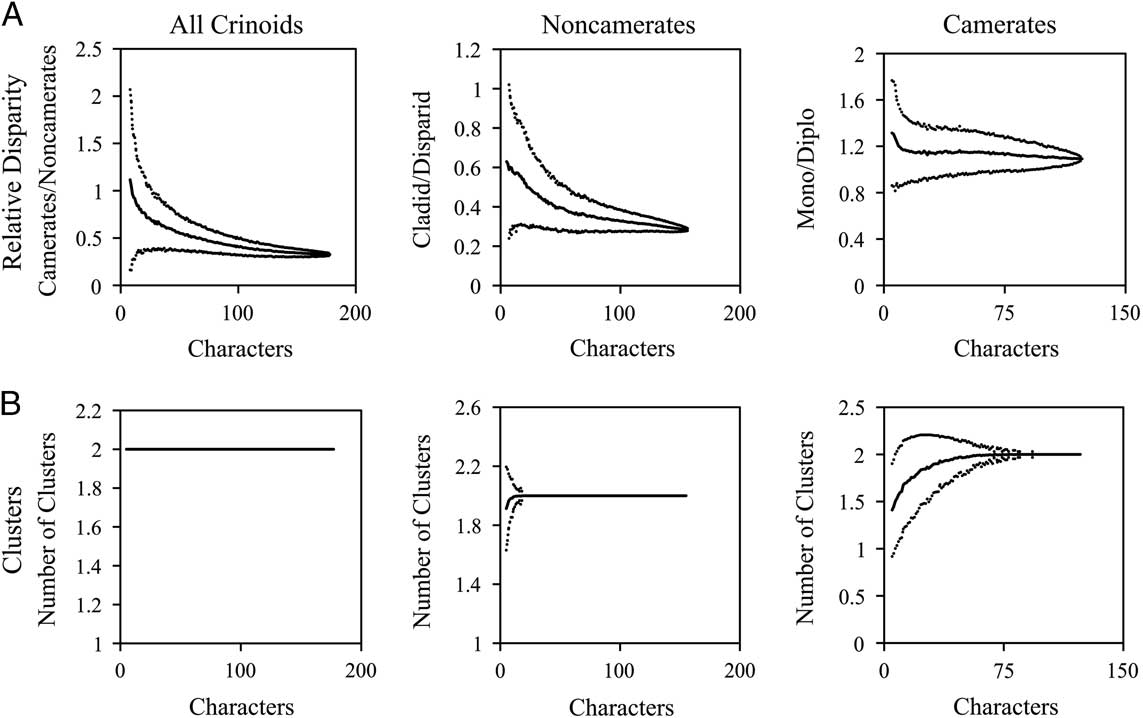
Examination of the character rarefaction curves for the individual groups within each morphospace yield results similar to those for the morphospace overall (Fig. 5). The slope of the rarefaction curve of the relative disparity of the different groups (Fig. 5A) decreases at approximately 30 characters. However, for the entire data set and noncamerates, the ratio continues to change as additional characters are added. This change is minor and would be unlikely to alter interpretations, but it does not stabilize in the same manner as other analyses. This indicates that even though the underlying distance structure is fairly stable, absolute distances and the placement of taxa within morphospace can still vary, which alters perceptions of relative disparity. The ability to statistically differentiate the groups (Fig. 5B) again stabilizes at approximately 30 characters, less for the distinctive clusters in the inclusive data set and more for the camerates in which the clusters overlap.
Character-level rarefaction curves for the internal properties of the three AEToL morphological data sets. Character sets were subsampled 1000 times including different numbers of characters from two to the full character set. A, Relative disparity between groups, calculated as the average squared distance between individuals within one group divided by another; all crinoids: camerate disparity divided by that of noncamerates; non-Camerata: Cladida disparity divided by that of disparids; Camerata: Monobathrida divided by that of Diplobathrida. B, Number of statistically distinctive clusters defined by whether the major groups in the subsamples could be statistically distinguished using the nonparametric two-sample Hotelling’s T-squared test.

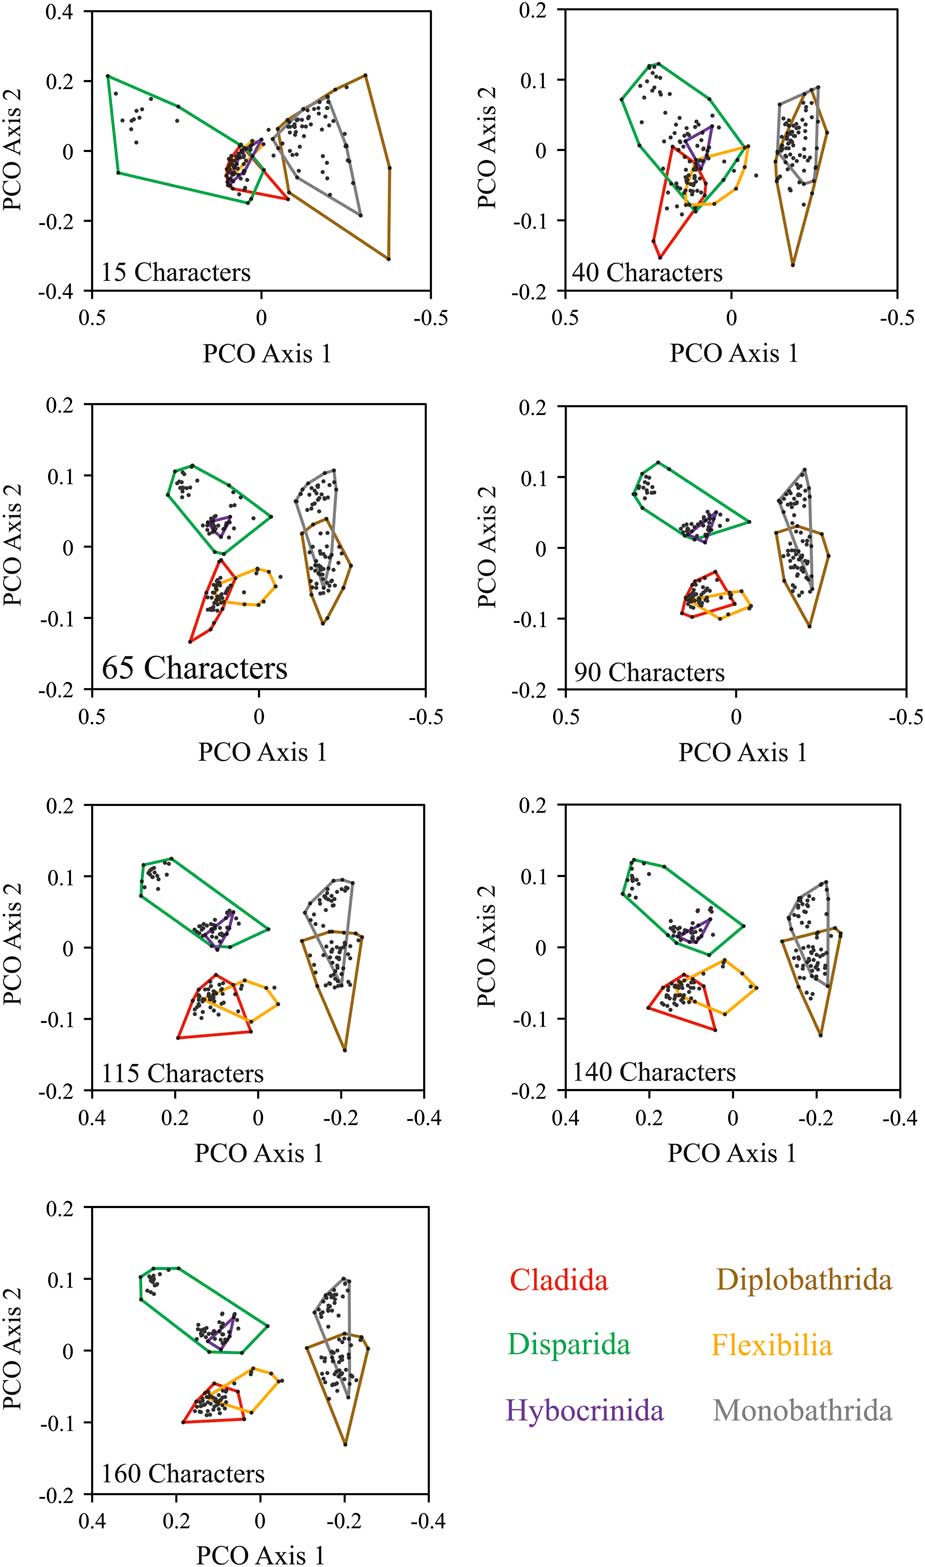
The distribution of taxa in the rarified morphospaces can be visualized by examining the area occupied and position of crinoid groups within morphospace at different levels of character subsampling (Fig. 6). The morphospace constructed with the lowest character volume (15 characters) is able to differentiate camerates and noncamerates, though there is little distance between them and the analysis is unable to distinguish patterns within those groups. The morphospace based on 40 random characters increases the distance between the two major groups and begins to differentiate the noncamerates. All of the subsequent morphospaces are similar in their overall placement of the different groups of crinoids. Monobathrid and diplobathrid overlap to varying degrees, with the former positioned at higher values on axis 2 along with disparids. Hybocrinids are positioned within the area occupied by disparids, and flexibles overlap with the cladids but occupy a more medial position in morphospace given their similarities to camerates (fixed brachials). As would be expected, there are differences between the morphospaces in terms of the amount of area covered and the amount of overlap between groups, indicating shifts in the placement of individuals within morphospace, but the overall structure of results is maintained.
Example morphospaces constructed with different numbers of random characters. Each example was selected by taking the sample with the median disparity of 500 random subsamples. This was done to present a morphospace representative of the average presented in previous figures and to avoid obvious outliers. The convex hulls enclose the major groups of crinoids included in the study.

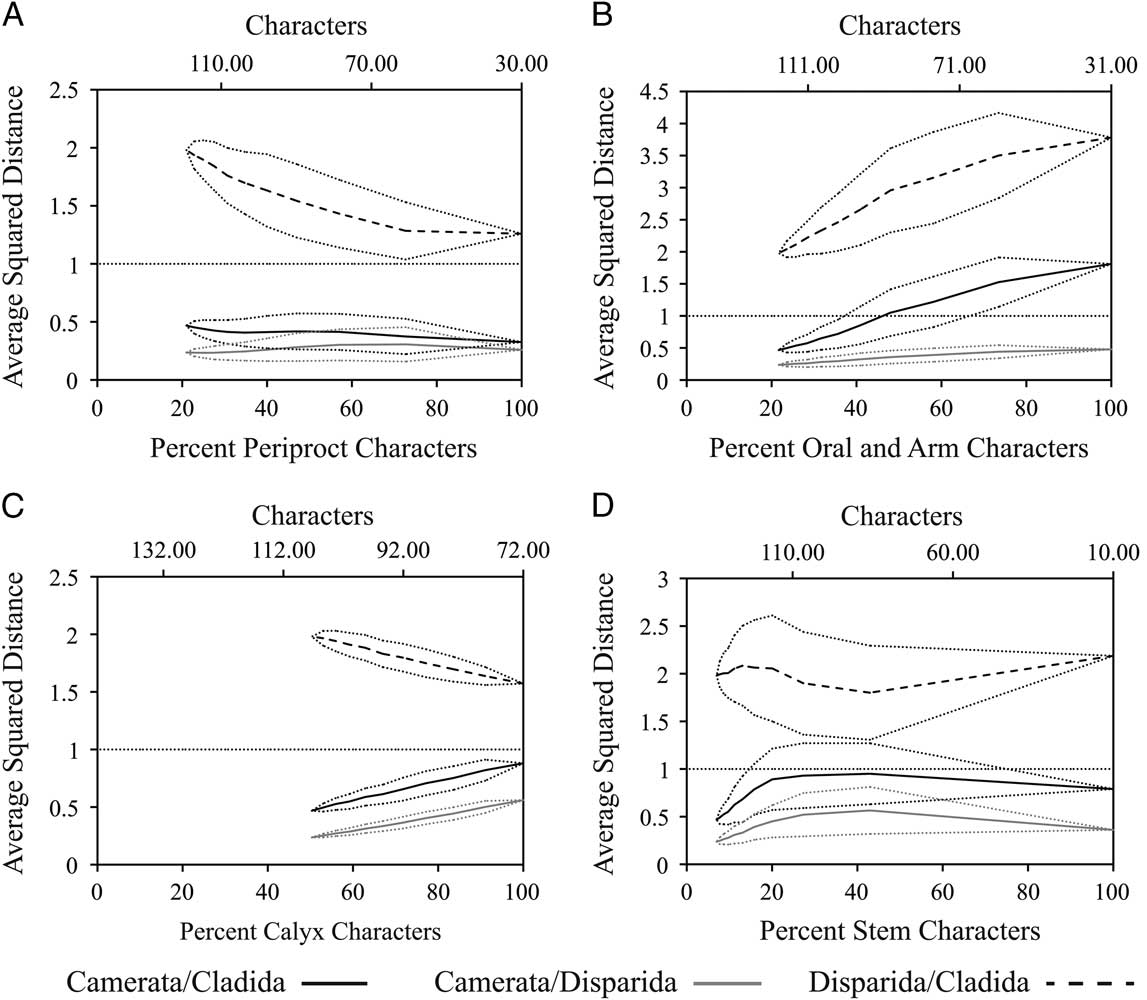
It would be expected that the type of character as well as the overall number of characters would have a role in the resulting morphospace. To explore this, a subsampling routine was conducted in which characters from one body region were always sampled and only a proportion of characters from other regions were randomly selected, such that as the number of characters sampled decreased, the relative proportion of characters from one body region were increased (Fig. 7). In three of the four cases (periproct, cup, and stem), the relative ordering of disparity of the crinoid subclasses remained constant (i.e., the ratio does not cross 1), although the magnitude of disparity between classes changed. For instance, as characters associated with the periproct (anal series, anal tubes, and sacs) are emphasized (Fig. 7A), the relative disparity of disparids lessens in comparison with that of cladids. As would be expected given their abundant fixed brachials, camerates increase in relative disparity as the calyx is emphasized (Fig. 7C). The emphasis of stem characters is less useful (Fig. 7D), which is likely a result of similar stem morphology within the groups examined. The only case in which the relative disparity changes (crosses 1) is the comparison of camerates and cladids (Fig. 7B) when the arms and oral systems are emphasized.
The effect of varying the proportion of characters from different body regions on relative disparity. The curves originate at the full data set, then the characters from the other body regions are gradually decreased in proportion. This is done by including the full set of characters from one region and taking a random sampling of the characters in other body regions based on their original proportions (e.g., taking a random sample [without replacement] including 90% of the characters from other body regions). At each proportion, relative disparity is calculated as the average of 1000 replicates of the disparity of one group of crinoids divided by another with the error envelopes calculated as the standard error of those replicates. A, Increasing the relative proportion of characters associated with the periproct, which includes characters describing anal plates/series in cladids and disparids, the CD interray plating in camerates, and the anal tube/sac. B, Increasing the relative proportion of characters associated with the oral system, which includes characters associated with the peristome, tegmen, and arms. C, Increasing the relative proportion of characters associated with the calyx, which includes characters associated with primary circlets, cup shape, plate ornamentation, fixed brachials, and fixed interray plates. D, Increasing the relative proportion of characters associated with the pelma, which includes characters associated with stem and holdfast.

Discussion
The original Foote (Reference Foote1994, Reference Foote1999) data set was constructed with discrete characters that would represent readily preserved portions of the crinoid body. Potential taxonomic or functional significance of characters was not a factor in character selection. Analyses in Deline (Reference Deline2009), Deline and Ausich (Reference Deline and Ausich2011), and Deline et al. (Reference Deline, Ausich and Brett2012) expanded on the Foote database by adding new characters needed to differentiate taxa named since the Foote data set was assembled and some taxa not included in the Foote data set. Further, the modified Foote data set reduced the number of binary character states. Approximately 33% of modified Foote database characters were binary characters, in contrast to the Foote database with 60%. Also, for multistate characters in both data sets, the modified Foote database commonly had more character states than the Foote database. The changes in character states are more the result of a shift in coding scheme in regard to the treatment of nonapplicable characters rather than the addition of or division of morphological features.
The new AEToL data set was constructed de novo of discrete characters, with the initial emphasis being characters that had been identified in the literature as important for the definition of genera. Additional characters and character states were added as more taxa were coded. The result was a greatly expanded data set, increasing the number of characters by ~80%, from 92 to 178. The new data set included characters needed to accommodate the unusual morphology of the protocrinoids (Guensburg and Sprinkle Reference Guensburg and Sprinkle2003) and other taxa that had not been coded previously. The relative number of binary versus multistate characters for the entire AEToL data set is basically the same as in the modified Foote data set, but it was variable for the suite of characters for different body portions. Relative to the modified Foote data set, the AEToL data set had a higher percentage of binary characters for the pelma, a higher percentage of multistate characters for the aboral cup/calyx, and a higher percentage of binary characters for the arms.
In the AEToL data set, characters were coded as needed to distinguish taxa and provide evidence for common ancestry, with little attention paid to balancing the number of characters in different regions of the body. Details of the posterior interray are very significant for differentiating taxa, and recent studies (Sumrall and Waters Reference Sumrall and Waters2012; Kammer et al. Reference Kammer, Sumrall, Zamora, Ausich and Deline2013) demonstrated the importance of oral region characters for homologies within pentaradiate echinoderms. This resulted in many more posterior and oral region characters and shifted the balance of characters representing different body regions (Table 1). Because camerate and noncamerate crinoids have a portion of characters unique to these two groups, it is more accurate to compare characters of each group (Table 1). In both, the relative number of characters is approximately the same for the aboral cup/calyx, stem/holdfast, and arm characters. The relative number of anal series characters is greater than the oral surface/tegmen for noncamerates, and the opposite is true for camerates. Additionally, there was a decrease in the relative number of characters associated with the arms, and attributes of the radial circlet were more emphasized than either the basal circlet or infrabasal circlet (Table 1).
More characters, more multistate characters, and more character states in the AEToL databases relative to the Foote database provide for a more detailed tracking of morphology. The echinoderm multielement, mesodermal skeleton of all echinoderms is a Bauplan with a very high potential for skeletal modification, resulting in a relatively high degree of homoplasy in crinoid morphology. This presents a major challenge for determining the underlying crinoid phylogeny. For example, consider an individual character such as pinnules. Even though pinnules are characteristic of camerate crinoids and advanced cladids, pinnules evolved in most major clades and may have evolved numerous times in some clades. The entire calyx design was also repeated among clades multiple times (Ausich Reference Ausich1996). Because crinoids have a multielement skeleton that commonly appears to have acted independently in many cases, the AEToL databases should capture the same aspects of the morphospace as captured by the modified Foote database, as well as a more detailed and nuanced crinoid morphospace because more characters and character states are considered. For example, this includes a more detailed depiction of simple constructional characters, such as details of the interradial areas of the aboral cup/calyx and characters that are considered important ecological characters, such as the presence of ramules.
Although the AEToL morphological character suite produces a distribution of taxa within morphospace that is statistically similar to the modified Foote data set, there are multiple differences that appear to better capture the details of crinoid morphology. The AEToL data set reduces the overall influence of the infrabasal circlet, which is valuable in that the developmental process of the circlet formation is unclear (Ausich Reference Ausich1996; Guensburg and Sprinkle Reference Guensburg and Sprinkle2003), and this circlet is greatly reduced and in some cases hidden within the basal concavity (e.g., many camerates and advanced cladids), which reduces its significance to the overall morphology. When this aspect is reduced, the cladids and disparids maintain their distance, but the monobathrids and diplobathrids begin to overlap, which is consistent with the differences or lack thereof in other body regions.
The AEToL character suite also improves the treatment of unusual morphologies. The modified Foote data set categorized the myelodactylids as very distinctive based only on unusual and fairly uniform stem characteristics within the family (Deline and Ausich Reference Deline and Ausich2011), whereas the current data set places them within the disparid area of morphospace. This distinction in the modified Foote data set was likely overemphasized given that myelodactylids are often poorly preserved with large amounts of missing data within the crown such that comparisons with other taxa are based largely on stem morphologies.
Alternatively, calceocrinids, which display unusual morphologies in the attachment of the stem to the cup, arms, the bilateral structure of the cup, and unique arm-branching patterns do not plot as distinctive from other disparids in the modified Foote data set (Deline and Ausich Reference Deline and Ausich2011: Fig. 1; Fig. 1). This may be caused by a lack of characters that collectively separate the family from other disparids along with large degrees of morphologic variation within the calceocrinids. The AEToL data set better addresses the morphologic distinctiveness of the calceocrinids, resulting in an increased distance from the rest of the disparids that is consistent with the separation between the disparids and the camerates. Finally, the addition of oral surface characters based on Kammer et al. (Reference Kammer, Sumrall, Zamora, Ausich and Deline2013) in the AEToL data set shifts the placement of hybocrinids into an intermediate position between cladids and disparids, which is more in line with their overall morphology (Ausich et al. Reference Ausich, Kammer, Rhenberg and Wright2015).
Changing the relative proportion of characters from different body regions can also yield insights into both aspects of morphology and potential biases in quantifying morphology. Morphological patterns in pterocephaliid trilobite cranidia appear to be consistent with those of the entire organism (M. Hopkins personal communication 2016). This is a useful result in understanding trilobite evolution, but how the disparity of a feature relates to the whole organism depends greatly on morphologic features, developmental patterns, and the organism being studied. The current results indicate the relative disparity between crinoid subclasses changes with a changing emphasis on different body regions. This could indicate that crinoid disparity is a product of the disparity patterns of distinctive anatomical regions, each of which have their own histories and dynamics. This lower level of morphological integration might explain the contrasting pattern in trilobites and is consistent with the observations of other authors (Kammer et al. Reference Kammer, Sumrall, Zamora, Ausich and Deline2013). Alternatively, this shift could be a mere artifact of the coding scheme. As species saturate character space, the pairwise dissimilarity should approach a value that is a function of the number of characters states (Lupia Reference Lupia1999). This value should be the number of character states within a region minus one divided by the number of character states, resulting in a value 0.5 for binary characters and increasing with the addition of more multistate characters. In the AEToL data set, these values can be easily calculated for the different body regions compared in Figure 7. This does not appear to be an issue, in that all of the body regions have similar values ranging from 0.71 in the oral region to 0.76 in the pelma. Therefore, it is unlikely that the character space is saturated, indicating that the shifts seen in Figure 7 are reflective of evolutionary patterns.
Large shifts in the magnitude in crinoid subclass disparity occur when characters associated with the periproct, cup, or oral surface are emphasized. As characters associated with the periproct are emphasized, disparids lag behind cladids, which is the result of more diversity in the cladid anal series within the cup and anal sacs above it. All of the ratios shift when the cup is emphasized. Camerate disparity increases in comparison with either cladids or disparids, which is the result of a more complex calyx that incorporates fixed rays and interareas. The biggest shift in subclass relative disparity occurs when the oral and arm characters are emphasized, resulting in the disparids and camerates appearing more disparate compared with cladids. Tegmen and arm characters opposed to those of the orals and peristome, which are more rarely preserved, likely drive this pattern. Camerates, and rarely disparids (e.g., Anomalocrinus), have tegmens, whereas cladids typically lack this feature (especially within the current data set). In addition, disparids have a greater diversity in arm structures based on the unusual branching patterns within the calceocrinids.
Care needs to be taken in constructing character suites to not overemphasize particular body regions that could potentially bias overall results. Alternatively, overall disparity might be somewhat simplistic in understanding morphological evolution through time. If a particular body region is more evolutionarily plastic and character rich than others, normalizing the weight of different body regions could dampen evolutionary patterns of interest. Therefore, care should be taken to dissect patterns of disparity within skeletal modules, between modules, and between entire organisms akin to analyses of alpha, beta, and gamma biodiversity.
Body regions can have different preservation potential (as is the case with crinoids; see Brett et al. Reference Brett, Moffat and Taylor1997), such that missing data is disproportionately applied to certain body regions, which may bias results, analogous to the loss of soft-tissue characters in phylogenetic studies, which makes fossil taxa appear more primitive (Sansom and Wills Reference Sansom and Wills2013). The current analysis demonstrating a change in morphological characterization with shifting emphasis on different body regions, along with a recent study (Samson et al. 2013) indicating a shift in emphasis between character types (e.g., soft tissue compared with skeleton) can alter the branch order in phylogenetic analyses, highlights the need for character subsampling analyses analogous to those presented herein (both random and selective) to examine how the choice of characters influences phylogenetic conclusions.
Even though the detail in the AEToL morphospace described earlier appears to better capture the morphology of early Paleozoic crinoids, the larger data set is not necessarily required to capture the large-scale trends in morphology through time. If a smaller character set is utilized, the temporal and or taxonomic breadth of the potential study could be expanded while still capturing relevant trends. Randomly selecting a set number of characters based on the pattern of the rarefaction curves would allow both a greater breadth of study and the ability to confidently capture morphological trends. For the current study, only 30–50 characters are needed when there are well-defined clusters of taxa (e.g., all crinoids or noncamerates). This may be related to characters or character states that are included to capture unusual and in many cases unique features (e.g., the respiratory structures in Colpodecrinus). These characters and character states are commonly known for a single individual and likely contribute little to the structure of the primary axes.
In addition, the complete character suite contains characters that, although they are anatomically distinctive, are also redundant, meaning they have similar distributions of characters states across the animals coded. Reducing the number of these characters may have a result in overall distances but not necessarily the distribution of taxa. The threshold mentioned above likely captures representatives of these redundant characters, such that the major subgroups in morphospace can be established. Gerber (Reference Gerber2013) recently explored the relationship between the integration of characters and disparity using Foote’s character suite. Although the results indicated character integration and disparity were not inherently related, the covariance of characters is likely important in generating the results of the current study. If levels of character integration increase through time, as was shown by Gerber (Reference Gerber2013), the number of characters needed to accurately quantify morphology would decrease. Alternatively, if the majority of character combinations were exhausted early in a clade’s history and followed by subsequent increases in convergent evolution, as was demonstrated by Wagner (Reference Wagner2000), more characters might be needed because there might be fewer characters unique to the major clades (i.e., fewer characters reiterating the same morphological signal). Nevertheless, the exclusion of these characters has little effect on the primary axes of the morphospace. In cases in which the clusters of taxa are less defined (e.g., camerates), more characters are needed to capture morphological patterns, and it may be possible that the complete AEToL character suite is still insufficient to capture the intricacies of camerate morphology. Nevertheless, the stabilization of morphological patterns with a fairly comprehensive character suite is satisfying given that the alternative would result in very different morphological and evolutionary results with the continual addition of characters.
Given that the distribution of taxa in morphospace is obviously unknown prior to experimental design and the construction of morphological character suites, the results of this study indicate that it is worthwhile to conduct a pilot study to examine the trends in character rarefaction curves in order to effectively design studies to quantify trends in morphology through time. This practice is valuable because accurately quantifying morphological patterns through time may not require expansive character suites.
Acknowledgments
This project was funded by AEToL Research Opportunity Award Supplements to National Science Foundation grants DEB 1036416 (W.I.A.) and DEB 1036356 (T. Kammer). University of West Georgia students G. Knison, T. Fanning, and E. Young assisted in coding specimens and were funded by the UWG Student Research Assistance Program. The AEToL character suite was improved by helpful input and discussions with T. Kammer and S. Donovan. We thank the following for providing access to curated specimens: Tiffany Adrian, University of Iowa; Roger Burkhalter, Sam Nobel Oklahoma Museum of Natural History, University of Oklahoma; Susan Butts and Jessica Utrup, Yale Peabody Museum of Natural History; Jessica Cundiff, Museum of Comparative Zoology, Harvard University; Kathy Hollis, U.S. National Museum of Natural History; and Brenda Hunda, Cincinnati Museum Center. This work was greatly improved through discussions with M. Foote and detailed and thoughtful reviews by Colin Sumrall, Peter Wagner, and Melanie Hopkins.