INTRODUCTION
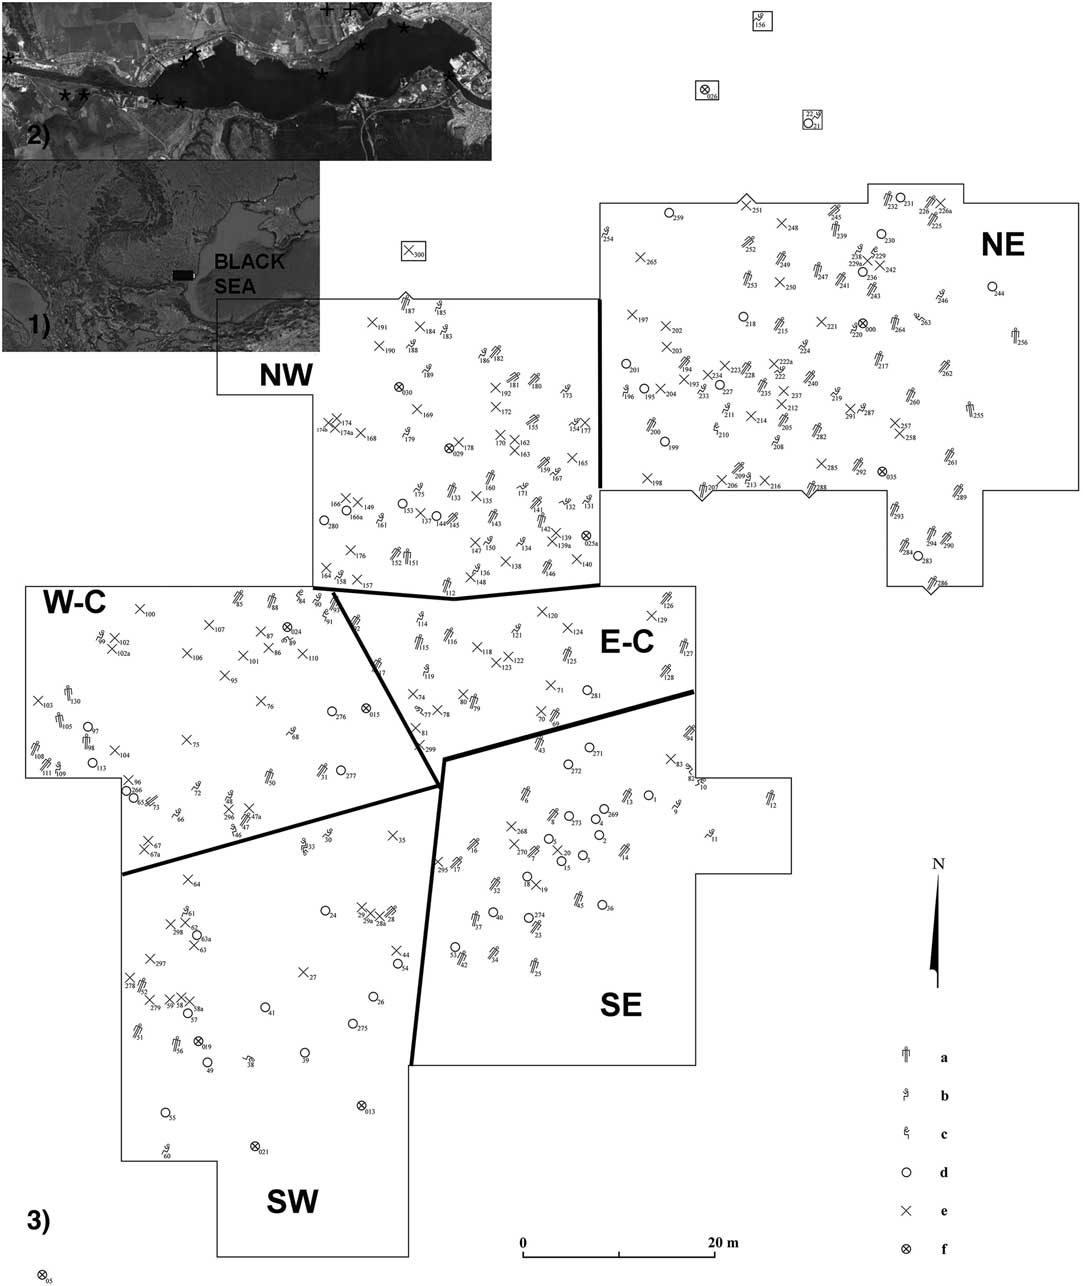
The Varna I cemetery was discovered by accident in 1972 in the Bulgarian Black Sea coastal city of the same name. An area of 7500 m2 yielded 315 graves (Figure 1) dating to the Eneolithic (Copper Age) period. What marked the site as truly significant was the large accumulation of gold objects recovered. Over 3000 objects of a wide range of design and weighing more than 6 kg were excavated. The excavator of the site, Ivan Ivanov, claimed the material dated to the second half of 5th millennium cal BC, and was therefore the earliest evidence for goldwork in the world (Ivanov Reference Ivanov and Avramova1988; Ivanov and Avramova 2000). In addition to the goldwork, the grave goods included more than 160 copper objects, more than 230 flint artifacts, about 90 stone objects, around 1000 beads made of different minerals, some vessels and figurines made of marble, more than 100 implements of bone and antler, and more than 700 clay products, as well as over 12,000 Dentalium shells and about 1100 imported Spondylus shell ornaments (bracelets, necklaces, and appliques). Amongst the burials were 49 graves with no human remains. Three of these so-called “cenotaph” graves contained clay heads with gold objects placed strategically on the location of eyes, mouth, nose, and ears (Slavchev et al. Reference Slavchev2016). Although the specific social structure underpinning the Varna I cemetery is disputed, from early state formation to chiefdom to non-hierarchical site (Renfrew Reference Raczky and Siklósi1978; Todorova Reference Todorova1978; Raduncheva Reference Raduntcheva1989; Chapman Reference Chapman1991; Whittle Reference Whittle1996; Bailey Reference Bailey2000; Chapman et al. Reference Childe2007; Kienlin Reference Krauß, Schmid, Ciobotaru and Slavchev2010), there can be little doubt of the hierarchical nature of the social relations that resulted in such a massive accumulation of exotic prestige objects (Slavchev Reference Slavchev2010; Chapman and Gaydarska Reference Chapman, Higham, Slavchev, Gaydarska and Honch2014).
1) Location of the Black Sea and the Varna site. 2) Location of the Varna site (V) and other sites in the vicinity of the Varna lakes: star symbols denote submerged sites under the waters of the Varna-Beloslav Lakes; cross symbols denote dryland sites. 3) Location of graves dated at the site of Varna, showing cemetery areas and types of grave. Key: a—extended inhumation; b—crouched inhumation on right; c—crouched inhumation on left; d—cenotaph; e—partly disarticulated skeleton; f—damaged or destroyed grave.

Bones for accelerator mass spectrometry (AMS) dating were collected in late 2003 and again in mid-2004 from the Institute of Experimental Morphology, Pathology and Anthropology with Museum, Sofia. The first group of 14 AMS dates was published by Higham et al. (Reference Higham, Chapman, Slavchev, Gaydarska, Honch, Yordanov and Dimitrova2007) and Chapman et al. (Reference Childe2007). Since the sample comprised a fraction of the human burials from the cemetery, a further 57 have now been dated, with one additional sample from the typologically earlier, Middle Copper Age Varna II cemetery (Ivanov Reference Ivanov1978). The radiocarbon (14C) dates reported here constitute the complete run of AMS dates for the Varna I cemetery dating project.
One of the areas of uncertainty that has remained from the initial 2007 study, however, was the potential for carbon derived from the marine reservoir to be incorporated in the bone collagen of the human bone from the cemetery. An offset, systematic or otherwise, in the dated corpus might be a source of uncertainty in the overall chronometric analysis. For this reason, we have explored the possibility that some of the previous results, and those we have newly obtained, might be offset to their true age, in addition to generating a large new dataset of AMS determinations. This is one of the areas we tackle below.
MATERIALS AND METHODS
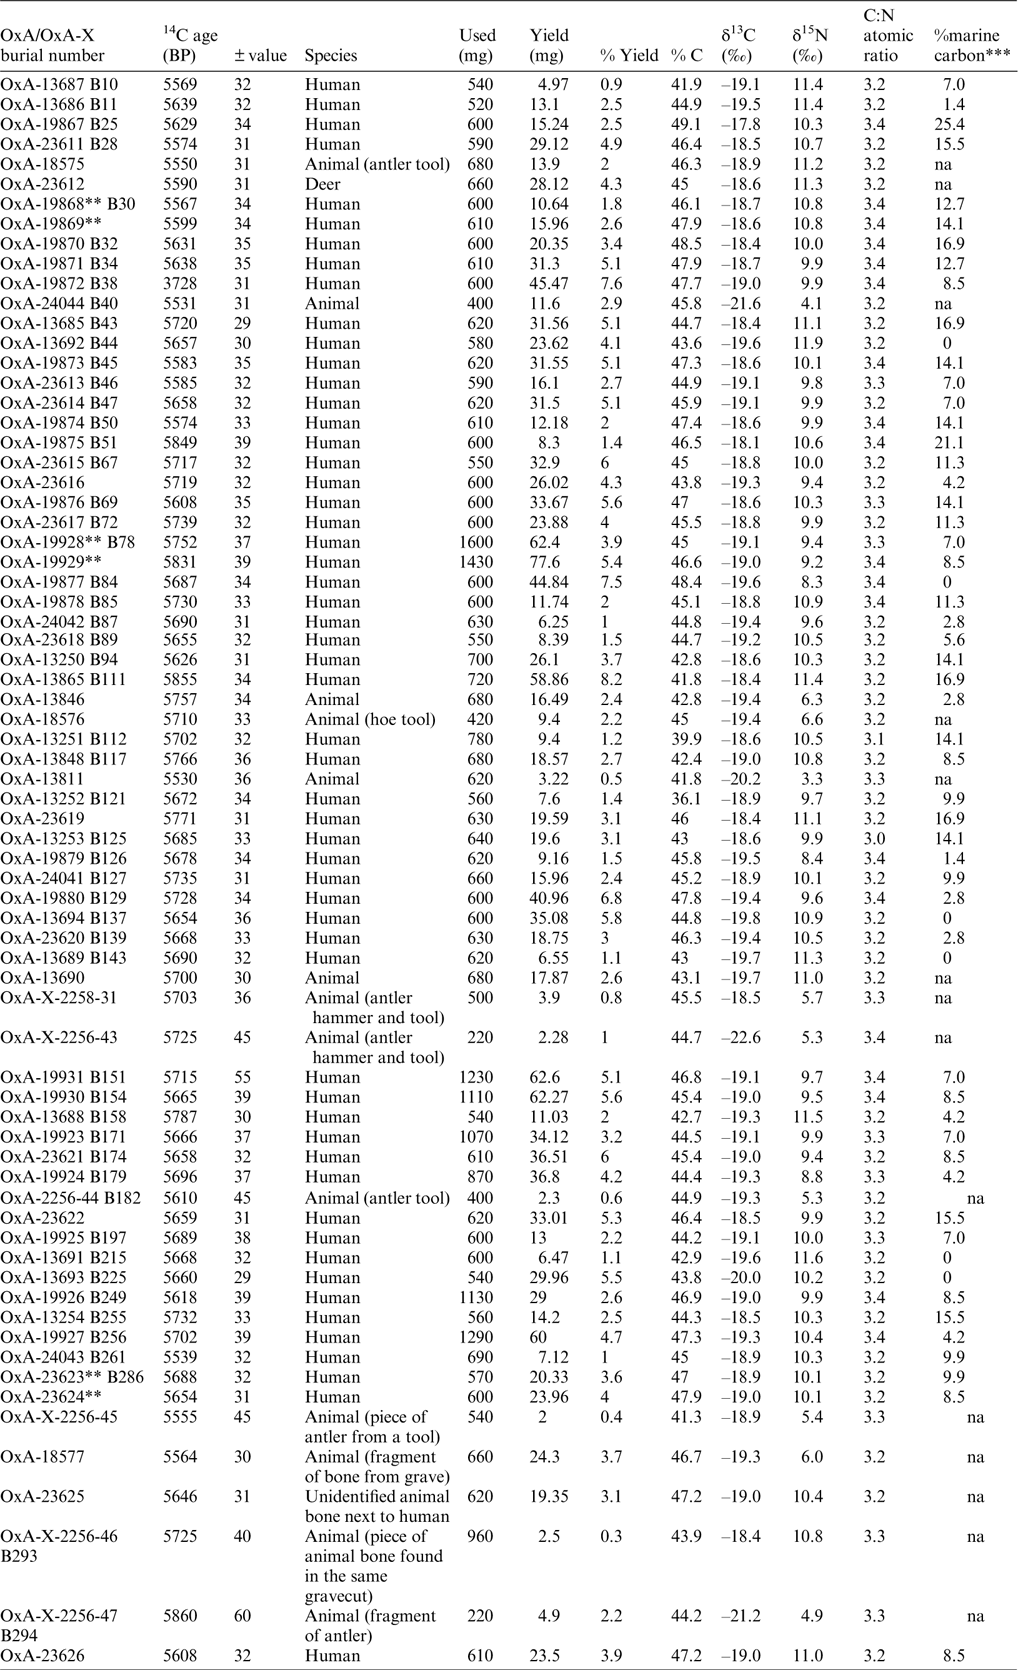
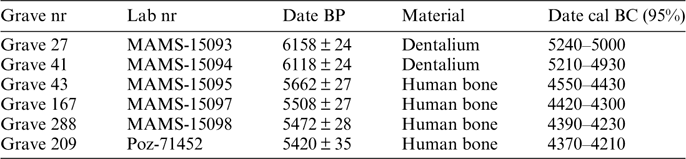
AMS radiocarbon dating was undertaken at the Oxford Radiocarbon Accelerator Unit (ORAU), University of Oxford. Methods applied are those outlined by Brock et al. (Reference Brock, Higham, Ditchfield and Bronk Ramsey2010). The data obtained is shown in Table 1 and includes the previous dates obtained by Higham et al. (Reference Higham, Chapman, Slavchev, Gaydarska, Honch, Yordanov and Dimitrova2007) and Chapman et al. (Reference Childe2007). Since the final preparations for this article, a further six AMS dates have been published for six graves (Table 2) (Krauß et al. Reference O’Shea2016: 284–6, Taf. 2). It is acknowledged that the two dates based on Dentalium require a large marine reservoir correction given that they probably derive from the Mediterranean Sea. The remaining four dates fall at the extreme range of the overall duration of the Varna I dates discussed here—both early and late, but would fit in the overall timespan of the cemetery proposed here.
Radiocarbon AMS dates and associated analytical data from the Varna site. All dates are listed by their burial number, with multiple determinations from the same human or animal bone in the same grave shown grouped together.Footnote *

* 14C age BP is the conventional radiocarbon age, expressed in years BP with BP being before 1950 AD. Stable isotope ratios are expressed in ‰ relative to VPDB and AIR with a mass spectrometric precision of±0.2‰ for C and±0.3‰ for N. Yield represents the weight of ultrafiltered collagen in milligrams. %Yld is the percent yield of extracted collagen as a function of the starting weight of the bone analyzed (“Used” also in mg). %C is the carbon present in the combusted gelatin. CN is the atomic ratio of carbon to nitrogen and is acceptable if it ranges between 2.9–3.5 (DeNiro Reference Gaydarska1985; Brock et al. Reference Brock, Higham, Ditchfield and Bronk Ramsey2010).
** Denotes duplicate measurements on the same bone.
*** The %marine carbon is the value used in model 4 to calculate reservoir carbon uptake, based on two δ13C end points; terrestrial and marine. Uncertainty is±10% (see text for details). na in this column denotes not applicable, no data.
AMS dates for the Varna I cemetery, commissioned by the Tübingen team outside the current dating program (source: Krauß et al. Reference O’Shea2016). There are no δ13C values reported in the source for these data.

Honch et al. (Reference Honch, Higham, Chapman, Gaydarska and Hedges2006) and Higham et al. (Reference Higham, Chapman, Slavchev, Gaydarska, Honch, Yordanov and Dimitrova2007) have suggested previously that there might be a small marine reservoir effect derived from the Black Sea operating amongst some of the humans buried at Varna. Quantifying and assessing the effect of a small potential 14C reservoir influence is not a simple procedure. One reason for this is that it is difficult to determine whether the carbon being fixed into bone collagen is via a pathway in which carbon is directly routed from the protein component of the diet, or whether it originates via a more mixed dietary pathway (the so-called scrambling model) incorporating carbon from other dietary macronutrients such as lipids and carbohydrates into the bone collagen. The idea that carbon and nitrogen isotopes respond linearly to one aspect of diet might be more complicated than has been previously assumed (e.g. Craig et al. Reference DeNiro2013). Recent work on the dating of known age samples of bone (from Herculaneum) by Craig et al. (Reference DeNiro2013), however, has at least shown that the δ13C values of bone collagen appear to predict the marine carbon component in collagen in a near linear manner, and therefore suggest that this method of correcting reservoir-affected samples might not be grossly wrong. This is one instance, and it is possible that other cases are not so straightforward.
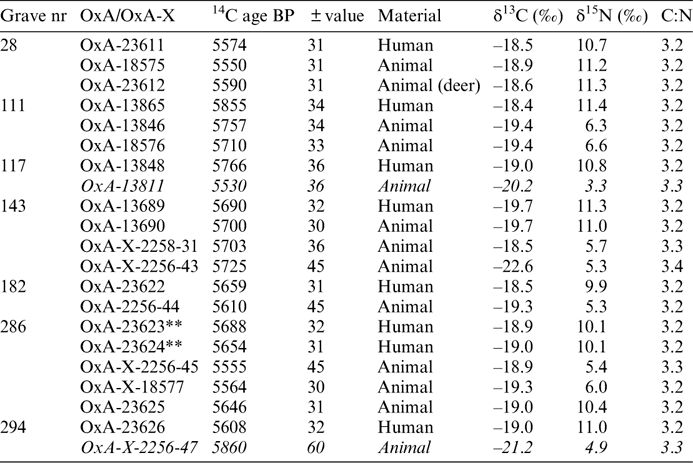
We examined the possibility of a reservoir effect initially by dating paired samples of human and animal bone excavated from the same graves (Table 3). Implicit within this analysis are the assumptions that (1) the AMS determinations are accurate, (2) the association between the dated materials is reliably known, and (3) there is no heirlooming of the animal bone artifacts interred in the graves that could offset their age from that of the human bone artificially. If these assumptions are upheld, then the differences between the AMS dates are likely a function of the uptake of reservoir-depleted carbon into humans, probably from the Black Sea, thus making the human dates older than in reality. There is also the possibility that some dietary protein might derive from the local riverine/aquatic environment; the latest studies of the Varna Lakes show their existence throughout the Holocene period (Vergiev et al. Reference Vladár2014).
Radiocarbon dates of paired human and animal bones from the Varna cemetery site.Footnote *

* Higham et al. (Reference Honch, Higham, Chapman, Gaydarska and Hedges2007) suggested that the date of the animal bone from grave 117 was potentially affected by low collagen yields and could be problematic. For this reason it is excluded from later analysis. Grave 28 contains stable isotopes from animal bones, which include a bone ascribed to “deer,” that are quite similar to the human values. This might indicate a possible problem of misidentification, therefore it might be wise to be cautious over reading too much into this paired series of results. Unfortunately, we do not have a wide dataset of animal stable isotope values from the Varna site, but even so values for deer ought to be substantially different to the values recorded here. In Grave 286, one of the animal bones yielded a δ15N value of 10.4‰, which is very similar to the human values. Although we cannot exclude the possibility that this might be a carnivore bone, rather than an ungulate bone, it seems suspicious that the values for both isotopes mirror the human values. We leave the determination OxA-23625 out of the later analysis for this reason. Burial 294 contains a case in which the animal bone is significantly older than the human bone with which it is associated. This may be an example of miss-association, with the animal bone being residual. There is an alternative and more likely possibility, however, this sample had a very low target current when being AMS dated, less than a third of the usual expected. The standard error is much larger and the accuracy of the measurement is potentially likely to be affected. For this reason we exclude the determinations from Burial 294 in the analyses shown in Figure 2.
** Denotes repeat measurements on the same bone.
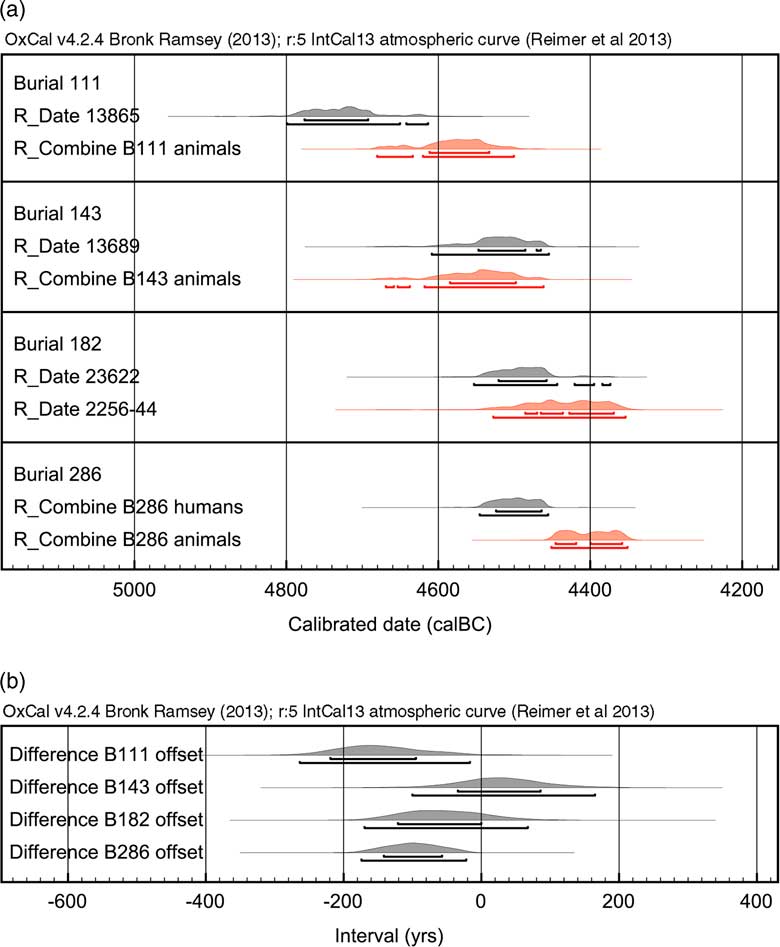
The stable isotope results shown in Table 3 suggest that some of the animal bones sampled are more likely to be human. OxA-18575 and 23612, for example, from Grave 28, disclosed high δ15N values, which reflect a probable human dietary signal. OxA-13690 falls into the same category; the isotope results here mirror those obtained for OxA-13689, the human bone from the same grave cut. OxA-23625 is similar. Because we could not be sure of the identification for these samples we left them out of the reservoir analysis below. For each case in which we had more than a single date from an animal or human in the same grave we calculated error-weighted means. In all cases the value for T was less than the value for chi-squared showing that the results are statistically identical. The paired animal/human calibrated results are shown in Figure 2a. We plotted the differences between the animal and human distributions using the Difference command in OxCal 4.3 and these are shown in Figure 2b. The results show that 2 of the 4 values overlap with 0, which means that they have no significant offset at 95% probability. However, two of the other pairs do not overlap, with offset values ranging from −263 to −16 years (95.4% prob.) and −174 to −22 years. This suggests there is a potential reservoir effect for the human bone samples of these pairs.
(a) Reservoir offsets plotted for paired human and animal bone AMS dates from the same grave contexts; see text for details. (b) Shows the Difference obtained between the human and animal data. The zero line denotes no offset. The results show that there are 2 pairs that show no statistical offset and 2 that do. The burial 286 offset does not contain OxA-23625, which we suspect strongly to be human on the basis of its stable isotopes (see text).

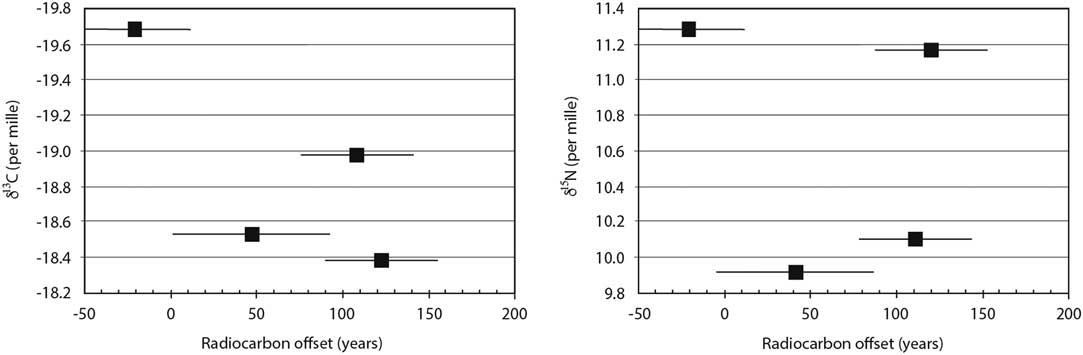
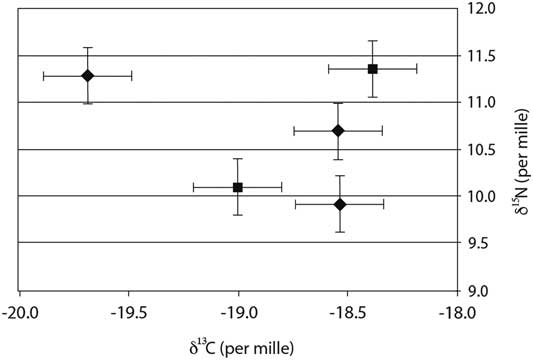
When the offset values are plotted against carbon stable isotope measurements, the offsets show an R2 value of 0.58 (Figure 3). Despite the small number of data points, the results from this and the paired analysis support an indication that some of the human bones enriched in δ13C may well be affected by reservoir carbon. Elevated δ15N values are often associated with 14C reservoir offsets, since there are more trophic levels in complex foodwebs in the freshwater and marine biomes. When we plotted 14C age offsets against δ15N, there was a poor correlation (Figure 3), but, again, paired data are few in number. Taken together, offsets do not appear to be consistent in terms of paired stable isotopes (Figure 4).
(Left) Offsets in paired radiocarbon determinations plotted against δ13C values (errors are not plotted but are±0.2‰). (Right) Offsets in paired 14C determinations plotted against δ15N values. Errors on the δ15N values are not plotted on the figure but are±0.3‰.

δ13C values plotted against δ15N values. Error bars are included in the figure (±0.3‰ for N and±0.2‰ for C). Square values denote high reservoir offsets, diamond values denote none.

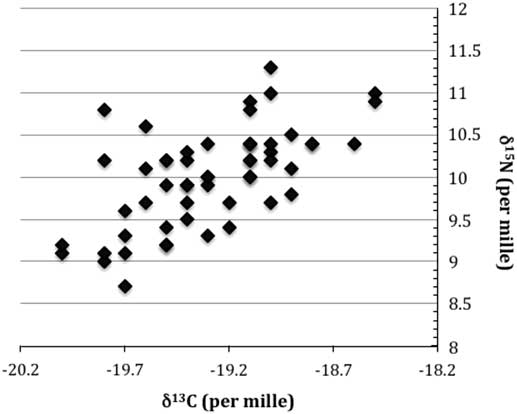
Previous work on human palaeodiet at the Varna cemetery has been undertaken by Honch et al. (Reference Honch, Higham, Chapman, Gaydarska and Hedges2006). This consisted of carbon and nitrogen isotope analysis, without paired 14C dating. The isotope data from Honch et al.’s (Reference Honch, Higham, Chapman, Gaydarska and Hedges2006) work is shown in Figure 5. They suggested that the isotope values for the humans reflected dietary protein sources that ranged from terrestrial C3 proteins to those that included a proportion of marine foods. Human δ15N values greater than 11‰ and those greater than 1σ away from the mean of the δ13C values (–19.3±0.3‰) were considered liable to be potentially affected by reservoir carbon (Honch et al. Reference Honch, Higham, Chapman, Gaydarska and Hedges2006:1499).
Stable isotope values for C and N from previously analyzed human bones at the Varna cemetery (after Honch et al. Reference Honch, Higham, Chapman, Gaydarska and Hedges2006). Errors are not shown but are±0.2‰ for C and±0.3‰ for N.

Modeling the AMS Dates
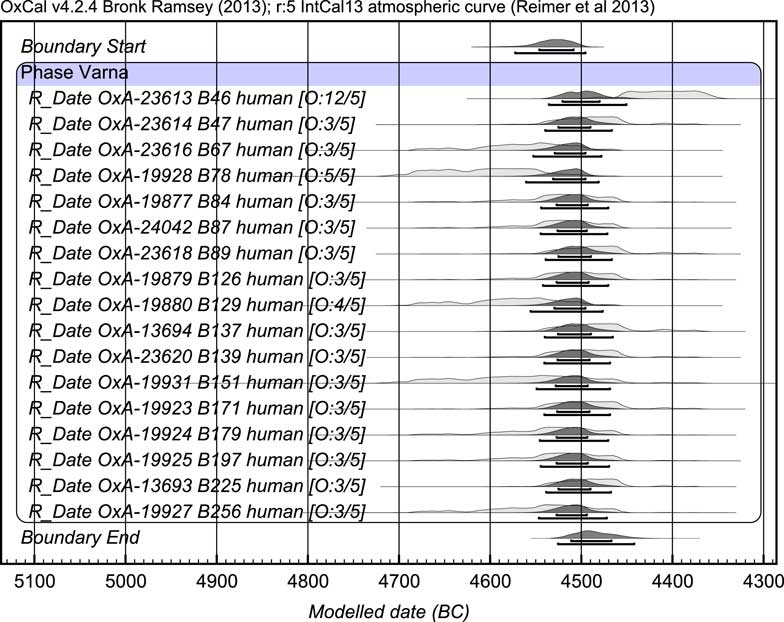
We tested different Bayesian calibration models to explore the effect on the chronology of the site when different groups of samples are analyzed in order to consider the effect of uptake of carbon via the marine reservoir effect. We focused initially on human bone determinations which were less enriched than –19.0‰ in δ13C and less than 11‰ in δ15N. These we consider less likely to exhibit reservoir offsets based on the work of Honch et al. (Reference Honch, Higham, Chapman, Gaydarska and Hedges2006:1499). All determinations were placed into a single Phase model in OxCal 4.3 (Bronk Ramsey Reference Bronk Ramsey2009a). We used the General outlier model to consider whether there were any results that were outlying. We used an outlier probability of 0.05, that being the value typical for providing a 1 in 20 chance that the measurement needs shifting in some way (Bronk Ramsey Reference Bronk Ramsey2009b). We term this Model 1. The results are shown in Figure 6. The model yields a start boundary of 4576–4495 cal BCFootnote 1 and an end boundary of 4527–4442 cal BC, with an overall interval of time representing 0–121 years (95.4% prob.). (In the Supplementary Material we provide all CQL code for the various models run in this paper.)
Plot of Bayesian model 1 containing human bone determinations with δ13C values >–19.0‰ and δ15N values <11.0‰. This is model 1 in the text. Modeled date (BC) on the x-axis refers to age ranges in cal BC.

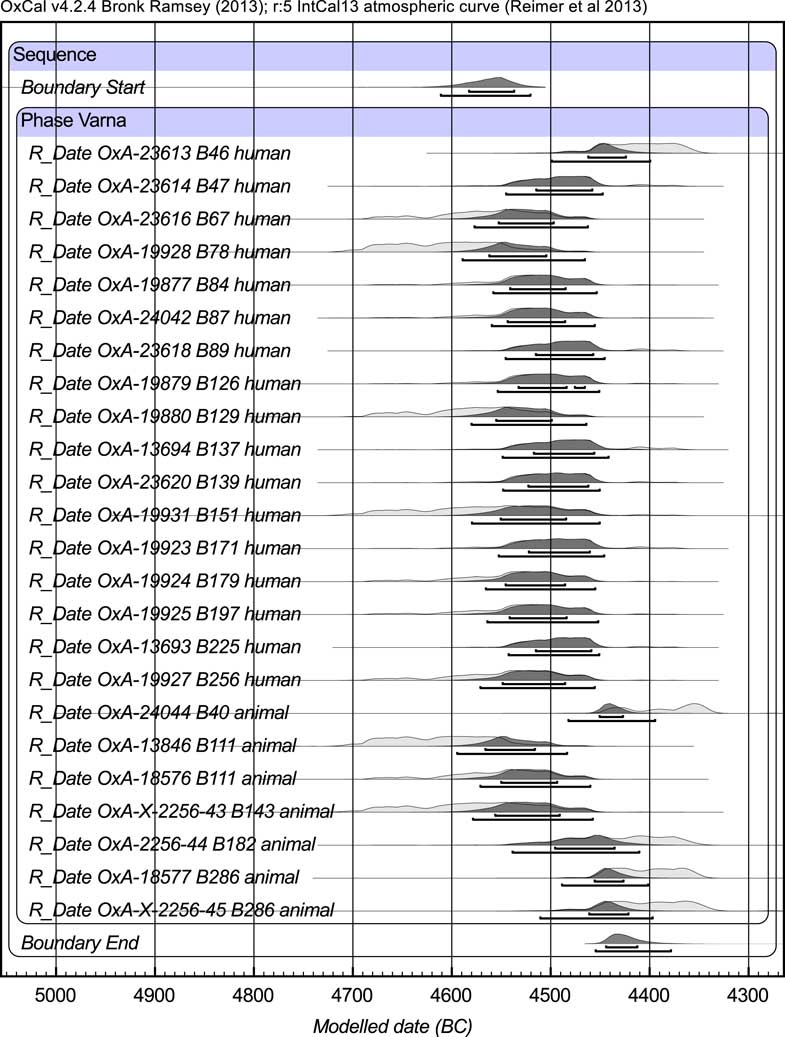
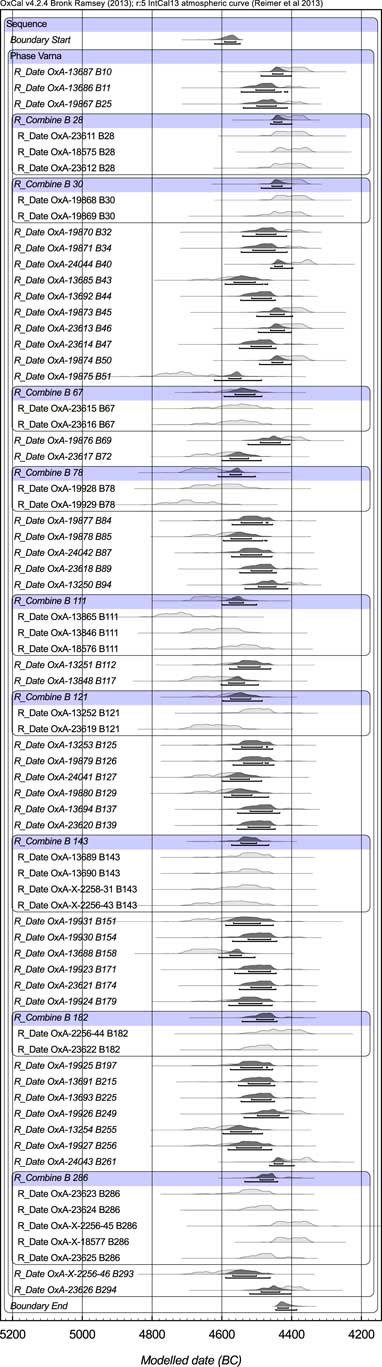
In Model 2, we added to the Model 1 human determinations AMS dates of animal bones that we can be fairly sure have no reservoir effectFootnote 2 . We did not combine or mean animal and human bones from the same grave cut in this model. As expected, with additional AMS measurements the results show a wider range, with the boundaries become older and younger respectively, and with some animal determinations clearly in the younger end of the group (Figure 7). The boundaries show the start of cemetery use dating to 4619–4469 cal BC, and the end at 4476–4377 cal BC, with a wider overall span of 83–227 years. In Model 3, all of the results were included (again with the exception of the problematic samples above) (Figure 8). In cases where we had multiple dates or duplicates from the same grave, we used OxCal’s R_Combine method prior to calibration. For this model, the results show a start boundary at 4621–4547 cal BC, an end at 4446–4386 cal BC, with an interval covering 129–278 years, in other words broadly similar to the data produced by Model 2. This suggests that there is not a significant overall offset or shift in the data due to variable reservoir effects, otherwise the inclusion of the remaining human bone dates would probably see older boundary ranges.
Bayesian model showing calibrated radiocarbon determinations of animal bones and humans, the latter restricted to those determinations with δ13C values <–19.0‰ and δ15N values less than 11‰. This is model 2 in the text. Modeled date (BC) on the x-axis refers to age ranges in cal BC.

Bayesian model showing determinations of animal bones and all human bones. Determinations from the same grave or with replicate measurements have been combined using the R_Combine function in OxCal. This is Model 3 in the text. Modeled date (BC) on the x-axis refers to age ranges in cal BC.

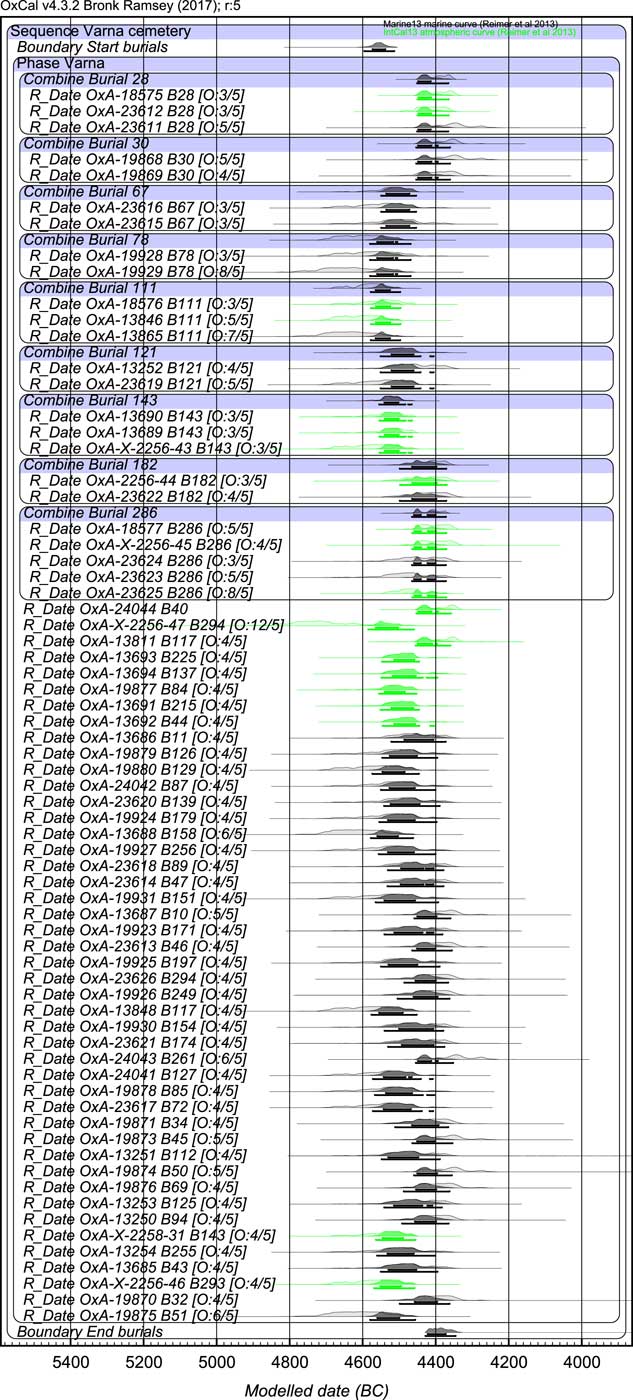
Finally, we tested a fourth model (Model 4), in which we included a correction for some determinations based on their carbon stable isotope values. We used the method of Arneborg et al. (Reference Arneborg, Heinemeier, Lynnerup, Nielsen, Rud and Sveinbjörnsdóttir1999) to linearly interpolate values between a 100% terrestrial diet (–19.6‰) and a 100% marine diet (–12.5‰) to estimate likely proportions of marine protein for each dated skeleton at the site. The terrestrial estimate was derived from measured δ13C values for Bos sp. and Ovis sp. outlined in Honch et al. (Reference Honch, Higham, Chapman, Gaydarska and Hedges2006) dating to the Eneolithic from Bulgaria (n=9). In the age model we used a ΔR value of 50±65 (from calib.org; Reimer and Reimer Reference Reingruber2001) and the Mixed Curves approach in OxCal 4.3, with the mixing estimate based on the interpolation value calculated and an uncertainty on each value of 10% (after Arneborg et al. Reference Arneborg, Heinemeier, Lynnerup, Nielsen, Rud and Sveinbjörnsdóttir1999). If any of the human bone δ13C values were less enriched than the terrestrial value we did not make any correction. The results for Model 4 are shown in Figure 9. The values for the start and end boundary of this model were 4590–4516 cal BC and 4427–4341 cal BC respectively (95.4%), so very marginally shifted to the younger end compared with the other models, as expected. We consider this to be the most reliable model of the group thus far tested in terms of the start PDF estimate since it takes into account the potentially reservoir-affected human bone samples.
Bayesian model showing determinations of animal bones and all human bones, some of which have been corrected to account for estimated marine carbon uptake using a linear interpolation model and the Mixed Curves approach in OxCal 4.3. Determinations from the same grave or with replicate measurements have been combined using the Combine function in OxCal. This is model 4 in the text. Combine was used instead of R_Combine in this model because the latter is inappropriate for this type of mixed curve model (R_Combine combines the data first and then calibrates against a common curve rather than a mixed curve). Modeled date (BC) on the x-axis refers to age ranges in cal BC.

Overall Duration of the Cemetery
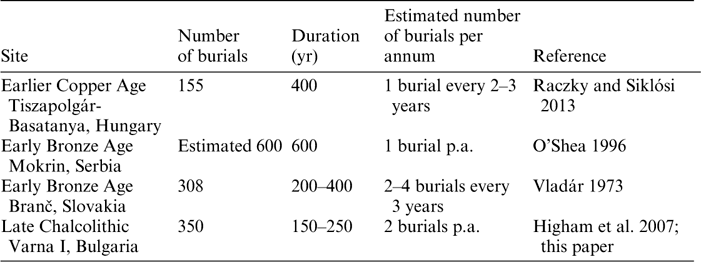
The set of new AMS dates we analyzed comprises 53 of the 315 graves, or about 17% of the totalFootnote 3 . This provides a representative basis for the overall chronology of the cemetery although we cannot be certain that there are earlier or later burials if these are undated. This is for future researchers to test. Model 4 provides an overall span of activity at the cemetery of 120–264 years (at 93.6% with a modal value of 150 years). Considering the number of graves, which may well have exceeded 350Footnote 4 , this may well have been a short timespan of use, with around two burials per year on average, much higher than most other prehistoric cemeteries (Table 4), although the chronologies from these sites are not hugely refined or precise compared with Varna. While the concentrated sequence of burials at Varna limits the time-depth of the ancestral presence to perhaps six generations, the frequency of burial acts would have enhanced the abilities of the communities to compare and contrast the quantities of grave goods buried with the newly interred dead, as well as deepening the personal, emotional and kinship links between mourners at successive funerals.
Estimated frequency of burials per annum, prehistoric cemeteries in Central and South-East Europe

Internal Chronology of the Six Cemetery Zones and the Spread of the Cemetery
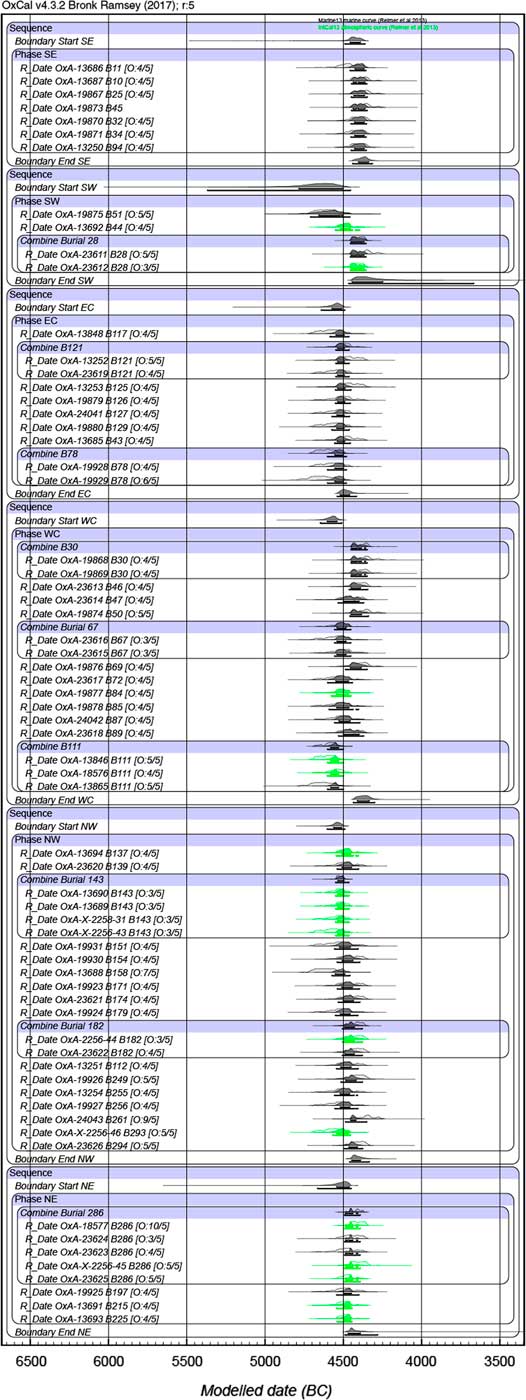
We have divided the territory of the cemetery into six equal zones (Figure 1). There is a variable number of AMS-dated graves in each of them, with comparable, high numbers of graves in three zones (n=10–11 graves in the North-East, North-West and West-Central zones) and rather fewer AMS-dated graves in the remaining three zones (4 graves in the South-West zone, 7 graves in the South-East zone and 8 graves in the East-Central zones). However, the lack of human bones in the concentration of well-furnished cenotaph graves in the Southern zones—especially the South-West zone—means that AMS dates are lacking for some of the “richest” graves in the entire cemetery; in general, there were museological and heritage objections to drilling even small samples from bone figurines. Nonetheless, the wide distribution of AMS-dated graves provides a reasonable basis for modeling the spatio-temporal spread of graves at Varna.
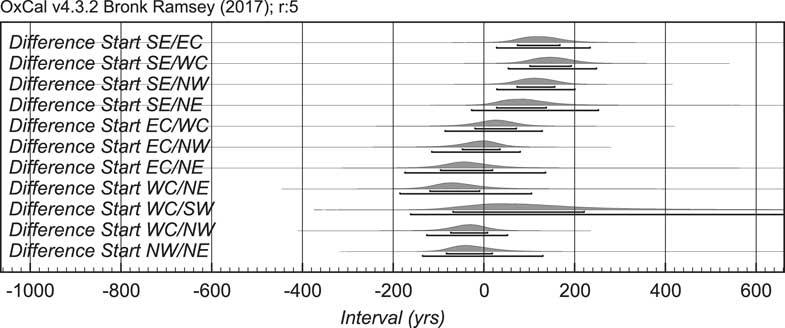
We analyzed the start and end boundaries of the different burial zones of the Varna site. We used the determinations corrected and modeled above in Model 4. The results are shown in Figure 10. Each burial zone was treated as a single phase and we used a General outlier model to explore whether there were any determinations at odds with the prior framework. We then tested the significance of the boundaries by measuring the differences between the start boundaries of the main burial zones identified at the site using OxCal’s Difference command. The results are shown in Figure 11. In the main, the data show no significant difference between the parameters, because the distributions overlap with 0. However, some are significant. Zones EC, WC, and NW, for instance, all begin earlier than area SE (see Figure 12). This suggests perhaps that several communities may have been burying clusters of burials in different areas of the cemetery from an early stage of its use rather than a single community burying their members in widely dispersed parts of the mortuary space. If this is true, their links to a widespread social network of communities would have required the negotiation of identities both within their own communities and between groups with recently developed exchange relations. The very establishment of a focal cemetery for this widespread network could have led to a strong development of place-value at Varna I, in turn strengthening the network as an emergent and significant socio-political force.
Summary of the analysis of different areas of the Varna site that received graves during the use of the cemetery.

Difference analysis between the boundary events shown in Figure 12 above. To be significant the PDFs being compared must not overlap with 0 at 95% probability. The results show that the vast majority of the PDFs overlap with 0 and therefore the comparisons between the two parameters (e.g. Start EC/Start WC) are not significant.

Summary of boundary events from Figure 11.

Internal Chronology of Graves of Different Grave Good Characteristics
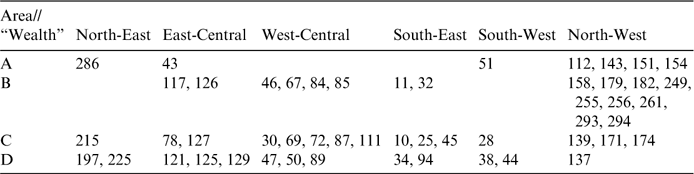
The consideration of the quantity of grave goods in human and animal bones selected for AMS dating led to a search for a balanced range of samples from each of four classes of grave good wealth as graded by the number of categories of grave goods in each grave: A=7 or more categories; B=4–6 grave good categories; C=2–3 grave goods categories; and D=no grave goods or 1 category. A total of seven Rank A graves were dated, with 17 graves of Rank B, 15 of Rank C, and 13 of Rank D (Table 5). Thus, while there is a bias toward graves with lower varieties of grave good categories, each grave class has at least seven samples and this gives some grounds for the selection of a representative sample for the establishment of a internal chronology for graves of different “wealth.”
Dated graves by cemetery area and grave-good “wealth” category.

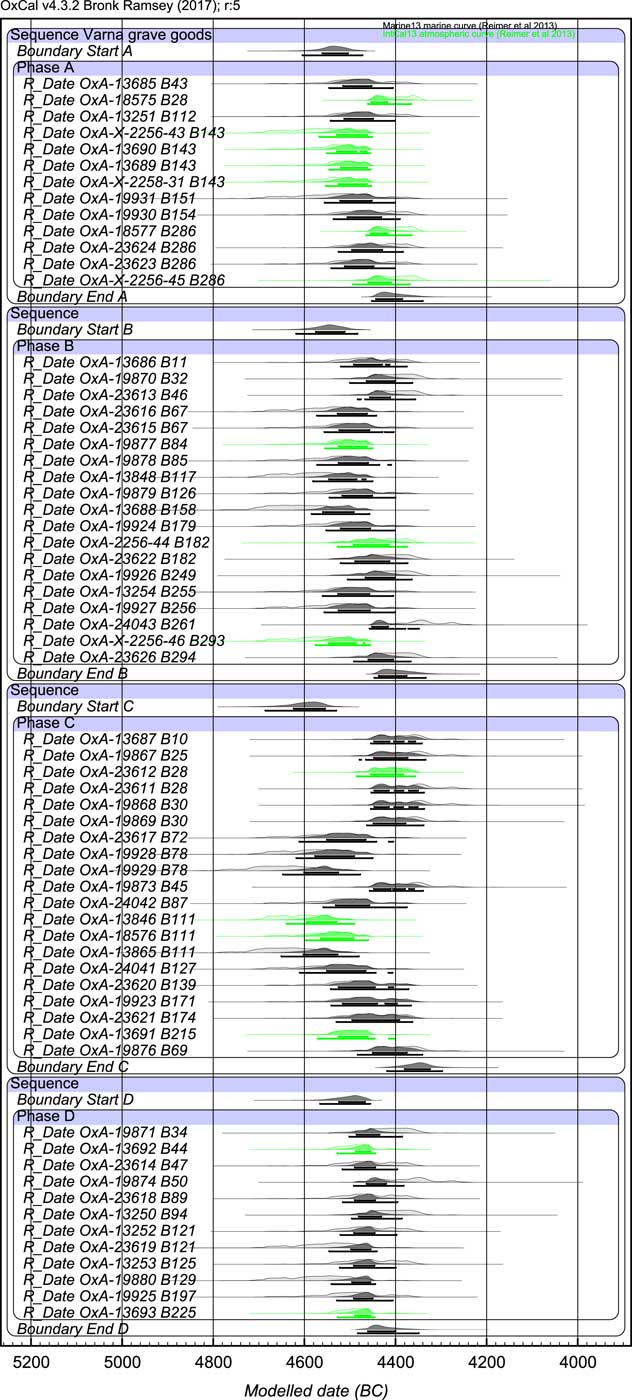
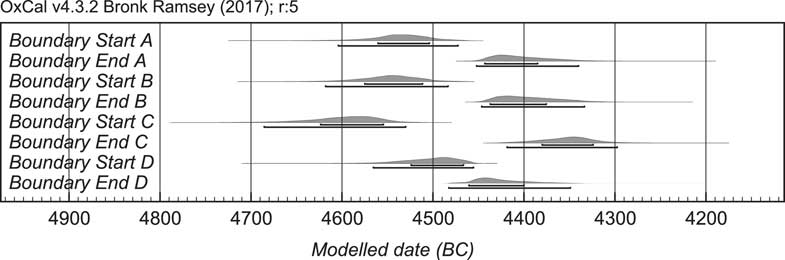
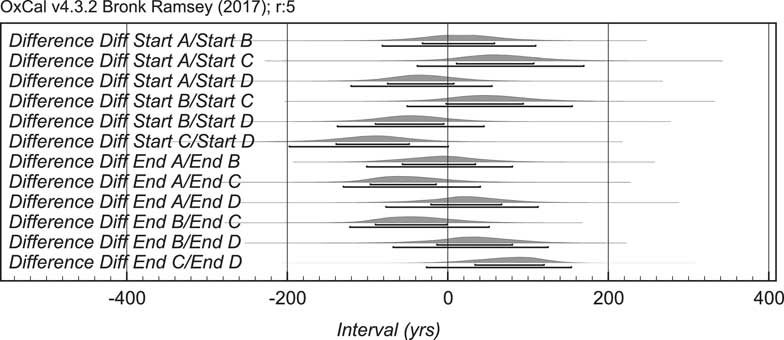
A further issue clarified by the new AMS dates concerned whether or not there was any significant difference between the age of the dated burials that contained few grave goods, and those that contained more significant mortuary offerings. One way to investigate these hypotheses is to model graves from the four grave good rankings separately, irrespective of the spatial distribution of graves of different “wealth.” Again, we placed the different grave good groups into a uniform boundaried Phase in OxCal. The result of this analysis is shown in Figure 13 (see Figure 14 for the boundaries obtained from each phase). We analyzed the significance of the differences between the boundaries using the Difference command in OxCal (Figure 15) (see Supplementary Material for model code). The results show no statistical difference between the start and end boundaries of any of the groups analyzed (Figure 15). We conclude that there is no statistical significance in the presence of grave goods at the site by age. This result contradicts the preliminary hypothesis of the early dates of Rank A graves based on the earlier set of 14 AMS dates (Chapman et al. Reference Childe2007; Higham et al. Reference Higham, Chapman, Slavchev, Gaydarska, Honch, Yordanov and Dimitrova2007).
Bayesian models for the relative proportions of graves with grave goods (see text for details).

PDF boundaries for the model in Figure 14 with results grouped by Grave Good numbers and type.

Summary of PDF differences between grave goods in groups A–D. Each difference overlaps with 0 at 95% probability, suggesting no significant difference between the measured parameters (the start and end PDFs of different groups). These are from the corrected AMS determinations.

Internal Chronology of Individual Artifact Types within the Cemetery
One aspect of the modeling of the Varna AMS dates that was impossible to explore with the first series was the consideration of date ranges for specific artifact types within the overall cemetery. The vast range of artifact types at Varna meant there were many types of interest for internal phasing. We focused on graves with a minimum of five AMS dates per grave type. This meant that many important types have been excluded from this analysis (e.g., gold appliqués and beads, copper chisels, bone figurines, facetted carnelian beads, jadeite axes, and flint superblades). Nonetheless, it still left a total of 11 specific artifact types for modeling, as well as seven raw material classes or artifact groups.
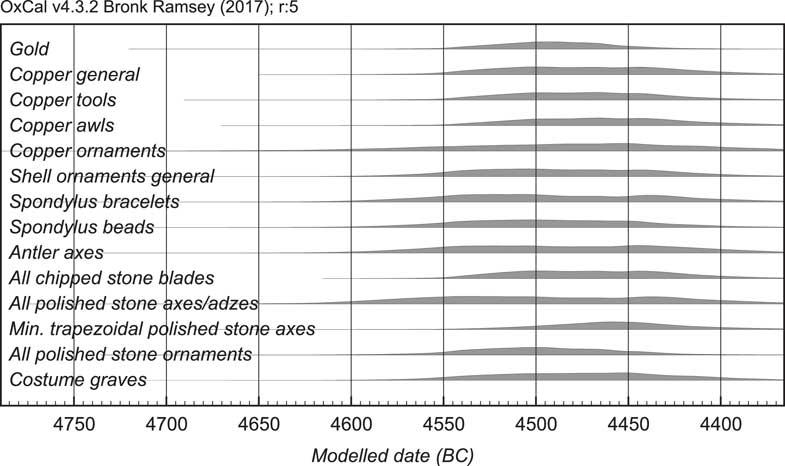
The results indicate a variety of chronological ranges for the artifact types, with a strong overlap in the middle decades of the cemetery. As in the previous example of grave goods, modeling disclosed no differences between any of the various artifact types. For this reason we have presented the results in the form of a Sum distribution to show the range of the various 14C ages corresponding to each group of dated artifact types (Figure 16). Artifact types appearing to start early included all polished stone axes and adzes, Spondylus bracelets and copper ornaments, although there is almost certainly no statistical support for this, it is simply based on the summed probability ranges. Those types continuing longer than others included all polished stone axes and adzes, miniature trapezoidal polished stone axes and possibly antler axes and shell ornaments in general. There are insufficient dated graves containing gold objects to provide any insights into the chronology of the Varna goldwork.
Summed probability distributions generated from calibrated AMS determinations that date artifact types in the various graves of the cemetery. A minimum of 5 dated graves per type was the requirement for inclusion.

Implications for the Bulgarian Copper Age
The new set of dates has broadly confirmed the previous chronological position of the Varna cemetery in the mid-5th millennium BC. This sits in stark contrast with its “relative” position in an overall Copper Age chronological scheme that puts it toward the end of the 5th millennium BC (Boyadziev Reference Boyadzhiev1995). This discrepancy explains the tacit rejection of the first series of dates by almost all Bulgarian prehistorians. The existing series of 14C dates for other Late Copper Age sites (Boyadziev Reference Boyadzhiev1995), however, can be rather negatively critiqued in terms of modern standards on the basis of poor sampling strategy, lack of taphonomic awareness and number of dates per site; however they remain the preferred, if outdated, basis for the absolute chronology for the Bulgarian Copper Age.
Since the publication of the first series of Varna dates almost 10 years ago, new dates have come to light from sites in Bulgaria (Tsirtsoni Reference Vergiev, Filipova-Marinova, Giosan, Pavlov and Slavchev2016) and the neighboring regions (Borić Reference Borić2009; Reingruber Reference Renfrew2015; Tasić et al. Reference Tasić, Marić, Penezić, Filipović, Borojević, Borić, Cook, Reimer, Bayliss, Barclay, Gaydarska and Whittle2015: Reference Tasić, Marić, Bronk Ramsey, Kromer, Barclay, Bayliss, Beavan, Gaydarska and Whittle2016; Schier et al., Reference Schier, Draşovean, Bayliss, Gaydarska and Whittlein prep.; Whittle et al., Reference Whittle, Bayliss, Barclay, Gaydarska, Bánffy, Borić, Draşovean, Jakucs, Marić, Orton, Tasić, Schier and Vander Linden2016). On the one hand, they suggest that there is a case to be made for a revision of the current Late Copper Age absolute chronology (e.g. Durankulak, Smyadovo, Pietrele), and on the other hand they are showcases of how such a revision should be approached (e.g. Vinča-Belo Brdo and Uivar-Gomila).
The data in Table 4 put Varna well within the Late Copper Age but one of the continuing problems is the overall paucity of dates for Middle Copper Age contexts, allowing the squeezing of the Middle Copper Age by the Late Copper Age, for which there are many settlement phases and many 14C dates. The only date from the Varna II cemetery, dating to the Middle Copper Age, lies in the 49th–48th centuries cal BC (OxA-X-2414-52), almost a century earlier than the earliest Varna I date.
What is the Position of the Varna Cemetery in the Bulgarian Copper Age?
An important question concerns the place of the Varna cemetery within the Bulgarian Late Copper Age—at the beginning, throughout, or toward the end. As mentioned above, the favored view among Bulgarian prehistorians would be the third scenario, on the grounds that Varna represents the peak of Balkan Copper Age developments, fairly soon to be followed by the collapse of Eneolithic societies (Todorova Reference Todorova1995). The case is based upon stratigraphy, typological arguments for both pottery and metal, neither strands of which can be confirmed by AMS dating. The opposite view, hardly supported in Bulgaria (cf. Gaydarska Reference Higham, Chapman, Slavchev, Gaydarska, Honch, Yordanov and Dimitrova2011 with Boyadzhiev Reference Boyadzhiev2015) and based upon the Varna I dates, is that Varna I dates earlier in the Late Copper Age sequence. This would support the Childean view of increased complexity at a time of profound social change, followed by a long stabilization phase, mapped onto the cultural rather than the site level (Childe Reference Childe1945). The third possibility is that the Varna cemetery lasted throughout the Late Copper Age. However, the long duration of the Late Copper Age, from 4600 to 4000 BC (Boyadziev Reference Boyadzhiev1995) is far longer than the one or two centuries for the duration of Varna I. When comparing the vast cemetery of Durankulak, some 70 km north of Varna, which covers broadly the whole period from the beginning of the Late Neolithic to the end of Final Eneolithic, we cannot recognize in the Varna cemetery the earliest and the latest phases of the Late Copper Age. Thus, our current thinking places Varna I to the early and middle parts of the Late Copper Age illustrating the complex processes for that period in the North-East Pontic area.
CONCLUSIONS
Once based on gold artifacts and colorful jewelry, the Varna cemetery’s continuing capacity to amaze and astound is nowadays based upon the new results of a wide range of scientific analyses, including AMS dating, petrology, and gemmology. Taking a minor marine reservoir effect into account, the Bayesian modeling of the Varna I dates based on our favored model (4) supports a start date of 4596–4516 cal BC and an end date of 4427–4341 cal BC (95.4% probability). This suggests that the beginning of the Varna cemetery falls into an early part of the Bulgarian Late Copper Age. The AMS dates are currently unable to provide the basis for a fine-grained internal chronology; however we note the Correspondence Analysis by Krauß et al. (Reference O’Shea2016) which will we think form the basis for a set of priors that could be used in future Bayesian models. We cannot presently distinguish a cluster of “richer” graves or a set of “poorer” graves in the early part of the cemetery’s use on the basis of our modeling. However, the AMS dates can distinguish between three areas—the East-Central and West-Central areas and the North-West—in which burials started before those of the South-East area. The AMS dates cannot presently distinguish where the earliest grave clusters were located; however there are some suggestive variations in the chronology of some important artifact types, including copper and shell ornaments, as well as polished stone axes and adzes and also pottery. Most of the pots were badly fired “models” of the real vessels made specially for the funeral. A brief inspection of the Durankulak cemetery, that covered all phases of the Varna culture, demonstrated a lack of some late pottery types found in the Varna cemetery (Todorova Reference Tsirtsoni2002), indicating variable use of pottery in different cemeteries.
There was a variable “Varna” effect on communities in the East Balkans, Eastern Europe, and the Carpathian Basin, which was related to the important role that the Varna Lakes communities played in long-distance exchange networks (Chapman Reference Chapman2013). The dating of an Atlantic-Volga exchange network to the centuries when burials were taking place at Varna underlines the key role that the Varna communities played in Copper Age innovations in the mid-5th millennium BC.
ACKNOWLEDGMENTS
The authors are grateful to the British Academy for funding the travel costs of the sample collection in 2004 through the Anglo-Bulgarian Inter-Academy Agreement; to Noah Honch for help with sample collection and lab analysis; to the Director of Varna Museum, Dr. V. Pletnyov, and the Corresponding Member of the Bulgarian Academy of Sciences, Professor Y. Yordanov, for granting us access to the Varna cemetery human bones. We are also grateful to the NERC Radiocarbon Facility (NERC/AHRC) for funding the radiocarbon work (grants NF/2003/2/10 and NF/2005/2/2), and to the ORAU staff, past and present, for their careful work on the Varna samples over the last few years. C. Bronk Ramsey (Oxford) provided some useful advice on the modeling and we also thank two anonymous reviewers for their comments and insights.
SUPPLEMENTARY MATERIAL
To view supplementary material for this article, please visit https://doi.org/10.1017/RDC.2018.9