Introduction
In the Svalbard archipelago, Norwegian Arctic, ocean currents and meteorological conditions provide a mild climate, despite the high latitude (76–81° N). The glaciers in the area are of various dynamic types, including continuously fast-moving ice streams draining large accumulation areas or ice caps, and surging glaciers in the active or quiescent phase, terminating on land or as tidewater glaciers in the fjords. Thirty-six per cent of the glaciers in Svalbard have surged (Hamilton and Dowdeswell, 1996), but there have been no field measurements of velocities during a surge on Svalbard.
Use has been made of feature tracking on sequential optical satellite images to measure velocities on various ice streams in Antarctica (Scambos and others, 1992; Whillans and Tseng, 1995). Automatic feature tracking can be conducted on Antarctic ice streams because the crevasses and ice conditions are relatively unchanged over a period of up to 10 years (Orheim and Lucchitta, 1987). Crevasses can therefore be identified in a time series of images. In Svalbard the surface reflection from ice is highly variable in both time and space (Winther, 1993). Surface melting in the summer gives large ablation areas at low elevation. Oscillation of the polar front position over the region also gives variable meteorological conditions, and hence variable surface reflectance, in the same month from year to year.
During the active phase of a surge, crevasses are developed and rapidly deformed. Changes in surface reflection, deformation of crevasses and variable satellite recording geometry in steep terrain complicate the conditions for automatic feature tracking.
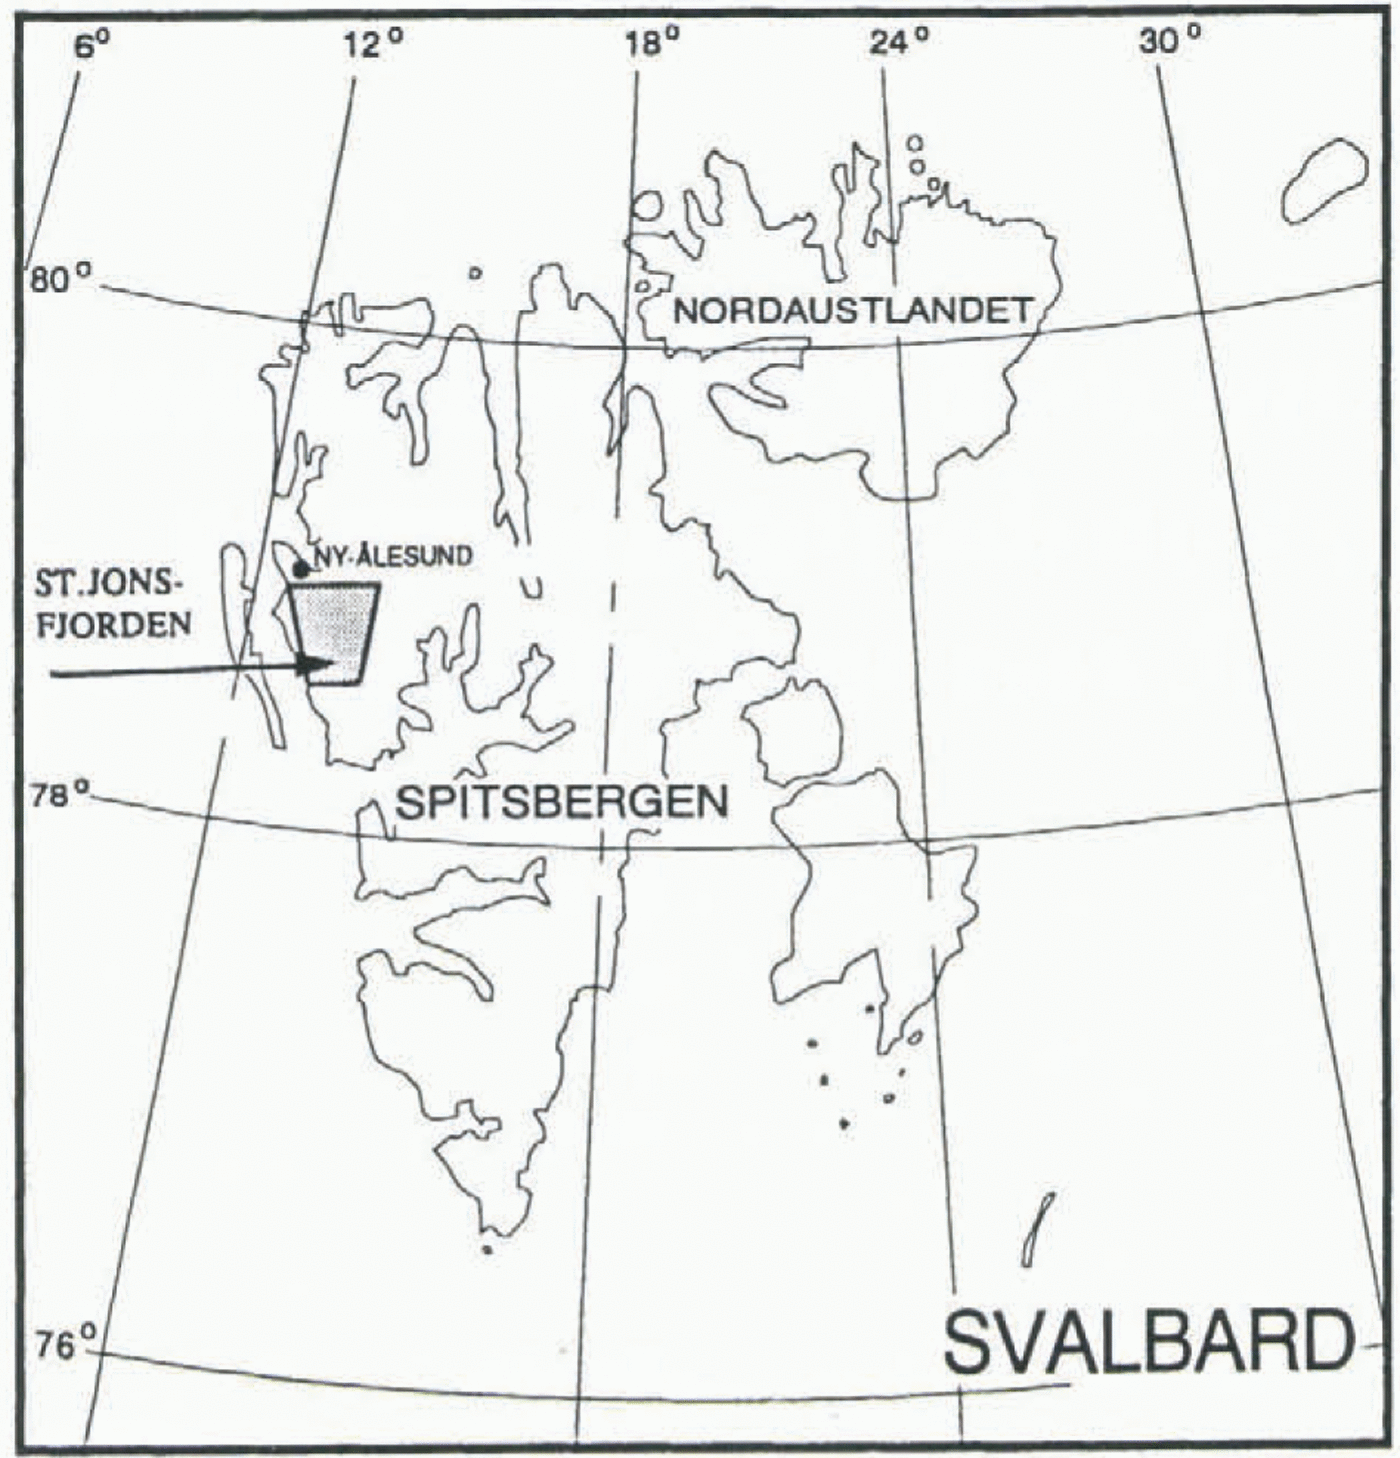
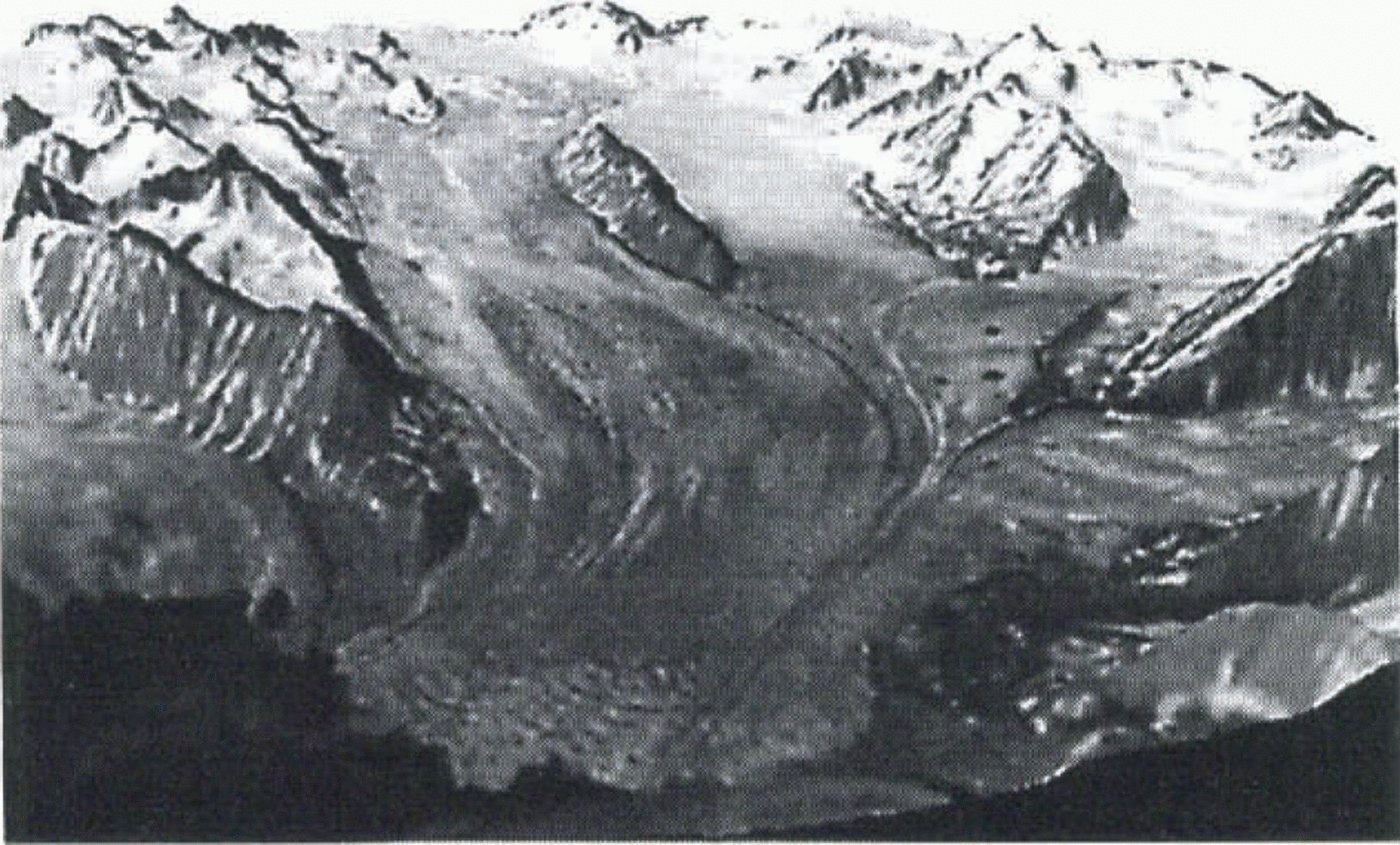
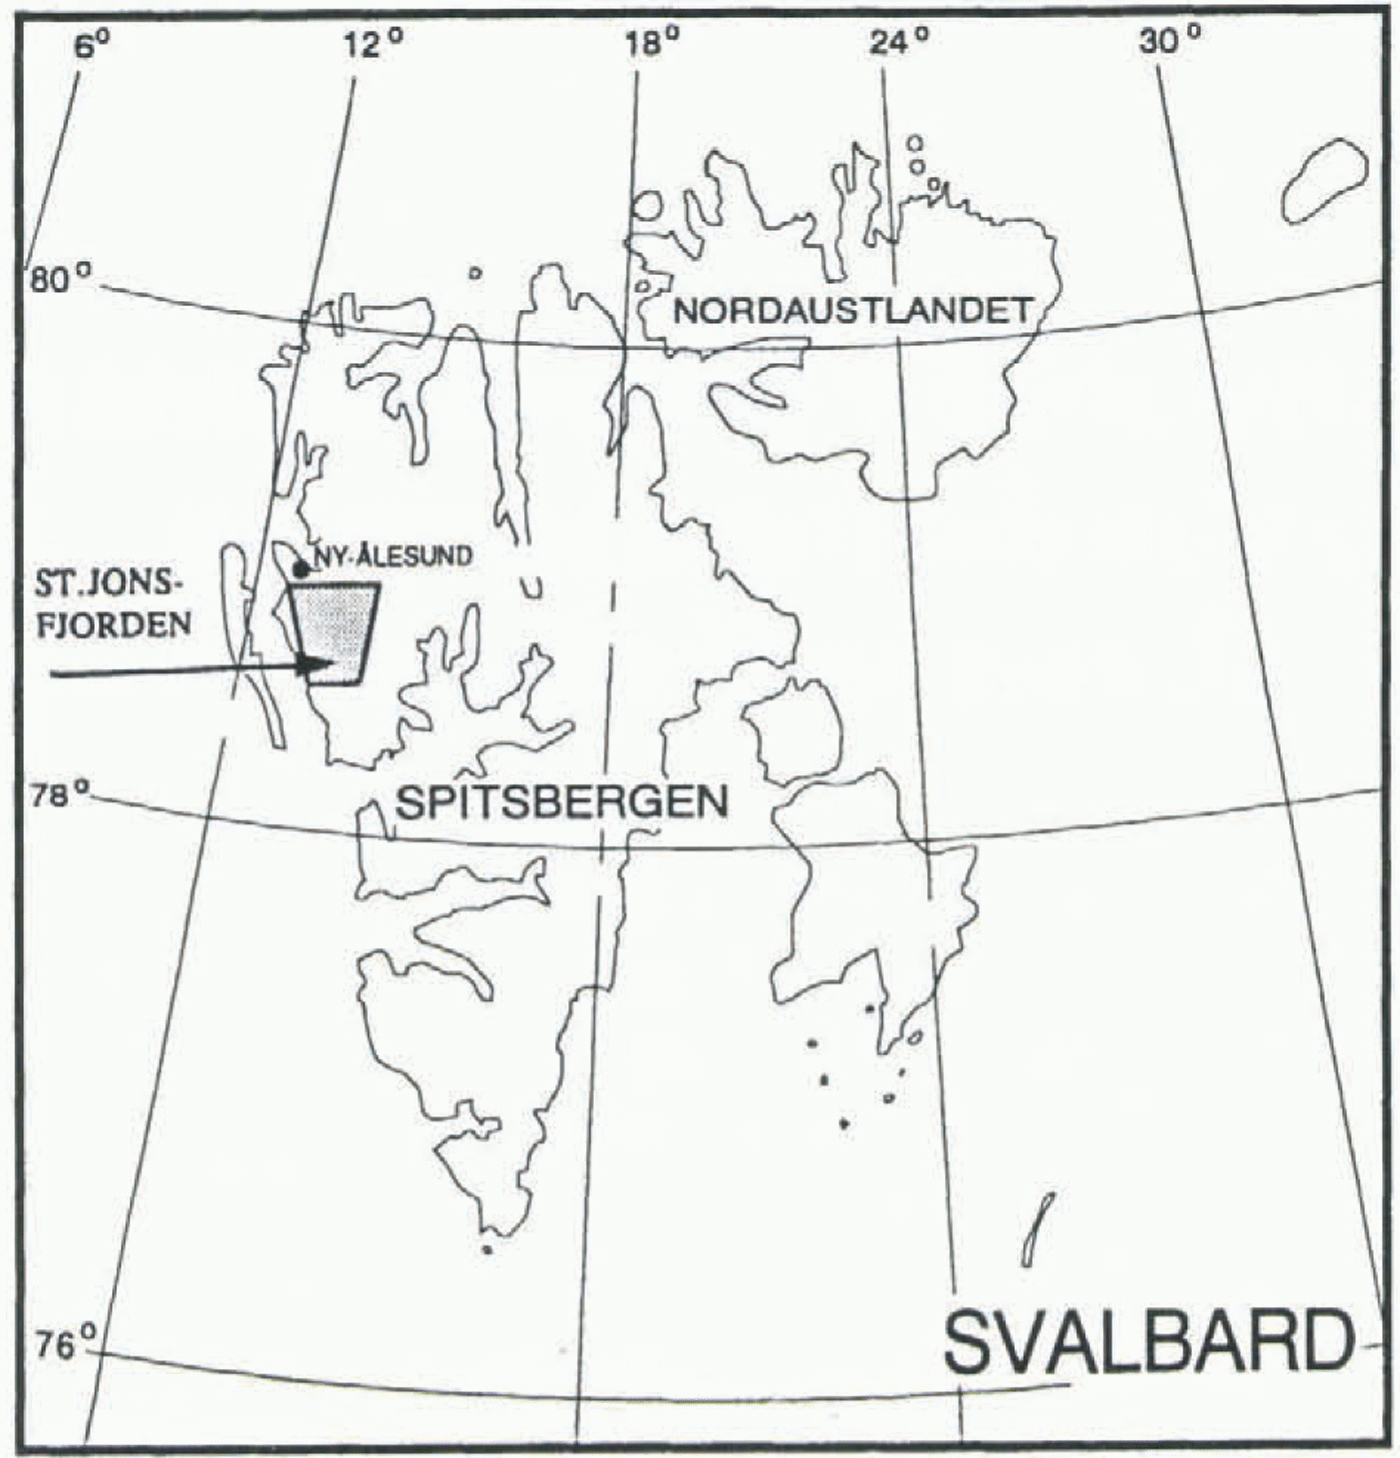
Development of crevasses indicating the start of a surge on Osbornebreen (78° N, 12° E; Fig. 1) was observed from an aircraft in the winter of 1986–87. The 20 km long glacier terminates in St Jonsfjorden (Fig. 2). The drainage basin rises to 800 m a.s.l. and covers a total of 152 km2. The glacier front had advanced 1.4 km into the fjord by April 1987 (Dowdeswell and others, 1991). A further advance of 0.3 km was measured on satellite images from July 1987.
The objectives of this project were to determine the velocity and the surface elevation change of this surging glacier by means of remote sensing. Sets of average velocity vectors with 1 month and 1 year separation were measured on Landsat thematic mapper (TM) and SPOT XS satellite images from 1987 and 1988. A digital elevation model (DEM) was constructed from aerial photographs from 1990 using a digital photogrammetric workstation. This DEM was compared with a map from 1966.
Methods
The displacement of crevasses and other features on the
Location of Osbornebreen, Svalbard (78° N, 12°E). The gray area is shown in Figure 2.
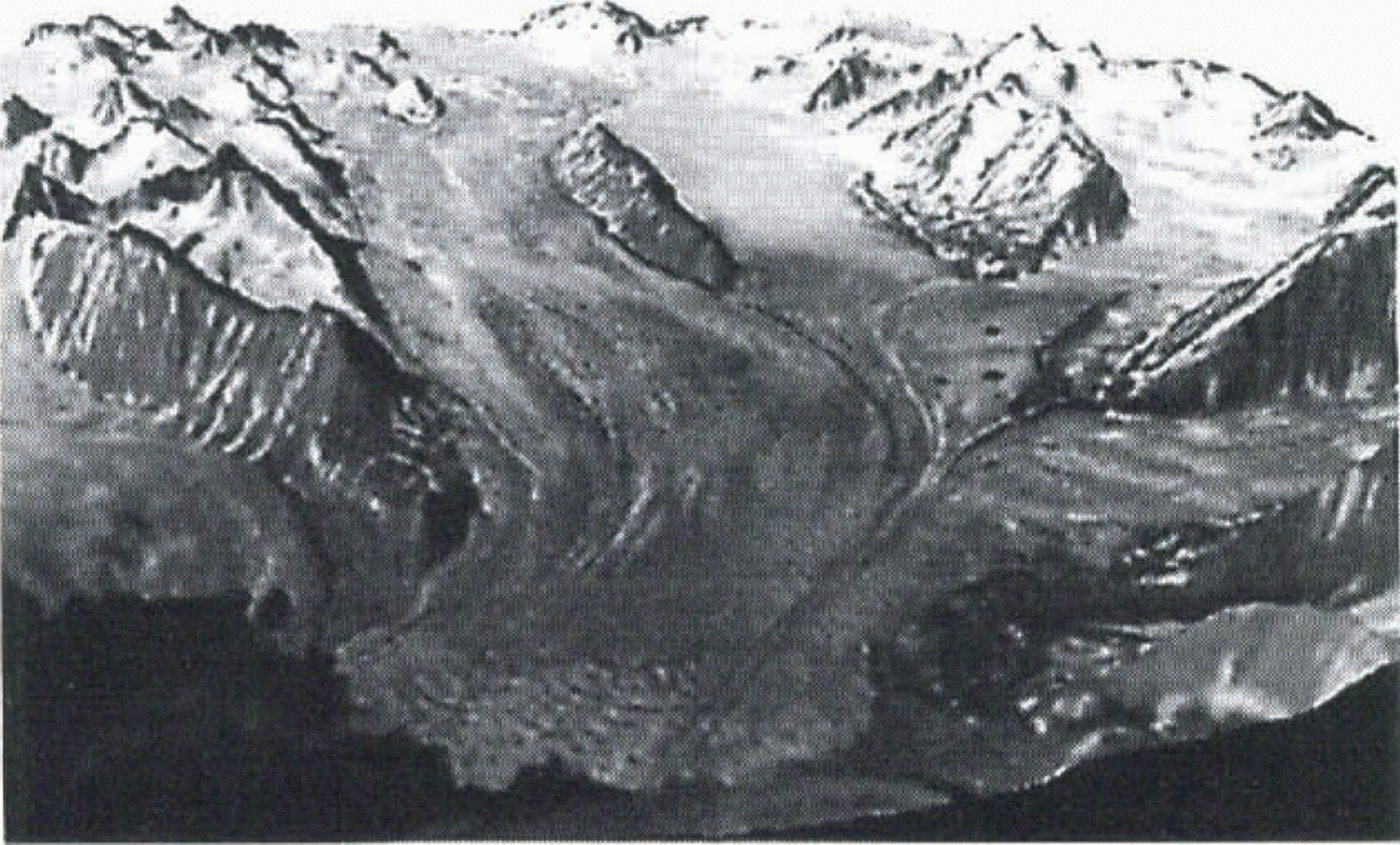
Osbornebreen seen from south to north. Location shown in gray in Figure 1. SPOT HRV (23 July 1988, 153–141/0) band 3, draped on a DEM from 1966.
glacier surface was measured in a time series of images to determine average velocity fields between each pair. The images were first co-registered using fixed features such as mountain peaks. Identification of the same crevasse in an oriented image pair is done automatically by calculation of the cross-correlation between the gray-scale values in the pair.
The gray values in an image are determined by four factors: illumination, reflectivity, geometry of surface objects and the sensor position (Lemmens, 1988). These factors will vary in time.
Illumination will change at different sun angles. Glacier surface topography in general varies smoothly, so this factor gives low spatial frequencies of the gray values. The crevasse pattern in the image changes because the crevasses cast shadows which can be quite different at varying sun angles, in addition to the deformation of the crevasses on the glacier between each recording. The crevasses form the spatial high-frequency pattern which should provide the basis of the correlation analysis for the crevasse tracking.
The surface reflectance at Austre Brøggerbreen (78° N, 11° E) in Svalbard increases steadily as the altitude increases up-glacier in a summer Landsat TM image, band 4 (Winther, 1993). In August 1987 the mean of the gray values (0–255) varies from 26 to 78 in different elevation zones from 50 to 400 m a.s.l. The varying reflections, from blue ice near the snout to while snow in the accumulation area, yield low spatial frequencies. Winther (1993) showed that surface reflectance also varies from year to year, with mean gray values for the whole glacier of 76 and 46 in August 1987 and August 1988, respectively.
Surface geometry and sensor position is given by a DEM, together with the satellite position and orientation at the time of recording. The surface slope relative to the position of the sensor and the source of illumination will influence the gray values. Varying terrain elevations will also cause geometrical displacement of features in both SPOT and Landsat TM images. The magnitude of the displacement is dependent on the position and orientation of the satellite, the terrain elevation and the distance from the satellite nadir track (Orun and Natarajan, 1994).
Calculation of cross-correlation of gray values in image pairs
The discrete correlation R of the two function values a and b over an interval n is defined as (Lemmens, 1988):

In this case a i and b i would be the gray values from 0 to 255 from the two images a and b, and n would be the number of samples along an image line in the chip. A correlation coefficient r can be calculated on a statistical basis by subtracting the mean value and normalizing by the standard deviation of the gray values in the chip:

The correlation estimate is done on a pair of chips, which is a subsection of the image with typical size of 32 x 32 samples. By calculating r as the chip moves across the image, one can obtain sets of r which form a correlation surface for the images (Mather, 1987). The position of a correlation peak, which represents the displacement between a detail in the two images, can be determined to a sub-pixel accuracy by means of interpolation on the correlation surface. Statistical correlation estimates were used in the previously mentioned projects on the Antarctic ice streams.
In this project, feature tracking was carried out in the Fourier domain where the correlation estimate is done on a frequency basis. The phases and amplitudes of the spatial frequencies of the gray values in the chips are calculated by the fast Fourier transform (FFT). The FFTs of the two chips are denoted F(a) and F(b) and are represented as complex images. The correlation theorem (Gonzalez and Wintz, 1987) states that the discrete correlation R between the chips can be estimated by a complex conjugate multiplication:

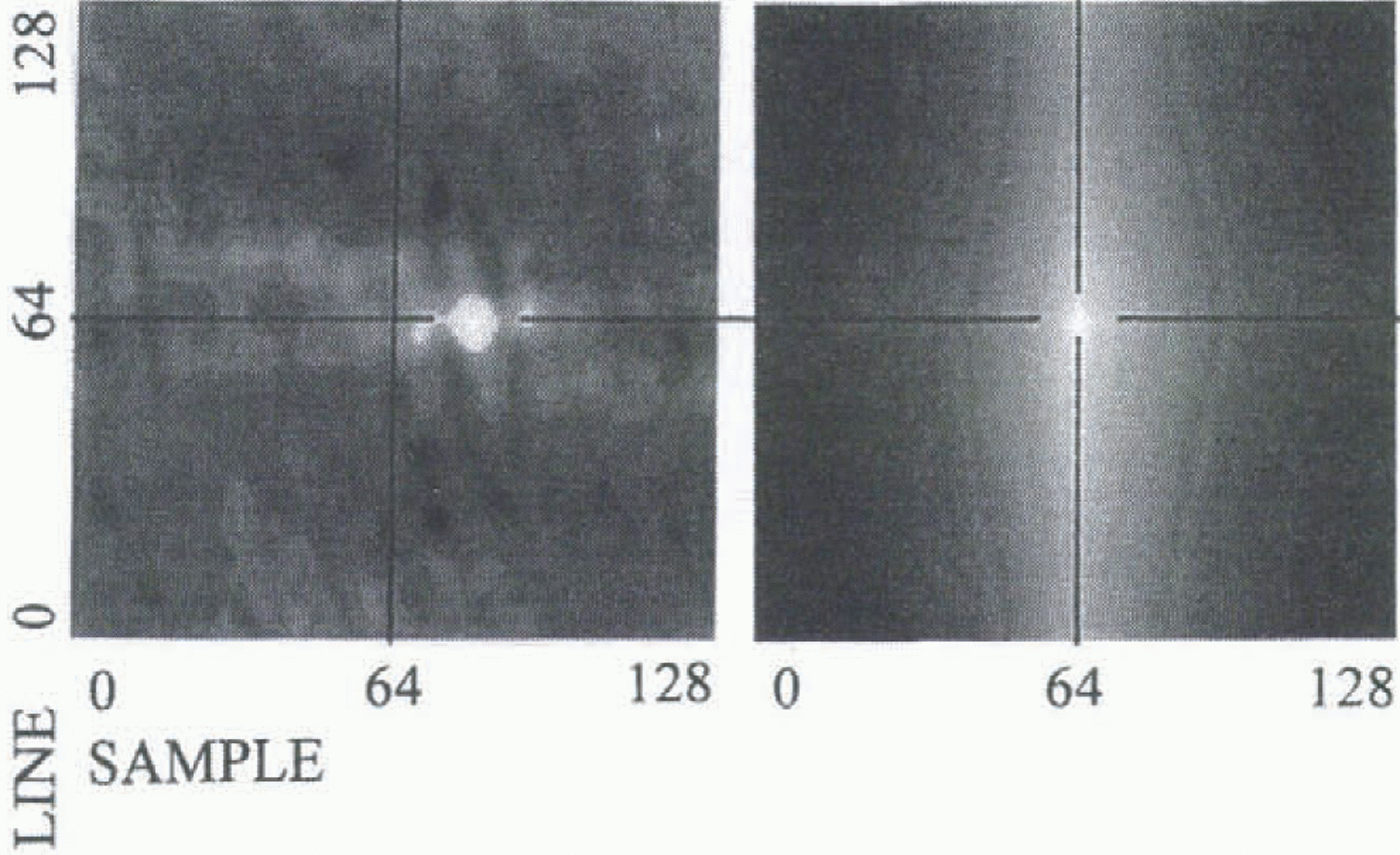
An inverse FFT is then performed on F(R) to obtain a cross-correlation image or correlation surface of this specific chip in the image domain (Fig. 3). The position of this peak represents the displacements between the two chips, and the determination of the position is similar to the statistical approach.
The original images were high-pass filtered before the
Examples of 128 x 128 pixel correlation surfaces in the image domain. In both cases the correlation was estimated on two chips from the same image, chosen with 15 pixels displacement in the sample direction. The left surface is estimated from chipi with high spatial frequencies, and the peak is the white spot positioned 15 pixels right of the center. The right surface is based on both high and low frequencies. The peak is smeared out by the dominant low frequencies, and the displacement cannot be measured.
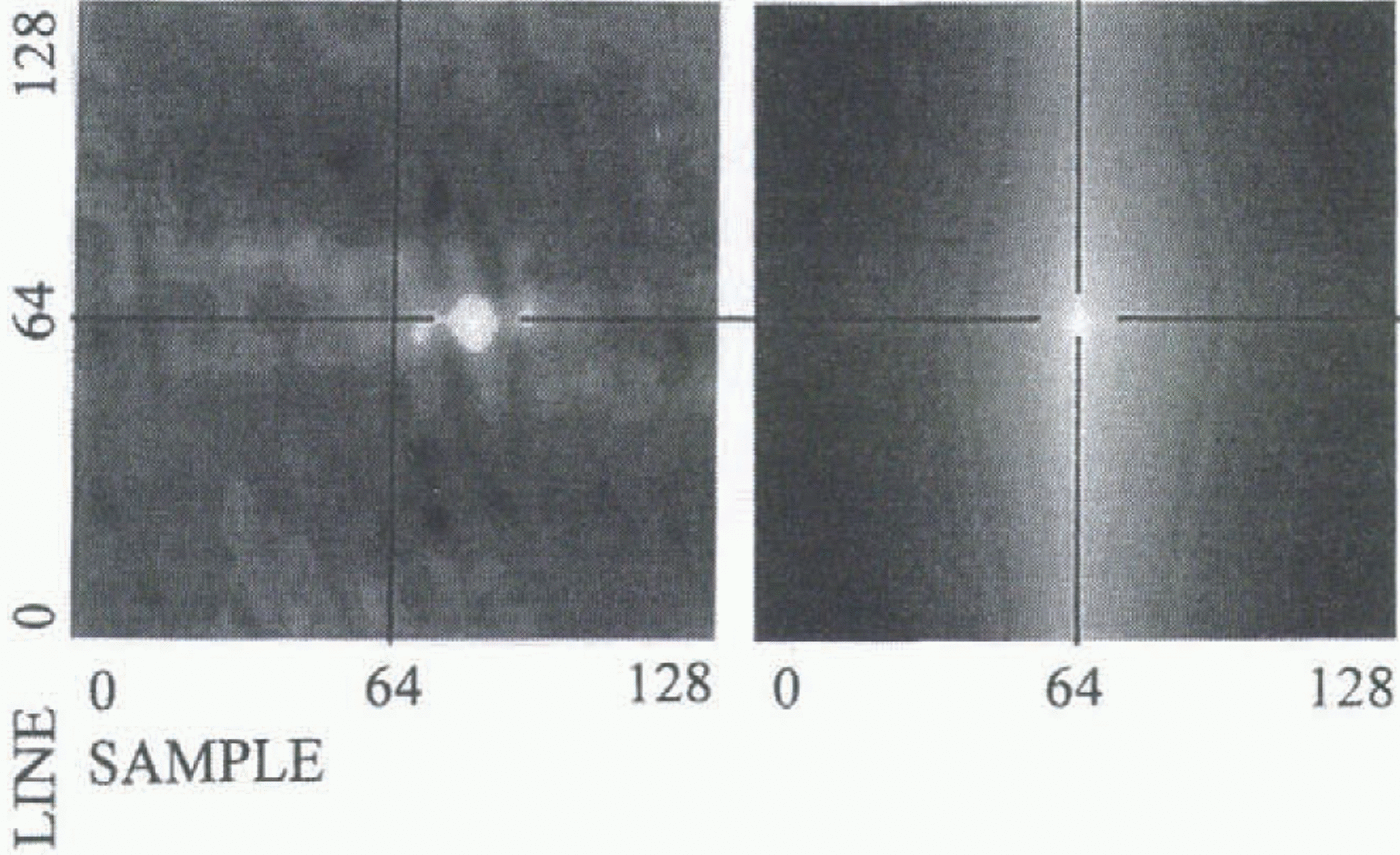
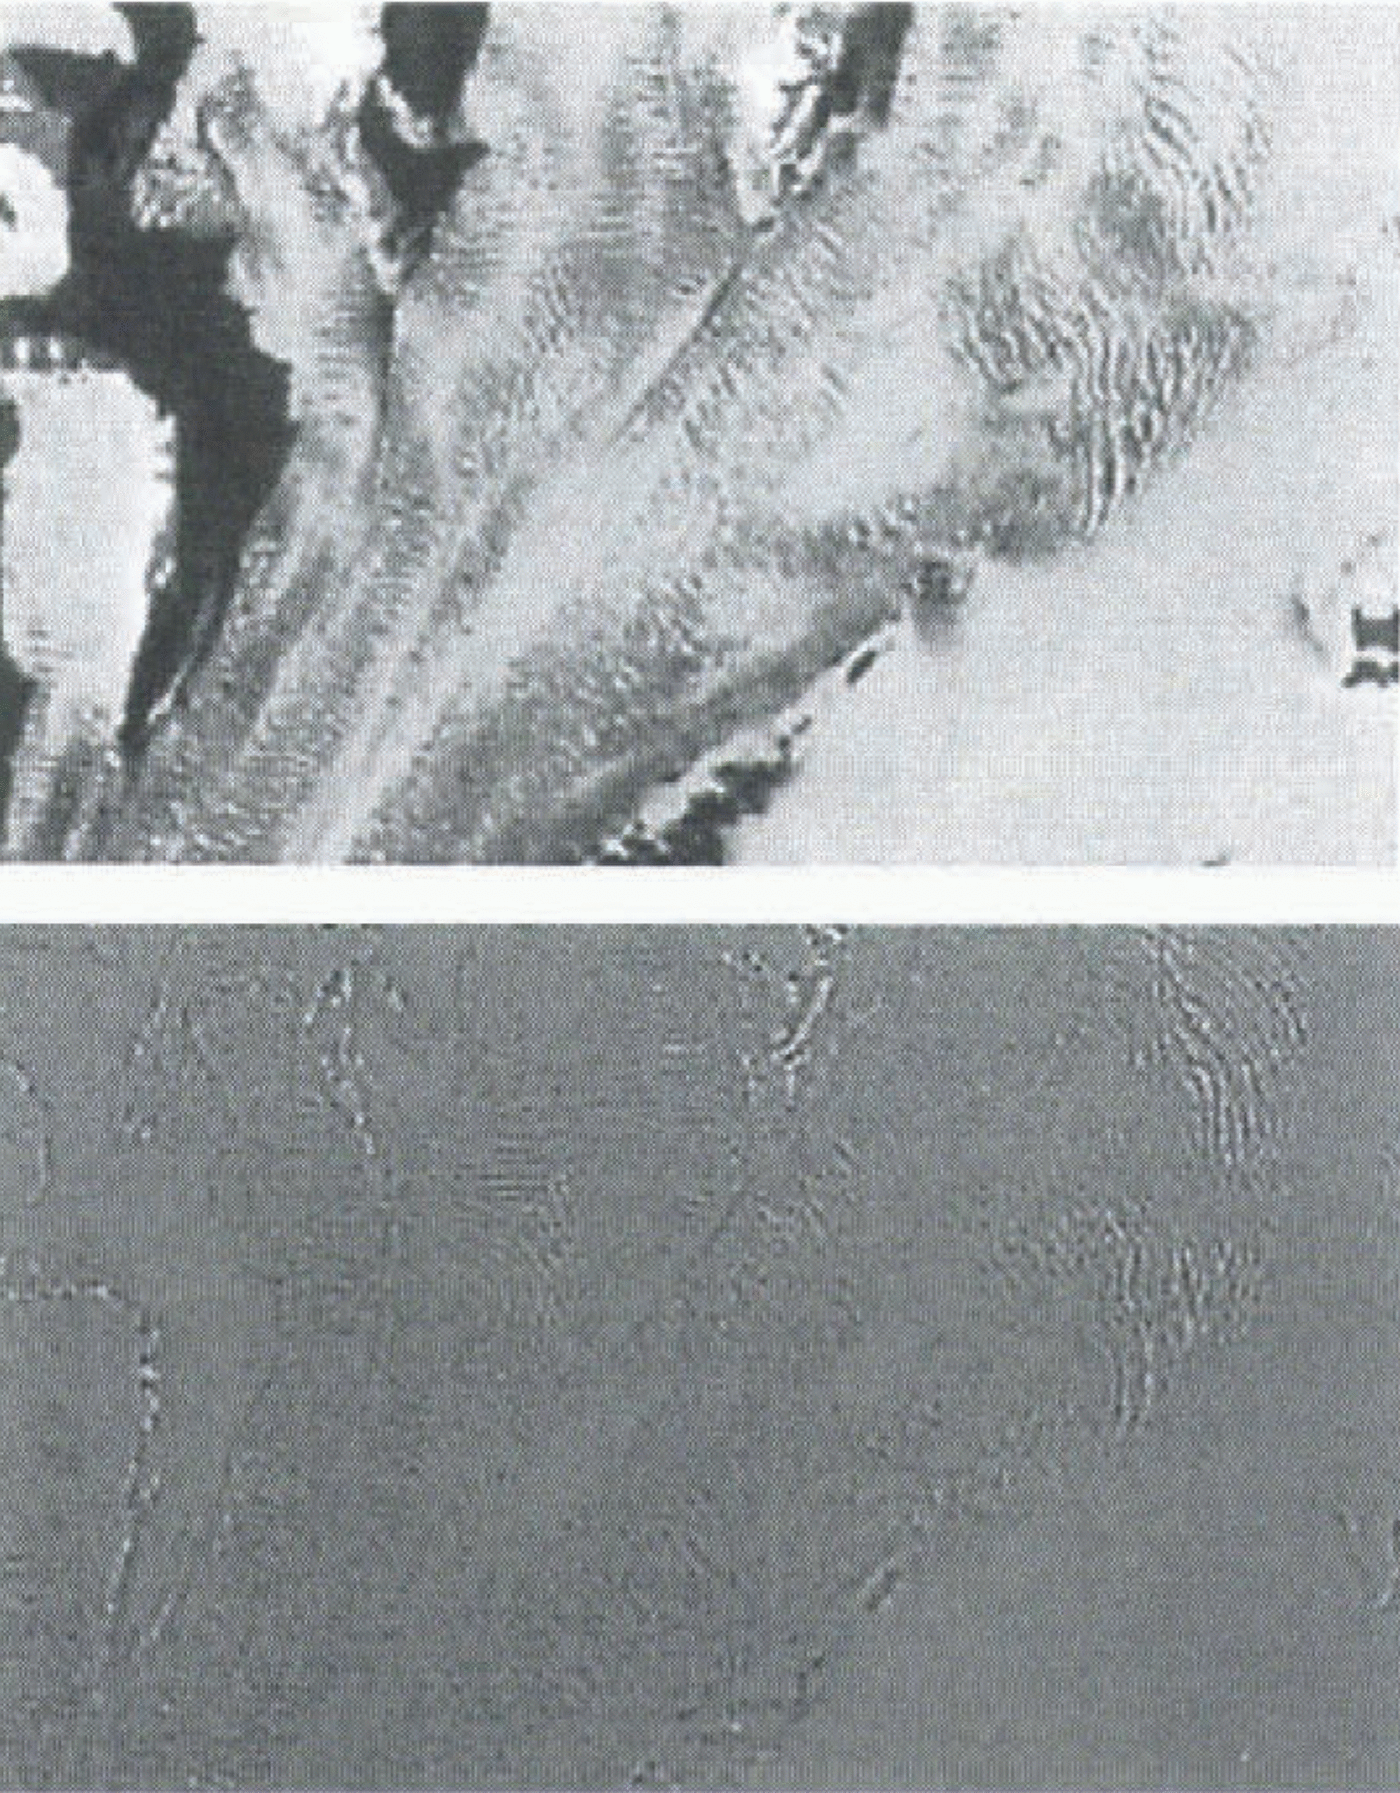
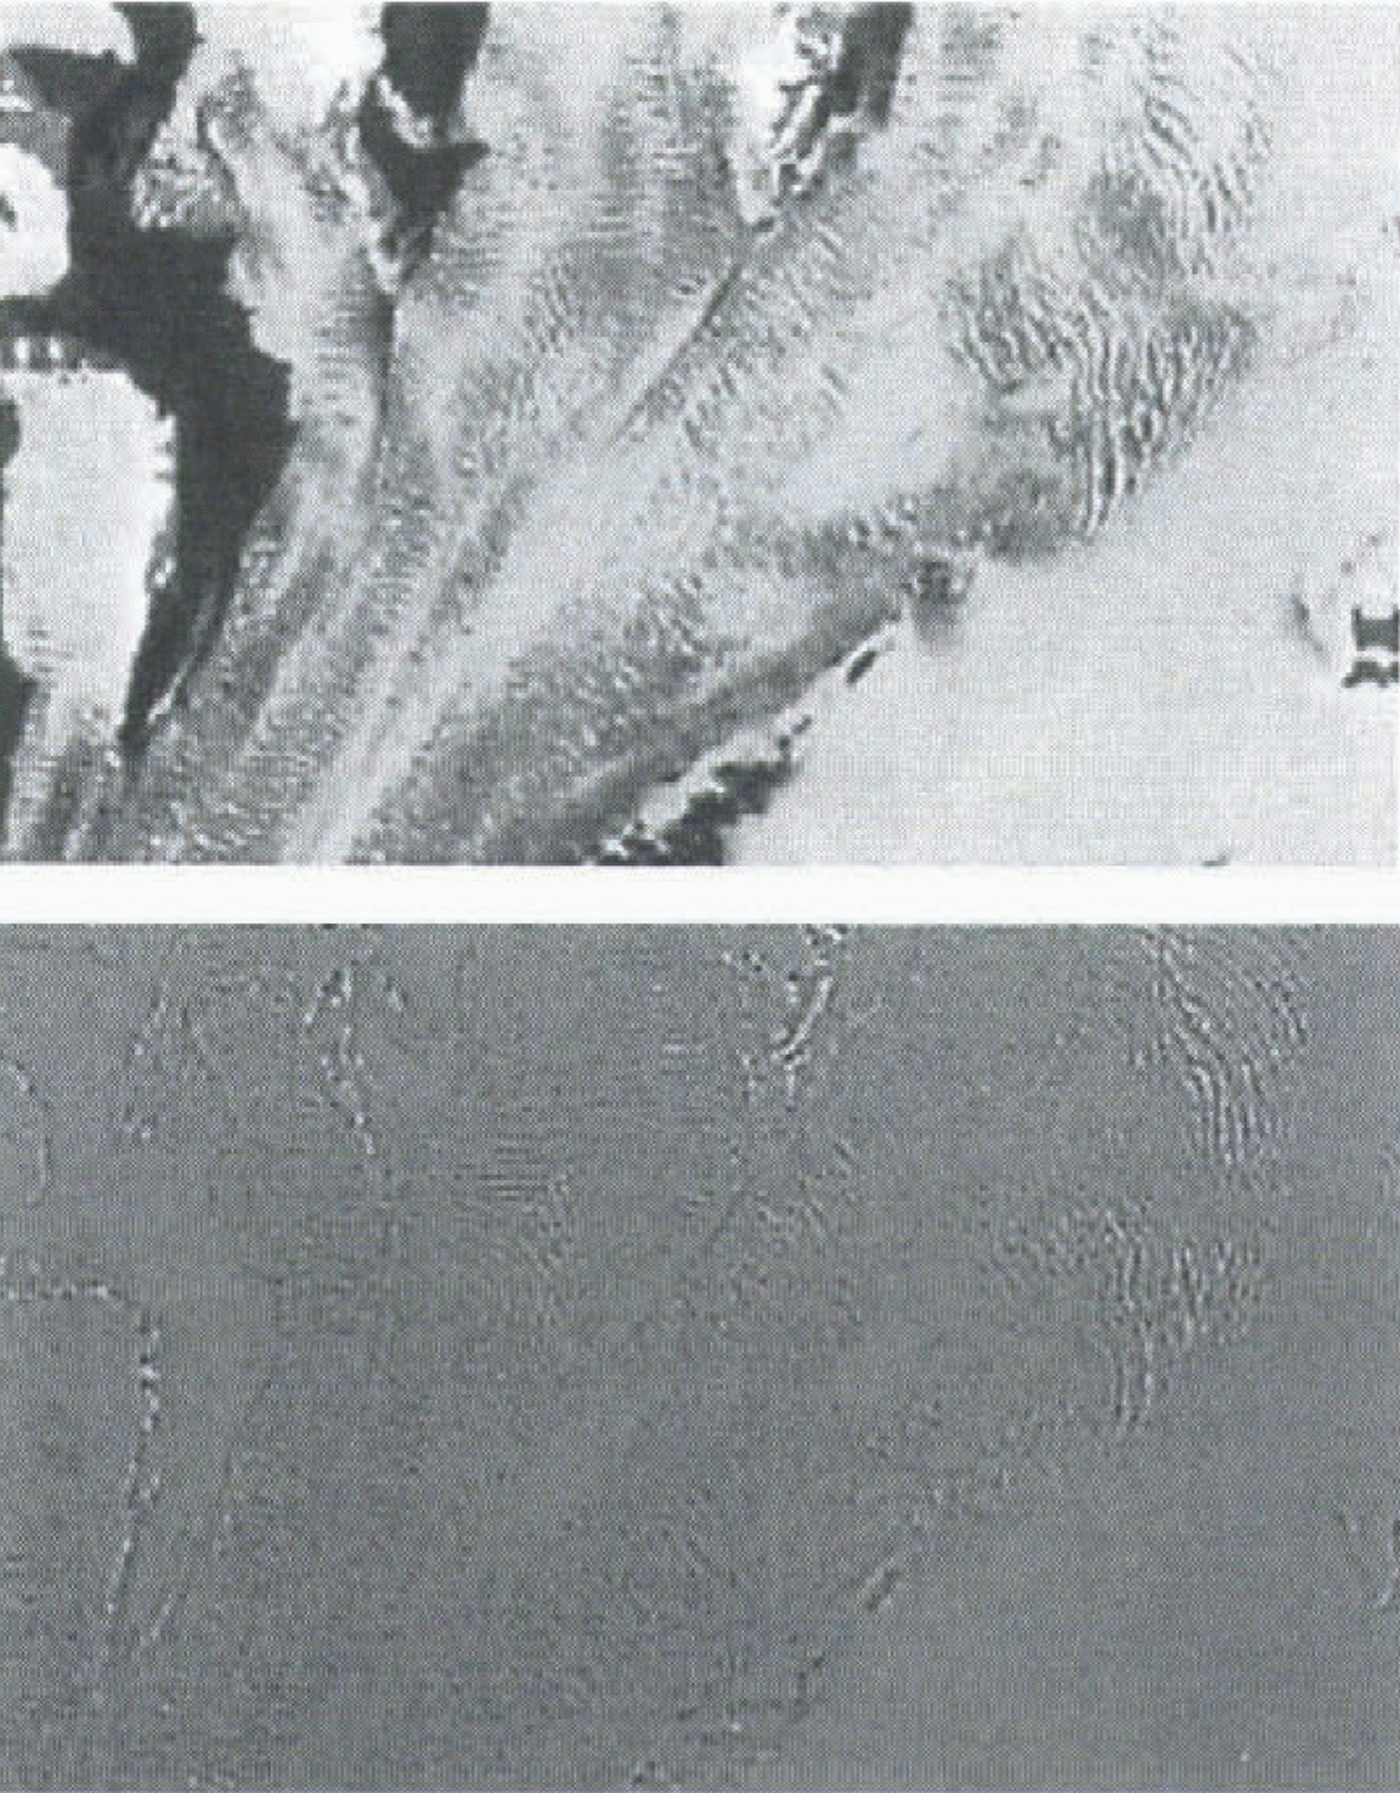
correlation estimate. This removes the spatial and time differences in surface reflections and illumination on the glacier. The high-pass filtering provides an almost unchanged mean value and standard deviation for various positions of the chip on all crevassed parts of the glacier (Fig. 4). Similar correlation surfaces are therefore obtained when estimating the correlation R in the Fourier domain compared with the statistical method, where r is calculated by normalizing with the mean value and standard deviation of the chip. A higher amplitude of the low frequencies can dominate the high frequencies in the correlation surface by smoothing the surface (Fig. 3). The interpolation for subpixel accuracy will be more accurate from correlation peaks based on high frequencies, because the slope of the correlation peak will be steeper and the peak is clearly defined. The number of accepted peaks was limited by requiring that this slope be steep. By filtering away all frequencies with larger wavelength than the chip size, one also avoids some of the extra frequencies introduced as a result of the periodic assumption of the Fourier transform (Gonzalez and Wintz, 1987) when transforming the chip.
Geometrical correction of satellite images
The available satellite images SPOT HRV (23 July 1988, 153-141/0) and Landsat TM (6 August 1987, 214/4; and 31 August 1988, 215/4) had been preprocessed to level IB (SPOT Image Corp., 1985) when delivered, which means that radiometric and geometric corrections based on knowledge of the system distortion had been applied.
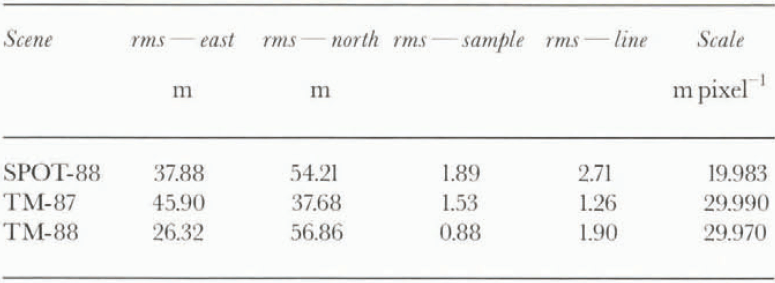
Each satellite image was co-registered to the coastline in a digital map, and a conformai (Helmert) transformation (Maling, 1993) between the image and the UTM system determined. The images were resampled using bilinear interpolation to 20 m pixels in the UTM projection, where a correction for the terrain displacement was also performed. The position of the satellite with respect to the scene was read from the image header file, and the off-nadir view angle was corrected for Earth curvature. The change in sample position of the nadir track for each scan line, caused by the Earth’s rotation, was described by a linear equation.
Top: Landsat TM band 4 from the accumulation area. Bottom: the same image high-pass filtered with 80% of frequencies removed.
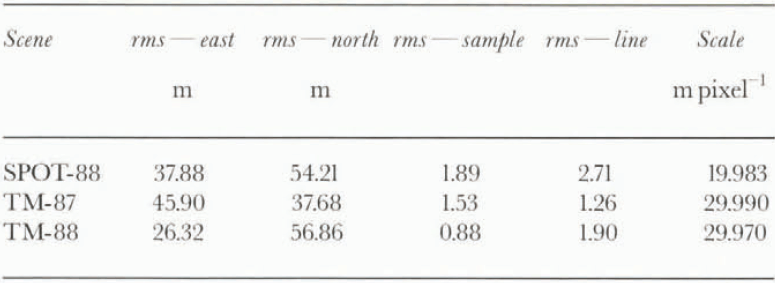
The SPOT image was orientated using ground-control points read from a paper copy map. The Landsat TM images were co-registered to the coastline in a digital map. The rms errors of the Helmert transformation, shown in Table 1, are therefore better for the TM images.
In order to remove the remaining systematic errors, such as translation and different scale in the pair of ortho-correrted images, the images were again warped based on a Helmert transformation and bilinear resampling, with a rms error of 0.4 pixels. The images were co-registered with use of the points located on the mountains. Both Landsat TM images were warped to the SPOT image.
Construction of a DEM from digital aerial photographs
To determine how the surface elevations changed during the surge, a new terrain model was constructed from 1990 aerial photographs. A digital photogrammetric workstation (He-lava DPW) was used for image orientation and extraction of the DEM. With the use of cross-correlation, similar points in the two digital photos in a stereo model were identified and elevations calculated. The correlation process is conducted automatically, within user-specified areas and to a specified grid resolution. The resulting elevation grid can
Water fluxes and chemical weathering rates at Finsterwalderbreen
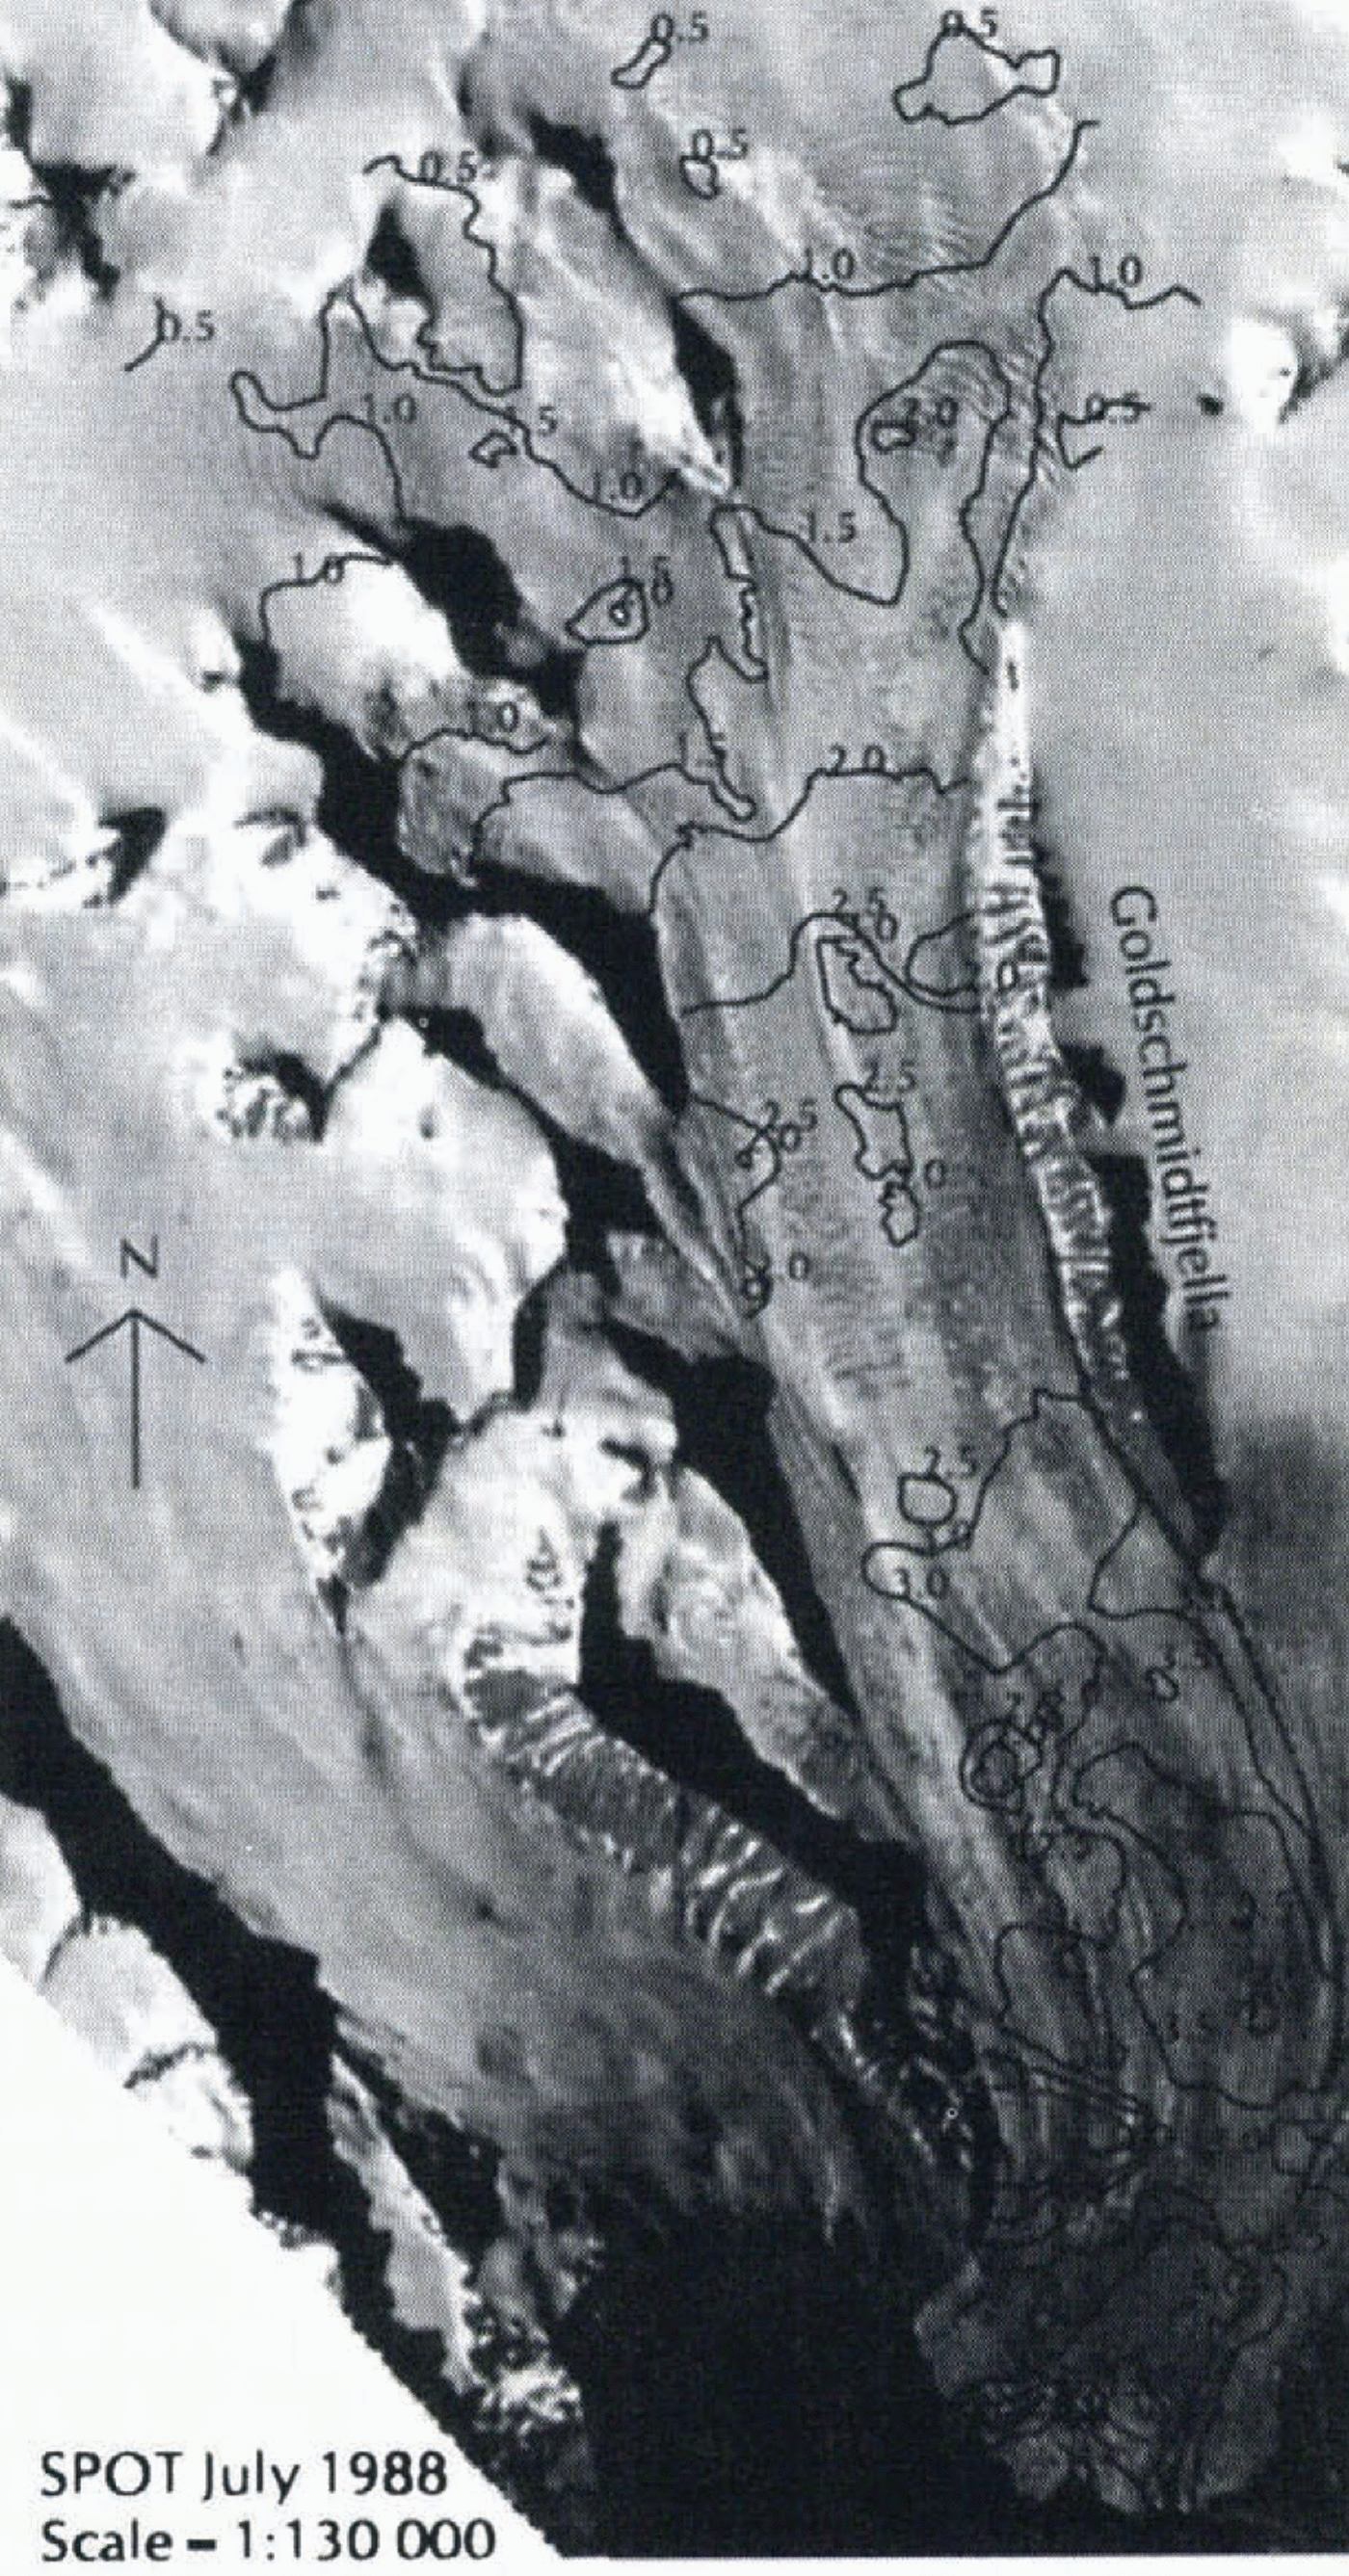
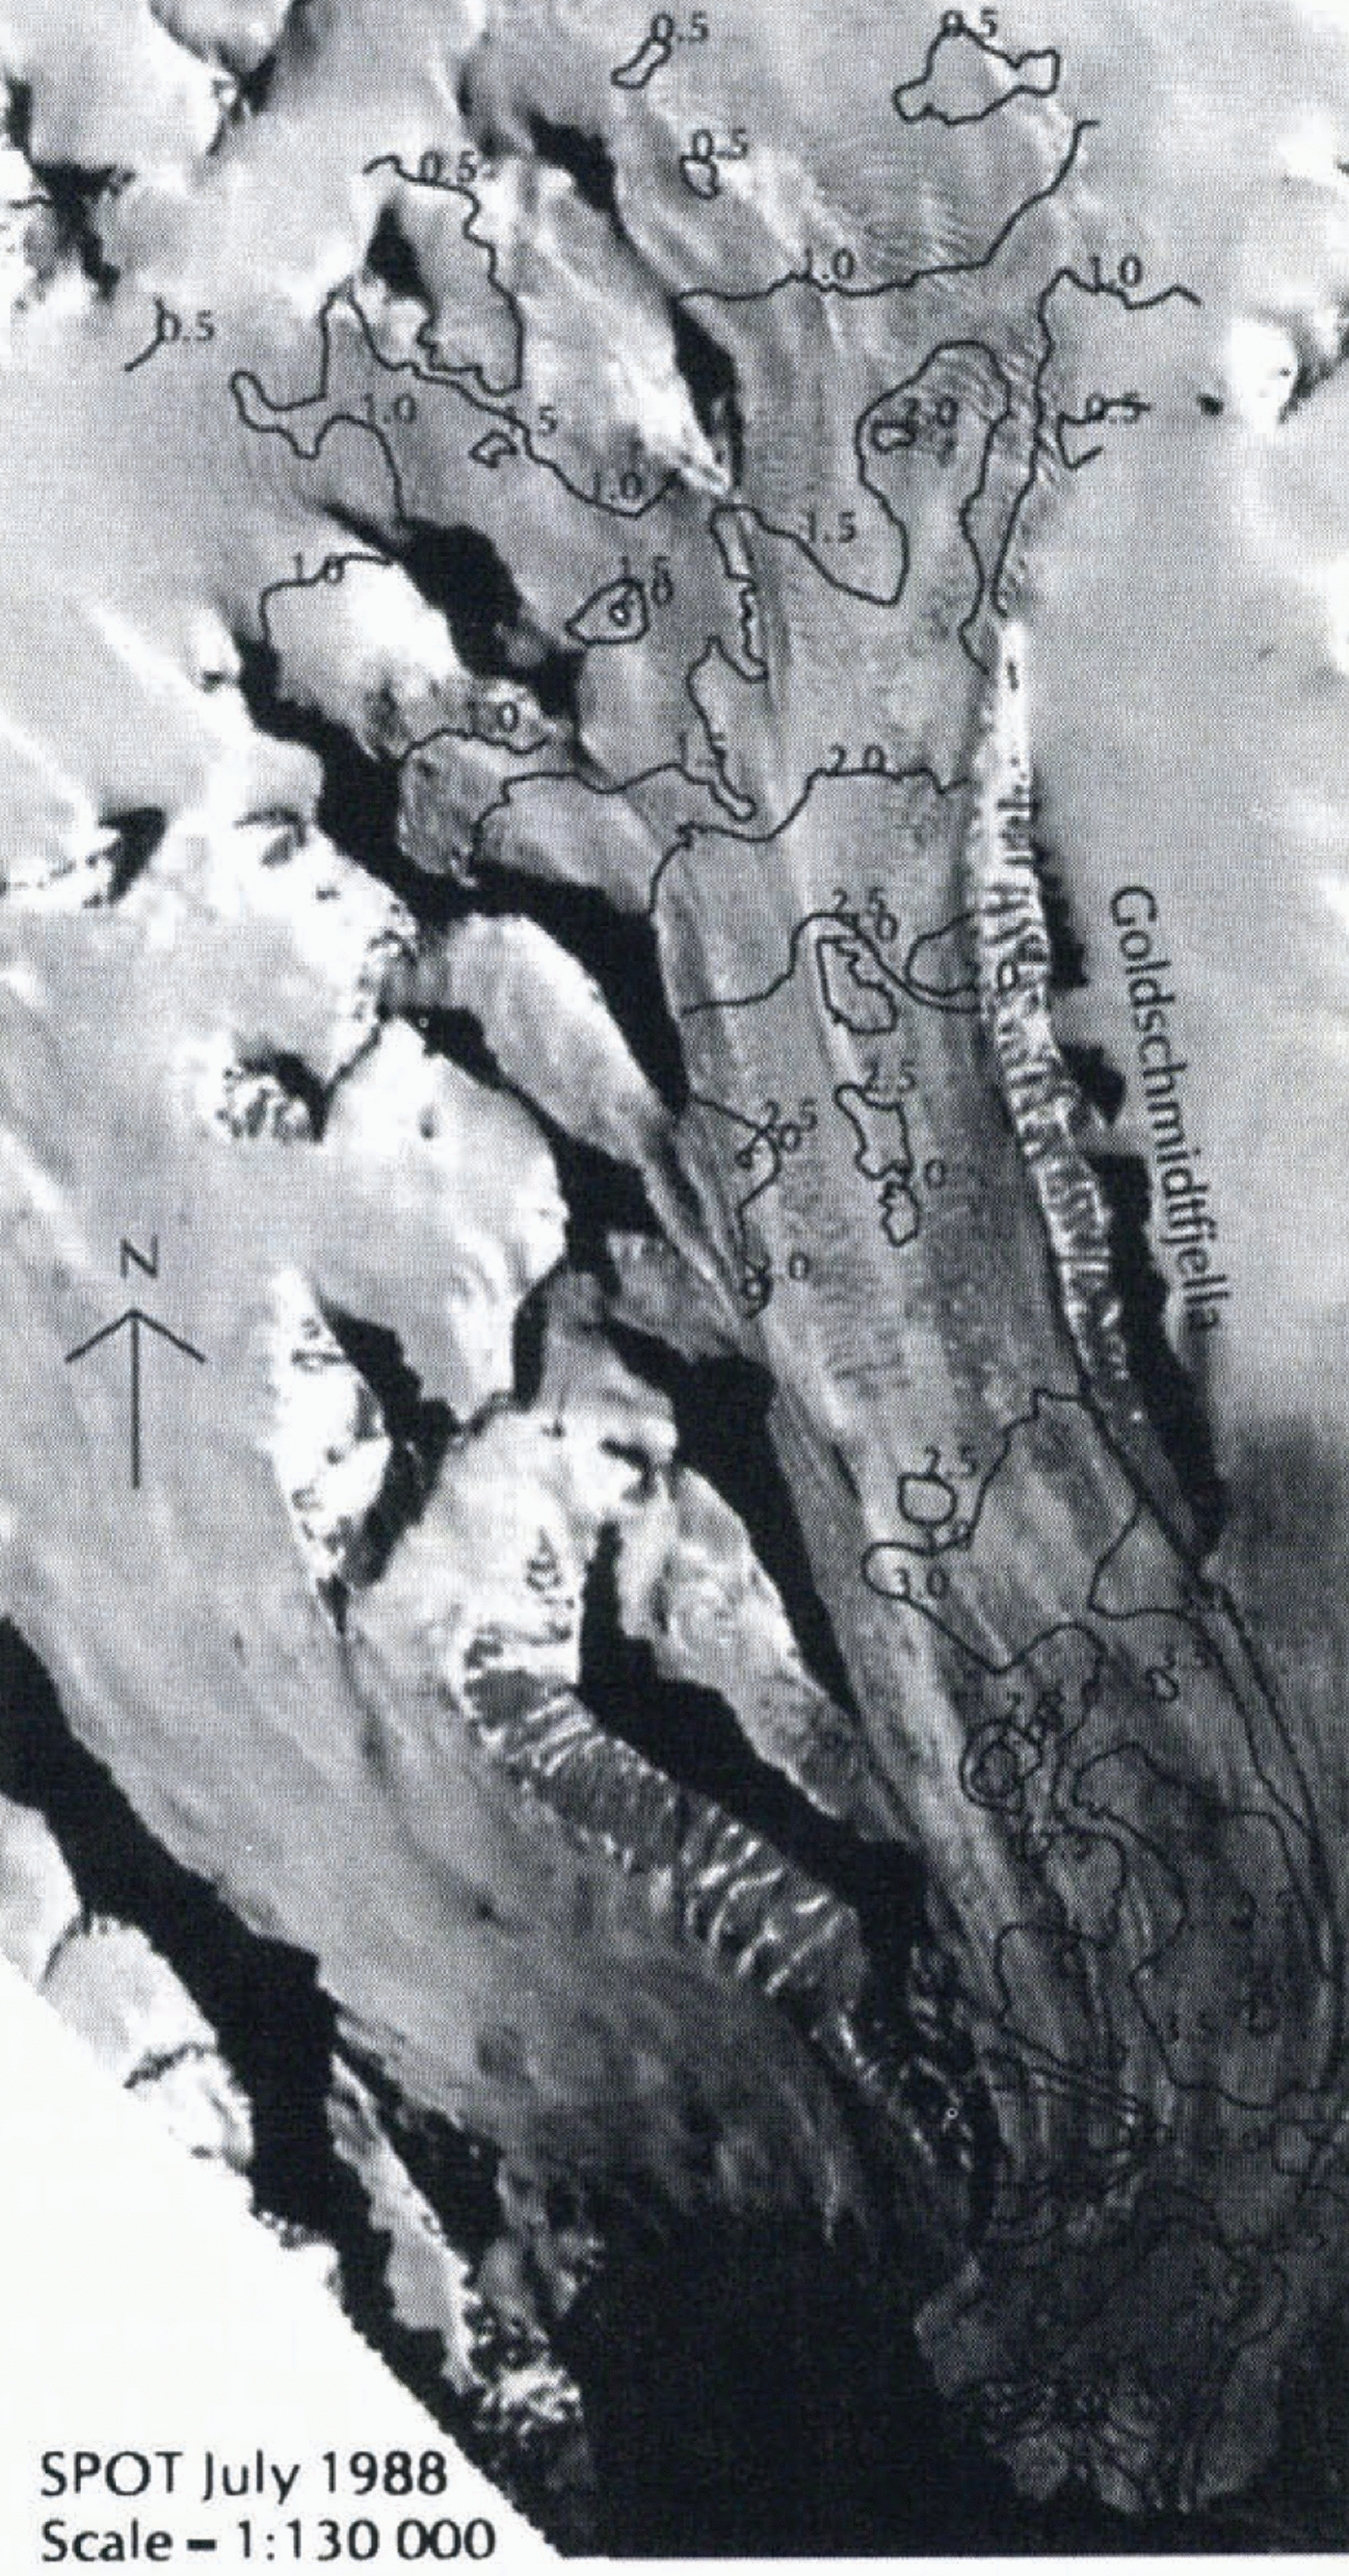
Velocity contours in 1988. Points A–B are marked as in Figure 6.
be edited by inspection on the screen, providing a three-dimensional image of the stereo model and elevation contours.
Results
Velocity
The cross-correlation estimates were carried out on three satellite images, which gave two sets of velocity vectors. The Landsat TM image from July 1987 was matched with the SPOT image from July 1988, which in turn was matched with the Landsat TM image from August 1988.
Crevasses already formed in 1987 were deformed in 1988. Where there was varying deformation within the chip size, which was the case in the accumulation area, no successful matching points were found. Near the terminus, the crevasses are covered by snow in the 1987 image. With a 1 year separation between the images, only the middle part of the glacier, along the central 6 km long mountain ridge Goldschmidtfjella (Fig. 5), gave successful matching points.
In July and August 1988, matching could be done over almost the entire glacier surface (Fig. 5). There were some difficulties near the terminus where high velocities and deformation of the crevasse pattern, together with melting of the surface, changed the pattern of the images significantly.
Typical movements during the period August 1987–July 1988 were more than 1 km, and for the 40 d period from July to August 1988 about 100 m. The average velocities are the same for both periods.
Terrain models
A DEM was constructed from ten aerial infrared photographs acquired by Norsk Polarinstitutt, Oslo, in 1990 at a scale of 1:50 000. It was developed with 10 m grid cells. There were no problems with the correlation in the surge-affected areas. The crevasses were well developed over the whole glacier in 1990, and give a good contrast in the images. Similar points are easily identified over the whole blue-ice area. In the accumulation area outside the surge-affected zone, the white snow gives no contrast in the images, and therefore similar points cannot be identified. The surface elevation of Osbornebreen constructed from the 1990 photographs has an error of about 10 m in elevation, the ground positioning about 5 m. The uncertainty is mainly a result of poor accuracy of the ground-control points (Rolstad, 1995). The method is suitable for determination of glacier surface elevations on surging glaciers, but only if accurate ground-control points are available.
The DEM from 1990 was compared with a DEM from 1966, to determine how the surge affects the glacier volume. The glacier surface is changed from 1966 to 1990 in the same way as seen on several surging glaciers (Raymond, 1987), with a reduction of the longitudinal slope. The glacier surface in the reservoir area is lowered by as much as 100 m, and the glacier front has advanced in total 2 km into the fjord, with a 100 m increase of the height at the position of the 1966 glacier front.
The terrain model constructed from the 1990 aerial photographs was inspected by calculating the surface slope in the longitudinal direction. A steep surface slope would indicate a surge front, but no such feature was detected.
Discussion
A surge involves longitudinal compression and extension of the ice (McMeeking and Johnson, 1986). During the active phase, a compression front propagates as a result of discontinuity of sliding conditions at the base of the glacier. Differences in velocity give rise to compressive regions adjacent to the slowly moving ice. Identification of the position of this discontinuity where the compression front/surge front is initiated could reveal why sliding conditions vary and the surge starts. Based on the velocity field from 1988, the various glacier front positions, the crevasse pattern and the DEM, we discuss whether the surge front has traveled over the entire glacier or only over the lower part of it, and whether these limited data can trace a compression front at all.
Description of the velocity field
The velocity field from 1988 generally shows extending flow downstream over the entire glacier, with ice velocity increasing from stagnant to 6.0 m d–1 at the glacier front (Fig. 5). The velocity increases steadily in the accumulation area. Along the mountain ridge, Goldschmidtfjella, the ice moves like a block with a velocity of 2.5 m d–1. This block
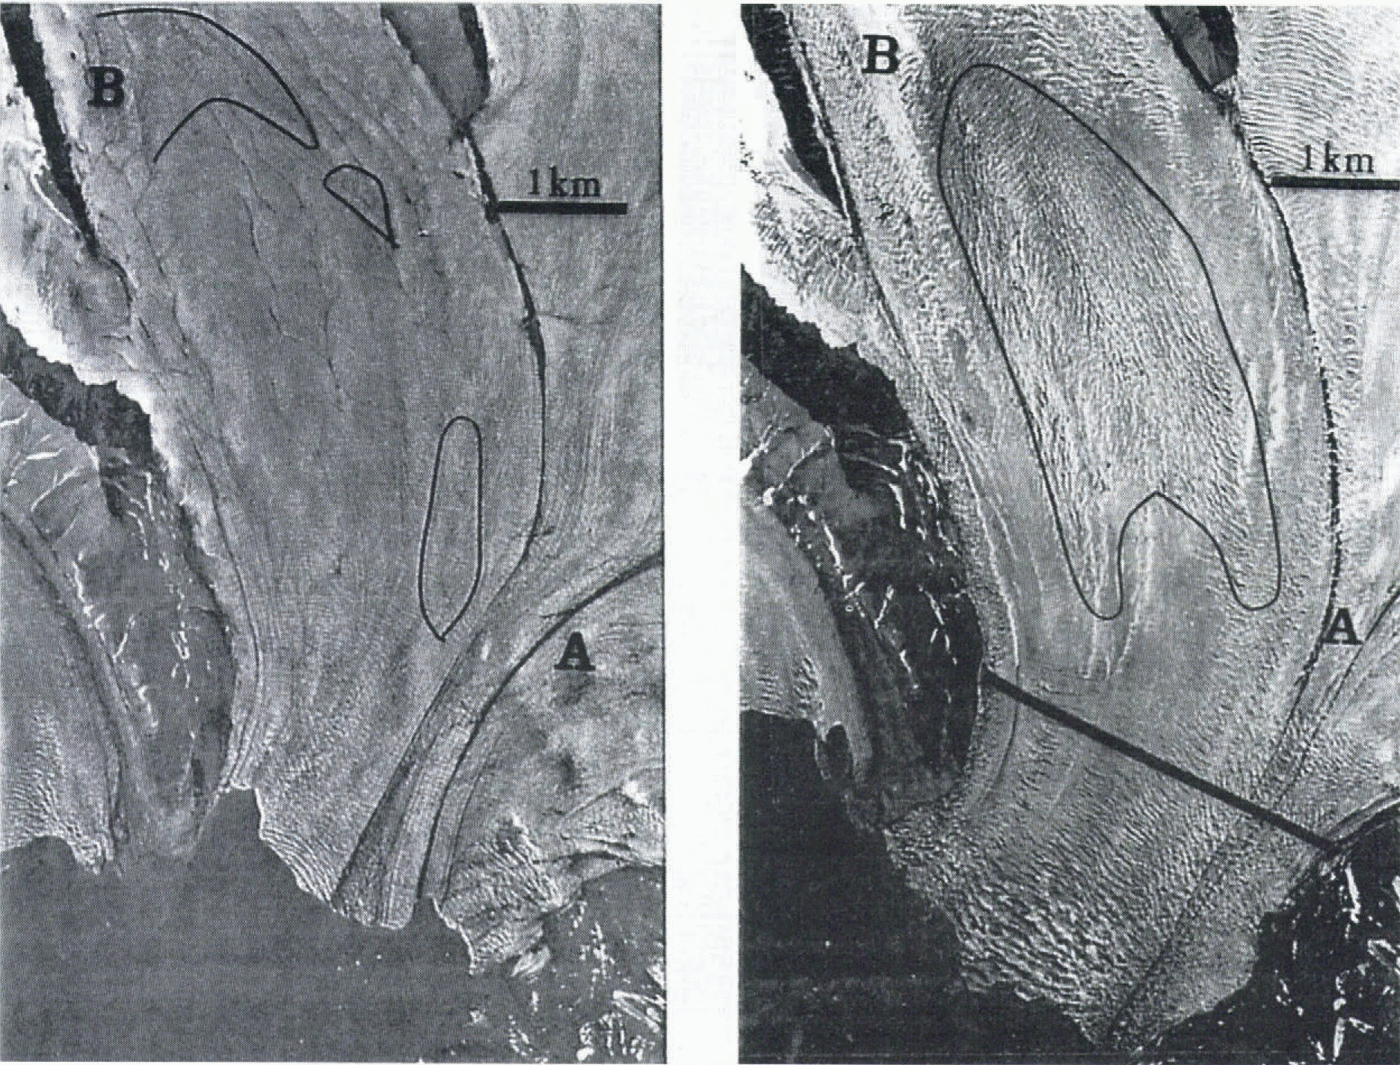
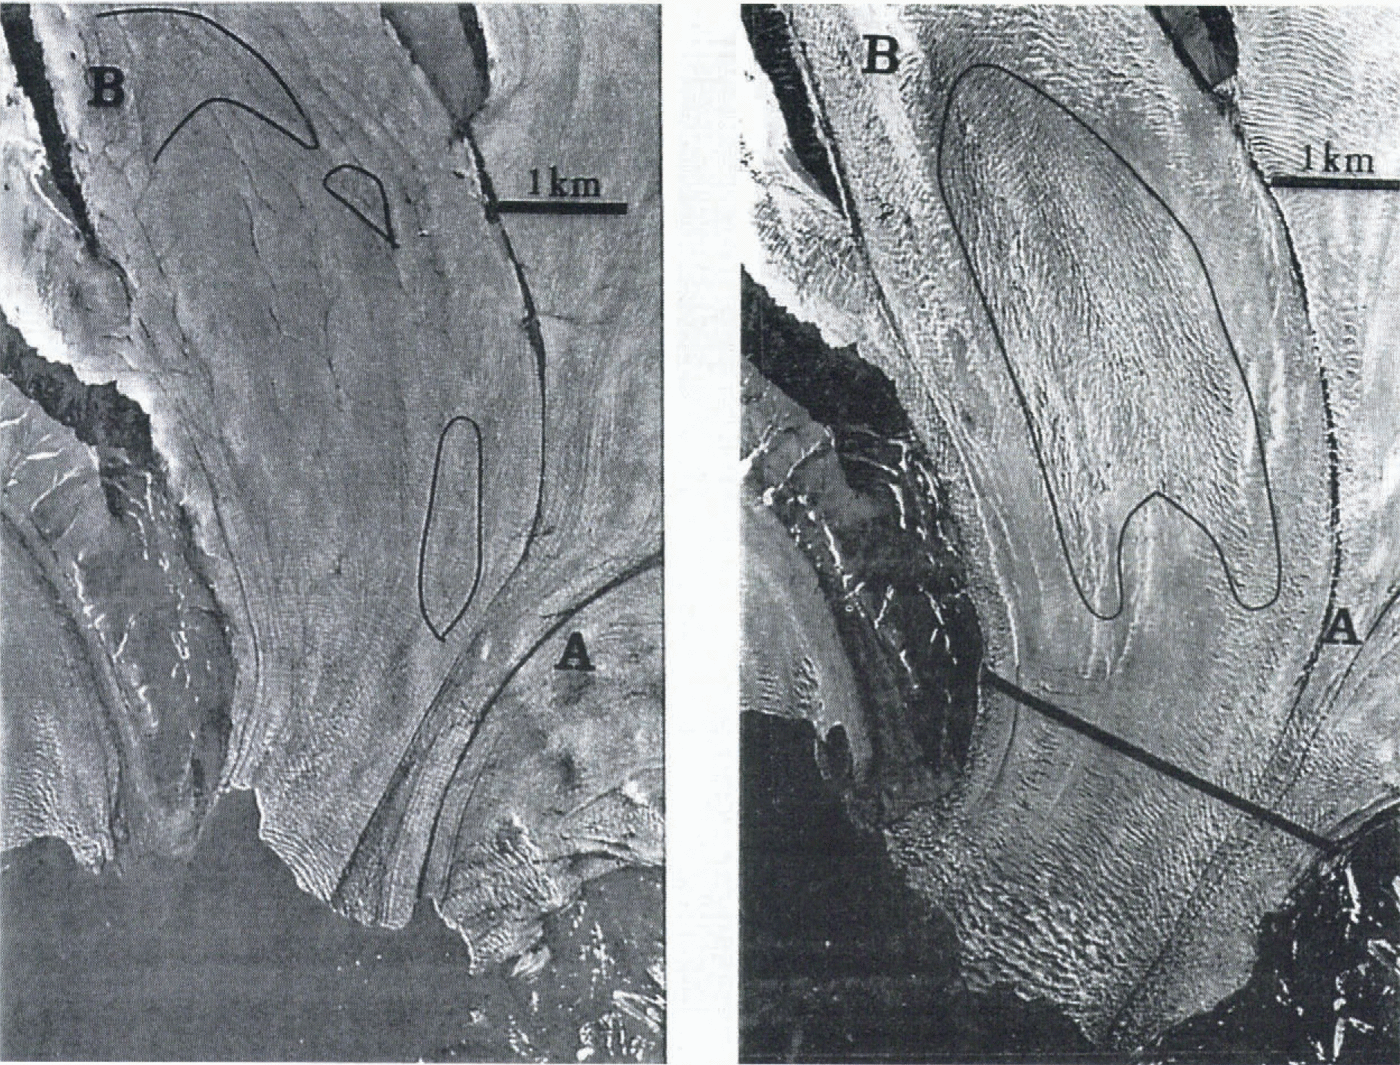
Left: Aerial photograph from 1966. North is upwards. The lines show crevasse patterns which outline the same area as marked in the right photograph from 1990. The surface rivers turn to the east above point B. Right: Aerial photograph from 1990. The surface is crevassed, and an area with longitudinal and transversal crevasses is marked. The thick line shows the glacier front position in 1986 before the surge.
movement is also visible in the velocity field from 1987 to 1988. Between points B and A, the velocity decreases from 3.0 to 2.0 m d–1 on the western part of the glacier, and increases from 3.0 to 4.0 m d–1 on the eastern part. Before entering the glacier front area below point A, the velocity slows down from 3.5 to 3.0 m d–1, and then increases steadily to 6.0 m d–1 at the front. The velocity pattern on Osbornebreen is similar to what is found for the frontal zone of the continuously fast-moving nearby ice stream, Kronebreen (Rolstad, 1995). There is no distinct zone with compressive flow on either of the two glaciers. We believe that the velocity field on Osbornebreen during the active surge phase is similar to the velocity field of a tidewater glacier with continuously high ice flux.
Description of the crevasse pattern
Crevasses were present over the entire glacier in April 1987. Transverse crevasses can be seen in the satellite images from the upper area and down to point B (Fig. 5). Some longitudinal Crevasses are present on the western part of the glacier along Goldschmidtfjella, possibly as a result of shear at the lateral margin. Between B and A, longitudinal crevasses are found (Fig. 6). Further downstream of point A, a zone without crevasses is found above the transverse crevassed front zone. When not covered by snow, a very similar crevasse pattern can be seen on all the available images from the period April 1987–August 1993.
Deformation of crevasses as a result of ice flow
The crevasses are formed and later deformed by the movement of the ice (Vornberger and Whillans, 1990). An extending velocity will open transverse crevasses and close the longitudinal ones. If a surge front traveled over the entire glacier at an early stage, leaving an indistinct crevasse pattern, it could be further reduced by closing of the crevasses. The satellite images used in this project have a low spatial resolution, so narrow crevasses will not show. There is extending flow in the upper accumulation area. Along Goldschmidtfjella the ice moves like a block; the successful feature-matching over a whole year separation (August 1987–July 1988) in this area gives evidence of very moderate ice and crevasse deformation. Some longitudinal crevasses can be seen on the east part, so there is reason to believe that the crevasse pattern is unchanged here since the initial phase of the surge. Between B and A the velocity contours are no longer transverse, they have an oval shape. This will introduce both compression and transverse strain. In this area the longitudinal crevasses may be wider.
Interpretation of the crevasse pattern
Tectonic zones of crevasse patterns on various surging glaciers in Svalbard have been described and interpreted by Hodgkins and Dowdeswell (1994). Longitudinally extending tectonic regimes give rise to transverse crevasses, and longitudinally compressive regimes give longitudinal crevasses. The propagation of a surge front leaves a chaotic crevasse pattern in both the longitudinal and the transversal direction. Such a crevasse pattern is outlined between B and A in Figure 6, which has been pointed out as the position of the surge front in 1990 (Hodgkins and Dowdeswell, 1994). The upper limit of this area is near point B. As the pattern shows only transverse crevasses up-glacier from position B, there is no evident trace of a previous compression front, and point B could be the position where the surge started. This suggests that back-pressure was released below point B, and that the extending flow spread up-glacier, forming transverse crevasses in the whole accumulation area.
Terminus advance
An observation of 1.4 km terminus advance in the period August 1986–April 1987 (Dowdeswell and others, 1991) is also confirmed in the present study, which gives a velocity at the front of at least 2100 m a–1 in the period August 1986–April 1987. This is a rather rapid advance shortly after the surge was initiated. The glacier terminus reached its maximum extension of 2 km into the fjord in July 1988, which is the same position as registered for 1990. In 1993 the front had retreated about 1 km. The crevasse pattern below B is similar in 1988 and 1990. The velocity field from 1988 shows a decrease in velocity on the eastern side from a maximum 4.0 m d–1 down to 3.0 m d–1 before entering the glacier front zone of continuously increasing velocity up to 6.0 m d–1. The longitudinal slope of the DEM from 1990 was inspected to find a steeper edge which would give topographic evidence of a surge front; but no such feature was found.
Hodgkins and Dowdeswell (1994) identified two types of glacier terminus advance during surges of tidewater glaciers, depending on the position of the surge/compression front relative to a low effective-pressure zone at the glacier terminus. Steady terminus advance is when the compression front has not yet reached the low effective-pressure zone. Rapid terminus advance is when the compression front has reached the low effective-pressure zone and been eliminated because of reduced back-pressure. Osbornebreen was used as an example of the former category, described by a steady glacier front advance at an average speed of 450 m a–1. According to the velocity field, the model where a surge front reaches the low-pressure zone and dies out could suit the situation in 1988. The decelerating area would then be the position of the compression front, now located close to the low-pressure zone. However, this deceleration is further downstream than the longitudinal crevasse pattern outlined as the surge front in the 1990 aerial photograph shown in Figure 6.
Variation in crevasse pattern and velocity as a result of bedrock topography
Bedrock topography influences the velocity and the crevasses. We inspected the area A–B on the aerial photographs from 1966 during the quiescent phase, shown in Figure 6. Transverse crevasses are found near point B, and some longitudinal crevasses outline the area where the chaotic crevasse pattern is identified on the 1990 photographs. Above point B the melt streams are turning east. According to the 1966 map, the glacier surface has an elevation difference of about 20 m in the transverse direction. This surface slope and the crevasse pattern suggest a rise in bedrock topography in this area. The 1988 velocity field shows, as mentioned, a decrease in velocity in the western part of the area A–B and an increase on the cast side (see Fig. 5). We believe the flow is rotating slightly and is moving faster as a result of thicker ice on the deep bedrock on the east side. Along the mountain ridge, both velocity fields show that the ice flows like a block (see Fig. 5). This indicates that the bedrock forms a smooth channel along the mountain ridge. The ice is not deformed as it flows along Goldschmidtfjella. When it reaches point B a bump in bedrock can form new crevasses, and further down the widening of the glacier gives a velocity/strain field which could open these longitudinal crevasses.
Conclusions
Preprocessing by high-pass filtering of the images gives an improvement in the estimate of the correlation R, because spatial and time variations in the surface reflection and illumination have been removed. It gives a more accurate determination of R when the aim is to recognize the highfrequency pattern of the crevasses. Filtering gives correlation surfaces with sleep, clearly defined peaks, and interpolating such surfaces gives improved sub-pixel accuracy. A velocity field could be determined with 1 month separation of the images for the whole glacier, but with 1 year separation only for a restricted zone without deformation.
The use of digital photogrammetry for extraction of terrain models was very useful on this surging glacier, as crevasses develop on the whole glacier surface, creating a good radiometric contrast for matching of similar points in the stereo model. An accurate net of geodetic ground-control points detectable in the images creates the possibility of extracting valuable information from the glacier surface.
The glacier surface geometry has changed from 1966 to 1990 in the same way as seen on several surging glaciers, with a reduction of the longitudinal slope. The surface was lowered up to 100 m in the accumulation area.
The velocity field from 1988 is similar to that found for the continuously fast-moving tidewater glacier Kronebreen. No distinct zones of compressive flow seem to be present. The rapid terminus advance, the velocity field and the crevasse pattern do not fit the models for terminus advance of surging glaciers described by Hodgkins and Dowdeswell (1994). The 1990 DEM gives no evidence of a surge front, which could be seen as a topographic bump. The rapid advance of the terminus, together with development of transverse crevasses in the upper accumulation area within a 6 month period, may indicate that the surge developed not as a compression zone traveling downstream, but as a zone of extension starting near the terminus traveling quickly upstream. The crevasse pattern in the images is interpreted as a result of the extension zone traveling upstream to the upper accumulation area, and as the whole glacier starts to slide, the crevasse pattern changes according to the bedrock topography.
Acknowledgements
We thank J. Kohler for discussing the methods. J. A. Dowdeswell and an anonymous reviewer contributed very helpful comments and suggestions on the manuscript.