INTRODUCTION
Nitrogen (N) is an essential mineral nutrient required in high concentrations for plant growth, high grain yield and quality (Koutroubas et al. Reference Koutroubas, Antoniadis, Fotiadis and Damalas2014). Among agricultural inputs, N fertilizer is a key concern. Currently, there is a change in global N supply and demand dynamics because of increasing consumption and high prices (FAO 2015). Since it is affecting agricultural production in developed countries where high yield is associated with increasing N fertilizer usage, it could be a serious constraint to production potential in developing countries where limiting production factors prevail (Beatty et al. Reference Beatty, Anbessa, Juskiw, Carroll, Wang and Good2010; Bingham et al. Reference Bingham, Karley, White, Thomas and Russell2012).
In newly reclaimed sandy soils, high use of N fertilizers characterizes intensive cultivation systems, which is never optimum in terms of economic and ecological benefits. In wheat, estimates on a global scale suggest that approximately 0·40–0·60 of the N applied to agricultural fields is recovered in the crop and its residues (Kirda et al. Reference Kirda, Derici and Schepers2001; Barraclough et al. Reference Barraclough, Howarth, Jones, Lopez-Bellido, Parmar, Shepherd and Hawkesford2010). The heavy application of nitrogenous fertilizers along with uncontrolled irrigation practices result in losses of N by leaching, denitrification, volatilization and runoff (Sylvester-Bradley & Kindred Reference Sylvester-Bradley and Kindred2009). This results in substantial financial waste and environmental pollution with nitrate, leading to negative impacts on human health (Cossani et al. Reference Cossani, Thabet, Mellouli and Slafer2011; Liu et al. Reference Liu, Zhang, Han, Tang, Shen, Cui, Vitousek, Erisman, Goulding, Christie, Fangmeier and Zhang2013). Therefore, two widely supported measures for alleviating these risks are either using careful N management for crop production or using high N use efficiency (NUE) genotypes (Wang et al. Reference Wang, An, Hu, Li, Zhang, Jia and Tong2011; Meng et al. Reference Meng, Yue, Hou, Cui and Chen2016).
To facilitate the elimination of N as a variable, genotypic selection is usually conducted with high N input (Gaju et al. Reference Gaju, Allard, Martre, Snape, Heumez, LeGouis, Moreau, Bogard, Griffiths, Orford, Hubbart and Foulkes2011; Cormier et al. Reference Cormier, Foulkes, Hirel, Gouache, Moënne-Loccoz and Le Gouis2016). However, this could be masking the efficiency differences among genotypes in accumulating and utilizing N in grain production. Consequently, more attention should be paid towards the inclusion of genotypic selection at low N, which is a condition not often prioritized by plant breeders (Sylvester-Bradley & Kindred Reference Sylvester-Bradley and Kindred2009).
Nitrogen use efficiency can be defined as the grain yield achieved per unit of available N supplied from soil or applied fertilizers. It can be divided into two main components: (i) nitrogen uptake efficiency (total-NUpE); crop above-ground N uptake per N unit available from soil and fertilizer, and (ii) nitrogen utilization efficiency (grain-NUtE); grain yield per plant N uptake at harvest (Moll et al. Reference Moll, Kamprath and Jackson1982).
Many studies have been performed with wheat to investigate genotypic variation at different N levels regarding NUE as well as the contribution of total-NUpE and grain-NUtE to improve NUE (Barraclough et al. Reference Barraclough, Howarth, Jones, Lopez-Bellido, Parmar, Shepherd and Hawkesford2010; Gaju et al. Reference Gaju, Allard, Martre, Le Gouis, Moreau, Bogard, Hubbart and Foulkes2014; Nguyen et al. Reference Nguyen, Panozzo, Spangenberg and Kant2016; Arata et al. Reference Arata, Lerner, Tranquilli, Arrigoni and Rondanini2017) and to assess the correlation between NUE parameters and grain yield in wheat (Wang et al. Reference Wang, An, Hu, Li, Zhang, Jia and Tong2011; Mahjourimajd et al. Reference Mahjourimajd, Kuchel, Langridge and Okamoto2016; Guttieri et al. Reference Guttieri, Frels, Regassa, Waters and Baenziger2017).
Genotypes can differ in NUE as a result of differences in N uptake (Rodgers & Barneix Reference Rodgers and Barneix1988) and N remobilization (Van Sanford & MacKown Reference Van Sanford and MacKown1986). At a single N-rate, Van Sanford & MacKown (Reference Van Sanford and MacKown1986) found that total-NUpE accounted for 0·54 of the variation in NUE in 25 genotypes. Similarly, Le Gouis et al. (Reference Le Gouis, Béghin, Heumez and Pluchard2000) studied 20 genotypes in wheat and obtained significant genetic variability in total-NUpE at high and low N, which accounted for 0·64 and 0·30 of the variation in NUE at both N levels, respectively. This could explain the decreased NUtE and consequently reduced NUE in modern wheat varieties with higher total-NUpE observed in high biomass genotypes (Feil Reference Feil1992). On the contrary, Barraclough et al. (Reference Barraclough, Howarth, Jones, Lopez-Bellido, Parmar, Shepherd and Hawkesford2010) reported that the genetic variation in NUE was associated mainly with differences in grain-NUtE rather than total-NUpE at different N rates. Recently, Asplund et al. (Reference Asplund, Bergkvist and Weih2014) reported higher total-NUpE in the field and higher grain-NUtE in the greenhouse with similar overall NUE in the two environments. Genotypic ranking, concerning NUE and total-NUpE, was similar in both field and greenhouse studies, but was different regarding grain-NUtE.
The aim of the present study was to evaluate the relative genotypic performance (grain yield and its components) as well as NUE, N-uptake (total-NUpE), N-utilization efficiency (grain-NUtE), nitrogen agronomic efficiency (NAE), nitrogen physiological efficiency (NPE), apparent nitrogen recovery (ANR) and grain yield response analysis of 16 wheat genotypes (Triticum aestivum) differing in their relative yield potential and grain quality under different N fertilization conditions in sandy soils.
MATERIALS AND METHODS
Experimental site and treatments
Two field experiments were carried out within a region of cereal production systems, at El-Khatara experimental farm, Faculty of Agriculture, Zagazig University, Egypt (30°36′N, 32°16′E), during the 2014/15, and 2015/16 growing seasons. Sowing date was 21 November in both seasons, which is considered within the optimal period for wheat cultivation in the area. Standard agronomic practices including pest, disease and weed control, sprinkler irrigation, and potassium and phosphate fertilizers were applied as recommended for wheat production in the region.
Genotypes and nitrogen regimes
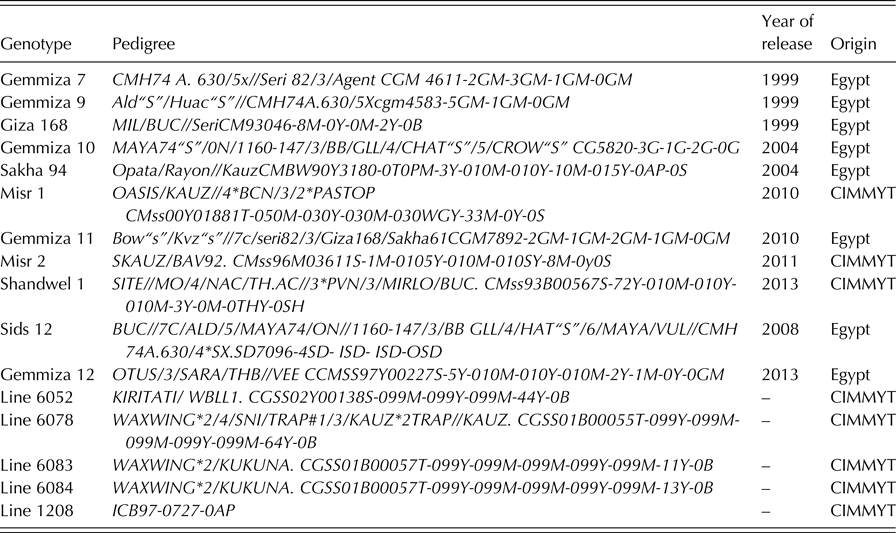
Sixteen spring bread wheat genotypes (T. aestivum L.) were grown each year (Table 1). These genotypes represented a subset of an elite genetic material differing in their yield and quality potentials. There were 11 genotypes, which appear in the Egyptian recommended list, together with five CIMMYT advanced breeding lines. The 16 genotypes were grown at five levels of N fertilizer. The experimental design was split-plot with three replications in which the N level was randomized in the main plots and genotypes were randomized in sub-plots. Each plot consisted of six rows with rows 0·2 m apart and 4-m long and seeding rate was 350 seeds/m2. N levels were 0, 70, 140, 210 and 280 kg/ha N of ammonium sulphate (20·5% N). To avoid leaching (as the soil is sandy, 94·18% sand), each N treatment was applied equally in seven splits at 10-day intervals after sowing.
Name, pedigree, year of release and origin of the 16 spring wheat genotypes used in this study

Soil sampling
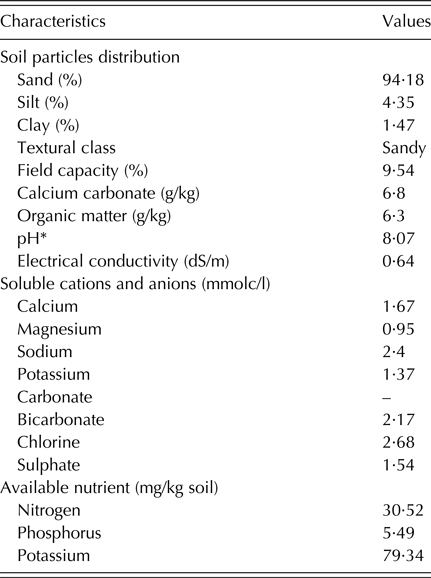
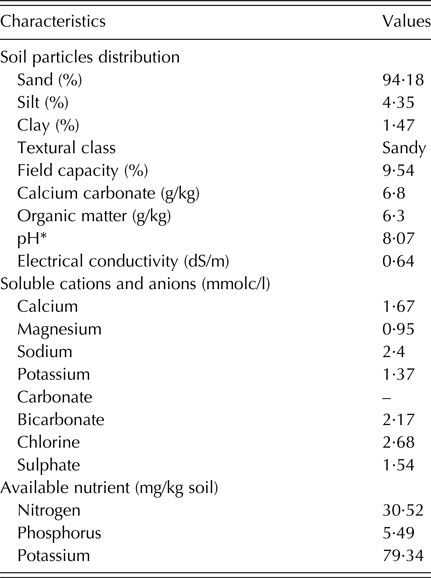
Soil was sampled, before fertilizer was applied, for the analysis of physical and chemical properties (Table 2). Three cores were taken from random positions across the field. Particle size analysis (PSA) was performed using the pipette method according to Pansu & Gautheyrou (Reference Pansu and Gautheyrou2006). The loss on ignition method was used to determine soil organic matter (Davies Reference Davies1974). Soluble cations and anions were measured using Jackson (Reference Jackson2005). Available phosphorus was determined according to Watanabe & Olsen (Reference Watanabe and Olsen1965). Soil mineral N concentration was determined shortly before N application. Samples were taken from plots at four locations along two opposing diagonals at a depth of 0–30 cm. Available N was determined using the method described by Black et al. (Reference Black, Evans, White, Ensminger and Clark1965).
Soil physical and chemical properties of the experimental site
Crop measurements
Data were collected on grain yield and its components (number of spikes/m2, number of grains per spike and thousand-grain weight). Additional measurements were taken on plant height and above-ground dry matter. Plant height was measured from the soil surface to the top of the spike. The above-ground dry matter was collected and plant material was dried until constant weight and weighed. The number of spikes was counted in 0·5 m2 at maturity, from two areas per plot. The number of grains per spike was determined by the average count of grains on spikes after harvest. Thousand-grain weight was estimated from the weight of three sets of 1000 grains. Grain yield (dried seed with 14% moisture content) was determined as the weight of grains harvested per plot and converted into kg/ha.
Shortly before harvest, plant samples were taken from all plots to determine total N in straw and grains. Twenty shoots, cut at the ground level, were chosen randomly from each plot. Spikes and remaining straw (stems and leaves) were separated, dried at 70 °C for 72 h until constant weight. Wet digestion was done using a mixture of perchloric acid (HClO4) and sulphuric acid (H2SO4) (Piper Reference Piper1950). Total N content was determined using the micro-Kjeldahl method according to Jackson (Reference Jackson1973). Nitrogen uptake in straw and grains were determined. Grain N uptake (kg/ha) was calculated by multiplying total grain yield by grain N percentage.
Calculation of nitrogen use efficiencies attributes
Nitrogen use efficiency was considered as the ratio of grain yield to available N from the soil and applied fertilizer. Nitrogen uptake efficiency (total-NUpE) was calculated as the ratio of above-ground N uptake to amount of available N from the soil and fertilizer. Nitrogen utilization efficiency (grain-NUtE) was calculated as the ratio of grain yield to above-ground N uptake (Moll et al. Reference Moll, Kamprath and Jackson1982). Nitrogen agronomic efficiency (kg/kg) was calculated according to Craswell & Godwin (Reference Craswell and Godwin1984) as the ratio of (grain yield at N x – grain yield at N0) to applied N at N x . Physiological efficiency (NPE, kg/kg) was calculated as the ratio of (grain yield at N x – grain yield at N0) to (Ng uptake at N x – Ng uptake at N0) (López-Bellido & López-Bellido Reference López-Bellido and López-Bellido2001). Apparent nitrogen recovery (%) was calculated as the ratio of (grain nitrogen uptake at N x – grain nitrogen uptake at N0) to applied N at N x (Delogu et al. Reference Delogu, Cattivelli, Pecchioni, De Falcis, Maggiore and Stanca1998).
The statistical analyses were performed using SAS software (version 9.2, SAS Institute, Cary, NC, USA). The differences among treatments for N levels (which were equally spaced) in the ANOVA were broken down into linear and quadratic contrasts, as well as deviation from regressions, to better describe the effect of increasing N level on the studied traits. When the interaction of genotype with N level was significant, linear model and quadratic-plateau regression model were applied using GraphPad Prism (version 5.00, GraphPad Inc., San Diego, CA, USA). The N-level response data were visually inspected, and the model was selected a statistically significant level (P ⩽ 0·05), with the largest coefficient of determination (R 2). Yield at optimum N level was determined.
RESULTS
Analysis of variance
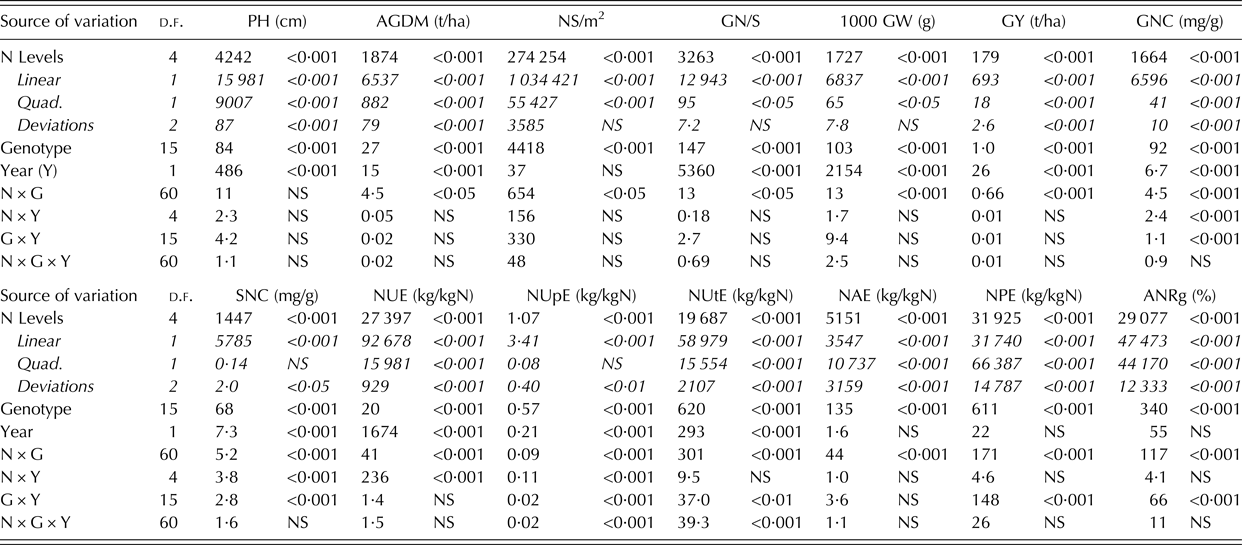
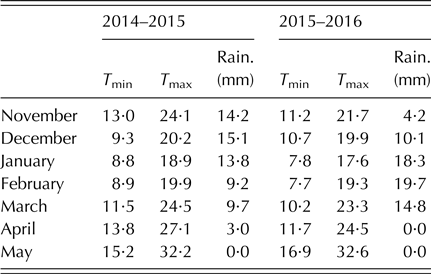
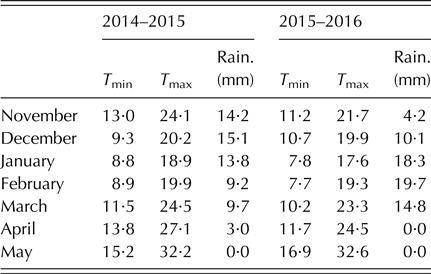
Analysis of variance (ANOVA) for N level, genotype, year and their interactions is presented in Table 3. Highly significant differences (P < 0·01) were observed among genotypes and N level for all investigated traits and tested parameters. The main effect mean squares magnitude suggests that grain yield and all other traits were more affected by N level than genotype. Furthermore, the ANOVA contrasts showed that increasing N levels presented a highly significant linear response (P < 0·01) for all traits and tested parameters. Most of the traits also showed a significant quadratic response (P < 0·05). The exceptions were straw N concentration and N uptake efficiency, where linear responses were significant (P < 0·01) but quadratic responses were not. In addition, the linear effect explained the largest proportion of variation due to N level, ranging from 0·75 to 0·99 for most of the studied traits and tested parameters, except N agronomic efficiency, N physiological efficiency and ANR, for which it captured <0·50. Although the N level × genotype interaction had a smaller magnitude than the N level and genotype main effects, the ANOVA mean squares showed significant genotype × N level interaction (P < 0·05) for all traits and parameters under investigation except plant height. This significant interaction indicated that genotypes performed differently at different N levels. Despite the significant difference between the two years due to weather conditions (Table 4), year × genotype, year × N level as well as year × genotype × N level interactions were not significant for the five main studied traits.
Analysis of variance (mean squares) of the studied traits for the 16 wheat genotypes grown at five nitrogen (N) levels
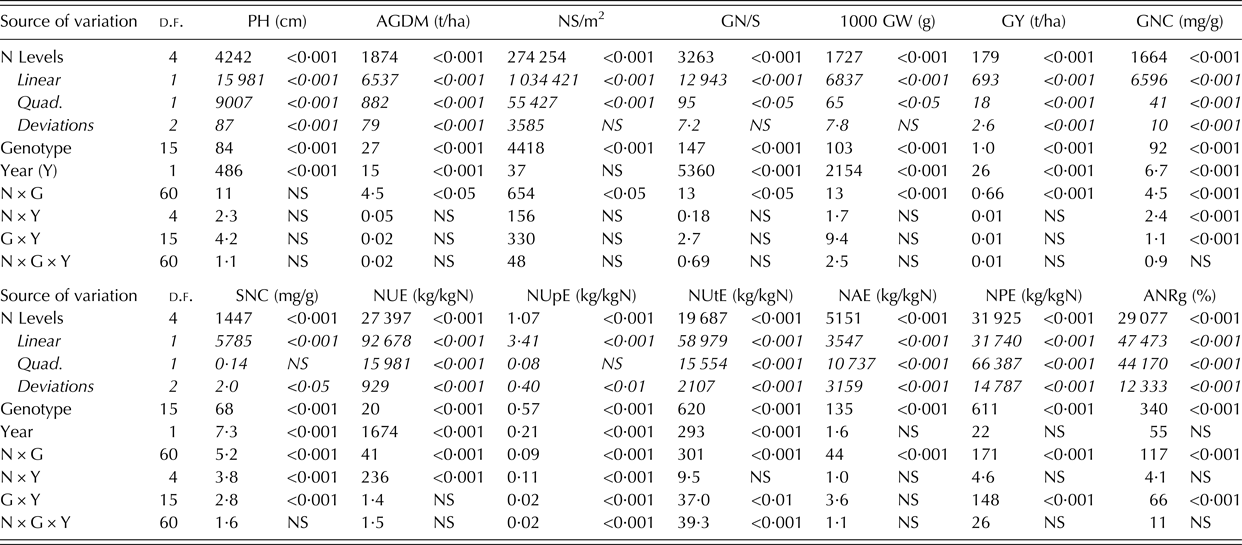
PH, plant height; AGDM, above-ground dry matter; NS/m2, number of spikes/m2; GN/S, number of grains per spike; 1000 GW, thousand-grain weight; GY, grain yield; GNC, grain N concentration; SNC, straw N concentration; NUE, N use efficiency; NUpE, N uptake efficiency; NUtE, N utilization efficiency; NAE, N Agronomic Efficiency; NPE, N physiological efficiency; ANRg, apparent nitrogen recovery, grain.
Meteorological data; minimum (Tmin), maximum (Tmax) monthly temperatures and rainfall (rain) for the two growing seasons at the experimental site
Plant height
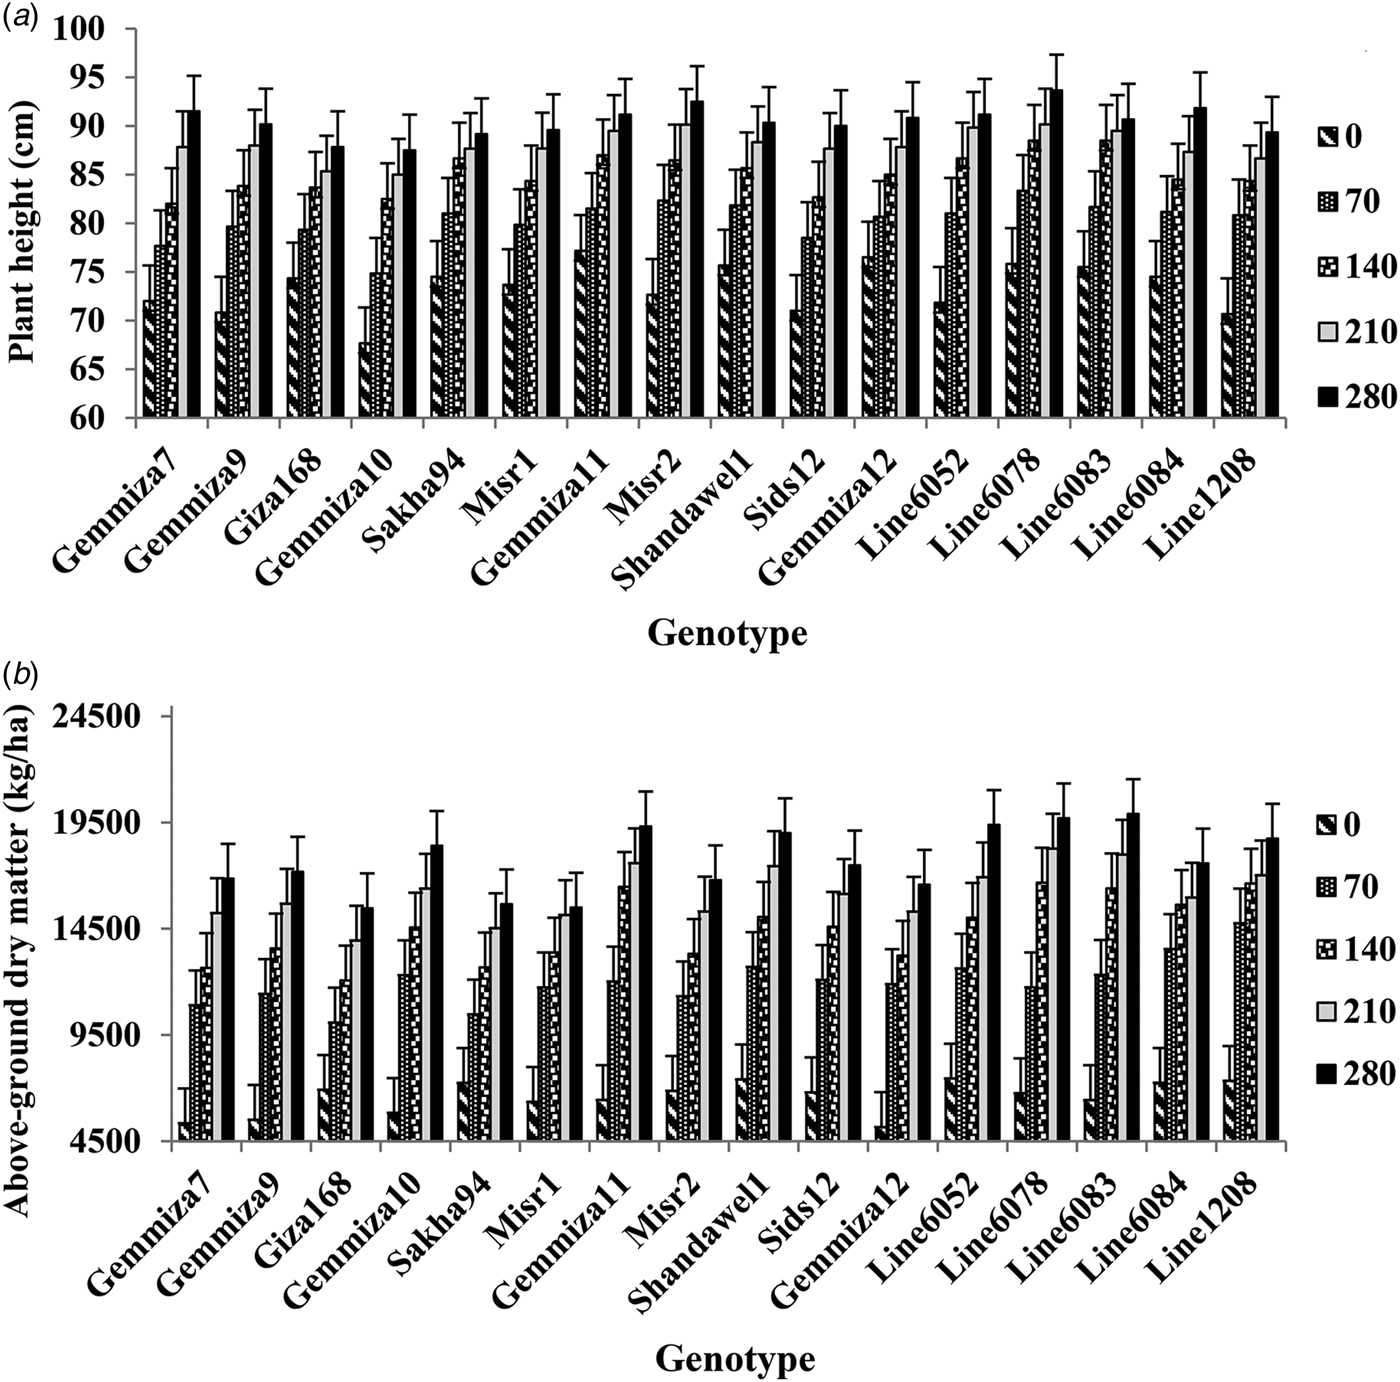
Plant height was significantly affected (P < 0·05) by N level ranging on average between 67·7 and 93·7 cm at N0 and N280, respectively. Nitrogen-deficient plants had shorter vegetative growth and a tendency for early maturity compared with well-nourished plants. Many genotypes were able to retain moderate height at N280 (Fig. 1(a)). Gemmiza 10 exhibited the lowest plant height at both N0 (67·7 cm) and N280 (87·5 cm). Also, Gemmiza 9, Misr 2 and Line 6052 showed the highest response to increasing N from N0 to N280 (19·3 cm). Giza 168 showed the lowest response regarding plant height at both N0 and N280 (74·3 and 87·8, respectively).
The effect of increasing N levels on (a) plant height and (b) above-ground dry matter for the 16 wheat genotypes over two growing seasons. The bars on the top of the columns represent the LSD (P < 0·05).

Above-ground dry matter
Nitrogen supply had a marked effect on the above-ground dry matter (Fig. 1(b)). Increasing N level resulted in a significant increase in dry matter, averaged across all genotypes between 5164·6 and 19 904·6 kg/ha. Despite Gemmiza 12 showing the lowest above-ground dry matter (5164·6 kg/ha), it exhibited the highest increase from N0 to N280 (68·8%). Line 6052 presented the highest above-ground dry matter at N0 (7453·8 kg/ha) and this response was almost tripled with increasing N fertilization to N280 (19 387·1 kg/ha). Gemmiza 10 and 11 showed the second and third greatest response to increasing N level from N0 to N280 (68·3 and 66·7%).
Grain yield components
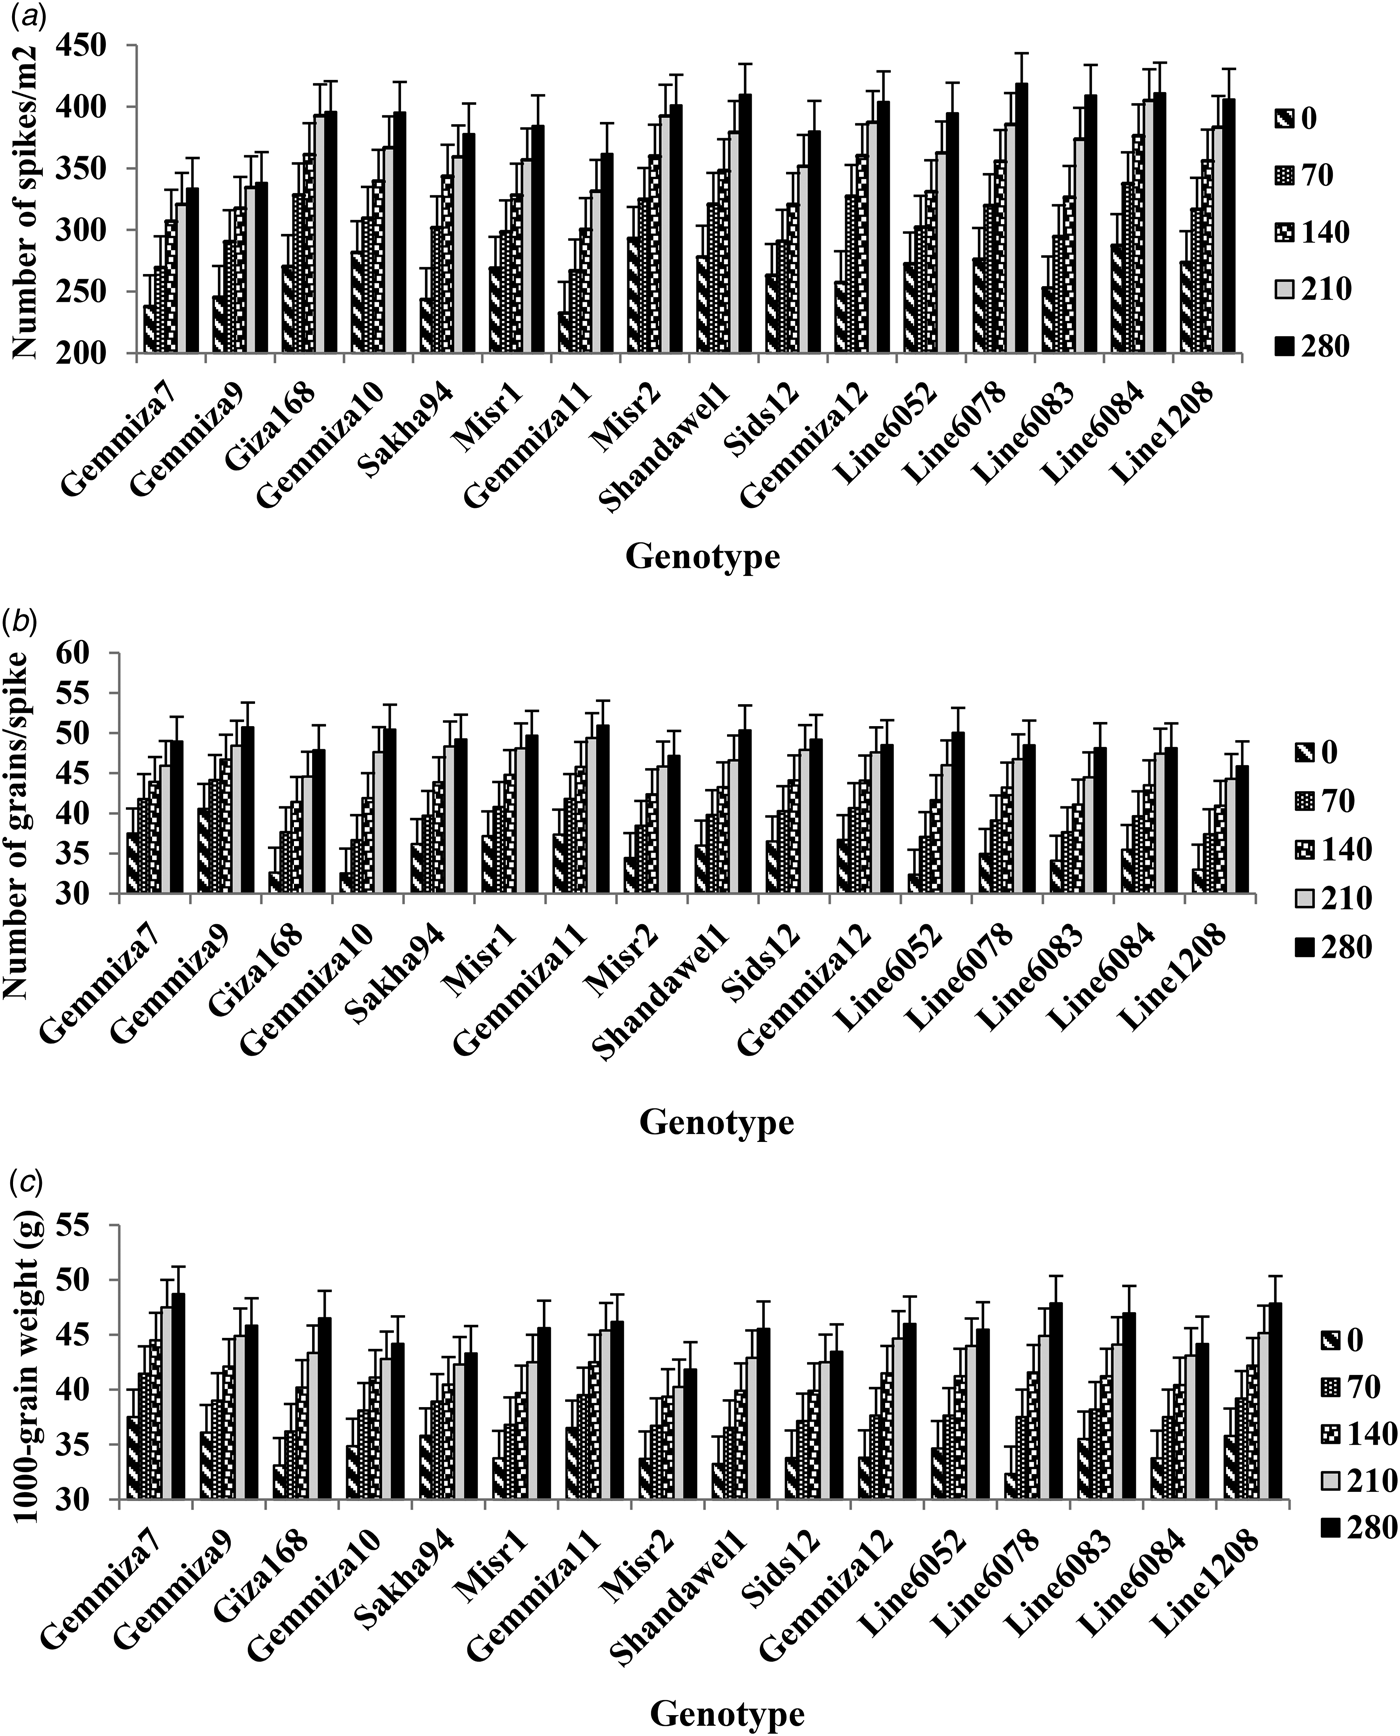
The amount of N significantly affected the total number of spikes/m2 (Fig. 2(a)). Data showed that the genotypes exhibited significant differences (P < 0·05) regarding the total number of spikes/m2 when the N level was increased to N280. The maximum number (418·6 spikes/m2) was achieved at N280 by Line 6078 followed by line 6084 (410·9 spikes/m2), Shandawel 1 (409·7 spikes/m2) and Line 6083 (409·1 spikes/m2). The lowest number (233·0 spikes) was recorded by Gemmiza 11 at N0, as well as showing a high increase from N0 to N280 (361·7 spikes with 35·6% increase), whereas the highest response was recorded by Line 6083 (38·1% increase).
The effect of increasing N level on (a) number of spikes/m2, (b) number of grains/spike and (c) 1000-grain weight (g) for the 16 wheat genotypes over two growing seasons. The bars on the top of the columns represent the LSD (P < 0·05).

Increasing N level from N0 to N280 significantly increased the number of grains/spike (Fig. 2(b)). At the highest two doses, the number of grains/spike did not differ significantly among most genotypes. At N280, Gemmiza 11 (50·9 grains/spike), Gemmiza 9 (50·7), Gemmiza 10 (50·4) Shandawel 1 (50·3) and Line 6052 (50·0) produced the highest number of grains/spike with no significant difference among them. Lines 6078, 6083 and 6084 showed medium/high number ranging between 48·1–48·5 grains/spike. Line 1208 exhibited the lowest grains/spike at N280 (45·9 grains/spike). The highest increase was observed by Gemmiza 10 and Line 6052 (35·5% increase) when N was raised to N280.
Thousand-grain weight was significantly affected by N level ranging between 32·3 and 48·7 g at different N levels (Fig. 2(c)). Higher levels of N produced heavier grains. Line 6078 showed the lowest thousand-grain weight at N0 (32·3 g) but the highest response at N280 (47·9 g; 32·5% increase). Gemmiza 7 presented the highest weight at both N0 and N280 (37·5 and 48·7 g, respectively). Gemmiza 11, Line 1208 and Line 6083 also presented high values at all N levels.
Grain and straw nitrogen concentration (mg/g)
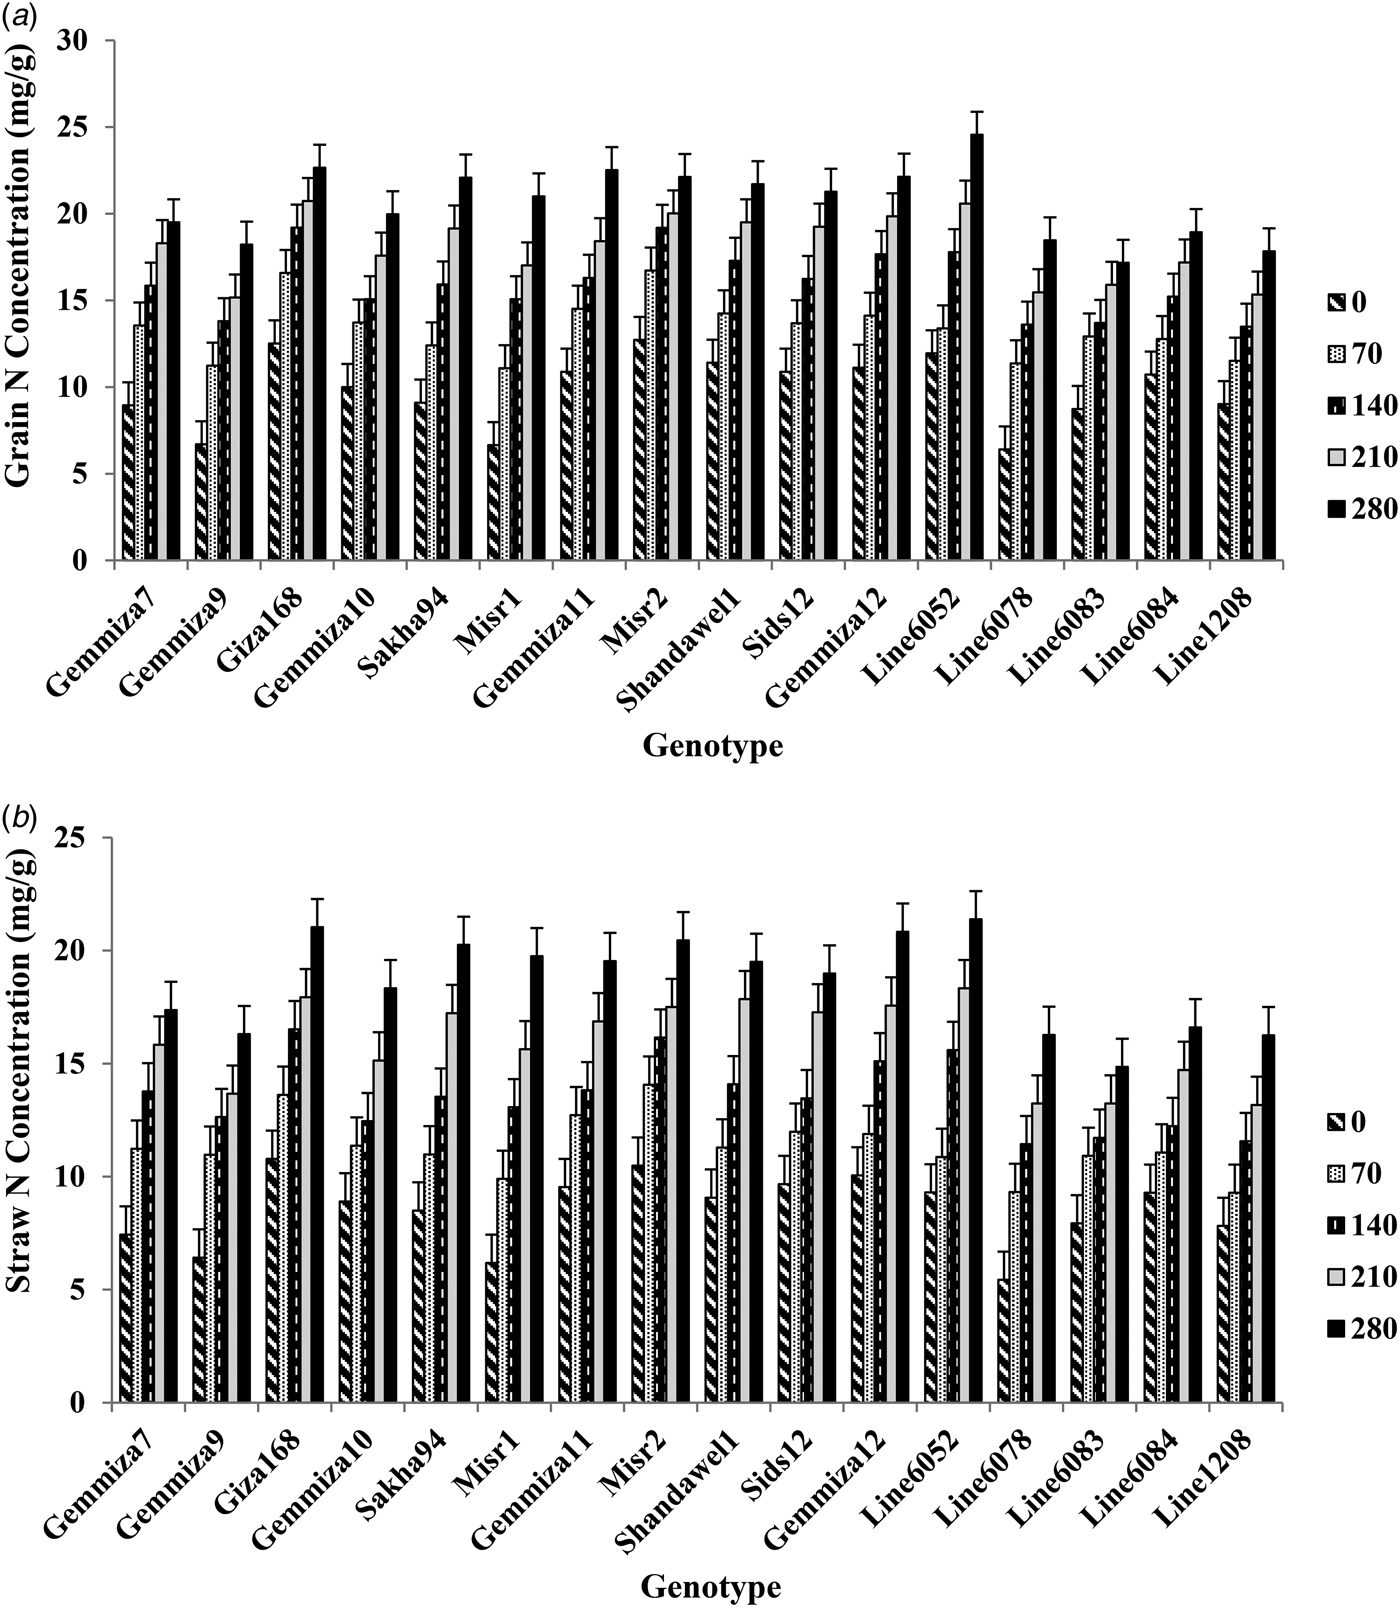
Different treatments significantly influenced N concentration in both grain and straw (Fig. 3(a ) and (b)). Data showed that grain and straw N concentrations (mg/g) were high with increasing N fertilizer levels up to 280 kg/ha. Grain and straw N concentrations were four times higher at N280 (24·6 and 21·4 mg/g, respectively) than at N0 (6·4 and 5·4 mg/g, respectively). Genotypes performed differently regarding N concentration in grain and straw depending on N level. At N280, Line 6052 had the highest concentrations (24·6 and 21·4 mg/g), along with Gemmiza 12 (22·1 and 20·8 mg/g) for both grain and straw, respectively. Similarly, Gemmiza 11 and Shandawel 1 presented high N concentrations for grain (22·5 and 21·7 mg/g, respectively) and straw (both 19·5 mg/g).
The effect of increasing N level on (a) Straw N concentration (mg/g) and (b) grain N concentration (mg/g) for the 16 wheat genotypes over two growing seasons. The bars on the top of the columns represent the LSD (P < 0·05).

Nitrogen use efficiency and its components
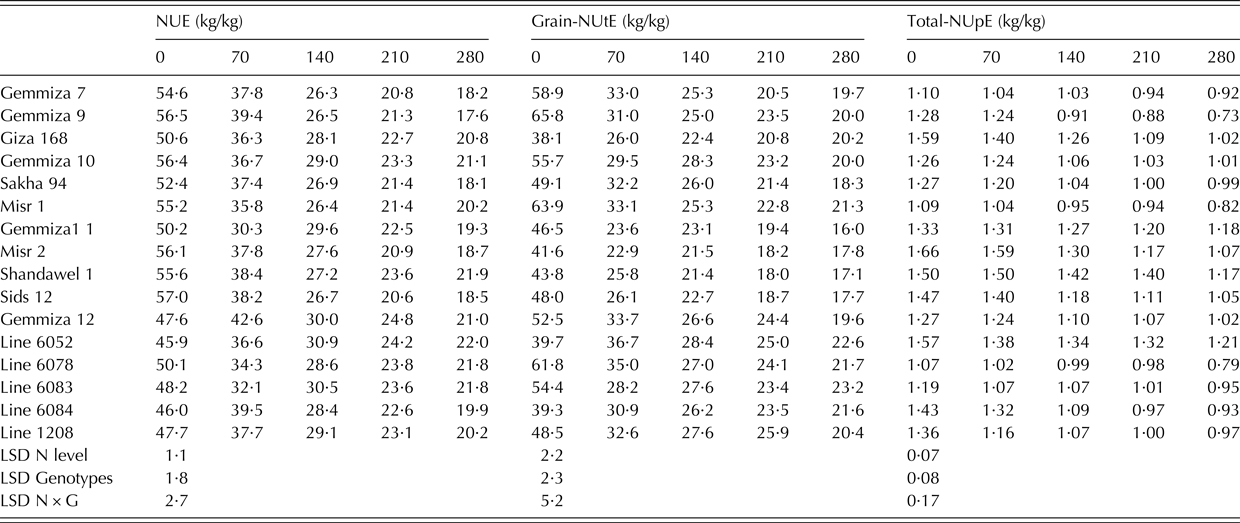
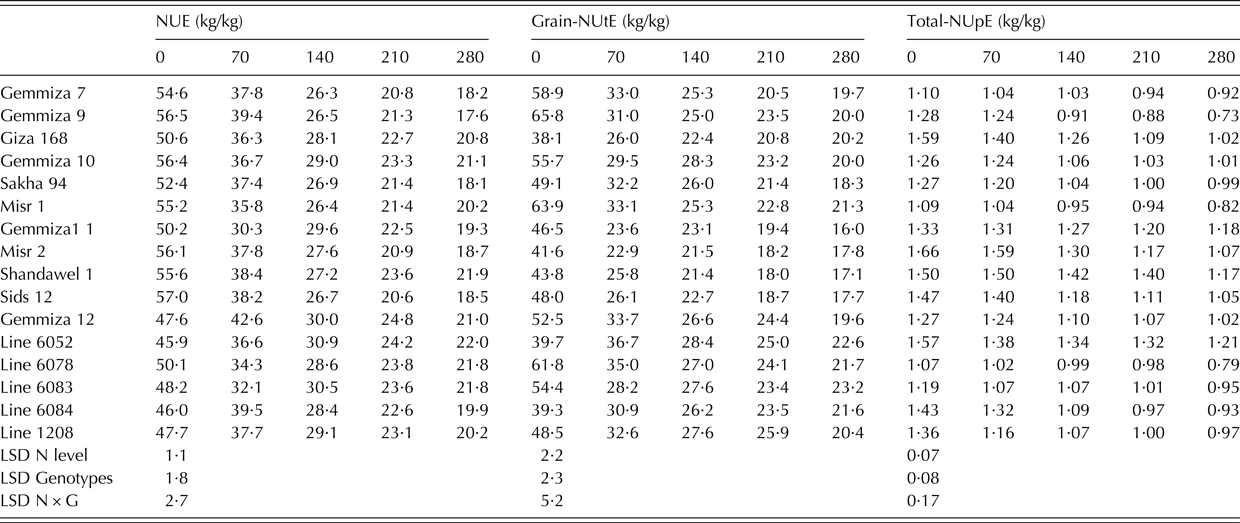
The two components of NUE (total-NUpE and grain-NUtE) varied significantly among genotypes at all N levels. NUE, total-NUpE and grain-NUtE were higher at low N levels (N0) than at the higher ones (N280) (Table 5). Nitrogen use efficiency ranged from 45·9 to 57·0 kg/kg at N0 and from 17·6 to 22·0 kg/kg at N280. Furthermore, total-NUpE ranged from 1·07 to 1·66 kg/kg at N0 and from 0·73 to 1·21 kg/kg at N280 and grain-NUtE ranged from 39·3 to 65·8 kg/kg at N0 and from 16·0 to 23·2 kg/kg at N280. Genotypes showed significantly different response to increasing N. Despite that Line 6052 presented the lowest NUE (45·9 kg/kg) at N0 but it had the highest value at N280 (22·0 kg/kg), while Shandawel 1, Line 6083, Line 6078, Gemmiza 10 and Gemmiza 12 were ranked among the highest at N280 (21·9, 21·8, 21·8, 21·1 and 21·0 kg/kg, respectively). The results of NUE were consistent with grain-NUtE and total-NUpE as the increase in N fertilization decreased both parameters significantly (P < 0·05) in all genotypes. The range of variation between genotypes was higher in grain-NUtE than in total-NUpE. Line 6052, Line 6078, Line 6083, Gemmiza 12 and Gemmiza 10 had a high grain-NUtE without N (39·7, 61·8, 54·4, 52·5 and 55·7 kg/kg, respectively) compared with 280 kg N (22·6, 21·7, 23·2, 19·6 and 20·0 kg/kg). Similarly, Line 6052, Line 6078, Line 6083, Gemmiza 12 and Gemmiza 10 in the N0 treatment had the lowest total-NUpE (1·57, 1·07, 1·19, 1·27 and 1·26 kg/kg, respectively) compared with the highest level N280 (1·21, 0·79, 0·95, 1·02 and 1·01 kg/kg, respectively).
Nitrogen use efficiency (NUE; kg/kg), nitrogen utilization efficiency (grain-NUtE; kg/kg), and nitrogen uptake efficiency (total-NUpE; kg/kg) mean values for genotypes by nitrogen level interactions, averaged over the two seasons
Nitrogen agronomic efficiency, nitrogen physiological efficiency and apparent nitrogen recovery
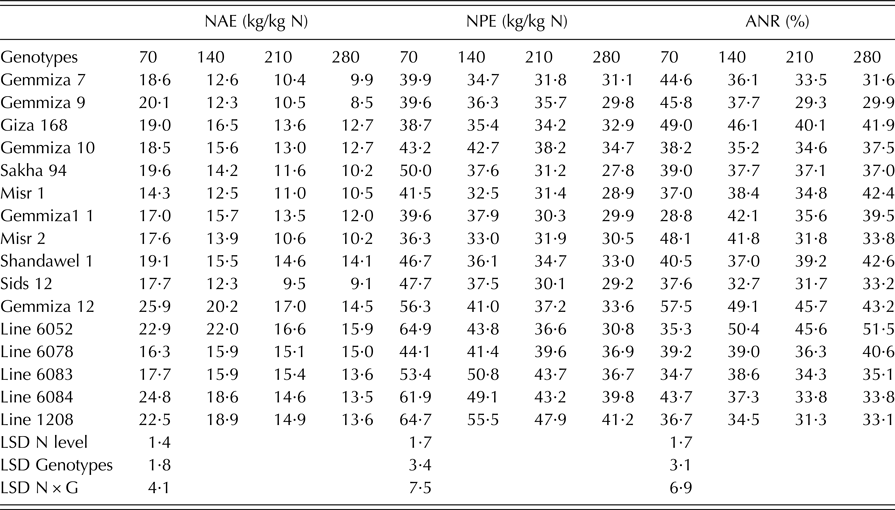
The three efficiencies, NAE, NPE and ANR (Table 6), decreased with increasing N level ranging from 14·3 to 25·9 kg/kg, 36·3 to 64·9 kg/kg and 28·8 to 57·5%, respectively, at N70, and from 8·5 to 15·9 kg/kg, 27·8 to 41·2 kg/kg and 29·9 to 51·5%, respectively, at N280. Variations in NAE appeared to result from differences among genotypes as well as N levels. The maximum NAE was exhibited by Line 6052 and Gemmeiza 12 (not significantly different) referring that increasing N enhanced grain yield by 22·9 and 25·9 kg grains/kg N, respectively at N70. On the other hand, supplying plants with 280 kg N/ha produced lower grain yield per unit of N increase recording NAE which reached 15·9 and 14·5 kg grains/kg for both genotypes respectively.
Nitrogen agronomic efficiency (NAE, kg/kg), nitrogen physiological efficiency (NPE, kg/kg) and apparent nitrogen recovery (ANR, %); mean values for genotypes by N level interactions averaged over the two seasons
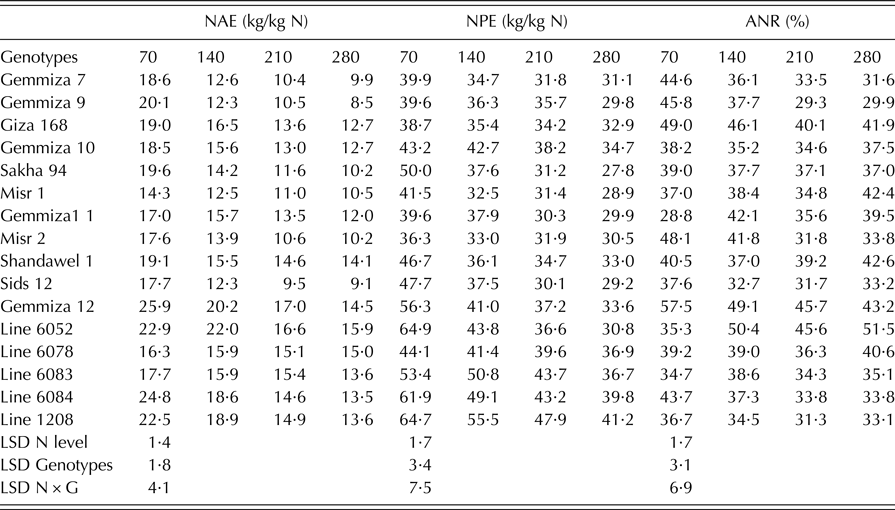
Variation of the physiological efficiency of nitrogen (NPE) was found among the studied genotypes and N levels: NPE was higher at N70 and decreased with increasing N level to N280. In the current study, treatments with low N level, e.g. N70 resulted in NPE values from 36·6 (Misr 2) to 64·90 (Line 6052) kg/kg. Meanwhile, with high N level e.g., N280, NPE values ranged between 27·8 (Sakha 94) and 41·2 (Line 1208).
Apparent N recovery was influenced by N application in all studied genotypes, ANR values were 28·8–57·5% throughout the N levels. The highest ANR (57·5%) was recorded by Gemmiza 12 at N70, while the lowest (28·8%) was obtained by Gemmiza 11 at N70.
Grain yield
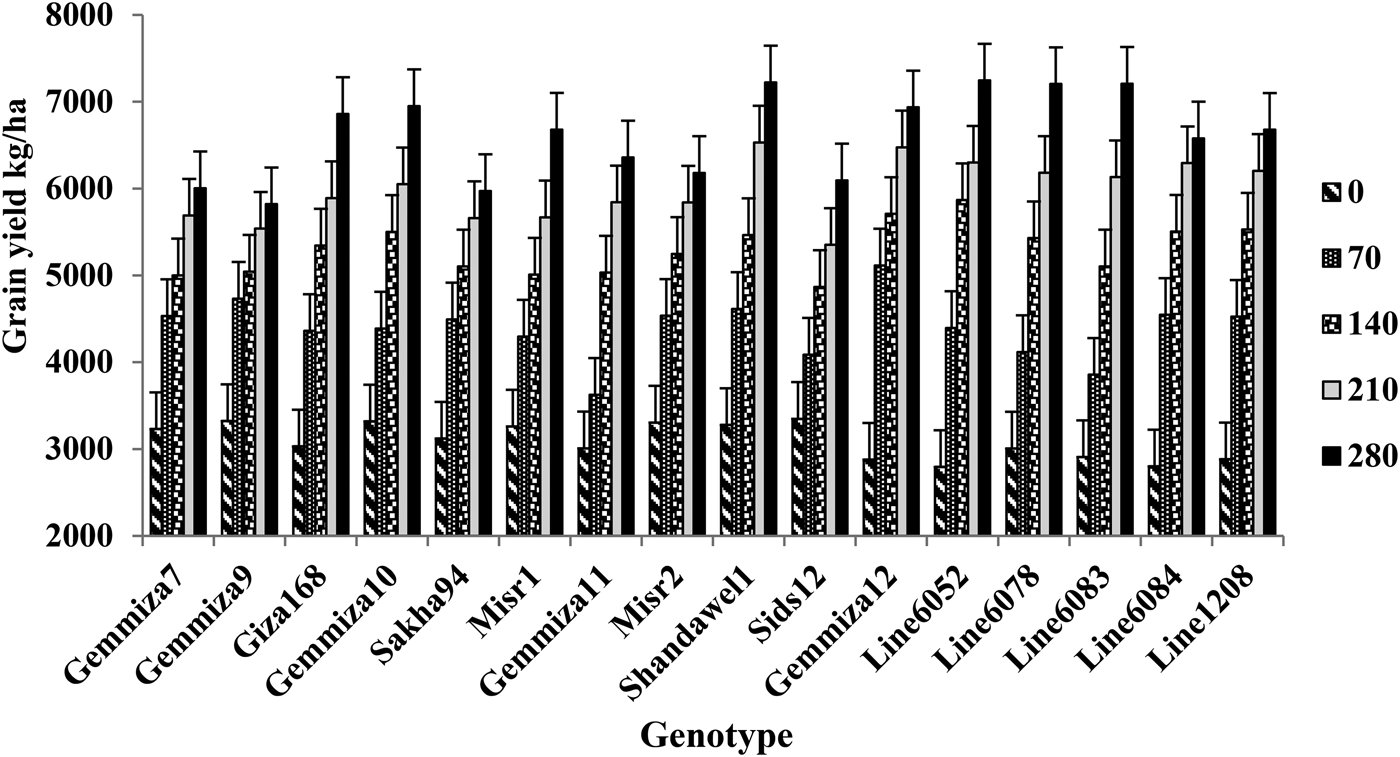
Grain yield was significantly influenced (P < 0·05) by the effects of N level and genotype (Fig. 4). There were large yield increases in the fertilized plots compared with the non-fertilized ones. The highest grain yield increase occurred at N280, which had the highest mineral N availability. Grain yield was doubled, on average, from 2794 kg/ha at N0 to 7245 kg ha kg/ha at N280 when averaged across all genotypes (Fig. 4). Genotypes showed different trends in their response to increasing N levels. The highest grain yield at N0 was observed in Sids 12 (3348 kg/ha) and it presented moderate grain yield at N280 (6094 kg/ha, 45·1% increase). Although Line 6052 showed the lowest grain yield at N0 (2794 kg/ha), it presented the highest grain yield at N280 (7245 kg/ha, 61·4% increase), and therefore, it is considered the most responsive, followed by Line 6083 (59·6% increase), Gemmiza 12 (58·4% increase), Line 6078 (58·2% increase), Line1208 (56·8% increase), Giza168 (55·8% increase) and Shandawel 1 (54·6% increase), while the lowest increase was exhibited by Gemmiza 9 (42·9% increase). This indicates yield potential differences in the genetic background of the genotypes. Genotypes Gemmiza 7, Gemmiza 9, Sakha 94, Misr 2 Gemmiza 12 and Line 6084 showed no significant difference in grain yield between N210 and N280.
The effect of increasing N level on grain yield kg/h for the 16 wheat genotypes over two growing seasons. The bars on the top of the columns represent the LSD (P < 0·05).

Correlation between grain yield and nitrogen use efficiency parameters
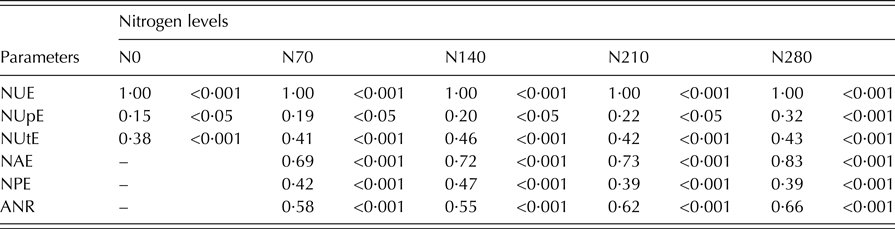
Grain yield had a highly significant (P < 0·01) relationship with NUE and its two components (Table 7). Grain yield was significantly correlated (P < 0·05) with grain-NUtE (r = 0·38–0·46) more than total-NUpE (r = 0·15–0·32). Also, NAE (r = 0·69–0·83), NPE (r = 0·39–0·47) and ANR (r = 0·55–0·66) were significantly associated (P < 0·05) with grain yield.
Correlation coefficients between grain yield and nitrogen use efficiency parameters for the 16 wheat genotypes at five nitrogen levels
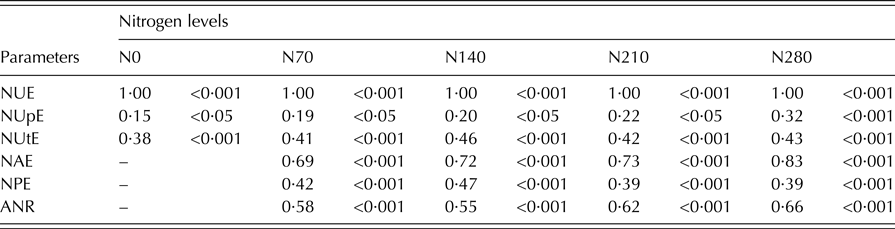
NUE, N use efficiency; NUpE, N uptake efficiency; NUtE, N utilization efficiency; NAE (N agronomic efficiency; NPE, N physiological efficiency; ANRg , apparent nitrogen recovery, grain.
Grain yield response analysis
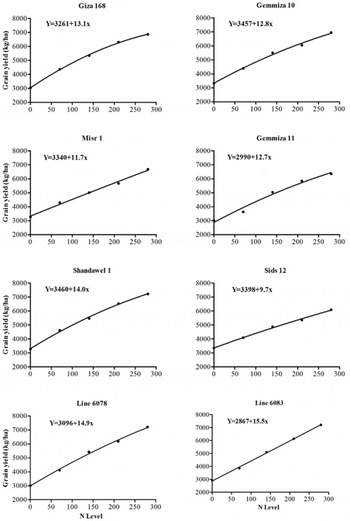
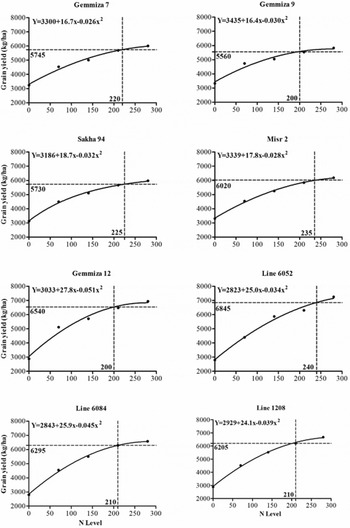
There was a significant interaction between genotype and N level (Table 3). The genotypes Giza 168, Gemmiza 10, Misr 1, Gemmiza 11, Shandawel 1, Sids 12, Line 6078 and Line 6083 showed linear non-diminishing responses (Fig. 5). In contrast, the other genotypes exhibited quadratic convex response (Fig. 6). Furthermore, the optimum N level ranged from 200 to 240 kg/ha, which produced grain yield ranged from 5540 to 6845 kg/ha. The optimum N level indicated that Line 6052 and Misr 2 had the highest values, while Sakha 94, Gemmiza 7 had intermediate and Gemmiza 12, Gemmiza 9, Line 6084 and Line 1208 had the lowest values (Fig. 6). Moreover, Gemmiza 12, Line 6084 and Line 1205 presented the highest yield at optimum N, followed by Line 6052, Gemmiza 9 and Gemmiza 7, while Misr 2 and Sakha 94 were the lowest ones.
Grain yield response to nitrogen fertilization level for the eight genotypes presented linear response (the symbols present the actual grain yield).

Grain yield response to nitrogen fertilization level and identifying optimum level for the eight genotypes presented quadratic response (the symbols present the actual grain yield and the dotted vertical lines indicate the optimum nitrogen).

DISCUSSION
Using genotypes that are able to recover more N and use this recovered N to accumulate more grain yield is economically and environmentally important. Increasing N uptake and utilization decreases N loss, particularly under high fertilization conditions, which minimizes environmental pollution risks. In Egypt, farmers’ experience indicates that sandy soil suffers from lack of available mineral elements, particularly N, and consequently low yield. Therefore, they tend to apply high N doses up to 280 kg N/ha for wheat production.
In the present study, 16 elite wheat genotypes (T. aestivum) were used to evaluate the grain yield and its components and to determine the relative performance concerning NUE, N-uptake (total-NUpE), N-utilization efficiency (grain-NUtE) under five N levels in sandy soils. Nitrogen agronomic efficiency, NPE, apparent N recovery (ANR) and grain yield response analysis were also determined.
High N supply resulted in higher net assimilation rate (Sage & Pearcy Reference Sage and Pearcy1987), more productive tillers (Wilhelm Reference Wilhelm1998), increase in the number of spikes per unit area (Ayoub et al. Reference Ayoub, Guertin, Lussier and Smith1994), number of grains per spike (Ibrahim et al. Reference Ibrahim, Bakry, Thalooth and El-Karamany2014), biological yield (Karrou & Maranville Reference Karrou and Maranville1993) and grain yield (Al-Abdulsalam Reference Al-Abdulsalam1997). Five N levels effectively differentiated genotypes with varying responsiveness to N fertilization, exhibiting a clear significant linear response for most of the traits under investigation. Significant genotypic variations were found for grain yield and its components, and NUE parameters at different N levels. The genotypes showed different ranking of response to N levels as well as different trends of decrease with each increase in those levels. The genotypes, i.e. Shandawel 1, Gemmiza 10, Gemmiza 12, Giza 168, Line 6052 Line, 6078 and Line 6083 presented high grain yield and considerable differences between N levels compared with the other genotypes. High grain yield of these genotypes was associated with the positive effects of considerable dry matter, yield components as well as extensive N concentration in grain and straw and, hence high NUE, NUtE, NUpE, NAE, NPE and ANR parameters. This indicates that these genotypes use N more efficiently and they have good ability to progress tillering, resulting in greater spike population and consequently increased grain and straw yields. Therefore, commercial use of these genotypes in favourable environments and at high N levels could be recommended. Also, they could be used in wheat breeding programmes to improve N use efficiency. On the other hand, the genotypes Gemmiza 7, Gemmiza 9, Sakha 94, Misr 2 and Line 6084 responded similarly, with no significant differences beyond 140 kg N/ha regarding grain yield and its components, indicating the possibility of reducing the application of N fertilizer without compromising grain yield. Thus, they could be recommended for environments with lower N availability. Similar results regarding the significant variation between genotypes in grain yield, its components and NUE parameters at different N levels have been established by other researchers: Guarda et al. (Reference Guarda, Padovan and Delogu2004), Barraclough et al. (Reference Barraclough, Howarth, Jones, Lopez-Bellido, Parmar, Shepherd and Hawkesford2010), Sadras & Lawson (Reference Sadras and Lawson2013), Ruisi et al. (Reference Ruisi, Frangipane, Amato, Frenda, Plaia, Giambalvo and Saia2015), Nguyen et al. (Reference Nguyen, Panozzo, Spangenberg and Kant2016) and Todeschini et al. (Reference Todeschini, Milioli, Trevizan, Bornhofen, Finatto, Storck and Benin2016).
Useful information could be obtained from the response curves that the genotypes presented a linear non-diminishing response could be used in favourable environments and high N levels. On the other hand, the N level 280 kg/ha could be considered the highest for the genotypes that showed quadratic response and any increase in applied N will not add any further significant increase in grain yield. These results were in line with the optimum N level, which was identified for these genotypes and ranged from 200 to 240 kg/ha. Additionally, the response equations clearly indicated the efficiency of some genotypes under N deficiency conditions where they recorded higher grain yield than the average without N fertilization (3172 kg/ha). The most efficient in this respect was Shandwel 1 followed by Gemmiza 10, Gemmiza 9, Sids 12, Misr 1, Misr 2, Gemmiza 7, Giza 168 and Sakha 94. These genotypes presented the highest NUE, NUtE and NUpE at N0. This indicates that the N use efficiency parameter results were in agreement with those obtained from the response equations, and denote their validity in evaluating yield potential in wheat. Accordingly, these traits could assist plant breeders and agronomists in selecting high yielding wheat genotypes under poor, moderate and rich fertilization levels.
Genotypic evaluation under low and high N levels is important. Some genotypes could present high NUE, high N response and high grain yield under N deficiency. However, under high N levels, they produce very low yield (such as Gemmiza 9). These genotypes are considered less N responsive, and they could be recommended under lower N availability conditions. At the same time, other genotypes could produce high yield under low as well as under high N levels, e.g. Shandawel 1. These genotypes are considered N efficient and N responsive and could be recommended for both low and high N levels.
The significant and positive correlation between grain yield and most of the N use efficiency parameters shows the importance of these traits in wheat plant breeding programmes as well as in varietal response to N fertilization recommendations under sandy soil conditions. Since grain yield was correlated with NUtE more than NUpE, it was found that NUtE was more important in defining grain yield. Therefore, it could be considered an important parameter to aid breeders in selecting genotypes possessing high-yielding potential capable of exploiting N inputs more efficiently. Similarly, the strong association between grain yield and NAE, NPE and ANR indicates their validity in detecting yield potential in wheat. These results are in agreement with the findings of Barraclough et al. (Reference Barraclough, Howarth, Jones, Lopez-Bellido, Parmar, Shepherd and Hawkesford2010) and Wang et al. (Reference Wang, An, Hu, Li, Zhang, Jia and Tong2011).
CONCLUSION
In agriculture systems worldwide, the challenge is to sustain or improve yield and profit with minimum inputs, i.e. sustainable intensification. Wheat breeders have consistently focused on improving yield under high fertilizer input environments, but N efficiency per se has not been a key target considering it will inevitably be amalgamated with improved yield. A genotype with high stability, even with intrinsically reduced yield potential at both high and low N availability, would be a better choice compared with a genotype with intrinsically greater yield potential at elevated N supply, but much-reduced yield at low N availability (Barraclough et al. Reference Barraclough, Howarth, Jones, Lopez-Bellido, Parmar, Shepherd and Hawkesford2010).
The significant genotypic variations for grain yield and its components as well as NUE parameters at different N levels investigated in the present study indicated their ability to increase grain and straw yields in response to elevating N fertilization levels. Additionally, the results indicated that an ideal genotype could be the one that takes up relatively high quantities of N, stores relatively less N in the straw maintaining reasonable stem biomass, uses N to translocate more assimilates to filling grains and builds up more grain yield per unit of absorbed N (Álvaro et al. Reference Álvaro, Isidro, Villegas, García del Moral and Royo2008). Line 6052, Shandawel 1, Gemmiza 10, Gemmiza 12, Line 6078 and Line 6083 presented a very high response to N fertilizer. They presented the highest grain N concentration as well as high NUE parameters. The substantial effect of N supply on these genotypes resulted in increased plant height, higher net assimilation rate, more productive tillers, increased number of spikes per unit area and grains per spike, heavier grains, higher biological yield and high grain yield. Consequently, these genotypes could be incorporated in breeding programmes to improve NUE where high yield and high NUE can be obtained by using suitable cultivars and managing corresponding N application strategy simultaneously (Lu et al. Reference Lu, Lu, Pan, Cui, Zou, Chen, He and Wang2015).
The authors thank Dr Ernesto Igartua Arregui and Dr Ahmed Anwar Abdul-Galil for their valuable revision to the manuscript.