Implications
To be successful in riding sport of any discipline, horses have to be able to move in balance under the rider. Gaits are therefore routinely evaluated for breeding purposes. However, the traditionally used subjective scoring system does not allow any inferences on certain movement characteristics. Information from detailed movement evaluations (DME) of foals and mares was used to define new movement traits and perform correlation analyses with routinely assessed conformation and performance traits. Positive genetic correlations with findings indicating impaired balance in movement imply that horse breeding may benefit from extending DME and using more specific information on gaits.
Introduction
Warmblood breeding primarily aims at producing riding horses, which are highly competitive in sport. Regardless of the discipline of riding sport, body control and balanced movement under the rider represent basic requirements for successful performances, justifying that movement traits are integral parts of the routine evaluations for breeding purposes. For mares intended for breeding use, studbook inspections (SBI) including evaluations of movement at hand are obligatory. Performance tests of mares including movement evaluations under rider are voluntarily, so the proportion of performance-tested broodmares is usually below 50%. Nevertheless, moderately high heritabilities and significant positive genetic correlations with sport performances make performance test data a valuable source of information for routine genetic evaluations of riding horses. In contrast, conformation information is available for significantly larger proportions of horses, including foals, but the way and extent of use of conformation data varies between breeding organizations. In Germany, traits from SBI and foal registrations are not included in the national genetic evaluation for riding horses. Regardless of the evaluation circumstances, the currently used definitions of conformation and performance traits are often very general and due to the common subjective scoring system do not allow any statements on specific movement characteristics. Although the benefits of refined trait definitions and descriptive evaluations have been stressed (Rustin et al., Reference Rustin, Janssens, Buys and Gengler2009), there are still very few warmblood breeding organizations that have accordingly revised their routine scoring systems.
Lacking specificity of gait scoring for breeding purposes may relate to the fact that certain unfavorable movement characteristics that are long known still occur. Hereditary influences on impaired coordination in equines have been suggested as early as in the first half of the 20th century (Dimock and Errington, Reference Dimock and Errington1939; Dimock, Reference Dimock1950). In a recent study, indications of imbalance (IMB) were found in almost equal proportions of warmblood foals and presumptive warmblood broodmares, and genetic analyses implied relevant genetic determination and opportunities to select against unfavorable movement characteristics and for better balance in movement in juvenile and adult horses (Becker et al., Reference Becker, Stock and Distl2011b). However, recommending extension of detailed movement evaluations (DME) and introduction of new traits into existing breeding programs requires knowledge of correlations with the routinely assessed traits: unnecessary increase of the number of traits to be recorded can be avoided (closely correlated traits), and interferences of concurrent breeding progress (unfavorable correlations) can be taken into account.
The aim of this study was to investigate the correlations between the new movement traits assessed during DME of warmblood foals and mares and the standard conformation and performance traits routinely assessed during SBI and mare performance tests (MPT) in the field.
Material and methods
DME
Information on DME was available for 3374 foals and 2844 mares presented for regular breeding events of the Oldenburg breeding societies in 2009 and 2010. During foal registrations, foals and mares were evaluated by a special judge focusing on unfavorable characteristics of movement (SJ; foals and mares) and by the regular judges of the breeding societies (RJ). Additional movement data of mares were collected during regular mare shows and few on-farm SBI of mares, with the same constellations of judges (SJ, RJ).
All mares were evaluated in hand, that is, led by a handler, in walk and trot, and the foals were evaluated moving freely alongside their dams. The mean age at DME was 2.3 months in the foals (range: 14 days to 7 months of age; 64% younger than 3 months of age) and 9.2 years in the mares (range: 3 and 24 years of age; 27% up to 5 years old). DME of foals were performed in 97 events, including 8 events with more than 100 evaluated foals (on average 34.79 ± 41.39 evaluated foals per event). DME of mares were performed in 62 events (33 foal registrations, 29 mare shows), including 6 events with more than 100 evaluated mares (on average 45.87 ± 45.83 evaluated mares per event).
The descriptive notes of the judges served as the basis for defining movement traits. Previous analyses of the DME data had shown that specific findings could be grouped by the affected structures or parts of the body and information from the two groups of judges, SJ and RJ, could be jointly used. This resulted in a set of three composite traits and one summary trait per age group: irregular tail tone and/or posture (TTP; lower than normal tone of tail muscles and/or any deviation from normal straight tail carriage), irregular motion pattern in hind legs (HM), irregularity in general motion pattern (GM) and IMB (any irregularities of movement, i.e. TTP, HM, GM and/or pace in foals, TTP, HM and/or GM in mares). The prevalences of the binary traits were 3.97% for TTP, 2.31% for HM, 1.13% for GM and 6.22% for IMB in the foals, and 4.89% for TTP, 1.37% for HM, 0.08% for GM and 5.49% for IMB in the mares. Heritability estimates of 0.08 ± 0.03 in the foals and 0.04 ± 0.02 in the mares were found for TTP, and heritability estimates of 0.12 ± 0.04 in the foals and 0.05 ± 0.02 in the mares were found for IMB by Becker et al. (Reference Becker, Stock and Distl2011b).
Conformation and performance data
Results of conformation evaluations were available for 1987 mares presented for studbook entry of one of the Oldenburg breeding societies in 2009. The SBI had either taken place in connection with mare shows or during on-farm visits or foal registrations. The age at SBI ranged from 2.6 to 23.2 years, with a mean age of 7.03 ± 4.64 years. The mares were presented standing and moving in walk and trot while led by a handler. Scores on a subjective scale from 1 to 10 were given by the judges of the breeding societies for conformation of head (Head), neck (Neck), saddle-bearing area (Sad), front limbs (FLimb), hind limbs (HLimb), frame (Frame), type (Type), general impression and development (Dev), walk (Walk), impetus and elasticity (ImpEl) and correctness of gaits (CorrG). In addition, a score for body conformation (Body) was derived from the scores for Head, Neck, Sad, FLimb, HLimb and Frame, and a total score was then calculated from scores for Body, Type, Dev, Walk, ImpEl and CorrG.
Results of MPT were available for 2758 mares that had participated in 1-day field tests of mares organized by the Oldenburg horse breeding society from 2000 to 2008. The mean age at MPT was 3.38 ± 0.61 years, with a proportion of 97% of 3- and 4-year-old mares. Subjective scores on a scale from 1 to 10 with intervals of 0.5 were given for the following traits: Walk during free movement (Walk F), Walk under rider (Walk R), Trot during free movement (Trot F), Trot under rider (Trot R), Canter during free movement (Canter F), Canter under rider (Canter R), Rideability and Free jumping (Jumping). Rideability scores were given by test riders, whereas the judges of the breeding societies were responsible for scoring of gaits and jumping. In addition, the balanced mean of gait scores achieved without rider and under the own rider was calculated for each of the gaits: Walk F + R, Trot F + R and Canter F + R. These summary gait scores were the only information on gaits available for the 979 mares tested in 2000 to 2002. Scoring of walk during free movement was not continued after 2005, so information on Walk F and Walk F + R was available only for the 896 mares tested in 2003 to 2005. Further details can be found in Becker et al. (Reference Becker, Stock and Distl2011a).
Of the 2844 mares with DME information, 605 mares were included in the SBI data (age at DME of 5.87 ± 4.25 years) and 471 mares were included in the MPT data.
Statistical analyses
To investigate the influence of unfavorable movement characteristics as reflected by the new movement traits from DME on the standard SBI and MPT traits, multiple analyses of variance were performed using the procedure MIXED of SAS (Statistical Analysis System, version 9.2, 2011). All new movement traits (n = 4; TTP, HM, GM, IMB in mares) and the directly scored conformation and performance traits, that is, 11 SBI traits (Walk, ImpEl, CorrG, Head, Neck, Sad, FLimb, HLimb, Frame, Type and Dev) and eight MPT traits (Walk F, Walk R, Trot F, Trot R, Canter F, Canter R, Rideability and Jumping) were included. Because of the low numbers of HM-positive and GM-positive mares with MPT information, only results for IMB and TTP will be presented from the multiple analyses of variance.
In each of the analyses, the standard trait from SBI or MPT was considered as dependent variable, and the new movement trait from DME was considered as independent variable. To correct for environmental influences, the models further included season of birth and age as fixed effects and evaluation event as random effect:
 $${{y}_{ijklm}}\,{\rm{ = }}\,\mu \,{\rm{ + }}\,DM{{E}_i}\,{\rm{ + }}\,AG{{E}_j}\,{\rm{ + }}\,BMO{{N}_k}\,{\rm{ + }}\,even{{t}_l}\,{\rm{ + }}\,{{e}_{ijklm}}$$
where yijklm is the SBI score (MPT score) of the individual horse, μ the model constant, DMEi the affection status for the respective DME trait, that is, IMB, TTP, HM or GM (i = 1 to 2; not affected, affected), AGEj the fixed effect of jth class of evaluation age in years (j = 1 to 2; ⩽3 years of age, >3 years of age), BMONk the fixed effects of the kth class of birth month (k = 1 to 4; February to March, April, May, June to January), eventl the random effect of the lth evaluation event (lSBI = 1 to 341, lMPT = 1 to 37; individual combinations of date and place of SBI or MPT evaluation) and eijklm the random residual.
Estimations of genetic parameters
Genetic analyses included four traits from DME (IMB in foals, TTP in foals, IMB in mares, TTP in mares), six locomotion-related traits from SBI (Walk, CorrG, ImpEl, FLimb, HLimb and Frame) and eight traits from MPT (Walk F, Walk R, Trot F, Trot R, Canter F, Canter R, Rideability and Jumping). GM and HM were not considered because of their low prevalences that were previously found to interfere with reliable estimations of (co)variance components (Becker et al., Reference Becker, Stock and Distl2011b). Pedigree information on all horses was made available by the breeding society through the German unified animal ownership database (Vereinigte Informationssysteme Tierhaltung w.V., Verden). For all horses with phenotype data (DME, SBI or MPT), information on four ancestral generations was considered, resulting in a relationship matrix with a total of 44158 horses. The following models were chosen according to the model fit statistics of the procedures MIXED and GLIMMIX of SAS:
 $${{{y}_{imnpst}}\, = \,\mu \, + \,{{b}_{\rm{1}}}\,AGED\_{{M}_i}\, + \,JUDG{{E}_m}\, + \,BMO{{N}_n}\cr \quad+ \,event{{D}_p}\, + \,{{a}_s}\, + \,{{e}_{imnpst}} \, \qquad{\rm (DME foals)$$
 $${{{y}_{jmopst}}\, = \,\mu \, + \,{{b}_{\rm{2}}}\,AGED\_\,{{J}_j}\, + \,JUDG{{E}_m}\, + \,ETYP{{E}_o}\cr\quad + \,event{{D}_p}\, + \,{{a}_s}\, + \,{{e}_{jmopst}} \ \ \quad {\rm (DME mares)}$$
 $${{{y}_{knqst}}\, = \,\mu \, + \,AGE{{S}_k}\, + \,BMO{{N}_n}\, + \,event{{S}_q}\cr\quad + \,{{a}_s}\, + \,{{e}_{knqst}} \qquad\qquad\qquad \ \ \,\qquad\qquad{\rm (SBI)}$$
 $${{{y}_{lnrst}}\, = \,\mu \, + \,AGE{{M}_l}\, + \,BMO{{N}_n}\, + \,event{{M}_r}\cr\quad + \,{{a}_s}\, + \,{{e}_{lnrst}} \qquad\qquad\qquad\qquad\quad\qquad{\rm (MPT)}$$
where y…t is the affection status for the respective DME trait or SBI score or MPT score of the sth horse, μ the model constant, AGED_Mi (AGED_Jj) the linear regression on the ith DME age in months (jth DME age in years) with regression factors b 1 (b 2), AGESk the fixed effect of the kth class of SBI age in years (k = 1 to 2; ⩽3 years of age, >3 years of age), AGEMl the fixed effect of the lth class of MPT age in years (l = 1 to 2; ⩽3 years of age, >3 years of age), JUDGEm the fixed effects of the mth combination of DME judges (m = 1 to 3; SJ only, RJ only, SJ + RJ), BMONn the fixed effects of the nth class of birth month (n = 1 to 4; February to March, April, May, June to January), ETYPEo the fixed effect of the oth DME type of mares (o = 1 to 2; foal registration, mare show), eventDp the random effect of the pth DME event (p = 1 to 125; individual combinations of date and place of DME), eventSq the random effect of the qth SBI event (q = 1 to 341; individual combinations of date and place of SBI), eventMr the random effect of the rth MPT event (r = 1 to 37; individual combinations of date and place of MPT), as the random additive genetic effects of the sth animal (s = 1 to 44 158) and e …t the random residual.
Variance components were estimated univariately and multivariately in linear animal models with residual maximum likelihood (REML) using VCE software, version 603 (Variance Component Estimation). Univariate genetic analyses of all traits (n = 18: 4 DME, 6 SBI and 8 MPT traits) were followed by bivariate analyses of one DME trait and one SBI or MPT trait each. Accordingly, additive genetic correlation estimates were obtained through 24 DME–SBI and 32 DME–MPT analyses.
Variance estimates were used to predict breeding values (BV) in univariate linear animal models by best linear unbiased prediction (BLUP) with PEST (Prediction Estimation; Groeneveld, Reference Groeneveld1990). Pearson correlation coefficients and Spearman rank correlations were determined between the univariately predicted BV using the procedure CORR of SAS. For the correlation analyses, two groups of sires were considered: the first group (S1) included all 1086 sires with offspring in the DME data. These sires had on average 5.7 offspring with DME (3.1 foals, 2.6 mares), 1.3 offspring with SBI and 2.3 offspring with MPT; the second group (S2) included only sires with offspring in the DME and SBI data (157 sires with on average 20.4 offspring with DME and 6.5 offspring with SBI) or DME and MPT data (155 sires with on average 18.3 offspring with DME and 14.6 offspring with MPT) that had at least five offspring in one of the two trait groups. Because Spearman rank correlations differed by maximally ±0.06 from the Pearson correlations, only Pearson correlation coefficients will be presented.
To facilitate interpretation of BV distributions, relative breeding values (RBV) were subsequently derived from the univariately predicted BV by standardizing to a mean of 100 and a standard deviation (s.d.) of 20, such that RBV >100 indicated higher and RBV <100 indicated lower probability of an animal to pass favorable genetic disposition (no unfavorable movement characteristics; higher SBI or MPT scores) for the respective trait to its offspring. Sires with offspring among the foals and the mares with DME (n = 138), among the mares with SBI (n = 867) and among the mares with MPT (n = 458) served as reference for the respective group of traits. Joint distributions of RBV were then analyzed in the 1086 sires with offspring (foals and/or mares) in the DME data. RBV for the SBI and the MPT traits were compared between groups of sires with RBV for DME traits more than half a s.d. below the mean (<90; n = 203 to 244), within one s.d. around the mean (90 to 110; n = 579 to 602) and more than half a s.d. above the mean (>110; n = 248 to 297).
Results
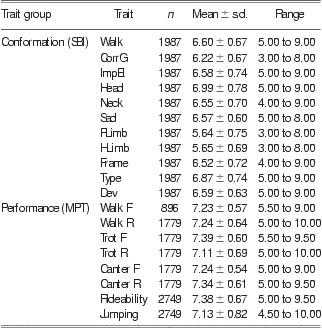
Means, s.d., minima and maxima for SBI and MPT traits are given in Table 1. Mean scores ranged between 5.64 and 6.99 in SBI and 7.11 and 7.39 in MPT, with s.d. of 0.60 to 0.78 for the SBI traits and 0.54 to 0.69 for all MPT traits except Jumping (s.d. of 0.82). For none of the conformation and performance traits the full scale of scores was used, with differences between minimum and maximum scores of between 3.5 and 5.5.
Means, s.d. and ranges of scores for conformation and performance traits from SBI in 2009 and MPT in 2000 to 2008

s.d. = standard deviations; SBI = studbook inspections; MPT = mare performance tests; CorrG = correctness of gaits, ImpEl = impetus and elasticity, FLimb (HLimb) = front (hind) limb conformation; Walk F (Trot F, Canter F) = Walk (Trot, Canter) during free movement; Walk R (Trot R, Canter R) = Walk (Trot, Canter) under rider.
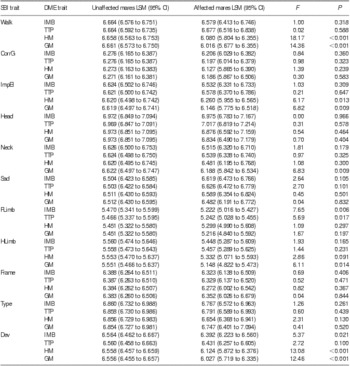
The results of analyses of variance with comparison of SBI results between mares without and with unfavorable movement characteristics are given in Table 2. When compared with the unaffected mares, mares affected with HM or GM had lower least square means (LSM) for all SBI traits. Mares affected with TTP or IMB had lower LSM for all SBI traits except Head, Neck and Sad. However, differences were in many cases not significant, particularly for IMB and TTP. LSM for FLimb and Dev were significantly lower in the IMB-positive than in the IMB-negative mares (P = 0.01 to 0.02). In the TTP-affected mares, scores for FLimb were on average significantly lower (P = 0.02) and scores for Dev tended to be lower than in the unaffected mares (P = 0.10). Mares affected with HM or GM had on average received significantly lower scores for Walk, ImpEl and Dev (P < 0.05); results were similar, but less clear for HLimb (P < 0.10). No significant differences were found regarding any of the DME traits for the SBI traits CorrG and Frame (P = 0.24 to 0.84).
Results of multiple analyses of variance for conformation traits from SBI of warmblood mares that underwent DME (n = 605), with error probabilities (P), LSM and 95% CI for unfavorable movement characteristics

Results with error probabilities of P < 0.1 are given in bold print.
SBI = studbook inspections; DME = detailed movement evaluations; LSM = least square mean estimates; CI = confidence intervals; IMB = indications of imbalance; TTP = irregular tail tone and/or posture; HM = irregular motion pattern in hind legs; GM = irregularity in general motion pattern; CorrG = correctness of gaits; ImpEl = impetus and elasticity; FLimb (HLimb) = front (hind) limb conformation.
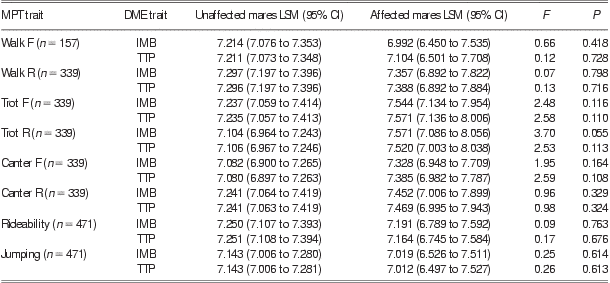
The results of analyses of variance with comparison of MPT results between mares without and with unfavorable movement characteristics are given in Table 3. LSM were mostly very similar in the unaffected mares than in the mares affected with IMB or TTP. However, for only three of the eight MPT traits, LSM were higher in the unaffected than in the affected mares. Scores for Trot R tended to be higher in the IMB-positive mares (P = 0.06), and results were similar, but less clear for TTP (P = 0.11). The same pattern of on average higher MPT scores in the affected mares was found for Trot F and Canter F (P = 0.11 to 0.16).
Results of multiple variance analyses for performance traits from MPT of warmblood mares that underwent DME (n = 471), with error probabilities (P), LSM estimates and 95% CI for unfavorable movement characteristics
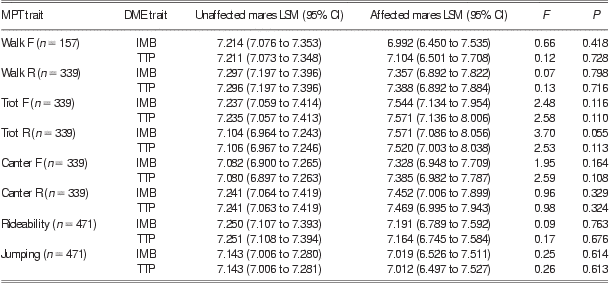
MPT = mare performance tests; DME = detailed movement evaluations; LSM = least square mean; CI = confidence intervals; IMB = indications of imbalance; TTP = irregular tail tone and/or posture; Walk F (Trot F, Canter F) = Walk (Trot, Canter) during free movement; Walk R (Trot R, Canter R) = Walk (Trot, Canter) under rider.
Genetic analyses revealed low to moderate heritability estimates for the SBI traits, with h 2 = 0.05 to 0.10 for CorrG, FLimb, HLimb and Frame, h 2 = 0.26 for Walk and h 2 = 0.33 for ImpEl (standard errors of 0.03 to 0.06). Moderate heritabilities of h 2 = 0.21 for Rideability, h 2 = 0.35 to 0.50 for the gait traits (Walk F, Walk R, Trot F, Trot R, Canter F, Canter R) and h 2 = 0.56 for Jumping (standard errors of 0.04 to 0.10) were estimated for the MPT traits. Heritability estimates for the SBI and MPT traits from univariate analyses and bivariate analyses with DME traits were very similar, with differences of <0.01 for all traits except Walk F (univariate h 2 of 0.45 ± 0.10 v. mean h 2 from bivariate analyses of 0.43 ± 0.08).
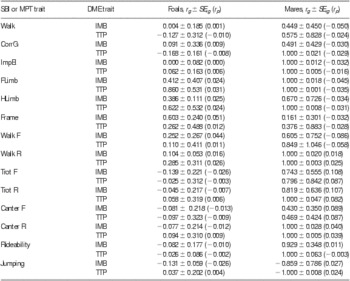
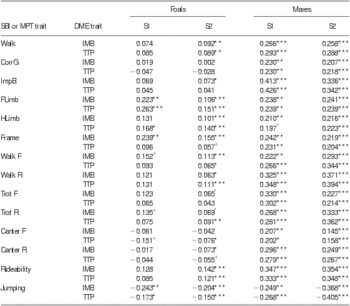
Additive genetic and phenotypic correlations between SBI and DME traits and between MPT and DME traits are given in Table 4. The additive genetic correlation estimates obtained for IMB in foals, IMB in mares, TTP in foals and TTP in mares ranged mostly between −0.1 and 0.9, but were in many cases associated with high standard errors. In the foal data, positive additive genetic correlations of 0.3 to 0.9 were found for FLimb, HLimb and Frame. In the mare data, additive genetic correlations were higher, and rg = 1.0 was found for four of the six SBI traits (CorrG, ImpEl, FLimb and HLimb) and for four of the eight MPT traits (Walk R, Trot R, Canter R and Rideability). Indications for negative genetic correlations with IMB and TTP in foals and mares were found for only one of the MPT traits (Jumping). Phenotypic correlations of DME traits with SBI and MPT traits were low, ranging in the foal data from −0.01 to 0.05 for SBI and from −0.03 to 0.04 for MPT and in the mare data from −0.05 to −0.02 for SBI and from −0.09 to 0.11 for MPT.
Additive genetic correlations (rg) with their standard errors (SErg) and phenotypic correlations (rp) from bivariate genetic analyses of conformation and performance traits from regular SBI and MPT and unfavorable movement characteristics from DME of foals and mares

SBI = studbook inspections; MPT = mare performance tests; DME = detailed movement evaluations; IMB = Indications of imbalance; TTP = Irregular tail tone and/or posture; CorrG = correctness of gaits; ImpEl = impetus and elasticity; FLimb (HLimb) = front (hind) limb conformation; Walk F (Trot F, Canter F) = Walk (Trot, Canter) during free movement; Walk R (Trot R, Canter R) = Walk (Trot, Canter) under rider.
Pearson correlation coefficients between univariately predicted BV for DME, SBI and MPT traits are given in Table 5. Consistent results were obtained for the two groups of sires, with BV correlations −0.24 to 0.26 (S1) and −0.20 to 0.16 (S2) in the foal data and −0.27 to 0.43 (S1) and −0.41 to 0.39 (S2) in the mare data. Although BV correlations were generally lower for IMB and TTP in foals than for IMB and TTP in mares, very similar correlation coefficients were determined for FLimb (IMB and TTP in S1, r = 0.22 to 0.26), Frame (IMB in S1, r = 0.24) and Jumping (IMB and TTP in S1, r = −0.17 to −0.27). Significantly, positive BV correlations of r > 0.3 with IMB and TTP in mares were found for ImpEl, Walk F, Walk R, Trot F, Trot R and Rideability.
Pearson correlation coefficients between univariately predicted breeding values for conformation and performance traits from regular SBI and MPT and unfavorable movement characteristics from DME of foals and mares in sires with offspring in DME (S1, n = 1086), and sires with offspring in DME and SBI (DME and MPT) and at least five offspring in one of the two trait groups (S2, n = 157 for SBI, n = 155 for MPT)

SBI = studbook inspections; MPT = mare performance tests; DME = detailed movement evaluations; IMB = indications of imbalance; TTP = Irregular tail tone and/or posture; CorrG = correctness of gaits; ImpEl = impetus and elasticity; FLimb (HLimb) = front (hind) limb conformation; Walk F (Trot F, Canter F) = Walk (Trot, Canter) during free movement; Walk R (Trot R, Canter R) = Walk (Trot, Canter) under rider.
Levels of significance: ***P < 0.001, **P < 0.01, *P < 0.05, +P < 0.10.
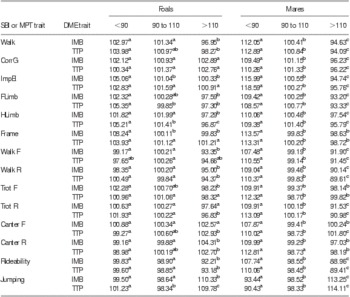
Mean RBV for SBI and MPT traits by classes of RBV for DME traits in the 1086 sires with offspring in the DME data are given in Table 6. In the sires with RBV >110 for IMB and TTP in foals mean RBV for SBI traits ranged between 96.9 and 102.9 and mean RBV for MPT traits ranged between 92.2 and 110.3. When compared with the sires with RBV <90 for IMB and TTP in foals, their mean RBV for Canter R and Jumping were by 3.7 to 10.8 points higher (P < 0.01). However, sires with RBV >110 for IMB in foals had >5 points lower mean RBV for Walk, Frame, Walk F and Rideability (P < 0.01), and sires with RBV >110 for TTP in foals had >5 points lower mean RBV for Walk, FLimb, HLimb, Walk R, Trot R and Rideability (P < 0.01). In the sires with RBV >110 for IMB and TTP in mares, mean RBV for SBI traits ranged between 93.2 and 98.7 and mean RBV for MPT traits ranged between 89.0 and 114.1. When compared with the sires with RBV <90 for IMB and TTP in mares, their mean RBV for Jumping were by 19.8 to 23.7 points higher (P < 0.001). However, their mean RBV for all SBI traits and all MPT traits except Jumping were by 7.6 to 22.8 points lower (P < 0.01).
Means of RBV for conformation and performance traits from SBI and MPT by classes of RBV for unfavorable movement characteristics in 1086 sires with offspring among the foals (n = 3724) and mares (n = 2844) with DME

RBV = relative breeding values; SBI = studbook inspections; MPT = mare performance tests; DME = detailed movement evaluations; IMB = indications of imbalance; TTP = irregular tail tone and/or posture; CorrG = correctness of gaits; ImpEl = impetus and elasticity; FLimb (HLimb) = front (hind) limb conformation; Walk F (Trot F, Canter F) = Walk (Trot, Canter) during free movement; Walk R (Trot R, Canter R) = Walk (Trot, Canter) under rider.
Standardization of RBV for all traits such that larger RBV indicate favorable genetic dispositions; significant differences (P < 0.05) between mean RBV are indicated by different superscript letters.
Discussion
Data for this study originated from DME of warmblood foals and mares, SBI and MPT. DME and SBI data were collected in two subsequent years, 2009 and 2010, under stable evaluation conditions and by the same teams of judges, resulting in complete DME information on 3374 foals and 2844 mares and complete SBI information on 1987 mares. In contrast, the MPT data were collected over a longer time period (2000 to 2008) in which some minor changes of performance evaluations and score documentation had been made. To avoid bias of correlation estimates caused by reference to genetically heterogeneous traits (Becker et al., Reference Becker, Stock and Distl2011a), only the traits with maximum and uniform specificity of recording were included in this study. Accordingly, the numbers of informative mares differed between the MPT traits and ranged from 896 for Walk F over 1779 for the other gait traits (Walk R, Trot F, Trot R, Canter F, Canter R) to 2749 for Rideability and Jumping.
Specific documentation of movement characteristics during DME made it possible to distinguish not only between horses without and with IMB, but also between horses without and with certain kinds of imbalanced movement. Signs corresponding to HM and GM are considered indicative of impaired balance and coordination of horses of different ages (Van Biervliet, Reference Van Biervliet2007). However, the prevalences of these more severe IMB findings were very low in the warmblood foals and mares presented in the regular breeding events used for DME. Signs corresponding to TTP may occur as accompanying findings in horses with clinically manifest ataxia, for example, in the context of the Wobbler syndrome. In our study, we found other and more severe IMB (HM, GM) in about every fourth horse with tail irregularities (TTP) and estimated significantly positive genetic correlations between TTP, HM and GM in foals and mares (Becker et al., Reference Becker, Stock and Distl2011b). Therefore, only the comprehensive DME trait, IMB and the most prevalent DME trait, TTP, were included in the extensive genetic correlation analyses with the standard traits from SBI and MPT.
In the warmblood horse, subjective scoring on a scale from 1 to 10 has been and is still the most common method of conformation and performance evaluation. Although slight differences in the trait definitions may exist between the breeding organizations, the standard set of traits evaluated in SBI and MPT has been unchanged in Germany for at least two decades. In previous population, genetic studies on conformation and performance in the German warmblood, Hanoverian SBI and MPT data from 1995 to 2004 had been used (Stock and Distl, Reference Stock and Distl2006 and Reference Stock and Distl2007). Despite the much larger numbers of informative mares (20 768 mares with SBI, 10 935 mares with 1-day field test of MPT) and somewhat different score distributions (0.19 to 0.98 higher means of SBI scores; 0.09 to 0.33 lower means of MPT scores for all gaits and rideability, 0.13 higher mean of MPT score for Jumping), the heritability estimates were very similar to those found in this study: the lowest heritabilities of about 0.1 were found for FLimb, HLimb and CorrG (h 2 = 0.09 to 0.12; Stock and Distl, Reference Stock and Distl2006), whereas heritabilities for the other movement-related traits were in the order of 0.3 to 0.4 (h 2 = 0.25 to 0.39 for Walk and ImpEl from SBI and Walk R, Trot R, Canter R, Rideability and Jumping form MPT; Stock and Distl, Reference Stock and Distl2006 and Reference Stock and Distl2007). According to the literature, neither breed nor evaluation age seemed to have major influence on the heritabilities of subjectively scored conformation and performance traits: recent reports refer to the same traits as evaluated in German SBI and MPT, analyzed in a sample of 783 3- to 4-year-old mares from the Hungarian Sport Horse population (h 2 = 0.2 to 0.5; Posta et al., Reference Posta, Komlósi and Mihók2010) and to more generally defined conformation traits analyzed in 8391 juvenile Finnhorses and Standardbreds (age range of 7 to 45 months, h 2 = 0.1 to 0.5; Schroderus and Ojala, Reference Schroderus and Ojala2010) and 3695 warmblood foals (h 2 = 0.45 to 0.49; Bhatnagar et al., Reference Bhatnagar, Lewis, Notter, Schacht and Splan2011). Furthermore, for Finnhorse and Standardbred trotters, it has been shown that subjectively scored conformation traits are moderately heritable in foals (h 2 = 0.1 to 0.5) and mares (h 2 = 0.1 to 0.8) and additive genetic correlations of 0.6 to 1.0 between analogous foal and mare traits imply benefits from using foal data as an early source of information (Suontama et al., Reference Suontama, van der Werf, Juga and Ojala2011).
The valuating scoring of vaguely defined traits and the unsatisfactory use of the full score scales are well-known problems in horse breeding, interfering with clear distinction between individuals with regard to conformation and performance characteristics (Stock and Distl, Reference Stock and Distl2006 and Reference Stock and Distl2007; Bhatnagar et al., Reference Bhatnagar, Lewis, Notter, Schacht and Splan2011). To better capture the variability in the population, splitting up of the standard traits and descriptive scoring on linear scales have been recommended and studied, but introduced by just very few horse breeding organizations yet: in 1989 in the Royal Warmblood Studbook of the Netherlands (KWPN; Koenen et al., Reference Koenen, van Veldhuizen and Brascamp1995) and in 2003 in the studbook of the Belgian warmblood horse (BWP; Rustin et al., Reference Rustin, Janssens, Buys and Gengler2009). The additional efforts of refined evaluation were justified by the expected increase of heritabilities and the improved information basis to make selection decisions. After the first 5 years of linear scoring in the BWP, phenotype distributions implied the need for further consolidation of the newly established system. However, mean heritability over 33 linear type traits and gaits was 0.32 in a sample of 987 mares, with h 2 = 0.15 to 0.55 for 27 type traits and h 2 = 0.33 to 0.52 for six gait traits (Rustin et al., Reference Rustin, Janssens, Buys and Gengler2009).
In this study, we used DME to support rather than replace the routine evaluations of foals and mares, and performed correlation analyses combining information from DME, SBI and MPT. Given the focus of DME on the unfavorable movement characteristics, the genetic correlations with the standard SBI and MPT traits were supposed to indicate whether or not selection based on these standard traits is suitable to reduce or at least avoid increase of the prevalences of IMB.
In the analyses of variance, for which mares with DME and SBI records (n = 605) and mares with DME and MPT records (n = 471) were considered, we found significant differences in scoring of the mares without and with IMB, using comprehensive and specific definitions of the DME traits (IMB v. TTP, HM, GM). However, the most consistent results were obtained for the SBI trait Dev, and only the mares with more severe signs of impaired balance (HM, GM) were scored significantly worse in Walk and ImpEl. Absence of significant differences in the SBI trait CorrG and in most of the MPT traits and the tendency to even higher scoring of IMB-positive mares in MPT trait Trot R indicate that the current definitions of gait traits do not cope with all movement characteristics seen in the presented mares. Owing to the data structure, the time period between DME and MPT was larger than between DME and SBI, and MPT participation preceded DME in all mares, and thus IMB may not have been visible at MPT in all mares that were later identified as IMB positive (n = 11). However, phenotype distributions with respect to DME and SBI are unlikely to be influenced by some time gap, because mares were usually identified as IMB positive (n = 88) at the same events as they were scored for SBI.
Studies on the development of equine locomotion pattern with age have revealed that certain kinematic characteristics remain remarkably stable over time and that intralimb coordination pattern are already established at foal age (Back et al., Reference Back, Barneveld, Schamhardt, Bruin and Hartman1994). These findings are in line with the significantly positive genetic correlations we had previously found between analogously defined DME traits in foals and mares (Becker et al., Reference Becker, Stock and Distl2011b). DME information on foals and mares was therefore included in the genetic correlation analyses, with separate trait definition within age group. In the multivariate estimations of genetic parameters, the phenotypic correlations with SBI and MPT traits were much lower (−0.03 to +0.05 for IMB and TTP in foals, −0.09 to +0.11 for IMB and TTP in mares) than the additive genetic correlations (−0.17 to +0.86 for IMB and TTP in foals, −1.00 to +1.00 for IMB and TTP in mares). In this connection, it has to be taken into account that compared with the standard SBI and MPT traits (observed score ranges from 3 to 10), the additive genetic variances of the binary coded, new movement traits from DME were very small, interfering with reliable estimation of variance–covariance matrices (Becker et al., Reference Becker, Stock and Distl2011b). To overcome the problem of low reliabilities of additive genetic correlation estimates, univariately predicted BV were used for further correlation analyses. Significantly, positive BV correlations were determined between IMB and TTP on the one hand and dressage-related standard traits from SBI and MPT, particularly when referring to the DME traits in mares. After uniform standardization, analyses of RBV further illustrated the unfavorable genetic correlations between the DME traits and conformation and between DME traits and dressage-related performance. Selection of dressage horses for better scores in SBI and MPT and without consideration of DME information will therefore bear the risk of increasing prevalences of IMB in future generations. According to our results, there is no such risk in the selection of horses for better jumping performance: the BV correlations were significantly negative and the RBV distributions were parallel for the DME traits and the MPT trait Jumping. Although this is the first study on genetic correlations with unfavorable movement characteristics considered indicative for impaired balance, the available literature on equine locomotion, conformation and performance provides data that agree with our results (Saastamoinen and Barrey, Reference Saastamoinen and Barrey2000).
Selection for proportionate conformation without major conformational defects is being practiced with different intensities and focuses in most horse populations, from racehorses and trotters over draught horses to riding horses (Ducro et al., Reference Ducro, Bovenhuis and Back2009a; Viklund et al., Reference Viklund, Braam, Näsholm, Strandberg and Philipsson2010). Biokinematics help to explain why certain conformational characteristics are more likely to be found in successful dressage horses than in the average population (Holmström et al., Reference Holmström, Magnusson and Philipsson1990 and Reference Holmström, Fredericson and Drevemo1995). Positive phenotypic and genetic correlations of frame, front and hind limb conformation with dressage abilities have been reported (Holmström et al., Reference Holmström, Magnusson and Philipsson1990 and Reference Holmström, Fredericson and Drevemo1995; Holmström and Philipsson, Reference Holmström and Philipsson1993; Ducro et al., Reference Ducro, Bovenhuis and Back2009a and Reference Ducro, Gorissen, van Eldik and Back2009b; Rustin et al., Reference Rustin, Janssens, Buys and Gengler2009), whereas correlations between conformation and show jumping performance appeared to be less clear and partly opposite to those found between conformation and dressage (Holmström et al., Reference Holmström, Magnusson and Philipsson1990; Ducro et al., Reference Ducro, Bovenhuis and Back2009a and Reference Ducro, Gorissen, van Eldik and Back2009b). For the DME traits reflecting unfavorable movement characteristics, we also obtained clearly different results for Jumping on the one hand and dressage-related traits on the other hand. Negative genetic correlations with Jumping indicated that IMB and TTP were less likely to be transmitted by horses with high genetic potential for good jumping performance. The opposite was true for horses with high genetic potential for good dressage performance, that is, high probability to receive above-average scores for FLimb, HLimb, Frame and gait traits in SBI and MPT. Obvious differences between the relations of balance in movement with dressage-related traits and with jumping-related traits have also been reported for the Dutch warmblood. On the basis of first stallion inspections of the KWPN, balance was positively correlated with walk (rg = 0.79) and trot (rg = 0.88) during free movement, but genetically uncorrelated with takeoff, technique and power during free-jumping (rg = −0.02 to −0.09; Ducro et al., Reference Ducro, Koenen, Van Tartwijk and Van Arendonk2007).
Significant phenotypic correlations exist between morphometric and kinematic measures of the equine back, indicating increase of lateral bending with increasing length of the back, particularly in the thoracic part (Johnston et al., Reference Johnston, Holm, Faber, Erichsen, Eksell and Drevemo2002). Because of the fundamental role of the equine back for locomotion, any structural and functional changes in the back are likely to affect the general motion pattern of the horse, including its coordination abilities (Van Weeren et al., Reference Van Weeren, McGowan and Haussler2010). The results of this study may be interpreted as a hint towards some limit of balancing capacities, which may have been reached in dressage horse breeding. Conformational characteristics favorable for a dressage horse, like a rectangle frame (facilitating swinging of the back) with a relatively short neck (facilitating elevation), may in connection with the aptitude to move with much expression overstrain the mechanisms of coordination. In contrast, horses bred for show jumping are less homogeneous with regard to conformation and move economically rather than expressively, particularly in trot. Accordingly, the probability to develop and show IMB may be increased in horses bred for dressage performance and may further increase with continuing selection with the focus on impressive movement.
Given the positive genetic correlations we found between dressage and unfavorable movement characteristics, extension of DME may be recommended to enable considering unfavorable movement characteristics when making breeding decisions. Warmblood riding horses showing IMB during free movement may not necessarily perform worse under rider than unaffected horses at young age. However, long-term effects of these conditions in warmblood riding horses are unknown so far. DME data collected in foals and mares will provide a suitable basis for further correlation analyses between unfavorable movement characteristics and performance on different levels and in different disciplines of sports.
Acknowledgements
The authors thank the Oldenburg horse breeding society for substantial support and valuable discussions helping to improve the paper.