1 Background
The term ‘quantum turbulence’ refers to a tangle of quantised vortex lines, a tangle whose formation and decay are determined by how these vortices collide, reconnect and separate. Although superfluid tangles form in a variety of
 $^{3}$
He or
 $^{4}$
He experiments such as counter-flow, moving grids and colliding vortex rings (Walmsley & Golov Reference Walmsley and Golov2008; Skrbek & Sreenivasan Reference Skrbek and Sreenivasan2012), until recently very little has been known directly about the underlying microscopic interactions. Instead, the nature of the vortex interactions has been inferred from how rapidly the tangle decays.
Theoretically, the observed decay has been linked to the conversion of the kinetic energy of the vortices into other forms of energy. In higher temperature experiments, this conversion could be into the kinetic energy of the normal (or classical) component of the superfluid. In low temperature quantum fluids, including Bose–Einstein condensates, it could be into the interaction energy and quantum waves.
Despite this, most of our current theoretical insight into the reconnection of quantised vortices has been through Lagrangian, Biot–Savart simulations of isolated vortex filaments, a dynamical system that does not include the terms for the interaction energy. Why?
Part of the reason is that the Lagrangian approach has experimental support, most recently by comparisons between experiments tracking quantised vortices with solid hydrogen particles (Bewley et al.
Reference Bewley, Paoletti, Sreenivasan and Lathrop2008; Paoletti et al.
Reference Paoletti, Fisher, Sreenivasan and Lathrop2008) and the scaling in the filament calculation of initially anti-parallel vortices by de Waele & Aarts (Reference de Waele and Aarts1994). In both cases, the minimum separation distance between vortices,
 $\unicode[STIX]{x1D6FF}$
, was interpreted in terms of the dimensional analysis based upon the circulation
 $\unicode[STIX]{x1D6E4}$
of the vortices. That is, if
 $(\text{d}/\text{d}t)\unicode[STIX]{x1D6FF}\sim v\sim \unicode[STIX]{x1D6E4}/\unicode[STIX]{x1D6FF}$
, then one would expect that
 $$\begin{eqnarray}\displaystyle \unicode[STIX]{x1D6FF}(t)\sim (\unicode[STIX]{x1D6E4}|t_{r}-t|)^{1/2}. & & \displaystyle\end{eqnarray}$$
This will be called the dimensional scaling.
Alternatively, one can simulate the underlying mean-field equations of quantum fluids and visualise vortex reconnection by following the low density isosurfaces that surround the zero-density cores. The problem with this approach is that tracking the motion of the vortices within these isosurfaces is difficult, even for single interactions.
The aim of this paper is to begin to fill that gap using two innovations for solutions of the mean-field, hard-sphere Gross–Pitaevskii equations. One innovation is an initial condition that suppresses fluctuations in the temporal scaling of separations and the second is a method for identifying the position of the vortex cores. These innovations will be used to determine the minimum separation scaling laws of
 $\unicode[STIX]{x1D6FF}$
between two reconnecting vortices for two classes of initial configurations, orthogonal or anti-parallel vortices. A review of the history of three-dimensional Gross–Pitaevskii reconnection calculations, starting from the first (Koplik & Levine Reference Koplik and Levine1993) up to those we will compare against is given after the equations are introduced in § 2.
The primary conclusion will be that the minimum separation
 $\unicode[STIX]{x1D6FF}(t)$
scaling laws (
 $|t_{r}-t|^{\unicode[STIX]{x1D6FC}}$
) for the two configurations yield distinctly different values for
 $\unicode[STIX]{x1D6FC}$
, both before and after reconnection and even when the pairs are almost within a core radii of each other. The anti-parallel case obeys the expectations from (1.1), but the orthogonal cases consistently obey a distinctly different type of scaling. It will be proposed that the differences are due to the alignment of their respective Frenet–Serret coordinate frames, differences that form almost immediately.
This paper is organised as follows. First, the equations and the initialisation of the model are introduced, followed by overviews of the anti-parallel and orthogonal global evolution in three dimensions. Next, the methods used to identify the trajectories of the vortices and the local properties of the Frenet–Serret frame, including curvature, are explained. The numerical results, arranged by the type of simulation, orthogonal and anti-parallel, are then described. The results include the time dependence of the separation of the vortices, the curvature along the vortices and the alignments in terms of the Frenet–Serret frames. Finally, the differences and similarities in the evolution of the orthogonal and anti-parallel cases are discussed.
2 Equations, numerics and initial condition
Following Berloff (Reference Berloff2004), the three-dimensional Gross–Pitaevskii equations for the complex wave function or order parameter
 $\unicode[STIX]{x1D713}$
are
 $$\begin{eqnarray}\displaystyle & & \displaystyle \frac{1}{i}\frac{\unicode[STIX]{x2202}}{\unicode[STIX]{x2202}t}\unicode[STIX]{x1D713}=E_{v}\unicode[STIX]{x1D6FB}^{2}\unicode[STIX]{x1D713}+V(|\boldsymbol{x}-\boldsymbol{x}^{\prime }|)\unicode[STIX]{x1D713}(1-|\unicode[STIX]{x1D713}|^{2})\nonumber\\ \displaystyle & & \displaystyle \quad \text{with }E_{v}=0.5\text{ and }V(|\boldsymbol{x}-\boldsymbol{x}^{\prime }|)=0.5\unicode[STIX]{x1D6FF}(\boldsymbol{x}-\boldsymbol{x}^{\prime }).\end{eqnarray}$$
These are the mean-field equations of a microscopic, quantum system with
 $\hbar$
and
 $m$
non-dimensionalized to be 1, a chemical potential of
 $E_{v}=0.5$
and using the hard-sphere approximation for
 $V(|\boldsymbol{x}-\boldsymbol{x}^{\prime }|)$
. They are an example of a defocusing nonlinear Schrödinger equation. All calculations in this paper will use (2.1).
These equations conserve mass:
 $$\begin{eqnarray}\displaystyle M=\int \,\text{d}\,V|\unicode[STIX]{x1D713}|^{2} & & \displaystyle\end{eqnarray}$$
and a Hamiltonian
 $$\begin{eqnarray}\displaystyle H=\frac{1}{2}\int \,\text{d}V\,[\unicode[STIX]{x1D735}\unicode[STIX]{x1D713}\boldsymbol{\cdot }\unicode[STIX]{x1D735}\unicode[STIX]{x1D713}^{\dagger }+0.25(1-|\unicode[STIX]{x1D713}|^{2})^{2}] & & \displaystyle\end{eqnarray}$$
where
 $\unicode[STIX]{x1D713}^{\dagger }$
is the complex conjugate of
 $\unicode[STIX]{x1D713}$
. The local strength of the mass density, kinetic or gradient energy
 $K_{\unicode[STIX]{x1D713}}$
and the interaction energy
 $I$
are
 $$\begin{eqnarray}\displaystyle \unicode[STIX]{x1D70C}=|\unicode[STIX]{x1D713}|^{2},\quad K_{\unicode[STIX]{x1D713}}={\textstyle \frac{1}{2}}|\unicode[STIX]{x1D735}\unicode[STIX]{x1D713}|^{2}\quad \text{and}\quad I(\boldsymbol{x})={\textstyle \frac{1}{4}}(1-|\unicode[STIX]{x1D713}|^{2})^{2}. & & \displaystyle\end{eqnarray}$$
Isosurfaces of
 $\unicode[STIX]{x1D70C}$
are used in all the three-dimensional visualisations and
 $K_{\unicode[STIX]{x1D713}}$
are included in figures 1–3, 6 and 12.
Gross–Pitaevskii calculations have identified the following properties associated with the reconnection of quantised vortices. First, it has been demonstrated (Leadbeater et al.
Reference Leadbeater, Samuels, Barenghi and Adams2003; Berloff Reference Berloff2004; Kerr Reference Kerr2011) that the line length grows just prior to reconnection, indicating a type of vortex stretching. Second, reconnection radiates energy, either as sound waves (Leadbeater et al.
Reference Leadbeater, Winiecki, Samuels, Barenghi and Adams2001, Reference Leadbeater, Samuels, Barenghi and Adams2003; Berloff Reference Berloff2004), nonlinear refraction waves (Berloff Reference Berloff2004; Zuccher et al.
Reference Zuccher, Caliari, Baggaley and Barenghi2012) or strongly nonlinear vortex rings (Leadbeater et al.
Reference Leadbeater, Samuels, Barenghi and Adams2003; Berloff Reference Berloff2004; Kerr Reference Kerr2011; Kursa et al.
Reference Kursa, Bajer and Lipniacki2011). Approximately 10 % of the initial kinetic energy
 $K_{\unicode[STIX]{x1D713}}$
is lost by these means during the initial reconnection (Kerr Reference Kerr2011). Further decay of any vortex tangle that might form has been addressed by Sasa et al. (Reference Sasa, Kano, Machida, L’vov, Rudenko and Tsubota2011), but will not be discussed here.
Simulations of vortex reconnection using the Gross–Pitaevskii equations began with Koplik & Levine (Reference Koplik and Levine1993). The origins of the configurations in the present work come from recent work in Kerr (Reference Kerr2011), Kursa et al. (Reference Kursa, Bajer and Lipniacki2011) and Rorai (Reference Rorai2012). Our scaling laws for
 $\unicode[STIX]{x1D6FF}(t)$
are consistent with the symmetric two-ring scaling in Tebbs et al. (Reference Tebbs, Youd and Barenghi2011) for the anti-parallel initial conditions, with the deviations from the dimensional scaling prediction (1.1) reported by Zuccher et al. (Reference Zuccher, Caliari, Baggaley and Barenghi2012) for the orthogonal initial conditions, with the caveats discussed in § 6.
2.1 Quasi-classical approximations
But how can the continuum Gross–Pitaevskii equations provide us with details about the Lagrangian dynamics and reconnections that underlie the vortex tangle of quantum fluids?
This can be done by writing the wave function as
 $\unicode[STIX]{x1D713}=\sqrt{\unicode[STIX]{x1D70C}}\text{e}^{\text{i}\unicode[STIX]{x1D719}}$
, where
 $\unicode[STIX]{x1D70C}$
is the density and
 $\unicode[STIX]{x1D719}$
is the complex phase. The phase velocity
 $\boldsymbol{v}_{\unicode[STIX]{x1D719}}$
and quantised circulation
 $\unicode[STIX]{x1D6E4}$
around the zero-density line defects are then defined as:
 $$\begin{eqnarray}\displaystyle \boldsymbol{v}_{\unicode[STIX]{x1D719}}=\unicode[STIX]{x1D735}\unicode[STIX]{x1D719}=\text{Im}(\unicode[STIX]{x1D713}^{\dagger }\unicode[STIX]{x1D735}\unicode[STIX]{x1D713})/\unicode[STIX]{x1D70C},\quad \unicode[STIX]{x1D6E4}=\int \boldsymbol{v}_{\unicode[STIX]{x1D719}}\boldsymbol{\cdot }\boldsymbol{s}=2\unicode[STIX]{x03C0}. & & \displaystyle\end{eqnarray}$$
Even though these lines cannot represent a true vorticity field because the vorticity
 $\unicode[STIX]{x1D74E}=\unicode[STIX]{x1D735}\times \boldsymbol{v}_{\unicode[STIX]{x1D719}}=\unicode[STIX]{x1D735}\times \unicode[STIX]{x1D735}\boldsymbol{\cdot }\unicode[STIX]{x1D719}\equiv 0$
. In this picture, vortex reconnection appears naturally as the instantaneous re-alignment of these lines and exchange of circulation when the line defects meet. If dimensions were added, the quantised circulation has the classical units of circulation:
 $\unicode[STIX]{x1D6E4}\sim \unicode[STIX]{x1D70C}L^{2}/T$
. Note these two differences with classical vortices governed by the Navier–Stokes equation: classical circulation is not quantised and viscous reconnection is never 100 %.
To extract the Lagrangian motion of quantised vortices from fields defined on three-dimensional meshes these issues must be addressed:
-
(i) As the state relaxes from its initial form, it should not be dominated by either internal waves (phonons) or strong fluctuations along the vortex trajectories (Kelvin waves).
-
(ii) Second, a method is needed for identifying the direction and positions that the vortices follow as they pass through the three-dimensional mesh.
The two innovations introduced in this paper, (2.7) for the initial density and (3.1) for tracking vortices, resolve both problems and allow us to extract smooth motion for the vortices from the calculated solutions of the Gross–Pitaevskii equations on Eulerian meshes.
To complete the discussion of the Gross–Pitaevskii equations (2.1), the full analogy to classical hydrodynamic equations comes from inserting
 $\unicode[STIX]{x1D713}=\sqrt{\unicode[STIX]{x1D70C}}\exp (\text{i}\unicode[STIX]{x1D719})$
into (2.1) to get the standard equation for
 $\unicode[STIX]{x1D70C}$
and a Bernoulli equation for
 $\unicode[STIX]{x1D719}$
:
 $$\begin{eqnarray}\displaystyle \frac{\unicode[STIX]{x2202}}{\unicode[STIX]{x2202}t}\unicode[STIX]{x1D70C}+\unicode[STIX]{x1D735}\boldsymbol{\cdot }(\unicode[STIX]{x1D70C}\boldsymbol{v}_{\unicode[STIX]{x1D719}})=0,\quad \frac{\unicode[STIX]{x2202}}{\unicode[STIX]{x2202}t}\unicode[STIX]{x1D719}+(\unicode[STIX]{x1D735}\unicode[STIX]{x1D719})^{2}=0.5(1-\unicode[STIX]{x1D70C})+\unicode[STIX]{x1D6FB}^{2}\sqrt{\unicode[STIX]{x1D70C}}/\sqrt{\unicode[STIX]{x1D70C}}. & & \displaystyle\end{eqnarray}$$
The
 $\boldsymbol{v}_{\unicode[STIX]{x1D719}}$
velocity equation can then be formed by taking the gradient of the
 $\unicode[STIX]{x1D719}$
equation.
As in Kerr (Reference Kerr2011), the numerics are a standard semi-implicit spectral algorithm where the nonlinear terms are calculated in physical space, then transformed to Fourier space to calculate the linear terms. In Fourier space, the linear part of the complex equation is solved through integrating factors with the Fourier transformed nonlinearity added as a third-order Runge–Kutta explicit forcing. The domain is imposed by using no-stress cosine transforms in all three directions. For all of the calculations the domain size is
 $L_{x}\times L_{y}\times L_{z}=(16\unicode[STIX]{x03C0})^{3}\approx 50^{3}$
or
 $(32\unicode[STIX]{x03C0})^{3}$
. Both
 $128^{3}$
and
 $256^{3}$
grids were used, with the
 $256^{3}$
grid giving smoother temporal evolution. Most of the analysis and graphics will use the
 $\unicode[STIX]{x1D6FF}_{0}=3$
,
 $256^{3}$
calculation.
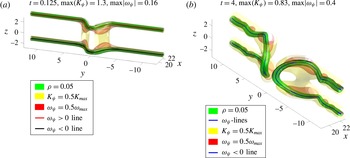
Anti-parallel case: density, kinetic energy
 $K_{\unicode[STIX]{x1D713}}=|\unicode[STIX]{x1D735}\unicode[STIX]{x1D713}|^{2}$
and pseudo-vorticity
 $|\unicode[STIX]{x1D735}\unicode[STIX]{x1D713}_{r}\times \unicode[STIX]{x1D735}\unicode[STIX]{x1D713}_{i}|$
isosurfaces plus vortex lines at these times: (a)
 $t=0.125$
, with
 $\max (K_{\unicode[STIX]{x1D713}})=1.3$
and (b)
 $t=4$
with
 $\max (K_{\unicode[STIX]{x1D713}})=0.83$
.
 $\max |\unicode[STIX]{x1D714}_{\unicode[STIX]{x1D713}}|=0.4$
for all the times. The vortex lines show that the pseudo-vorticity method not only follows the lines
 $\unicode[STIX]{x1D70C}=0$
well, but the
 $t=4$
frame also shows that it can be used to follow isosurfaces of fixed
 $\unicode[STIX]{x1D70C}$
. The
 $t=0.125$
frame shows that initially the kinetic energy is largest between the elbows of the two vortices, with large
 $\unicode[STIX]{x1D714}_{\unicode[STIX]{x1D713}}$
at the elbows. The
 $t=4$
frame shows the newly reconnected vortices as they are separating with undulations on the vortex lines that will form additional reconnections and vortex rings at later times.

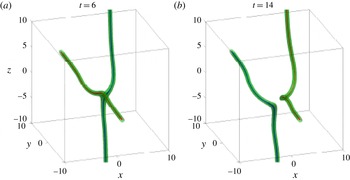
Overview of the evolution of the
 $\unicode[STIX]{x1D6FF}_{0}=\text{3, 256}^{3}$
orthogonal calculation from a three-dimensional perspective for two times:
 $t=6$
as reconnection is beginning and
 $t=14$
after it has ended, where
 $t_{r}\approx 8.9$
. Green
 $\unicode[STIX]{x1D70C}=0.05$
isosurfaces encase the vortex cores, blue and red lines. The Frenet–Serret frames for
 $t=8.75$
are given in figure 6. A twist in the post-reconnection
 $t=14$
right (
 $x>0$
) vortex is visible.

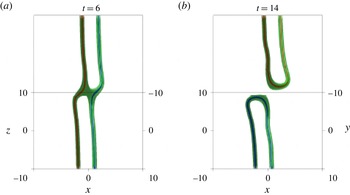
The same
 $\unicode[STIX]{x1D6FF}_{0}=3$
fields and times as in figure 2 from the Nazarenko perspective, which looks down the
 $45^{\circ }$
propagation plane in the
 $y{-}z$
-plane in figure 8(a). This perspective is useful because the pre- and post-reconnection symmetries can be seen most clearly, which is why it is the basis for comparison of reconnection angles in figure 8(b) and § 4.6. The arms are extending away from the reconnection plane, either towards or away from the viewer. Also note that from this perspective, loops are clearly not forming.

2.2 Choice of initial configurations and profiles
Configurations. Two initial vortex configurations are used in this paper, anti-parallel vortices with a perturbation and orthogonal vortices. Both configurations have been used many times for both classical (Navier–Stokes) and quantum fluids, including the first calculations using the three-dimensional Gross–Pitaevskii equations (Koplik & Levine Reference Koplik and Levine1993).
The advantage of focusing on these configurations is that the interactions leading to reconnection for most other configurations, for example colliding or initially linked vortex rings, can be reduced to either anti-parallel or orthogonal dynamics, both of which can resolve the reconnection events in smaller global domains. This is because the initial reconnection events require, effectively, only half of each ring.
These two configurations also represent the two extremes for the initial chirality or linking number of the vortex lines in a quantum fluid. In classical fluids, the corresponding global property is the helicity,
 $h=\int (\unicode[STIX]{x1D735}\times \boldsymbol{u})\boldsymbol{\cdot }\boldsymbol{u}\,\text{d}V$
. When
 $h$
is large, it tends to suppress nonlinear interactions. Anti-parallel initial conditions have zero net helicity and are sensitive to initial instabilities while orthogonal initial conditions have a large helicity, so reconnection can be delayed (Boratav et al.
Reference Boratav, Pelz and Zabusky1992).
Density profile. The density profiles for all the vortex cores in this paper are determined by the following Padé approximate:
 $$\begin{eqnarray}\displaystyle & & \displaystyle |\unicode[STIX]{x1D713}_{sb}|=\sqrt{\unicode[STIX]{x1D70C}_{sb}}={\displaystyle \frac{c_{1}r^{2}+c_{2}r^{4}}{1+d_{1}r^{2}+d_{2}r^{4}}}\nonumber\\ \displaystyle & & \displaystyle \quad \text{with }c_{1}=0.3437,c_{2}=0.0286,d_{1}=0.3333,\text{ and }d_{2}=0.02864.\end{eqnarray}$$
Note that
 $c_{2}\lesssim d_{2}$
, which implies that as
 $r\rightarrow \infty$
, the density approaches the usual background of
 $\unicode[STIX]{x1D70C}=1$
from below more slowly than the true Padé of this order does. The true Padé, derived by Berloff (Reference Berloff2004), has
 $c_{2}=d_{2}=11/384\approx 0.02864$
. Therefore, the profile with
 $c_{2}\lesssim d_{2}$
is designated as
 $\unicode[STIX]{x1D713}_{sb}$
because it is a sub-Berloff (Reference Berloff2004) profile. Furthermore, because the calculations are in finite domains, to ensure that the Neumann boundary conditions are met, a set of up to 24 mirror images of the vortices are multiplied together. This multiplication process takes the slight, original
 $\unicode[STIX]{x1D70C}_{sb}<1$
values as
 $r\rightarrow \infty$
and generates stronger differences. At the boundaries, this gives
 $(1-\unicode[STIX]{x1D70C})\approx 0.02-0.03$
.
For all of the configurations discussed here, using this
 $|\unicode[STIX]{x1D713}|\lesssim 1$
initial profile appears to be crucial in allowing us to obtain clear scaling laws for the pre- and post-reconnection separation of the vortices. As discussed in § 4.2, further tests have confirmed that the temporal separations of all of the true Padé approximates had significant fluctuations. This includes the new Padé’s from Rorai et al. (Reference Rorai, Sreenivasan and Fisher2013), which are close to what one gets using a diffusion steady-state equation as in Meichle et al. (Reference Meichle, Rorai, Fisher and Lathrop2012).
Once the best profile has been chosen, then one must choose the trajectories of the interacting vortices. The anti-parallel global states are shown first in figure 1 as they illustrate the use of all of the three-dimensional diagnostics.
The width of the vortex cores, the healing length
 $a$
, is determined by the distance over which the vortex-core profile
 $\sqrt{\unicode[STIX]{x1D70C}_{sb}(r)}$
rises from zero to
 $\sqrt{\unicode[STIX]{x1D70C}_{sb}(1)}\approx 0.52$
. For our profiles,
 $a\approx 1$
in simulation units.
2.3 Anti-parallel: initial trajectory and global development
Based upon past experience with classical vortices and Kerr (Reference Kerr2011), the positions
 $\boldsymbol{s}_{\pm }(y)$
of the two nearly anti-parallel
 $y$
-vortices, with a perturbation in the direction of propagation
 $x$
, were
 $$\begin{eqnarray}\displaystyle \boldsymbol{s}_{\pm }(y)=\left(\unicode[STIX]{x1D6FF}_{x}\frac{2}{\cosh ((y/\unicode[STIX]{x1D6FF}_{y})^{1.8})}-x_{c},y,\pm z_{c}\right). & & \displaystyle\end{eqnarray}$$
The parameters used were
 $\unicode[STIX]{x1D6FF}_{x}=-1.6$
,
 $\unicode[STIX]{x1D6FF}_{y}=1.25$
,
 $x_{c}=21.04$
and
 $z_{c}=2.35$
. The power of 1.8 on the normalized position was chosen to help localise the perturbation near the
 $y=0$
symmetry plane. The density profiles were applied perpendicular to this trajectory, and not perpendicular to the
 $y$
-axis.
As in Kerr (Reference Kerr2011), two of the Neumann boundaries act as symmetry planes to increase the effective domain size. These planes are the
 $y=0$
,
 $x{-}z$
perturbation plane and
 $z=0$
,
 $x{-}y$
dividing plane. Because the goal of this calculation was to focus upon the scaling around the first reconnection, the long domain used in Kerr (Reference Kerr2011) to generate a chain of vortices is unnecessary and
 $L_{y}$
is less. In addition, based upon recent experience with Navier–Stokes reconnection (Kerr Reference Kerr2013),
 $L_{z}$
was increased to ensure that the evolving vortices do not see their mirror images across the upper
 $z$
Neumann boundary condition.
Figure 1 shows the state at
 $t=0.125$
, essentially the initial condition, and the state at
 $t=4$
, after the first reconnection event at
 $t_{r}\approx 2.4$
. Three isosurfaces are given. Low-density isosurfaces (
 $\unicode[STIX]{x1D70C}=0.05$
), isosurfaces of the kinetic energy
 $K_{\unicode[STIX]{x1D713}}$
(2.4) and isosurfaces of
 $|\unicode[STIX]{x1D74E}_{\unicode[STIX]{x1D713}}|$
(3.1), a pseudo-vorticity that is introduced in the next section. The vortex lines defined by
 $\unicode[STIX]{x1D74E}_{\unicode[STIX]{x1D713}}$
and Proposition 1 in § 3 are shown using thickened curves. The structure at the time of reconnection is discussed in § 5 using figure 12 and how the flow would develop later has already been documented by Kerr (Reference Kerr2011), which shows several reconnections forming a stack of vortex rings.
Both
 $K_{\unicode[STIX]{x1D713}}$
and
 $\unicode[STIX]{x1D74E}_{\unicode[STIX]{x1D713}}$
are functions of the first derivatives of the wave function, but show different aspects of the flow. The
 $K_{\unicode[STIX]{x1D713}}$
isosurfaces show where the momentum is large. Initially, the momentum is dominated by forward motion between the perturbations, as shown for
 $t=0.125$
. Post-reconnection, at
 $t=4$
, the
 $K_{\unicode[STIX]{x1D713}}$
surfaces show that the primary motion is around the vortices.
 $|\unicode[STIX]{x1D74E}_{\unicode[STIX]{x1D713}}|$
is large where the vortex cores bulge and have the greatest curvature.
2.4 Orthogonal: initial separations and global development
The orthogonal vortices are respectively parallel to the
 $y$
axis and parallel to the
 $z$
axis through two points on either side of
 $x=y=z=0$
on the line through
 $y=z=0$
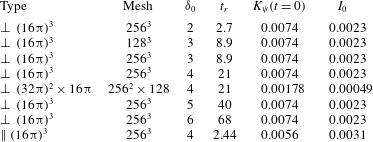
. The five separations and other details of the simulations are given in table 1. Because all of the orthogonal cases with
 $\unicode[STIX]{x1D6FF}_{0}\geqslant 2$
behave qualitatively in the same manner, all of the orthogonal three-dimensional images will be taken from the
 $256^{3}$
,
 $\unicode[STIX]{x1D6FF}_{0}=3$
calculation, whose estimated reconnection occurs at time
 $t_{r}=8.9$
.
Cases: type is orthogonal
 $\bot$
or anti-parallel
 $\Vert$
, initial separations, approximate reconnection times, initial kinetic and interaction energies.

The first two sets of three-dimensional isosurfaces and vortex lines in figures 2 and 3 are used to show the global evolution of the vortices through reconnection, with figure 2 providing a true three-dimensional perspective of the orthogonality and figure 3, defined by figure 8(b), providing a perspective down the
 $y=z$
axis, which is also used for the determination of three-dimensional angles in § 4.4. The three times chosen for each are
 $t=4$
, pre-reconnection,
 $t=8.5$
as reconnection begins and
 $t=19$
, post-reconnection.
The two isosurfaces are for a low density of
 $\unicode[STIX]{x1D70C}=0.05$
and kinetic energy of
 $K_{\unicode[STIX]{x1D713}}=0.5$
, where
 $\max (K_{\unicode[STIX]{x1D713}})=0.58$
. There are two pseudo-vortex lines (3.1) in each frame, one that originates on the
 $y=0$
plane and the other on the
 $z=0$
plane. The
 $t=8.5$
frame also shows some additional orientation vectors that will be discussed in § 4.
Some qualitative features are:
-
(i) The initially orthogonal vortices are attracted towards each other at their points of closest approach, asymmetrically bending out towards each other.
-
(ii) During this stage there is a some loss of the kinetic energy between
 $t=8$
and
$t=11$
,
$\unicode[STIX]{x1D6E5}_{t}K_{\unicode[STIX]{x1D713}}<10\,\%K_{\unicode[STIX]{x1D713}}(t=0)$
. This is converted into interaction energy
$I$
(2.4). There are no further noticeable changes in
$K_{\unicode[STIX]{x1D713}}$
for
$t>12$
.
-
(iii) After reconnection, from one perspective there is a slight twist on one vortex, but it is not twisted enough for the vortices to loop back upon themselves and reconnect again. Instead, the two new vortices pull back from one another, as shown by the
$t=19$
frame in figure 2. This is consistent with experimental observations of vortex interactions using solid hydrogen particles (Bewley et al.
Reference Bewley, Paoletti, Sreenivasan and Lathrop2008; Schwarzschild Reference Schwarzschild2010) in the sense that post-reconnection filaments simply pull back from one another and do not loop. Section 4.3 provides further structural information using the axes of the respective Frenet–Serret frames.





3 The vortex-core pseudo-vorticity tracking method
The section describes the pseudo-vorticity method we use to accurately track the vortex cores. Its basis is that the quantum vortex lines of zero, and minimum, density will be perpendicular to the gradients of the real and imaginary parts of the wave function, and therefore in the direction of the following pseudo-vorticity:
 $$\begin{eqnarray}\displaystyle \unicode[STIX]{x1D74E}_{\unicode[STIX]{x1D713}}=0.5\unicode[STIX]{x1D735}\unicode[STIX]{x1D713}_{r}\times \unicode[STIX]{x1D735}\unicode[STIX]{x1D713}_{i}. & & \displaystyle\end{eqnarray}$$
The inspiration for this approach comes from the Clebsch potential formulation of the classical incompressible Euler equations, where the vorticity is formed from the gradients of the Clebsch potential by taking their cross-product.
Proposition 1. At points with
 $\unicode[STIX]{x1D70C}=0$
, the direction of the quantised vortex is defined by the direction of
 $\unicode[STIX]{x1D74E}_{\unicode[STIX]{x1D713}}=0.5\unicode[STIX]{x1D735}\unicode[STIX]{x1D713}_{r}\times \unicode[STIX]{x1D735}\unicode[STIX]{x1D713}_{i}$
.
Proof. A quantised vortex is defined by
 $\unicode[STIX]{x1D70C}\equiv 0$
, which, because
 $\unicode[STIX]{x1D70C}=\unicode[STIX]{x1D713}_{r}^{2}+\unicode[STIX]{x1D713}_{i}^{2}$
, implies that
 $\unicode[STIX]{x1D713}_{r}=\unicode[STIX]{x1D713}_{i}=0$
on this vortex line.
Then define
 $\hat{\unicode[STIX]{x1D714}}_{\unicode[STIX]{x1D70C}}$
, the direction vector of the line at any arbitrary point on the vortex line. By the definition of the line, the values of
 $\unicode[STIX]{x1D713}_{r}$
and
 $\unicode[STIX]{x1D713}_{i}$
in this direction must not change and thus we know that
 $\unicode[STIX]{x1D735}\unicode[STIX]{x1D713}$
must satisfy
 $$\begin{eqnarray}\displaystyle \hat{\unicode[STIX]{x1D714}}_{\unicode[STIX]{x1D70C}}\boldsymbol{\cdot }\unicode[STIX]{x1D735}\unicode[STIX]{x1D713}_{r}=\hat{\unicode[STIX]{x1D714}}_{\unicode[STIX]{x1D70C}}\boldsymbol{\cdot }\unicode[STIX]{x1D735}\unicode[STIX]{x1D713}_{i}=0 & & \displaystyle\end{eqnarray}$$
at these points. This is only possible if
 $\hat{\unicode[STIX]{x1D74E}}_{\unicode[STIX]{x1D70C}}=(\unicode[STIX]{x1D735}\unicode[STIX]{x1D713}_{r}\times \unicode[STIX]{x1D735}\unicode[STIX]{x1D713}_{i})/|\unicode[STIX]{x1D735}\unicode[STIX]{x1D713}_{r}\times \unicode[STIX]{x1D735}\unicode[STIX]{x1D713}_{i}|$
.◻
Once
 $\unicode[STIX]{x1D74E}_{\unicode[STIX]{x1D713}}$
is known over all space, the trajectories of the vortex lines
 $\boldsymbol{r}(s)$
can be determined by integrating the equation
 $\text{d}\boldsymbol{r}(s)/\text{d}s=\unicode[STIX]{x1D74E}(\boldsymbol{r})$
from initial
 $\unicode[STIX]{x1D70C}\approx 0$
seed points. The seeds were chosen on the domain boundaries by extracting the locations, on the boundaries, of the vertices of
 $\unicode[STIX]{x1D70C}\gtrsim 0$
isosurface meshes, determined using Matlab, then averaging the positions of those vertices. The method requires that the isosurface density
 $\unicode[STIX]{x1D70C}$
be small enough that the positions of only 3–6 vertices need to averaged. A variation of this method can be used to identify the vortex cores throughout the domain and, while it fails around reconnection points due to the extensive
 $\unicode[STIX]{x1D70C}\approx 0$
zone, provides important validation of the pseudo-vorticity method.
Potentially, the pseudo-vorticity method could fail near the time and position of reconnection because both
 $\unicode[STIX]{x1D70C}\approx 0$
and
 $\unicode[STIX]{x1D735}\unicode[STIX]{x1D713}_{r,i}$
are small. In practice, this has not been a problem.
Once the lines have been found, the derivatives along their trajectories of their three-dimensional positions can be determined, and from those derivatives the local curvature, Frenet–Serret coordinate frames and possibly the local motion of the lines can be found. Properties that could be compared to the predictions of vortex filament models.
To analyse these properties, the following alternative definition of the pseudo-vorticity is useful.
Corollary 1.
 $\hat{\unicode[STIX]{x1D74E}}_{\unicode[STIX]{x1D70C}}=\hat{\unicode[STIX]{x1D74E}}_{\unicode[STIX]{x1D713}}$
where
 $\hat{\unicode[STIX]{x1D74E}}_{\unicode[STIX]{x1D70C}}=\unicode[STIX]{x1D735}\unicode[STIX]{x1D70C}\times \unicode[STIX]{x1D735}\unicode[STIX]{x1D719}/|\unicode[STIX]{x1D735}\unicode[STIX]{x1D70C}\times \unicode[STIX]{x1D735}\unicode[STIX]{x1D719}|$
.
Proof. Start with
 $\unicode[STIX]{x1D713}_{r}=\sqrt{\unicode[STIX]{x1D70C}}\cos \unicode[STIX]{x1D719}$
and
 $\unicode[STIX]{x1D713}_{i}=\sqrt{\unicode[STIX]{x1D70C}}\sin \unicode[STIX]{x1D719}$
.
Expand:
 $0.5\unicode[STIX]{x1D735}\unicode[STIX]{x1D713}_{r}\times \unicode[STIX]{x1D735}\unicode[STIX]{x1D713}_{i}=[\unicode[STIX]{x1D735}\sqrt{\unicode[STIX]{x1D70C}}\cos \unicode[STIX]{x1D719}-\sqrt{\unicode[STIX]{x1D70C}}\sin \unicode[STIX]{x1D719}\unicode[STIX]{x1D735}\unicode[STIX]{x1D719}]\times [\unicode[STIX]{x1D735}\sqrt{\unicode[STIX]{x1D70C}}\sin \unicode[STIX]{x1D719}+\sqrt{\unicode[STIX]{x1D70C}}\cos \unicode[STIX]{x1D719}\unicode[STIX]{x1D735}\unicode[STIX]{x1D719}]$
.
Remove all
 $\unicode[STIX]{x1D713}_{r}$
and
 $\unicode[STIX]{x1D713}_{i}$
terms sharing the same gradient to reduce this to
 $$\begin{eqnarray}\displaystyle 2(\unicode[STIX]{x1D735}\sqrt{\unicode[STIX]{x1D70C}}\times \unicode[STIX]{x1D735}\unicode[STIX]{x1D719}\sqrt{\unicode[STIX]{x1D70C}}\cos ^{2}\unicode[STIX]{x1D719}-\unicode[STIX]{x1D735}\unicode[STIX]{x1D719}\times \unicode[STIX]{x1D735}\sqrt{\unicode[STIX]{x1D70C}}\sqrt{\unicode[STIX]{x1D70C}}\sin ^{2}\unicode[STIX]{x1D719}). & & \displaystyle\end{eqnarray}$$
Finally, use
 $\unicode[STIX]{x1D735}\sqrt{\unicode[STIX]{x1D70C}}=\unicode[STIX]{x1D735}\unicode[STIX]{x1D70C}/(2\sqrt{\unicode[STIX]{x1D70C}})$
to get
 $\unicode[STIX]{x1D74E}_{\unicode[STIX]{x1D713}}=\unicode[STIX]{x1D735}\unicode[STIX]{x1D70C}\times \unicode[STIX]{x1D735}\unicode[STIX]{x1D719}$
.◻
Do these lines follow the cores of
 $\unicode[STIX]{x1D70C}\equiv 0$
? One test is to interpolate the densities from the Cartesian mesh to the vortex lines. The result is that these densities are very small, but not exactly zero. Another test is simultaneously plot the pseudo-vorticity lines along with very low isosurfaces of density, examples of which are given in figures 1 and 2. The centres of the isosurfaces and the lines are almost indistinguishable.
Using the next proposition, the motion of the
 $\unicode[STIX]{x1D70C}=0$
lines given by the time derivative of
 $\unicode[STIX]{x1D713}$
can be written exactly using just the gradients and Laplacians of the wave function
 $\unicode[STIX]{x1D713}$
. This will be used in a later paper.
Proposition 2. The motion of the vortex line is given by the coupled set of equations
 $$\begin{eqnarray}\displaystyle \left.\begin{array}{@{}c@{}}\displaystyle (\unicode[STIX]{x1D735}\unicode[STIX]{x1D713}_{r}\times \unicode[STIX]{x1D735}\unicode[STIX]{x1D713}_{i})\cdot \frac{\text{d}}{\text{d}t}\boldsymbol{x}(s,t)=0,\\ \displaystyle -\unicode[STIX]{x1D735}\unicode[STIX]{x1D713}_{r}\cdot \frac{\text{d}}{\text{d}t}\boldsymbol{x}(s,t)=-0.5\unicode[STIX]{x0394}\unicode[STIX]{x1D713}_{i},\\ \displaystyle -\unicode[STIX]{x1D735}\unicode[STIX]{x1D713}_{i}\cdot \frac{\text{d}}{\text{d}t}\boldsymbol{x}(s,t)=0.5\unicode[STIX]{x0394}\unicode[STIX]{x1D713}_{r}.\end{array}\right\} & & \displaystyle\end{eqnarray}$$
The solution of which is
 $$\begin{eqnarray}\displaystyle \frac{\text{d}}{\text{d}t}\boldsymbol{x}(s,t)=-0.5\frac{\unicode[STIX]{x0394}\unicode[STIX]{x1D713}_{i}(\unicode[STIX]{x1D74E}_{\unicode[STIX]{x1D713}}\times \unicode[STIX]{x1D735}\unicode[STIX]{x1D713}_{i})+\unicode[STIX]{x0394}\unicode[STIX]{x1D713}_{r}(\unicode[STIX]{x1D74E}_{\unicode[STIX]{x1D713}}\times \unicode[STIX]{x1D735}\unicode[STIX]{x1D713}_{i})}{\unicode[STIX]{x1D74E}_{\unicode[STIX]{x1D713}}^{2}} & & \displaystyle\end{eqnarray}$$
where the pseudo-vorticity
 $\unicode[STIX]{x1D74E}_{\unicode[STIX]{x1D713}}:=\unicode[STIX]{x1D735}\unicode[STIX]{x1D713}_{r}\times \unicode[STIX]{x1D735}\unicode[STIX]{x1D713}_{i}$
.
Proof. We already know that the trajectory of the vortex lines is defined by the pseudo-vorticity
 $\unicode[STIX]{x1D74E}_{\unicode[STIX]{x1D713}}=\unicode[STIX]{x1D735}\unicode[STIX]{x1D713}_{r}\times \unicode[STIX]{x1D735}\unicode[STIX]{x1D713}_{i}$
from the proposition above.
Since the density remains zero along this line, the motion we are interested in is perpendicular to this direction.
On the
 $\unicode[STIX]{x1D70C}=\unicode[STIX]{x1D713}_{r}^{2}+\unicode[STIX]{x1D713}_{i}^{2}\equiv 0$
lines the time derivatives of
 $\unicode[STIX]{x1D713}_{r,i}$
are:
 $$\begin{eqnarray}\displaystyle \left.\begin{array}{@{}c@{}}\displaystyle \frac{\unicode[STIX]{x2202}}{\unicode[STIX]{x2202}t}\unicode[STIX]{x1D713}_{r}=-0.5\unicode[STIX]{x0394}\unicode[STIX]{x1D713}_{i},\\ \displaystyle \frac{\unicode[STIX]{x2202}}{\unicode[STIX]{x2202}t}\unicode[STIX]{x1D713}_{i}=0.5\unicode[STIX]{x0394}\unicode[STIX]{x1D713}_{r}.\end{array}\right\} & & \displaystyle\end{eqnarray}$$
Next we can Taylor expand to first order
 $\unicode[STIX]{x1D713}_{r,i}$
about the parameterised curve
 $\boldsymbol{x}(s,t)$
:
 $$\begin{eqnarray}\displaystyle \unicode[STIX]{x1D713}_{r}=(\unicode[STIX]{x1D735}\unicode[STIX]{x1D713}_{r})(\boldsymbol{x}-\boldsymbol{x}(s,t))\quad \text{and}\quad \unicode[STIX]{x1D713}_{i}=(\unicode[STIX]{x1D735}\unicode[STIX]{x1D713}_{i})(\boldsymbol{x}-\boldsymbol{x}(s,t)) & & \displaystyle\end{eqnarray}$$
and their time derivatives again to first order are
 $$\begin{eqnarray}\displaystyle \left.\begin{array}{@{}c@{}}\displaystyle \frac{\unicode[STIX]{x2202}}{\unicode[STIX]{x2202}t}\unicode[STIX]{x1D713}_{r}=\left(\unicode[STIX]{x1D735}\frac{\unicode[STIX]{x2202}}{\unicode[STIX]{x2202}t}\unicode[STIX]{x1D713}_{r}\right)(\boldsymbol{x}-\boldsymbol{x}(s,t))-\unicode[STIX]{x1D735}\unicode[STIX]{x1D713}_{r}\frac{\text{d}}{\text{d}t}\boldsymbol{x}(s,t)\approx -\unicode[STIX]{x1D735}\unicode[STIX]{x1D713}_{r}\frac{\text{d}}{\text{d}t}\boldsymbol{x}(s,t),\\ \displaystyle \frac{\unicode[STIX]{x2202}}{\unicode[STIX]{x2202}t}\unicode[STIX]{x1D713}_{i}=\left(\unicode[STIX]{x1D735}\frac{\unicode[STIX]{x2202}}{\unicode[STIX]{x2202}t}\unicode[STIX]{x1D713}_{i}\right)(\boldsymbol{x}-\boldsymbol{x}(s,t))-\unicode[STIX]{x1D735}\unicode[STIX]{x1D713}_{i}\frac{\text{d}}{\text{d}t}\boldsymbol{x}(s,t)\approx -\unicode[STIX]{x1D735}\unicode[STIX]{x1D713}_{i}\frac{\text{d}}{\text{d}t}\boldsymbol{x}(s,t).\end{array}\right\} & & \displaystyle\end{eqnarray}$$
By adding that the motion will be perpendicular to the vortex (i.e. the pseudo-vorticity
 $\unicode[STIX]{x1D735}\unicode[STIX]{x1D713}_{r}\times \unicode[STIX]{x1D735}\unicode[STIX]{x1D713}_{i}$
) to the two time derivative equations, one gets the required three coupled equations.◻
3.1 Curvature obtained from the
$\unicode[STIX]{x1D714}_{\unicode[STIX]{x1D713}}$
lines

The curvature of the lines identified by the pseudo-vorticity algorithm will be found by applying the Frenet–Serret relations to the derivatives of the trajectories
 $\boldsymbol{r}(s)$
of the vortex lines.
Definition 3.1. The Frenet–Serret frame for any smooth curve
 $\boldsymbol{r}(s):[0,1]\rightarrow \mathbb{R}^{3}$
has an orthonormal triple of unit vectors
 $(\boldsymbol{T},\boldsymbol{N},\boldsymbol{B})$
at each point
 $\boldsymbol{r}(s)$
where
 $\boldsymbol{T}(s)$
is the tangent,
 $\boldsymbol{N}(s)$
is the normal and
 $\boldsymbol{B}(s)$
is the bi-normal. The following relations between
 $(\boldsymbol{T},\boldsymbol{N},\boldsymbol{B})$
define the curvature
 $\unicode[STIX]{x1D705}$
and torsion
 $\unicode[STIX]{x1D70F}$
:
 $$\begin{eqnarray}\displaystyle & \boldsymbol{T}(s)=\unicode[STIX]{x2202}_{s}\boldsymbol{r}(s), & \displaystyle\end{eqnarray}$$
 $$\begin{eqnarray}\displaystyle & \unicode[STIX]{x2202}_{s}\boldsymbol{T}=\unicode[STIX]{x1D705}\boldsymbol{N}, & \displaystyle\end{eqnarray}$$
 $$\begin{eqnarray}\displaystyle & \unicode[STIX]{x2202}_{s}\boldsymbol{N}=\unicode[STIX]{x1D70F}\boldsymbol{B}-\unicode[STIX]{x1D705}\boldsymbol{T}, & \displaystyle\end{eqnarray}$$
 $$\begin{eqnarray}\displaystyle & \unicode[STIX]{x2202}_{s}\boldsymbol{B}=-\unicode[STIX]{x1D70F}\boldsymbol{N}. & \displaystyle\end{eqnarray}$$
The numerical algorithm for calculating the curvature
 $\unicode[STIX]{x1D705}$
and its normal eigenvector
 $\boldsymbol{N}$
uses the function gradient in Matlab twice. That is, first
 $\boldsymbol{r}_{,s}$
and then
 $\boldsymbol{r}_{,ss}$
are generated. Next, normalising
 $\boldsymbol{r}_{,s}$
gives the tangent vector
 $\boldsymbol{T}$
, the direction vector between points on the vortex lines. Finally, the derivative of
 $\boldsymbol{T}$
gives us both the curvature,
 $\unicode[STIX]{x1D705}=|\unicode[STIX]{x2202}_{s}\boldsymbol{T}|$
and the normal
 $\boldsymbol{N}=\unicode[STIX]{x2202}_{s}\boldsymbol{T}/\unicode[STIX]{x1D705}$
. In practice it is better to calculate the curvature using:
 $$\begin{eqnarray}\displaystyle \unicode[STIX]{x1D705}=|\boldsymbol{r}_{,s}\times \boldsymbol{r}_{,ss}|/|\boldsymbol{r}_{,s}|^{3}. & & \displaystyle\end{eqnarray}$$
4 Orthogonal reconnection: new scaling laws and their geometry
The goals of this section are to apply the pseudo-vorticity algorithm (3.1) to the evolution of the initially orthogonal vortex lines and use these positions to demonstrate that the separation scaling laws for the originally orthogonal vortices deviate strongly from the mean-field prediction for all initial separations and for all times.
The major points to be demonstrated for the orthogonal calculations are:
-
(i) For strictly orthogonal initial vortices, there is just one reconnection and loops do not form out of the post-reconnection vortices in figure 2.
-
(ii) The sub-Berloff profiles are crucial for obtaining temporal evolution that is smooth enough to allow clear scaling laws for the pre- and post-reconnection separations to be determined (Rorai Reference Rorai2012).
-
(iii) The separation scaling laws before and after reconnection are the same for each case, with the following surprising results. Before reconnection
$\unicode[STIX]{x1D6FF}_{in}\sim (t_{r}-t)^{1/3}$
, which is slower than the dimensional scaling (1.1). And after reconnection
$\unicode[STIX]{x1D6FF}_{in}\sim (t_{r}-t)^{2/3}$
, faster than the dimensional scaling (1.1). Possible relationships between these scaling laws and those for the intermediate orientations of Rorai (Reference Rorai2012) and Zuccher et al. (Reference Zuccher, Caliari, Baggaley and Barenghi2012) are discussed in § 6. -
(iv) This non-dimensional scaling arises as soon as the vorticity tangent vectors at their closest points are anti-parallel and the alignment of the averaged Frenet–Serret frames at these points with respect to the separation vector are respectively orthogonal, parallel and orthogonal for the averaged tangent, curvature and bi-normal.
-
(v) Reconnection occurs in the reconnection or osculating plane defined by the tangent
$\boldsymbol{T}$
and normal
$\boldsymbol{N}$
vectors (that is the vorticity and curvature directions) of the two vortices at the points of closest approach and at times
$t\approx t_{r}$
. Surprisingly, this alignment of the points of closest approach is seen from early to late times for the orthogonal cases, see figure 9. -
(vi) Angles taken between the reconnection event and the larger-scale structure are convex, not concave or acute, which could be the source of the non-dimensional separation scaling laws.


4.1 Approach and separation
To determine the separation scaling laws before and after reconnection, these steps are followed.
-
(i) First, the trajectories of the
$y$
and
$z$
vortex lines, originating respectively on the
$y=0$
and
$z=0$
planes, are identified by applying the Matlab streamline algorithm to the pseudo-vorticity field
$\unicode[STIX]{x1D74E}_{\unicode[STIX]{x1D713}}$
. -
(ii) Next, points
$\boldsymbol{x}_{y}$
and
$\boldsymbol{x}_{z}$
are the points of closest approach and the time dependence of the minimum separation distance
$\unicode[STIX]{x1D6FF}_{yz}(t)=|\boldsymbol{x}_{y}-\boldsymbol{x}_{z}|$
were identified and plotted, as in the inset of figure 5. -
(iii) Once it was clear that neither the incoming nor outgoing separations obeyed the dimensional expectation (1.1), several alternative scaling laws were applied to the separations. Only the
$1/3$
incoming power law and outgoing
$2/3$
law working well for every case. Then, by using these power laws, refined estimates of
$\tilde{t}_{r}(\unicode[STIX]{x1D6FF}_{0})$
were made by cubing the
$\unicode[STIX]{x1D6FF}$
separations for
$t<\tilde{t}_{r}(\unicode[STIX]{x1D6FF}_{0})$
) and taking the
$3/2$
power of
$\unicode[STIX]{x1D6FF}$
for
$t>\tilde{t}_{r}(\unicode[STIX]{x1D6FF}_{0})$
. -
(iv) For all of the initial
$\unicode[STIX]{x1D6FF}_{0}$
, the estimates of
$t_{r}$
using the
$t<t_{r}$
(cubic) and
$t>t_{r}$
(
$3/2$
) fits gave nearly identical
$t_{r}$
, which were then combined and used to give the fit
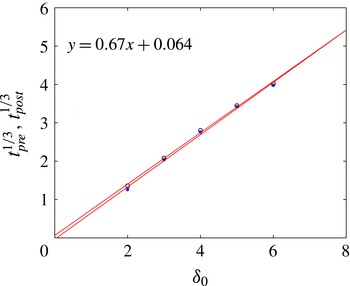
$t_{r}(\unicode[STIX]{x1D6FF}_{0})=(0.67\unicode[STIX]{x1D6FF}_{0}+0.064)^{3}$
shown in figure 4. -
(v) Using these
$t_{r}(\unicode[STIX]{x1D6FF}_{0})$
, figure 5 compares the scaled pre- and post-reconnection separations
$\unicode[STIX]{x1D6FF}(t)$
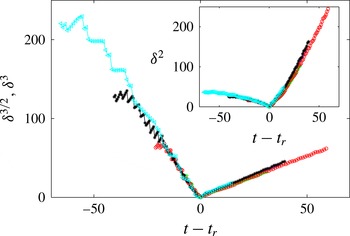
by overlaying all five cases from Rorai (Reference Rorai2012) using (4.1a,b )The inset illustrates the strength of the new scaling laws compared to the dimensional prediction (1.1) by scaling the separations
$$\begin{eqnarray}\displaystyle \unicode[STIX]{x1D6FF}_{in}\sim |t_{r}-t|^{1/3}\quad \text{for }t<t_{r}(\unicode[STIX]{x1D6FF}_{0})\quad \text{and}\quad \unicode[STIX]{x1D6FF}_{out}\sim |t-t_{r}|^{2/3}\quad \text{for }t>t_{r}(\unicode[STIX]{x1D6FF}_{0}).\quad & & \displaystyle\end{eqnarray}$$
$\unicode[STIX]{x1D6FF}_{yz}(t)$
using (1.1).





Reconnection times as a function of the initial separation. Reconnection times are estimated by using times immediately before and after reconnection plus the empirical
 $1/3$
and
 $2/3$
scaling laws.

Pre- and post-reconnection separations for five cases:
 $\unicode[STIX]{x1D6FF}_{0}=2,3,4,5,6$
for calculations with
 $256^{3}$
points. ●:
 $\unicode[STIX]{x1D6FF}_{0}=2$
,
 $+$
:
 $\unicode[STIX]{x1D6FF}_{0}=3$
, ○:
 $\unicode[STIX]{x1D6FF}_{0}=4$
,
 $\divideontimes$
:
 $\unicode[STIX]{x1D6FF}_{0}=5$
, ▵:
 $\unicode[STIX]{x1D6FF}_{0}=6$
. Pre-reconnection distances are raised to the power 3, while post-reconnection distances are raised to the power
 $3/2$
. This scaling is visibly better than the dimensional prediction (
 $\unicode[STIX]{x1D6FF}^{2}$
versus time to reconnection) shown in the inset. The scaled separations for
 $t<t_{r}$
fluctuate more strongly than the
 $t>t_{r}$
scaled separations.

4.2 Sub-Berloff profile
To obtain the clear scaling laws of figure 5, it was necessary to apply both the sub-Berloff profile (2.7) and the mirror images, as discussed above. To demonstrate the value of the sub-Berloff profile, additional calculations were done using the best full Padé approximate profiles in the same geometries and either used mirror images or did not. This included, the true Berloff profile, that is (2.7) with
 $c_{2}=d_{2}=0.02864$
, the low-order
 $1\times 1$
Padé approximate of the Fetter (Reference Fetter, Mahanthappa and Brittin1969), (2.7) with
 $d_{1}=1$
and
 $c_{2}=d_{2}=0$
, and the Padé approximates from Rorai et al. (Reference Rorai, Sreenivasan and Fisher2013), solutions that are very close to the ideal diffusive solution. All gave approach and separation curves similar to those for the orthogonal case in Zuccher et al. (Reference Zuccher, Caliari, Baggaley and Barenghi2012), including temporal oscillations in the separations
 $\unicode[STIX]{x1D6FF}_{yz}$
as well as weak signatures of the clear and distinctly different approach and separation scaling laws that we are reporting. Further work will be needed to identify why instabilities generated on the vortex lines are either suppressed by the sub-Berloff profile or absorbed by it.
4.3 Evolution of the orthogonal geometry during reconnection
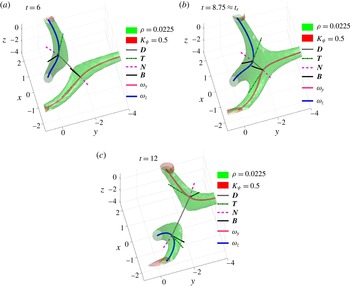
Isosurfaces, quantum vortex lines and orientation vectors in three dimensions for the
 $\unicode[STIX]{x1D6FF}_{0}=3$
,
 $256^{3}$
calculation at
 $t=6$
(a),
 $t=8.75$
(b) and
 $t=12$
(c) where
 $t_{r}\approx 8.9$
. Lines and vectors at the closest points on each vortex are the separation
 $D$
and Frenet–Serret vectors (3.9):
 $\boldsymbol{T}$
,
 $\boldsymbol{N}$
and
 $\boldsymbol{B}$
.

The three-dimensional evolution of the vortices is illustrated in figures 2, 3 and 6 and the alignments at or near reconnection are illustrated with two sketches taken from different perspectives in figure 8(a,b). Figures 2 and 3 illustrate the global changes in structure from two perspectives. One a general perspective and another that shows the symmetries by looking down the
 $y=z$
 $45^{\circ }$
direction. This view was inspired by the linear reconnection model Nazarenko & West (Reference Nazarenko and West2003) and is designated the NP perspective. Each figure has a
 $t=6$
frame, long before the reconnection at
 $t_{r}\approx 8.9$
, and a frame at
 $t=14$
, long after reconnection.
The local in time and space evolution around the reconnection is illustrated using the sketches and these three times in figure 6:
 $t=6$
is at the beginning of reconnection,
 $t=8.75$
is just before the reconnection time of
 $t_{r}\approx 8.9$
and
 $t=12$
shows the end of reconnection. Over this period the
 $\unicode[STIX]{x1D70C}=0.05$
isosurfaces change slowly while the
 $\unicode[STIX]{x1D70C}\equiv 0$
pseudo-vorticity lines within them move rapidly towards one another. The Frenet–Serret frames around the points of closest approach are discussed in §§ 4.4 and 4.5.
Figure 8(a,b) provides two planar sketches at or near the reconnection time, with the best reference point for each being the mid-point between the closest points on the two vortices:
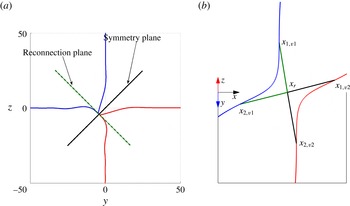
 $$\begin{eqnarray}\displaystyle \boldsymbol{x}_{r}(\unicode[STIX]{x1D6FF}_{0},t)=0.5(\boldsymbol{x}_{y}(t)+\boldsymbol{x}_{z}(t)). & & \displaystyle\end{eqnarray}$$
The sketch in figure 8(a) projects the vortices at the reconnection time
 $t_{r}$
onto the
 $y{-}z$
plane around the point of reconnection:
 $\boldsymbol{x}_{r}(\unicode[STIX]{x1D6FF}_{0},t_{r})$
, along with the two planes of interest, the reconnection or osculating plane and the propagation/symmetry plane. These are defined in terms of the average Frenet–Serret basis vectors (4.3) in § 4.5. The second sketch in figure 8(b) looks down the
 $x=0$
,
 $y=z$
 $45^{\circ }$
direction of propagation of
 $\boldsymbol{x}_{r}(\unicode[STIX]{x1D6FF}_{0},t)$
onto the
 $\boldsymbol{T}_{av}\times \boldsymbol{N}_{av}$
(4.3) reconnection plane. Important features include:
-
(i) Because figure 8(a) is at
$t=t_{r}$
, the projections of the planes and vortices all cross at
$\boldsymbol{x}=\boldsymbol{x}_{r}(\unicode[STIX]{x1D6FF}_{0},t_{r})$
, which means that the red and blue curves trace both the pre- and post-reconnection trajectories of the vortices, as follows:-
(1) The trajectories before reconnection follow the curves parallel to the
$y=0$
and
$z=0$
axes that are half blue and half red. These are projections of the red and blue lines in figure 8(b). -
(2) The trajectories immediately after reconnection are indicated by the red and blue curves coming out of the reconnection plane.
-
-
(ii) The two orthogonal lines through
$\boldsymbol{x}_{r}$
represent the reconnection and propagation planes:-
(1) The reconnection plane, defined by
$\boldsymbol{T}_{av}=0.5(\boldsymbol{T}_{y}-\boldsymbol{T}_{z})$
and
$\boldsymbol{N}_{av}=0.5(\boldsymbol{N}_{y}-\boldsymbol{N}_{z})$
(4.3). Before or after reconnection, the separation vector
$\boldsymbol{D}=(\boldsymbol{x}_{z}-\boldsymbol{x}_{y})/|\boldsymbol{x}_{z}-\boldsymbol{x}_{y}|\neq 0$
is also in this plane.-
(I) It is shown below that
$\boldsymbol{T}_{y,z}$
and
$\boldsymbol{N}_{y,z}$
swap at reconnection, so all of these basis vectors stay in this plane after reconnection.
-
-
(2) And the propagation plane, which contains the velocity of
$\boldsymbol{x}_{r}(\unicode[STIX]{x1D6FF}_{0},t)$
and the average bi-normal
$\boldsymbol{B}_{av}=0.5(\boldsymbol{B}_{y}+\boldsymbol{B}_{z})$
(4.3).
-
-
(iii) The
$x=0$
,
$y=z$
projection in figure 8(b) is the NP perspective inspired by the linear model of Nazarenko & West (Reference Nazarenko and West2003), which tells us that
$\boldsymbol{x}_{r}=0.5(\boldsymbol{x}_{y}+\boldsymbol{x}_{z})$
translates in the
$(-y,-z)$
direction. This motion tells us that the reconnection does not occur at the centre of the computational box.-
(1) Note that for the points on either side of
$\boldsymbol{x}_{r}$
, the tangents
$\boldsymbol{T}_{y,z}$
and curvature vectors
$\boldsymbol{N}_{y,z}$
are anti-parallel. The components that are not anti-parallel are directed out of the Nazarenko perspective. This also holds for the lines across the central, green
$\unicode[STIX]{x1D70C}=0.05$
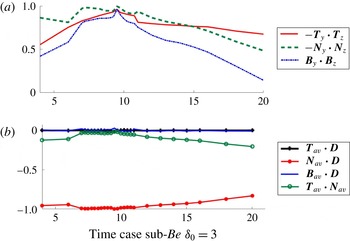
isosurface in figure 6(b). Figure 9(a) shows how
$\boldsymbol{T}_{y}\boldsymbol{\cdot }\boldsymbol{T}_{z}$
,
$\boldsymbol{N}_{y}\boldsymbol{\cdot }\boldsymbol{N}_{z}$
and
$\boldsymbol{B}_{y}\boldsymbol{\cdot }\boldsymbol{B}_{z}$
converge to this state as
$t\rightarrow t_{r}$
. -
(2) The lines drawn across the centre of figure 8(b) are used to determine the long-range angles discussed in § 4.6.
-








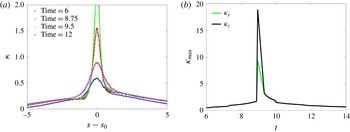
Curvature of the vortex lines is given only for the
 $\unicode[STIX]{x1D6FF}_{0}=\text{3, 256}^{3}$
calculation with
 $t_{r}\approx 8.9$
as the curves about
 $t_{r}(\unicode[STIX]{x1D6FF}_{0})$
are similar for all
 $\unicode[STIX]{x1D6FF}_{0}$
. (a) Curvatures against arclength
 $s$
at four times:
 $t=6$
, 8.75, 9.5 and 12. The profiles for the other line are similar, with their maximum peaks at
 $t=9.5$
, both off the plotted scale. (b) Time evolution of the maximum curvatures of the two lines. For each line there is a sudden jump to the large post-reconnection maximum at
 $t=t_{r}$
.

(a) Sketch of the orthogonal reconnection around the reconnection point
 $\boldsymbol{x}_{r}$
at the reconnection time
 $t_{r}$
of the vortices projected onto the
 $y{-}z$
plane. The pre-reconnection trajectories approximately follow the
 $y{-}y_{mid}=0$
and
 $z{-}y_{mid}=0$
axes and the post-reconnection trajectories are the red and blue lines. Two projected planes are indicated in black. The reconnection plane
 $(z{-}z_{r})=-(y{-}y_{r})$
contains the tangents to the vortex lines
 $\boldsymbol{T}_{y,z}$
and their curvature vectors
 $\boldsymbol{N}_{y,z}$
both before and after reconnection, as well at the separation vector between the closest points
 $\boldsymbol{x}_{y,z}$
. The propagation/symmetry plane
 $(z{-}z_{r})=(y{-}y_{r})$
which contains the bi-normals
 $\boldsymbol{B}_{y,z}$
and the direction of propagation of the mid-point
 $\boldsymbol{x}_{r}(t)$
between the closest points of the vortices:
 $\boldsymbol{x}_{y}$
and
 $\boldsymbol{x}_{z}$
. From this perspective the angles along the reconnection plane before reconnection are shallow, and those after reconnection are sharp. (b) Sketch just before reconnection using the Nazarenko perspective, that is looking down on the reconnection plane along the propagation/symmetry plane. Four line segments (in three-dimensions) have been added that connect
 $\boldsymbol{x}_{r}$
, the mid-point between the vortices at closest approach, to four points, each located
 $\unicode[STIX]{x0394}s$
units along the vortices from their respective closest points. Angles generated between adjacent segments as a function of
 $\unicode[STIX]{x0394}s$
are plotted in figure 11.

4.4 Curvature
Curvature has played a central role in our understanding of quantum turbulence due to its use in predicting velocities in the law of Biot–Savart and the local induction approximation. The connection between these approximations for the velocities and the true dynamics of quantum fluids, as modelled by the Gross–Pitaevskii equations, would be in how the gradient of the phase
 $\unicode[STIX]{x1D719}$
of the wave function
 $\unicode[STIX]{x1D713}$
is modified by the curvature of the vortex lines.
In that context, could curvature profiles provide clues for the origins of the anomalous scaling exponents of the orthogonal separations? For example, if the local induction approximation is relevant, then a sudden increase in the maximum curvature of the lines, such as in figure 7, might explain the change in scaling.
Is that increase large enough, or is more needed? Two primary features should be noted. First, the profiles of the curvature along the vortex lines in figure 7(a) are very symmetric in
 $s$
about the points of closest approach, both before and after reconnection. Second, while there by a sharp jump in
 $\unicode[STIX]{x1D705}_{max}$
at
 $t=t_{r}$
in the time-evolving curvature maxima
 $\unicode[STIX]{x1D705}_{max}$
in figure 7(b) (
 $\unicode[STIX]{x1D6FF}_{0}=3$
case), at all other times
 $\unicode[STIX]{x1D705}_{max}$
is modest. That is, for
 $t<t_{r}$
, there is only modest growth, which for
 $t>t_{r}$
relaxes rapidly to the pre-reconnection values of
 $\unicode[STIX]{x1D705}_{max}$
. All other cases have similar behaviour, including one slightly under-resolved
 $\unicode[STIX]{x1D6FF}_{0}=4$
case in a large
 $(32\unicode[STIX]{x03C0})^{3}$
domain.
Therefore, one must conclude that a bigger picture is needed. Our proposal is to look at the alignments of their respective Frenet–Serret frames as another reason for the changes in scaling. Using analysis from Rorai (Reference Rorai2012), the next section will look first at the alignments of the points of closest approach, then at alignments between points further along the vortices in § 4.6.
4.5 Orthogonal: Frenet–Serret orientation
Besides allowing us to calculate the curvature of the vortex lines, knowing their trajectories allows us to calculate the Frenet–Serret frame (3.9). For the
 $256^{3}$
,
 $\unicode[STIX]{x1D6FF}_{0}=3$
calculation, figures 9 and 10 show the evolution of the Frenet–Serret frames at the closest points
 $\boldsymbol{x}_{y,z}$
. These alignments provide quantitative support for describing the local frame at the reconnection point
 $\boldsymbol{x}_{r}$
in terms of the reconnection plane and the propagation plane sketched in figure 8(a). First
 $t<t_{r}$
evolution is given, then the post-reconnection
 $t>t_{r}$
flip.
-
(i) For
$t<t_{r}$
, pre-reconnection: figure 9(a) shows that the vorticity direction or tangent vectors
$\boldsymbol{T}_{y,z}$
, the curvature vectors
$\boldsymbol{N}_{y,z}$
and the bi-normals
$\boldsymbol{B}_{y,z}$
converge to their opposites as
$t\rightarrow t_{r}$
, both before and after reconnection. -
(ii) Figure 9(b) then uses following averages of the Frenet–Serret frames between
$\boldsymbol{x}_{y}$
and
$\boldsymbol{x}_{z}$
(4.3)
$$\begin{eqnarray}\displaystyle \left.\begin{array}{@{}lc@{}}\displaystyle \circ & \boldsymbol{N}_{av}=0.5(\boldsymbol{N}_{y}-\boldsymbol{N}_{z})\quad \text{and is parallel to }\boldsymbol{D}(t),\\ \displaystyle \circ & \boldsymbol{T}_{av}=0.5(\boldsymbol{T}_{y}-\boldsymbol{T}_{z})\quad \text{and is perpendicular to both }\boldsymbol{N}_{av}\text{ and }\boldsymbol{D},\\ \displaystyle \circ & \boldsymbol{B}_{av}=0.5(\boldsymbol{B}_{y}+\boldsymbol{B}_{z})\quad \text{and is perpendicular to }\boldsymbol{T}_{av},\boldsymbol{N}_{av}\text{ and }\boldsymbol{D}.\end{array}\right\} & & \displaystyle\end{eqnarray}$$
-
(1) That is: subtract the tangent and curvature vectors because they become anti-parallel as
$t{\nearrow}t_{r}$
and add the bi-normals because they are parallel as
$t{\nearrow}t_{r}$
. -
(2) Comparing these averages shows that
$\boldsymbol{T}_{y,z}$
,
$\boldsymbol{N}_{y,z}$
and their unit separation vector
$\boldsymbol{D}=(\boldsymbol{x}_{z}-\boldsymbol{x}_{y})/|\boldsymbol{x}_{z}-\boldsymbol{x}_{y}|$
all lie in the same plane, the reconnection plane in figure 8(a). -
(3) These alignments between
$\boldsymbol{T}_{av}$
,
$\boldsymbol{N}_{av}$
and
$\boldsymbol{B}_{av}$
with
$\boldsymbol{D}$
form in the early stages, long before the reconnection at
$t_{r}=8.9$
.
-
-
(iii) Post-reconnection Frenet–Serret frames flip:
-
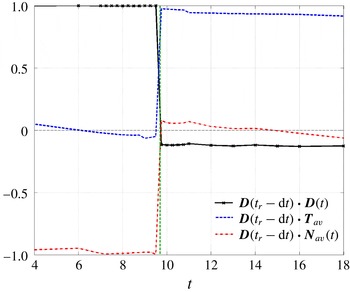
(1) Figure 10 shows that the directions of
$\boldsymbol{T}_{av}$
and
$\boldsymbol{N}_{av}$
swap and
$\boldsymbol{D}$
rotates by
$90^{\circ }$
so that all three are still in the reconnection plane with the same relations to one another. -
(2) Note that
$\boldsymbol{B}_{av}$
remains orthogonal to the reconnection plane.
-


These two frames show how the basis vectors of the Frenet–Serret frames (3.9) at the closest points
 $\boldsymbol{x}_{y,z}$
of the
 $\unicode[STIX]{x1D6FF}_{0}=3$
,
 $256^{3}$
calculation are aligned and help define the reconnection plane and the propagation plane used in figure 8(a,b). (a) The alignments between the Frenet–Serret components at
 $\boldsymbol{x}_{y,z}$
. For
 $t<t_{r}$
the tangent vectors
 $\boldsymbol{T}_{y,z}$
and curvature vectors
 $\boldsymbol{N}_{y,z}$
become increasingly anti-parallel as the reconnection time is approached while the bi-normal vectors
 $\boldsymbol{B}_{y,z}$
become increasingly aligned. These trends are reversed for
 $t>t_{r}$
. (b) The alignments between the averages over
 $\boldsymbol{x}_{y,z}$
of the Frenet–Serret frames defined by (4.3) with the separation vector
 $\boldsymbol{D}$
between
 $\boldsymbol{x}_{y}$
and
 $\boldsymbol{x}_{z}$
.

For the
 $\unicode[STIX]{x1D6FF}_{0}=3$
,
 $256^{3}$
calculation, the alignments over time of
 $\boldsymbol{D}(t_{r}^{-})=\boldsymbol{D}(t_{r}-\text{d}t)$
with
 $\boldsymbol{T}_{av}$
and
 $\boldsymbol{N}_{av}$
, the averages (4.3) over the tangent and curvature components of the Frenet–Serret frames at the closest points
 $\boldsymbol{x}_{y,z}$
.
 $\boldsymbol{B}_{av}\boldsymbol{\cdot }\boldsymbol{D}(t_{r}^{-})\approx 0$
for all times.
 $\boldsymbol{D}(t_{r}^{-})$
is the separation direction at
 $t=8.9$
, just before reconnection.

The alignments of the components of the Frenet–Serret frames at
 $\boldsymbol{x}_{y,z}$
and the separation of these points
 $\boldsymbol{D}$
are significantly different than their alignments for the anti-parallel case in § 5. Comparisons are discussed in § 6.
4.6 Angles at reconnection
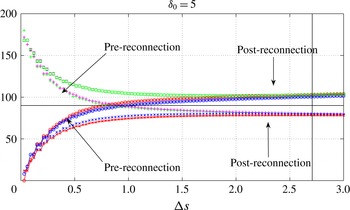
Angles between the segments in three-dimensional space displayed in figure 8(b) as a function of
 $\unicode[STIX]{x0394}s$
for
 $\unicode[STIX]{x1D6FF}_{0}=5$
and
 $t=40$
(pre-reconnection) and
 $t=41$
(post-reconnection). The angles between the arms of the same vortex, triplets [
 $\boldsymbol{x}_{1,v1},\boldsymbol{x}_{r},\boldsymbol{x}_{2,v1}$
] and [
 $\boldsymbol{x}_{1v2},\boldsymbol{x}_{r},\boldsymbol{x}_{2v2}$
], are indicated by circles (blue and red) before reconnection, and stars (blue and red) after reconnection. The angles sum to
 $360^{\circ }$
as
 $\unicode[STIX]{x0394}s\rightarrow 0$
, implying that the segments near the reconnection point
 $\boldsymbol{x}_{r}$
lie on a plane, specifically, the reconnection plane in figure 8(b) The sum of the angles grows with
 $\unicode[STIX]{x0394}s$
and is about
 ${\sim}362^{\circ }$
for
 $\unicode[STIX]{x0394}s\sim 2.7$
(vertical black line), which is consistent with the arms of reconnecting vortices becoming progressively more convex and hyperbolic as they move away from
 $\boldsymbol{x}_{r}$
, both before and after reconnection. The rapidly changing behaviour for small
 $\unicode[STIX]{x0394}s$
is a kinematic result of how the lines and angles indicated in figure 8(b) were chosen and is not significant. What could be more significant are the differences in the angles for intermediate
 $\unicode[STIX]{x0394}s$
and their influence upon any Biot–Savart contributions to the velocities.

What additional dynamics might help us identify the differences between the orthogonal and anti-parallel separation scaling laws?
One place to look is larger-scale alignments and long-range interactions. While the underlying Gross–Pitaevskii equations are local, the existence of the vortex structures means that such alignments should exist and should influence the local motion of the
 $\unicode[STIX]{x1D70C}=0$
lines to the degree that the law of Biot–Savart can be applied. With the goal of identifying any such long-range interactions, this section determines the evolution of pre- and post-reconnection angles between points on the extended structures.
Relevant angles can be defined between the arms of the reconnecting vortices around the reconnection point as follows.
-
(i) From the points of closest approach
$\boldsymbol{x}_{y,z}(t)$
, define
$\boldsymbol{x}_{r}(t)=0.5(\boldsymbol{x}_{y}(t)+\boldsymbol{x}_{z}(t))$
. -
(ii) Move
$\pm \unicode[STIX]{x0394}s$
along the arms of the vortices from
$\boldsymbol{x}_{y,z}(t)$
and identify four new points:
$\boldsymbol{x}_{1,y}$
,
$\boldsymbol{x}_{2,y}$
,
$\boldsymbol{x}_{1,z}$
and
$\boldsymbol{x}_{2,z}$
, illustrated in the Nazarenko perspective sketch in figure 2. -
(iii) To get a fully three-dimensional perspective, note that these points lie on outstretched arms such as in figure 2(b).
-
(iv) Connect the four points with
$\boldsymbol{x}_{r}$
to form an extended three-dimensional frame then calculate the angles
$\unicode[STIX]{x1D703}_{i}$
between these four vectors. -
(v) The plots of
$\unicode[STIX]{x1D703}_{i}(\unicode[STIX]{x0394}s)$
all show these qualitatively similar features:-
(1) The sum of the
$\unicode[STIX]{x1D703}_{i}$
grows as
$\unicode[STIX]{x0394}s$
increases, starting from
$\sum _{i}\unicode[STIX]{x1D703}_{i}(\unicode[STIX]{x0394}s=0)=360^{\circ }$
, showing that the inner (
$\unicode[STIX]{x0394}s\approx 0$
) structure is a plane. -
(2) The vertical line in figure 11 represents the
$\unicode[STIX]{x0394}s_{p}$
for which
$\sum _{i}\unicode[STIX]{x1D703}_{i}(\unicode[STIX]{x0394}s)=362^{\circ }>360^{\circ }$
, indicating that the structure is mildly hyperbolic, the opposite of the anti-parallel pyramid structure with acute angles. -
(3) The inner angles, that is the angles between the triplets [
$\boldsymbol{x}_{1,v1},\boldsymbol{x}_{r},\boldsymbol{x}_{2,v1}$
] and [
$\boldsymbol{x}_{1v2},\boldsymbol{x}_{r},\boldsymbol{x}_{2v2}$
], are all larger than
$90^{\circ }$
before reconnection, and smaller after.The difference is about
$20^{\circ }$
in all of the calculations and would be consistent with the observed slower approach and faster separation. -
(4) When looking down at the reconnection plane in either figure 8(b) or figure 3(b), do not forget that the centre of the reconnection plane is moving along the
$y=z$
direction of the propagation plane and simultaneously dragging or pushing the extended arms as it moves, as in figure 2(b).
-
-
(vi)
$\unicode[STIX]{x1D703}_{i}(\unicode[STIX]{x0394}s)$
depends upon
$\unicode[STIX]{x1D6FF}_{0}$
as follows:-
(1) As
$\unicode[STIX]{x1D6FF}_{0}$
decreases, the
$\unicode[STIX]{x1D703}=90^{\circ }$
pre-reconnection cross-over, at
$\unicode[STIX]{x1D6FF}s=0.8$
for
$\unicode[STIX]{x1D6FF}_{0}=5$
, decreases. -
(2) The geometry becomes more hyperbolic. That is
$\sum _{i}\unicode[STIX]{x1D703}_{i}(\unicode[STIX]{x0394}s)$
increases as
$\unicode[STIX]{x1D6FF}_{0}$
decreases with
$\sum _{i}\unicode[STIX]{x1D703}_{i}(\unicode[STIX]{x0394}s)=370^{\circ }$
for
$\unicode[STIX]{x1D6FF}_{0}=3$
.
-









Understanding these features could provide us with some hints about the origins of the anomalous scaling laws. One hint could be the different angles at intermediate scales,
 $0.5\leqslant \unicode[STIX]{x0394}s\leqslant 2.5$
. Pre-reconnection, this span has approximately retained its original
 $\unicode[STIX]{x1D703}\sim 90^{\circ }$
orthogonal alignment. Post-reconnection the angles over this span still sum to approximately
 $362^{\circ }$
, but the angles on either side of the reconnection have jumped by
 $\pm 20^{\circ }$
. The sudden jump is due to how the directions of the tangent and curvature vectors swap at reconnection. Using the sketch in figure 8(b), this means that prior to reconnection the angle in three-dimensional space is between the triplets [
 $\boldsymbol{x}_{1,v1},\boldsymbol{x}_{r},\boldsymbol{x}_{2,v1}$
] and [
 $\boldsymbol{x}_{1v2},\boldsymbol{x}_{r},\boldsymbol{x}_{2v2}$
] and afterwards between the triplets [
 $\boldsymbol{x}_{1v1},\boldsymbol{x}_{r},\boldsymbol{x}_{1v2}$
] and [
 $\boldsymbol{x}_{2v1},\boldsymbol{x}_{r},\boldsymbol{x}_{2v2}$
]. Similar behaviour is seen for all the
 $\unicode[STIX]{x1D6FF}_{0}$
cases. It is visualised for
 $\unicode[STIX]{x1D6FF}_{0}=3$
, using two perspectives in figures 2 and 3.
The goal is find a model that links the sudden swaps in local alignments in figures 9 and 10 with the non-local changes in figure 11 and from that explains the anomalous orthogonal reconnection scaling. This model must also accommodate the scaling of anti-parallel reconnection, which obeys the expected dimensional scaling both before and after reconnection. The discussion in § 6 addresses what might be required.
5 Anti-parallel results: approach, separation, curvature
In contrast to the orthogonal vortices, whose scaling laws do not obey expectations, it will now be shown that the scaling of initially anti-parallel vortices obeys those expectations almost completely.
Figure 1 illustrated the overall structure of our anti-parallel case before reconnection at
 $t=0.125$
and after reconnection at
 $t=4$
, where
 $t_{r}\approx 2.44$
. The very low-density
 $\unicode[STIX]{x1D70C}=0.05$
isosurface is the primary diagnostic for the vortex lines and as in Kerr (Reference Kerr2011), the post-reconnection density isosurfaces are developing a second set of reconnections near
 $y=\pm 5$
from which the first set of vortex rings will form. Eventually two stacks of vortex rings on either side of
 $y=0$
should form from the additional waves along the original vortex lines. Large values of the gradient kinetic energy (2.4) and the magnitude of the pseudo-vorticity (3.1) are shown using two additional isosurfaces and the trajectories of the
 $\unicode[STIX]{x1D70C}\approx 0$
pseudo-vorticity are traced with thick lines.
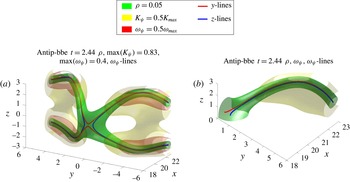
Figure 12 provides two perspectives of the structure approximately at the reconnection time using the same isosurfaces and vortex lines as in figure 1, except there are now two sets of vortex lines. Figure 1(a) shows two red curves seeded using
 $\unicode[STIX]{x1D70C}\approx 0$
points on the
 $y=0$
,
 $x{-}z$
perturbation plane and two blue curves seeded using
 $\unicode[STIX]{x1D70C}\approx 0$
points on the
 $z=0$
,
 $x{-}y$
dividing plane, representing respectively the pre- and post-reconnection trajectories.
As with the
 $\unicode[STIX]{x1D6FF}_{0}=3$
orthogonal case in figure 6(b), the reconnection time isosurfaces have an extended zone of very low density around the reconnection point and a strong isosurface of the gradient kinetic energy outside this zone. Large values of
 $|\unicode[STIX]{x1D714}_{\unicode[STIX]{x1D70C}}|$
are also outside the reconnection zone.
Density, kinetic energy
 $K_{\unicode[STIX]{x1D713}}=0.5|\unicode[STIX]{x1D735}\unicode[STIX]{x1D713}|^{2}$
(2.4) and pseudo-vorticity
 $|\unicode[STIX]{x1D735}\unicode[STIX]{x1D713}_{r}\times \unicode[STIX]{x1D735}\unicode[STIX]{x1D713}_{i}|$
isosurfaces plus vortex lines shortly after the time of the first reconnection,
 $t=2.4375\gtrsim t_{r}=2.344$
from two perspectives with
 $\max (K_{\unicode[STIX]{x1D713}})=0.83$
.
 $\max \!|\unicode[STIX]{x1D714}_{\unicode[STIX]{x1D70C}}|=0.4$
for all the times. (a) Four vortex lines, with each pair starting at the points of nearly zero density on the
 $y=0$
and
 $z=0$
symmetry planes respectively; (b) gives a second perspective that looks into a quadrant through the two symmetry planes and is designed to demonstrate that locally, around
 $y=z=0$
, the shape of the
 $\unicode[STIX]{x1D70C}=0.05$
isosurface is symmetric on the two symmetry planes.

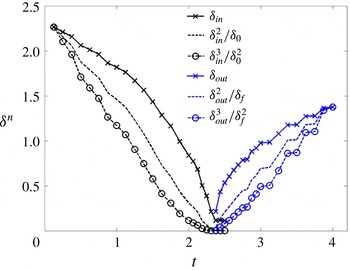
Figure 13 presents several possible fits for the pre- and post-reconnection separation scaling laws, with both the pre-reconnection incoming and post-reconnection outgoing separations following the predicted dimensional scaling of
 $\unicode[STIX]{x1D6FF}\sim |t_{r}-t|^{1/2}$
(1.1), unlike the orthogonal cases just shown. Furthermore, for
 $\unicode[STIX]{x0394}t=|t-t_{r}|<0.5$
,
 $\unicode[STIX]{x1D6FF}_{in}(t_{r}-t)$
and
 $\unicode[STIX]{x1D6FF}_{out}(t_{r}-t)$
are almost mirror images of each other, although that is not the case for larger
 $\unicode[STIX]{x0394}t$
.
This suggests that unlike the orthogonal case, where we have attempted to relate the asymmetric scaling laws to asymmetries in the underlying structure, for the anti-parallel case we want to identify physical symmetries that would predispose the scaling laws to be temporally symmetric and follow the dimensional prediction.
The purpose of giving two perspectives near the reconnection time in figure 12 is to clarify the physical symmetries at this time. The overall structure in figure 12(a) shows how all four legs of vorticity converge on the
 $y=z=0$
line where the
 $x{-}z$
or
 $x{-}y$
symmetry planes cross, giving the butterfly trajectories around the
 $y=z=0$
line. These are outer surfaces, figure 12(b) looks at the interior of the structure by slicing it at the symmetry planes, allowing one to see where the
 $\unicode[STIX]{x1D70C}\approx 0$
vortex lines cross within the isosurface during reconnection.
Separations near the time of the first reconnection of the anti-parallel vortices. The positions are found using the isosurface method on the symmetry planes. Both pre- and post-reconnection curves (in and out) follow
 $\unicode[STIX]{x1D6FF}_{0}\sim (t_{r}-t)^{1/2}$
most closely.

This butterfly can also be described as a blunted pyramid by extending the 2 red and 2 blue curved legs to the reconnection plane, that is the flattened isosurface where the red and blue vortices meet. Two types of angles for this structure have been determined. One set of angles is determined by linearly extending the red and blue legs to a point at
 $x\approx 18$
on the
 $y=z=0$
line where the symmetry planes meet. At the reconnection time, the four angles between these legs are all approximately
 $45^{\circ }$
. This definition of the angles is similar to how de Waele & Aarts (Reference de Waele and Aarts1994) described the pyramid generated by their Biot–Savart calculation of anti-parallel quantum vortices.
One can also determine the angles at the blunt tip by considering the normal vectors
 $\boldsymbol{N}$
at the points where each vortex crosses the symmetry planes. At these positions the components of
 $\boldsymbol{N}_{y}$
on the
 $y$
-lines are
 $(n_{x},0,n_{z})$
and the components of
 $\boldsymbol{N}_{z}$
on the
 $z$
-lines are
 $(n_{x},n_{y},0)$
, which define two angles,
 $\unicode[STIX]{x1D703}_{y}=\tan ^{-1}(n_{z}/n_{x})$
and
 $\unicode[STIX]{x1D703}_{z}=\tan ^{-1}(n_{y}/n_{x})$
. These angles are the inclinations of the normal vectors with respect to the
 $x$
-line through
 $y=z=0$
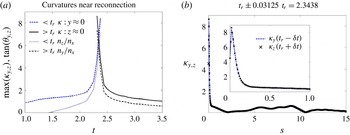
. The time dependence of the tangents, and the curvatures determined by (3.10), are given in figure 14(a). At times significantly before and after the reconnection, the tangents are approximately 1, corresponding to the
 $45^{\circ }$
alignments of the legs of the pyramid far from the blunt tip at reconnection.
(a) Maximum curvatures,
 $\unicode[STIX]{x1D705}_{y0}$
,
 $\unicode[STIX]{x1D705}_{z0}$
, versus time.
 $\unicode[STIX]{x1D705}_{y0}$
and
 $\unicode[STIX]{x1D705}_{z0}$
are always on symmetry planes. The approach before reconnection and separation after reconnection are similar. Reconnection time is where the curves cross,
 $t_{r}\approx 2.344$
. (b) Curvatures as a function of arclength along the vortices near the reconnection time, with the profile from the new
 $z$
vortex taken a bit before
 $t_{r}$
and the profile of the old
 $y$
vortex a bit after
 $t_{r}$
. The curavatures near
 $y=z=0$
are similar, which drives similar approach and separation velocities.

However, as the reconnection time is approached (
 $t<t_{r}$
), then left behind (
 $t>t_{r}$
), the tangents and curvatures on both the original vortex lines (red) and new lines (blue) are approximately 6. That is,
 $$\begin{eqnarray}\displaystyle \left.\begin{array}{@{}l@{}}\text{for }t>t_{r}\text{ both }\unicode[STIX]{x1D705}_{y}\text{ and }n_{z}/n_{x}{\nearrow}6\text{ as }t{\nearrow}t_{r}\quad \text{and}\\ \text{for }t_{r}>t\text{ both }\unicode[STIX]{x1D705}_{z}\text{ and }n_{y}/n_{x}{\searrow}6\text{ as }t{\searrow}t_{r}.\end{array}\right\} & & \displaystyle\end{eqnarray}$$
 $\tan \unicode[STIX]{x1D703}_{y,z}=6$
corresponds to
 $80^{\circ }$
, that is nearly perpendicular to the
 $x$
-line through
 $y=z=0$
, where the symmetry planes meet, and not the
 $45^{\circ }$
angles of a pyramid. This also implies that as reconnection is approached, the directions of the curvatures
 $\boldsymbol{N}_{y,z}$
are nearly parallel to the separation vectors
 $\boldsymbol{D}$
between the red, and blue, vortices. Very reminiscent of what has been found for the orthogonal vortices as
 $t{\nearrow}t_{r}$
and
 $t{\searrow}t_{r}$
in figures 9 and 10. It also means that the directions of the
 $\boldsymbol{N}_{y,z}$
and the tangents
 $\boldsymbol{T}_{y,z}$
nearly swap during reconnection, as in the orthogonal cases and not what a true pyramid with a sharp tip would do.
Figure 14(a) also shows that these swaps are temporally symmetric away from
 $t_{r}$
. That is for just before and after
 $t_{r}$
when respectively
 $\unicode[STIX]{x1D705}(t_{r}-t)\approx \unicode[STIX]{x1D705}(t-t_{r})$
and
 $n_{z}(t_{r}-t)/n_{x}(t_{r}-t)\approx n_{y}(t-t_{r})/n_{x}(t-t_{r})$
. Figure 14(b) emphasises this further by showing, simultaneously, the dependence of
 $\unicode[STIX]{x1D705}_{y}$
and
 $\unicode[STIX]{x1D705}_{z}$
on their arclengths
 $s$
at times just before and after the estimated reconnection time of
 $t_{r}=2.34$
.
The temporal symmetry is also expressed in the three-dimensional structures. On longer time scales this is represented for
 $t<t_{r}$
by how the red
 $+$
blue vortex lines in figure 1(a) become the pinched red vortex lines in figure 12(a) at
 $t=t_{r}$
. For
 $t>t_{r}$
this process is reversed as the pinch in the new blue
 $z$
-vortex lines at
 $t=t_{r}$
in figure 12(a) expand to become the blue lines in figure 1(b).
The local spatial symmetry at the time for reconnection is demonstrated in figure 12(b), which shows a cut within the density isosurface where the trajectories of the before and after vortex lines are indistinguishable. Having these temporal and spatial symmetries might be the crucial difference between the different
 $\unicode[STIX]{x1D6FF}(t)$
scaling for the orthogonal versus anti-parallel cases.
The scaling of
 $\unicode[STIX]{x1D6FF}(t)$
in figure 13 is consistent with the scaling of the side-by-side reconnecting rings in Tebbs et al. (Reference Tebbs, Youd and Barenghi2011), who found the dimensional
 $1/2$
scaling and a pyramid structure at the reconnection time. The relationship to the anti-parallel case of Zuccher et al. (Reference Zuccher, Caliari, Baggaley and Barenghi2012) is discussed in § 6.
6 Contrasting geometries near reconnection
How do the alignments of the vortices in the orthogonal and anti-parallel cases compare? First the similarities will be summarised, especially those within the reconnection zone. Next, the differences between the long-range alignments and whether there is a role for rarefaction waves. Finally, any remaining questions.
Similarities. Prior to the vortices entering the reconnection zone, for both initial configurations, the vortices at their closest points are anti-parallel in a direction perpendicular to their separation. For the anti-parallel case this is by construction, while the orthogonal vortices immediately pivot into this configuration, despite their global skew-symmetric alignment.
Furthermore, within the reconnection zone defined by when
 $t\approx t_{r}$
and
 $\boldsymbol{x}\approx \boldsymbol{x}_{r}$
, the curvature vectors in both initial configurations tend to anti-align with the separation between the vortices. This creates the geometry of the reconnection plane where the tangents and normal vectors of the opposing vortices are anti-parallel. Taken together this also implies that the local bi-normals for each line are nearly parallel and do not point in the direction of separation, but in the direction of the phase velocity.
The formation of the flattened reconnection plane shows that very near the reconnection, a pyramid does not form in the anti-parallel case; instead, the configuration of the vortex cores is very similar to the planar fixed point solution in Meichle et al. (Reference Meichle, Rorai, Fisher and Lathrop2012). Post-reconnection, in both cases the curvature and tangent directions swap, or nearly so in the anti-parallel case.
Long-range alignments. The global alignments of the anti-parallel case are dominated by the imposed symmetries, resulting in both the large-scale pyramid alignment with its acute angles and the short-range flattening onto the reconnection plane.
Characterising the long-range orthogonal alignments has been more challenging. The reconnection plane perspective in figure 3 has been the most useful because, by looking along a
 $45^{\circ }$
angle in the
 $y{-}z$
plane, the vortices are always distinct, without any loops. This perspective then led to the analysis of the angles defined in the sketch of the NP projection in figure 8(b). Figure 11 uses these angles to identify two differences with the anti-parallel case. First, the sum of the angles before and after reconnection is greater than
 $360^{\circ }$
. That is, the geometry is hyperbolic, not acute as in the anti-parallel pyramid. Second, a change in the profile of long-range alignment after reconnection has been identified, see figure 11. This second observation confirms that the change in the scaling laws is connected to how the vortices are aligned, although it is not enough to provide a dynamical explanation for the change in scaling.
Any role for rarefaction waves? While the deviations from the dimensional scaling prediction (1.1) in Zuccher et al. (Reference Zuccher, Caliari, Baggaley and Barenghi2012) are qualitatively similar to what we have presented, they suggest that are due to local influence of rarefaction waves upon the locations of the points of closest approach.
In contrast, our calculations show little evidence of rarefaction waves influencing the reconnection zone, as in the anti-parallel reconnection close-ups in figure 12. This implies that there must be another source of the differences in the separation scaling laws. The differences between the large-scale orthogonal alignments and angles in figure 11 and the symmetric anti-parallel angles in figure 14(a) could be that source. It is also worth noting that the scaling and geometry for our anti-parallel case is consistent with the ring simulations in Tebbs et al. (Reference Tebbs, Youd and Barenghi2011), the only recent Gross–Pitaevskii reconnection simulation with a symmetric initial condition.
Why do our calculations suppress these waves? The sub-Berloff core profile has this capability due to its background density being less than one, which could absorb the waves or suppress the growth of perturbations and waves. How the boundaries can reflect waves must also be considered. Only by removing these reflections do anti-parallel, or nearly anti-parallel, vortices reconnect into the chains of vortices that have been found by Kerr (Reference Kerr2013) (Navier–Stokes) and Kerr (Reference Kerr2011), Kursa et al. (Reference Kursa, Bajer and Lipniacki2011) (Gross–Pitaevskii). Further references in Kerr (Reference Kerr2013) discuss what happens to reconnecting Navier–Stokes vortices if the boundaries are too close, as in Hussain & Duraisamy (Reference Hussain and Duraisamy2011).
Remaining questions: These results leave us with several major questions.
-
(i) First, could the scaling laws shown here be extended to the huge range of length scales in experiments? This seems possible given that these scaling laws are tied to unique alignments that form early and continue through the reconnection period.
-
(ii) What if the initial state is not strictly orthogonal? Based upon several additional configurations considered in Kursa et al. (Reference Kursa, Bajer and Lipniacki2011), Rorai (Reference Rorai2012) and Zuccher et al. (Reference Zuccher, Caliari, Baggaley and Barenghi2012), it seems that all quantum reconnection events lie between the two extremes presented here. Kursa et al. (Reference Kursa, Bajer and Lipniacki2011) suggests that there is a cross-over between the two behaviours when the angle
$\unicode[STIX]{x1D6FE}$
between the vortices is approximately
$10^{\circ }$
. Calculations with more general initial conditions are needed to determine when and for how long each type of scaling dominates. -
(iii) Can these cases be compared with the experiments using solid hydrogen markers? Improvements in tracing the experimental vortices are needed and being developed because there were too few robust events (that is more than 6 markers) in the sample used in the best current statistical analysis of these events (Paoletti et al. Reference Paoletti, Fisher, Sreenivasan and Lathrop2008).
-
(iv) Finally, how can the alignments quantified here for the orthogonal cases be used to explain the anomalous reconnection scaling laws? These long-range alignments might suggest that there might be a role for full Biot–Savart analysis, except that all Biot–Savart calculations only find the dimensional scaling laws. Another route would be to run very finely resolved calculations where the motion of zero-density vortex cores could be determined directly.


7 Summary
The reconnection scalings of two configurations of paired vortices, orthogonal and anti-parallel, have been found to have different scaling exponents that appear at all times.
For the anti-parallel case, the temporal scaling of both the pre- and post-reconnection separations in figure 13 obey the dimensional prediction,
 $\unicode[STIX]{x1D6FF}_{\pm }(t)\sim A\sqrt{\unicode[STIX]{x1D6E4}|t_{r}-t|}$
and the arms of the vortex pairs as the reconnection time is approached form an equilateral pyramid with a smooth tip in figure 12, which is in most respects qualitatively similar to the prediction of a Biot–Savart model (de Waele & Aarts Reference de Waele and Aarts1994). Around the smooth tip the curvatures
 $\boldsymbol{N}$
and separation
 $\boldsymbol{D}$
are nearly parallel and as a result the directions of curvature
 $\boldsymbol{N}$
and the tangents
 $\boldsymbol{T}$
almost swap during reconnection.
The orthogonal cases, in contrast, show asymmetric temporal scaling with respect to the reconnection time
 $t_{r}$
figure 5. For
 $t<t_{r}$
,
 $\unicode[STIX]{x1D6FF}_{-}(t)\sim A_{-}(\unicode[STIX]{x1D6E4}|t_{r}-t|)^{1/3}$
and for
 $t>t_{r}$
,
 $\unicode[STIX]{x1D6FF}_{+}(t)\sim A_{+}(\unicode[STIX]{x1D6E4}|t_{r}-t|)^{2/3}$
, where the coefficients
 $A_{\pm }$
are independent of the initial separation
 $\unicode[STIX]{x1D6FF}_{0}$
. At
 $t\approx t_{r}$
in figure 6(b), the reconnecting vortices are anti-parallel, with the vortices interacting in a reconnection plane that contains the tangent and curvature vectors of both vortices as well as their separation vector. All five lie in the reconnection plane. This results in the directions of curvature and vorticity swapping during reconnection.
Two innovations. There are two innovations that allow these calculations to generate clean scaling laws. One is an initial core profile that either minimises the formation of secondary waves by the interacting vortices, or absorbs these waves. The second innovation is a way to trace the vortex lines that minimises the need to identify computational cells with small values of the density.
With these innovations, it is shown that the robust, anomalous scaling laws for the initially orthogonal vortices are independent of their initial separations and that these scaling laws are associated with a unique alignment of the Frenet–Serret frames. This alignment forms early and then continues through the reconnection period to the end of each calculation. These features suggest that the anomalous scaling laws for initially orthogonal vortices could extend to vortices on the macroscopic scales of a quantum fluid and be observed.
Acknowledgements
C.R. acknowledges support from the National Science Foundation, NSF-DMR Grant No. 0906109 and support of the Universitá di Trieste. R.M.K. acknowledges support from the EU COST Action program MP0806 Particles in Turbulence. Discussions with C. Barenghi and M. E. Fisher have been appreciated. Support with graphics from R. Henshaw is appreciated.