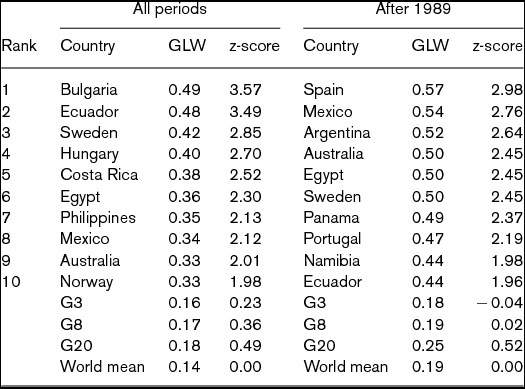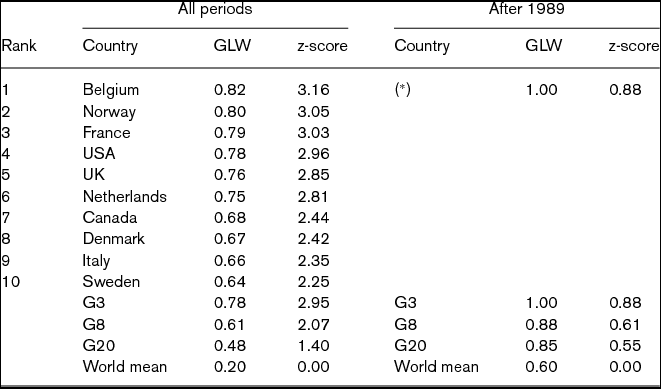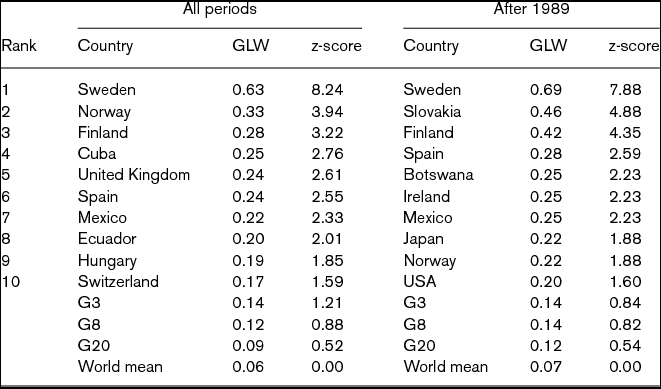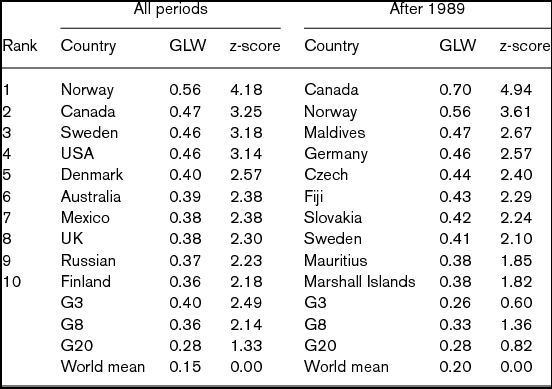


1. Introduction
Cooperation without hegemony literature review
History has witnessed changes in world leaders throughout time. By maximizing the use of their resources, strong states often dominate the world. The expanding global reach of the Spanish Empire's power, influence, and wealth in the early modern period is one of the most typical examples. During the long process of the re-conquest of the Iberian Peninsula, Spaniards wanted to build a kingdom of Christians by persecuting Muslims and Jews, who in turn exited the peninsula (Landes, Reference Landes1999). During the period of Muslim domination of the Iberian Peninsula, Muslims were vigorous and thriving in trade, while Jews were astute and agile in finance across borders. Native inhabitants, who would later be called the Spaniards, were ignorant of trade and finance, and were mainly involved in agriculture. Thus, even when the Christians dominated the Iberian Peninsula, they did not build on past practices of trade or finance. Instead, they pursued distant navigation and extraction of products such as gold and the cultivation of pepper in far-away lands. Thus, the king hired Christopher Columbus, an Italian adventurer, to discover a new world. By conquering what is now called Latin America, Spanish explorers brought astronomical wealth to the kingdom, enabling Spain to claim the status of world hegemon or global leader in the fifteenth to sixteenth century. Even though Christians in Spain did not excel in manufacturing lamps and machines or in carrying out international commerce as did the Muslims, and did not excel in cross-border financing to kings and aristocrats and to city merchants such as the Jews, they did navigate, conquest, and ultimately accumulate wealth from a distant new world. Christians opened up a new world, thus linking the old world with a new world for the first time in history. They exercised global leadership through distant navigation and predatory conquest. The Spanish advantage in distant navigation and predatory conquest gave Spain power to dominate the world. The combination of distant navigation, predatory conquest, and wealth accumulation at home could be called an international regime of a sort. Not being able to produce much value from agriculture at a low technological level, Spanish kings wanted to demonstrate their power through a ‘Christian valorous spirit’. Thus, global leadership and international regime were linked to each other.
Shifting to the United States, one can see another combination of global leadership and international regime. Persecuted for their religion, deprived of a living, and for other reasons, people (who came to be known Americans) migrated to the northeastern fringes of North America in the seventeenth century from Britain and later from other parts of Europe (Cumings, Reference Cumings2009). Challenges came from indigenous groups who occupied the land and had their own system of living. From the very beginning, Americans stood at the frontier. The frontier was not abroad, but within, as Americans increased in number and assumed ownership of the land as opportunities arose. It was called the manifest destiny of Americans, that is to go west and build cities, start venture commerce, construct industry, and to arm themselves.
As the United States developed demographically, industrially, militarily at home, it inevitably joined international regimes covering aspects such as navigation, free trade, open markets, and the rule of law. But it remained isolated when it came to demonstrating initiative in international regimes. It was only faintly in the 1920s and more vigorously in the 1940s that the United States took steps towards global leadership. Similar to the growth in Spanish power, that took advantage of the greatly improved navigational capabilities, US power started to grow when the Europeans destroyed each other on an unprecedented scale in the first half of the twentieth century. A quick review at the development of global leadership over the last six centuries (Gilpin, Reference Gilpin1983; Modelski and Thompson, Reference Modelski1988; Landes, Reference Landes1999; Thompson et al., Reference Thompson, Colerasi and Rasler2007) reveals that the most striking feature of US global leadership is that in addition to possessing overwhelming military might, the United States has been on the whole successful in taking the initiative for inculcating global norms and establishing global institutions in a wide-range of policy areas, such as free trade, international finance, free navigation, intellectual property rights, economic cooperation, climate change, health, education, and food . The experience of the United States reinforces the analysis that the basis of the increasingly extending US power and influence throughout the world is the junction between global leadership and the international regime.
Indeed, global leadership and international regimes are paired relatively close to each other. Stephen D. Krasner defines international regimes as ‘implicit or explicit principles, norms, rules, and decision-making procedures around which actors’ expectations converge in a given area of international relations’ (Krasner, Reference Krasner1982: 186). The state, as an institutional form, is centrally important in the formation of international regimes. From a theoretical standpoint, regimes can be viewed as intermediate factors, or an ‘intervening variable’, between the fundamental characteristics of world politics, such as the international distribution of power on the one hand and the behavior of states on the other (Keohane, Reference Keohane1984). State power matters a great deal in determining who gets to make the rules, how compliance is pursued once the rules are in place, and how international institutions operate (Sell, Reference Sell, Held and McGrew2002). An ever-more interconnected world demands more cooperation among states for trade, peace, security, and a host of other issues. Global leadership, a leading role of the state to create a multilateral consensus for a shared global challenge, becomes visible in various stages of cooperation processes between countries. Some state actors play a more important role than others do in the course of cooperation and negotiation processes and have, therefore, more influence on the results. Their opinions must be taken into account by other nations before taking diplomatic action. The reason can be the greater military or economic potential of these actors, as well as their legitimacy and diplomatic effectiveness (Flemes, Reference Flemes2007). When multilateral consensus in a given area of international relations takes the form of multilateral treaties, the leading role of a state can be more tangible and better recorded. The leading actors propose an agenda and draw a political script for the creation, observation, and enforcement of international treaties. It should be noted that the global leadership is required in various aspects of the global community. Thus, global leaders should play a key role in promoting the development of international regimes, not least in the fields of human rights, global environment, but also in peace, arms control, intellectual property, and commerce and communication.
Different stages of history have experienced global leadership exercised by many different countries. For instance, there is the leadership of France, the Holy Roman Empire, Sweden, England, and the Netherlands in the process of forming the post-Westphalia system of states in Europe, and the leadership of the United Kingdom, France, and the United States in the process of forming the Versailles Treaty as a post-World War I regime. After World War II, the so-called P5, the United States, the Union of Soviet Socialist Republics (USSR), the United Kingdom, France, and China, played a critical role at several critical political points in history by exerting their veto power as permanent members of the Security Council of the United Nations. In 1975, facing the awakening of oil powers, six economic powers, the United States, Japan, West Germany, France, the United Kingdom, and Italy met at Rambouillet, France, and formed a new leaders group, the G6. The addition of Canada made it the G7, and later Russia joined to make it the G8. In 1998, all the G8 countries, plus the BRICs (Brazil, Russia, India, and China) and eight representatives of emerging countries, Argentina, Australia, Indonesia, Mexico, Republic of Korea, Saudi Arabia, South Africa, and Turkey agreed to act jointly for the sake of solving various global issues. The G20 was formed.
However, for Ian Bremmer, an American political scientist, ‘for the first time in seven decades, we live in a world without global leadership’ (Bremmer, Reference Bremmer2012: 3), and ‘we have entered the G-Zero’ (Bremmer, Reference Bremmer2012: 4). In his book, ‘Every Nation for Itself: Winners and Losers in a G-Zero World’, he coins the term G-Zero and explains it as ‘a world order in which no single country or durable alliance of countries can meet the challenges of global leadership’ (Bremmer, Reference Bremmer2012: 1). The world's most influential nations lose their willingness to lead in solving global issues and in taking on new international responsibilities. Both the established powers that formed the G7/8 and the rising states that comprise the G20 are too busy watching out for their own needs – they are too preoccupied playing their own game. It is because of ‘every nation for itself’ that no single country or bloc of countries has the political and economic leverage – or the will – to drive a truly international agenda and to accept new risks and burdens abroad (Bremmer and Roubini, Reference Bremmer2011). Therefore, this is not a G6, G7, G8, or a G20 world. This is the era of a G-Zero – a leaderless world.
Bremmer is indeed not the only author who is telling us about the existence of international cooperation in the current world in the absence of hegemony. Before Bremmer, other striking discussion can be found in the cooperation-without-hegemony literature. One of the most prominent discussions is from Keohane's After Hegemony. In his book, Keohane describes the conditions by which states build international regimes in order to promote mutually beneficial cooperation. Keohane analyses international regimes and institutions in three different issue areas of the world political economy, including finance, trade, and oil, and describes the evolution of these regimes. He reminds us of when, nearly two decades after World War II, hegemonic power and international regimes, established under conditions of hegemony, combined to facilitate cooperation. Hegemony plays an important role, even a crucial one, in accounting for the creation of international regimes (Keohane, Reference Keohane1984). Contemporary international economic regimes that were constructed under the aegis of the United States after World War II, such as the IMF and the GATT, are among the typical examples of cooperation facilitated by the dominance of a single power. Therefore, there are strong theoretical reasons for believing that hegemonic cooperation relies on a dominant power making rules and providing incentives for others to conform to those rules (Keohane, Reference Keohane1984). However, is it the only possible form of international cooperation? Can cooperation persist without the dominance of a single power? Keohane did answer these pressing questions, stating that cooperation does not necessarily require the existence of an hegemonic leader after international regimes have been established. Post-hegemonic cooperation is also possible. In other words, cooperation can emerge and a regime can be created without hegemonic leadership.
Continuing with the same argument, another discussion taking the sociological approach to regimes comes from Puchala and Hopkins, in the rational design issue of the International Organization journal. They state that a regime exists in every substantive issue-area in international relations where there is discernibly patterned behavior. Such patterned behavior may reflect the dominance of a powerful actor or oligarchy rather than voluntary consensus among all participants (Puchala and Hopkins, Reference Puchala and Hopkins1982). They also mentioned that the decline of US hegemony and the attendant reduction in resources available for enforcing norms buttressed by American power created challenges to existing regimes. In their opinion, disagreements have arisen over appropriate norms in the areas of trade, oil, food, and even nuclear security. Later, Braithwaite and Drahos's book, Global Business Regulation, expands the institutional literature on how to sustain cooperation by providing an innovative and systematic interpretation of the present multilateral system across a vast critical area of business regulation, from property and contract, financial regulation, corporations and securities, to trade, labor standards, environment, nuclear energy, telecommunications, drugs, food, and transport (Braithwaite and Drahos, 2000).
Recently, several new books broaden the empirical existence of such vast cooperation in the absence of hegemony. The order of the world without leadership is also described by Hale et al. Ranging over the main areas of global concern, from security to the global economy and the environment in the postwar era, their book, Gridlock: Why Global Cooperation is Failing when We Need It Most examines a situation called ‘gridlock’, where tools for global policymaking, principally state-to-state negotiations over treaties and international institutions, have either failed to make breakthroughs or have had only limited success (Hale et al., Reference Hale, Held and Young2013). They explain that the strident voices of former leaders and the rise of new powers representing a more diverse array of interests make intergovernmental agreement more difficult. The lack of effective global governance in these particular issue areas in the world increasingly widens the gap between our need for global solutions and flagging ability of multilateral institutions to meet that need squarely (Hale et al., Reference Hale, Held and Young2013).
Other typical materials contributing to the cooperation without hegemony literature include Gideon Rachman's Zero-Sum Future: American Power in an Age of Anxiety and Charles A. Kupchan's No One's World: The West, the Rising Rest, and the Coming Global Turn. For Rachman, he describes the international system where the win-win logic that allowed major powers to embrace globalization is now being replaced by a zero-sum logic, in which one country's gain looks like another's loss (Rachman, Reference Rachman2011). Simply put, the logic of international relations has been changed. Every country is exceptional in its own way and no country can exercise global leadership. Without a dominant power, it is much more difficult for multi-polar, multinational forums to reach a final consensus or they may even fail. As the result, there is an increasing risk of a deadlock in international forums on a set of global climate and macro-economic issues. Charles Kupchan's latest book adds to these arguments by explaining the implications of the ‘no one's world’ situation where no great power dominates. Kupchan sees a coming ‘global turn’ to a new international system with a structure quite different to the era dominated by a benign American unipolar hegemon. Globalization has speeded up the rise of other emerging powers rise such as China, India, and Brazil. However, these new powers will not replace the previous dominance of Western order. The twenty-first century will not belong to America, China, Asia, or anyone else. It will be no one's world. For the first time in history, an interdependent world will be without a center of gravity or global guardian (Kupchan, 2012).
Empirical testing of cooperation without hegemony from the international regime perspective
How can we verify the above-mentioned authors’ claim about the shift towards cooperation without hegemony paradigm on an empirical basis? To describe hegemonic leadership of a country in an international context, there are several approaches. The traditional approach of political scientists can be called a descriptive approach. It is to give a detailed account of leadership behavior that affects the behaviors of other members. The most complete picture of leadership can be attained through maximum effort to collect material and interpret it. This approach, however, requires a full book to provide a sufficient level of description. But how can we compare the leadership of a particular country at a different stage of history and in different policy domains?
Another approach can be labeled a schematic approach. It must use a uniform framework in order to understand the behavior of a country. It is even better if a quantitative metric can be provided to evaluate the leadership and then applied to different political domains. And, of course, well-collected statistics are needed for further analysis.
The study uses the second approach to construct a quantitative link between international regimes and global leadership. In this attempt, we seek to develop a system that can observe global leadership change over time and that is more systematic than the one that currently exists. Our task in this study is focused on the empirical testing of international regimes as registered by the United Nations (UN). As world politics has been transformed from the era dominated by a single hegemon to the new way of global governance that is represented by diverse stakeholders, this transformation has come to alter the ability of states to cooperate multilaterally. The expected rules of cooperation and state's compliance with these rules are increasingly being materialized in the form of multilateral treaties. The decision to ratify any UN treaty represents interests in a certain international policy area, and then reflects the willingness on the part of the ratifying country to comply with international law and thus to cooperate with other partners. Regime theorists explain that when treaties are ratified, states signal their intentions through being a signatory and prioritizing the issue. The more initiative a nation takes in international treaties, the more it shows to the international community its intention to be a leader. In other words, the timely decision to ratify a treaty demonstrates the leading role of a state as a first mover in response to a shared global issue. Therefore, a quantitative metric measuring the initiative of action in global norms to evaluate the leadership willingness of a nation has been created. By comparing the results of these metrics for key global players through different stages of world history and in different policy domains, we can identify the divergence in powers that are bound to shape twenty-first century world politics. By tracing changes in the leadership role among established powers and rising powers, observations can be made on how well international regimes across various policy areas have been functioning through major milestones in world history.
In this sense, our paper does not discuss subjects such as the decline of the United States or the rise of China and other emerging powers. It is far beyond the scope of this paper. That task remains for future works. Our discussion is limited to illustrating the shift towards cooperation without hegemony paradigm and providing visualization for the idea of a leaderless world from an international regime perspective.
For this purpose, the collection of 120 prominent international conventions deposited in the UN system is implemented. It contains the ratification status of conventions that cover a range of subject matters, from human rights, environment, and peace, to labor, intellectual property, trade, commerce, and communication. The records of international negotiations, ratifying more than one hundred international agreements of nearly 200 states are examined to describe the leadership behavior of nation-states. Based on the above, the research provides a striking portrait of dynamic and disparate world leaders, while at the same time giving an overview of the most important global norms, rules, and institutions. The results show a notable decrease in world leadership performance among countries and the convergence in states’ position in world politics. These results then are used to highlight what is stated about the new world era – an era of cooperation without hegemony.
The rest of the paper is structured as follows. The collection of UN multilateral conventions data on a wide range of world political arenas is first introduced. The following section then describes the evolution of global norms in the form of conventions. The paper continues by explaining the quantitative framework used for measurement and analysis of leadership. The obtained results are then used to observe the changes in global leadership in each domain of global regimes. Finally, some conclusions about the cooperation without hegemony paradigm from the global regime perspective are offered in the last part of the paper.
2. International convention database
What is an international convention?
A convention is a principal source of international law, which is a legally binding agreement open for ratification by member states. Over past centuries, a number of additional terms that refer to this instrument of international law have been developed. For example, it may also be known as a treaty, agreement, protocol, covenant, contract, statute, or exchange of letters among other terms. No particular nomenclature exists for such international instruments, thus the title has normally no overriding legal effect. Although the term treaty is the generic term used to refer to all formal written agreements between states, conventions are most commonly used to refer to a large multilateral agreement on a topic that is generally of considerable importance (Barker, Reference Barker and Kutting2004). Despite the difference in title, these documents all have common features as formally written instruments entered into by sovereign states through a process of negotiation, signature, and ratification, by which states establish rights and obligations among themselves. A government that has ratified a convention is expected to apply its provisions through legislation or other appropriate means, as indicated in the text of the convention (Alli, 2008).
In an increasingly interdependent world that recognizes many issues that transcend national boundaries, such as ozone depletion, climate change, protection of biodiversity, most countries have acknowledged that international cooperation is required to address international concerns and promote sustainable development. Therefore, increasingly, global cooperation leads to international treaties negotiated under the auspices of the UN. As of 1 December 2000, there were 520 major multilateral instruments deposited with the Office of the UN Secretary-General, covering a range of subject matters such as human rights, disarmament, commodities, refugees, the environment, and the law of the sea (Barker, Reference Barker and Kutting2004). The number of treaties deposited with the Secretary-General grows steadily. However, these represent only a fraction of the over 40,000 international agreements currently registered with the UN (Barker, Reference Barker and Kutting2004).
From the initial goals of protecting human rights, safeguarding peace, establishing a framework for international trade and promoting economic and social progress, international conventions have been added to tackle the new generation of global matters, from intellectual property protection and labor laws to issues associated with the peaceful uses of nuclear energy, armaments proliferation, combat against terrorism, and cybercrime.
Selection criteria for inclusion in the database
The International Convention Database (ICDB) is a resource for information on the ratification status of over one hundred major international conventions, covering a range of subject matters. Basically, the database provides ‘when, who, what’ information about conventions (i.e. who ratified what convention and when).
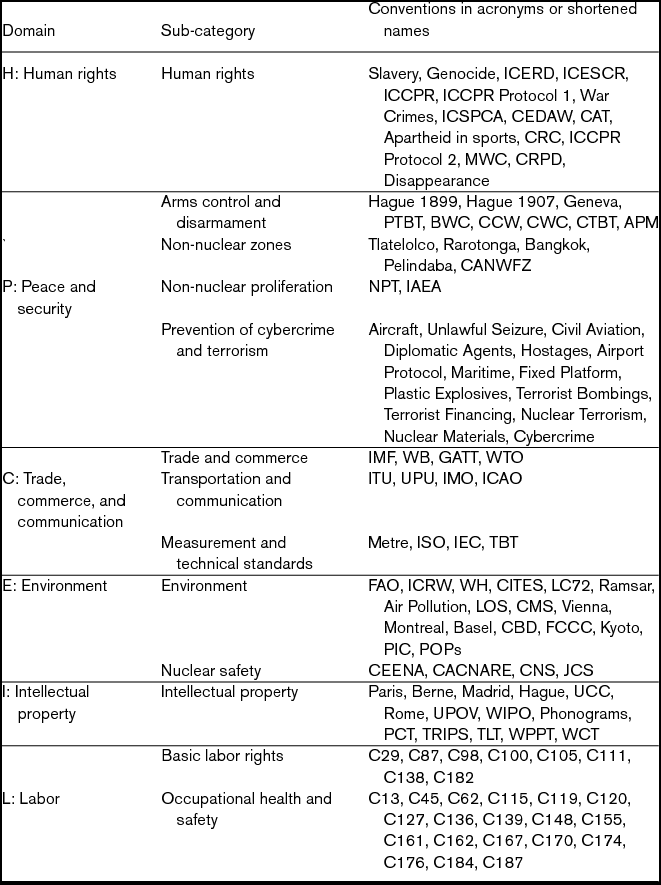
To select which conventions should be included in the database is one of the main concerns of the study. This task is far from easy, considering that there are more than 500 multilateral treaties that have been deposited with the UN Secretary-General and many other treaties that are deposited with governments or other entities. Therefore, this study first referred to Mathias Koenig-Archibugi's map on the organizational infrastructure of global governance (Koenig-Archibugi, 2002). It includes a number of formal international and transnational organizations operating at a global level and is categorized into four areas: security, human welfare, environment, and economy. Based on that, we extend the scope of the study by not only focusing on the instruments developed by UN specialized agencies, programs and funds, but also including other international agreements that fall under the auspices of the UN. Through an assessment of their importance and contribution in forming international regimes, we have collected in total 120 multilateral conventions deposited in the UN system. Moreover, the range of subjects has been also widened to cover six areas representing six major global issues for today's world: human rights (H), peace and security (P), trade, commerce, and communication (C), environment (E), intellectual property (I), and labor (L). Each area includes different but related sub-subject matters. For instance, arms control and disarmament, non-nuclear zones, non-nuclear proliferation, prevention of cybercrime and terrorism, all fall under the peace and security category. Table 1 shows all the conventions covered in the ICDB, listed by their abbreviated forms. Each convention is briefly introduced in the next section.
List of multilateral conventions covered by the study

Note: The full listing of conventions is given in Appendix 1.
3. Evolution of global norms in the form of conventions
Since international regimes reflect patterns of cooperation and discord, by investigating the evolution or the norms and rules of regimes over time, we can use the concept of international regimes both to explore continuity and to investigate change in world politics (Keohane, Reference Keohane1984). In this section, the evolution of international regimes in the form of multilateral conventions is reviewed using a Global Support Index as a visualization aid. We first describe the construction of this quantitative index and its meaning.
Global Support Index
For our research, we have constructed a Global Support Index (GSI) to measure the degree of support by the international community for an international convention. GSI is an indicator that covers participation by nearly 200 states in conventions categorized into the six major groups: human rights; peace and security; trade, commerce, and communication; environment; intellectual property; and labor. In particular, we developed this global support metric to consider both the ratified country coverage (RCC) and the ratified population coverage (RPC). RCC was obtained by counting how many states have ratified a given convention to become its party members, while RPC represents the international commitment to the convention by the percentage of the world population. To derive RPC, we collected the yearly population data of all states in the world from 1960 to 2011 from World Bank Statistics for our calculations. By showing the degree to which the convention is supported or has spread globally over time in both number of state members and population coverage, a more detailed picture of world support for different international conventions according to global issue is provided.
The following sections of this paper show the comparable results of the Global Support Index, both by RCC and RPC, while also briefly introducing the formation and goal of each convention. Through the analysis of changes in treaty participation by number of state members across a broad time pattern, there is clearly a surge of ratification from the mid-twentieth century onwards. Moreover, the noteworthy difference between RCC and RPC suggests useful information can be extracted about the variation in ratification.
Trade and commerce
The growth of trans-border transactions of goods and people is a relentless driving force behind the creation of a global coordination mechanism, and it always requires leadership to coordinate the conflicting demands of trading partners. Tariffs and technical and safety standards are the main areas for coordination.
Among all, tariffs had been the central and uppermost concerns of all members. An uncountable number of tariff unions and tariff agreements have been formulated throughout history. They can be traced back centuries. But all of them have been regional in terms of geographical scope, and it is not until the General Agreement on Tariffs and Trade (GATT) emerged after World War II that the world had truly global tariffs. A history of tariff unions and agreements is not needed here. A global coordination mechanism seems to have appeared in other aspects of international trade, such as measurement standards and quarantine procedures.
Trans-border trade necessitated a globally uniform measurement standard as a basis of fairness and for efficiency of trade. Due to the initiatives of France and several European countries, the first-ever globally uniform measurement convention was established in 1875 based on the metric system. As a central organ to implement the convention, the International Bureau of Weights and Measures (French acronym BIPM is commonly used to denote this organ) was established in Paris at the same time.
Trans-border trade often brought in unexpected, unwelcomed guests. Pests and several communicable diseases, brought by traders, were repeated causes for concern. In order to prevent the spread of diseases, various quarantine systems were devised and practiced at many ports around the world. The word ‘quarantine’ originates from the Venetian dialect form of the Italian quaranta giorni, meaning ‘forty days’. One practice was an imposed 40-day period of isolation for ships and people wishing to enter the city of Dubrovnik in Dalmatia (currently Croatia). As a form of international convention, the first multilateral International Sanitary Convention was concluded at Venice in 1897, which focused on the plague (Obijiofor, Reference Obijiofor1969). The functions of sanitary conventions were later integrated into the mandates of the World Health Organization (WHO).
Thus, the removal of tariffs and technical barriers of various forms are the central issues in the promotion of commerce, even from the early days of global commerce, and the value of these eliminations is growing increasingly today.
For the commercial aspects of international development, there are numerous international organizations involved in the regulation of international trade that have been developed. The Bretton Woods Conference in 1944 is recorded as an important milestone by the creation of the International Bank for Reconstruction and Development (IBRD), which is part of today's World Bank (WB) and International Monetary Fund (IMF). Then came the GATT, which was signed at an international conference in Geneva in October 1947.
The World Trade Organization (WTO), the GATT's successor body, serves to exemplify the methods and practical measures adopted by an organized global trading system to regulate international trade in support of national aspirations for international development (Sucharitkul, Reference Sucharitkul and Maniruzzaman2004). The aim of the GATT was to expand international trade and raise world welfare by promoting non-discrimination among member nations and by adhering to a policy of national treatment (Tiefenbrun, Reference Tiefenbrun, Schwabach and Cockfield2004). It provided a regulatory framework for world trade (Tiefenbrun, Reference Tiefenbrun, Schwabach and Cockfield2004). However, the GATT was not followed consistently by all of its member nations until the WTO was formed in 1995 (Tiefenbrun, Reference Tiefenbrun, Schwabach and Cockfield2004).
The WTO has more than 130 members, accounting for over 90% of world trade. The WTO represents a legal framework for the organization of international trade, consisting of a binding set of technical regulations and product standards governing the Agreement on Technical Barriers to Trade (TBT). In recognition that differing regulations and standards among countries makes trade difficult for producers and exporters, the TBT exists to promote the development of regulations, standards, testing, and certification procedures that countries use to regulate markets, while also providing members with the right to protect their consumers, preserve their natural resources, and protect domestic industries.
An estimated 80% of the world trade is affected by standards and regulations and the cost to producers and service providers to comply with these ‘standards’ can amount to 10% of production costs (Mari, Reference Mari2012). Therefore, measurement and technical standards have a very important role not just for technology and society, but also for relational activities such as trade. The Metre Convention, International Electrotechnical Commission (IEC), and International Standard Organization (ISO) are among the most important technical standards. The main purpose is reliance on measurements which might be used and interpreted in the same way worldwide.
Communication
A connected world always requires coordination efforts to establish and maintain connectivity. This is true for all types of telecommunication technology, from electric telegraphy, postal mail to the Internet, and for all means of transportation, from ocean-going ships, railway to airlines.
Almost 30 years after the invention of electric telegraphy, technical experts from different countries gathered in Geneva, Switzerland, to discuss how to coordinate a shared global use of the telecommunication infrastructure and to assist in the development and coordination of worldwide technical standards. It marked the birth of a new international governance framework, the International Telecommunication Union (ITU) in 1865. ITU is one of the oldest international organizations that still exists and is the prototype for many of the ensuing international organizations with similar coordinating functions.
In the area of postal communication, experts organized an international congress in Berne, Switzerland, in 1874 to discuss how to facilitate a global postal system by regarding the whole world as a single postal territory. This meeting marked the birth of another international organization, the Universal Postal Union (UPU) in 1874. Through UPU, postal authorities agree on the rules for what, and how, items should be mailed, and they compensate each other for handling each other's mail (Alleyne, Reference Alleyne and Luthra2004).
For another area of global communication, the International Maritime Organization (IMO) and the International Civil Aviation Organization (ICAO) constitute the current participants in the law-making process for international transport by air, sea, and other international waterways (Alleyne, Reference Alleyne and Luthra2004). To respond to the need for international standards to regulate shipping that can be adopted and accepted by all countries, the IMO was formally created in 1948. Meanwhile, the ICAO was established in 1944 to promote a safe and orderly development of international civil aviation throughout the world. Until now, it serves as a forum for cooperation among its 190 member states. Its function is to create standards and regulations necessary for aviation safety, security, efficiency, and regularity, as well as for aviation environmental protection.
Figures 1 and 2 represent the development progress of the most important trade, commerce, and communication conventions.
GSI measured by RCC (Trade, Commerce and Communication)
GSI measured by RPC (Trade, Commerce and Communication)
Intellectual property
In the late twentieth century, economists and critical theorists recognized that many developed countries with long dominant industrial economies based on the manufacturing, distribution, and consumption of tangible goods were being eclipsed in size and social impact by an emerging economic system based on the creation, commodification, exploitation, and control of intangible (or information-based) goods (Coombe and Turcotte, Reference Coombe2012). This shift raised the importance of intellectual property (IP) in an increasingly globalized information economy. Intellectual property conventions regulate the protection and management of copyright, trademarks, patent rights, and related areas such as trade secrets, geographical indications, and rights of publicity. They also conserve the originality of industrial designs, plant varieties, databases, and integrated circuit topography. In mainstream policy discourses, IP policy is advanced as a means to provide incentives for creativity and innovation, and to secure economic rewards for investment in research and development, while providing a socially optimal level of creative and technological goods (Coombe and Turcotte, Reference Coombe2012). That explains why the last two decades have attracted the heightened attention and concern of the IP community.
The most important international governmental organizations to promote the protection for intellectual property is the World Intellectual Property Organization (WIPO) – a specialized UN agency, established in 1967 in Geneva, Switzerland. WIPO currently has 187 member states and manages 25 international treaties. However, the origins of WIPO can be traced back to one of the first intellectual property treaties, the 1883 Paris Convention for the Protection of Industrial Property (Paris), which established the Union for the Protection of Industrial Property, the so-called Paris Union. Other key conventions in this arena include the 1886 Berne Convention for the Protection of Literary and Artistic Works (Berne), the 1891 Madrid Agreement Concerning the International Registration of Marks (Madrid), the 1925 Hague Agreement Concerning the International Deposit of Industrial Designs (Hague), and the Universal Copyright Convention (UCC). UCC, which was adopted in 1952 and entered into force in 1955, introduced the idea that culture (literary, scientific, and artistic works) embodies universal values that require uniform protection and accordingly a shared responsibility to be assumed by the international community. UCC is an alternative for those countries that disagreed with aspects of the Berne Convention, but still wish to participate in some form of multilateral copyright protection.
Whereas previous copyright law had been written to regulate the circulation of printed materials, there was no equivalent protection for sound recordings. In the 1930s, the use of magnetic tape for recording made the reproduction of sounds and images easier and cheaper than ever before. In response to these new technologies, the Rome Convention for the Protection of Performers, Producers of Phonograms, and Broadcasting Organizations (Rome) was accepted in 1961. The convention expands the coverage of copyright protection from the author of a work to the creators and owners of specific physical instances of intellectual property, such as audiocassettes or DVDs. Later, in 1971, the Convention for the Protection of Producers of Phonograms against Unauthorized Duplication of Their Phonograms (Phonograms) was created as a new international treaty that was designed to give music producers, separate from composers and performers, additional powers to combat copyright infringement. This gave them standing to prosecute makers of unauthorized copies of their tapes or records in other countries (Baskerville, Reference Baskerville2006).
Extending the regulations for the protection of industrial property in the Paris Convention, the Patent Cooperation Treaty (PCT) came into effect in 1978 and facilitates filing for patent protection for the same invention in member countries by providing centralized filing and standardized application procedures (Moschini, Reference Moschini and Azzeddine2004).
The 1994 Agreement on Trade Related Intellectual Property Issues (TRIPS) administered by the WTO achieved further progress in this field by creating a framework of uniform standards of protection for a wide range of intellectual property on a near-universal basis. The agreement covers seven areas of intellectual property. They are: (1) copyright and related rights (rights of performers, producers of sound recordings, and broadcasting organizations); (2) trademarks; (3) geographical indications, including appellations of origin; (4) industrial designs; (5) patents, including the protection of new varieties of plants; (6) layout-designs of integrated circuits; and (7) undisclosed information, including trade secrets. In each of these areas, the agreement establishes minimum standards of protection, that is provisions relating to the domestic enforcement of IP rights and provisions concerning international dispute settlement (Safadi, Reference Safadi and Sirageldin2004).
Other instruments in the field of protecting copyright include the well-known International Convention for the Protection of New Varieties of Plants (UPOV), the WIPO Performances and Phonograms Treaty 1996 (WPPT), and the WIPO Copyright Treaty 1996 (WCT).
Figures 3 and 4 are used to depict the evolution of intellectual property rights since the late nineteen century.
GSI measured by RCC (Intellectual Property)
GSI measured by RPC (Intellectual Property)
Labor
Although the concept of protecting workers from the perils of labor environments dates all the way back to fourteenth-century Europe, the first example of the modern labor rights movement came in response to the brutal working conditions accompanying the onset of the Industrial Revolution in the eighteenth and nineteenth centuries (Brown, Reference Brown2001). In 1802, the Parliament of the United Kingdom passed the English Factory Act that restricted working hours to 12 hours per day (Brown, Reference Brown2001). However, it was evident that the support for the rights of workers in these early days was inconsistent across international boundaries.
It was not until the end of World War I that the International Labour Organization (ILO) was established (in 1919) to implement uniform standards on an international scale. Leaders of the world met at Versailles and agreed to set up this completely new type of international organization, represented not only by governments but by representatives from business and by workers. One of the main functions of the ILO is to develop international labor conventions that cover labor matters, such as the protection of basic worker rights, job security enhancement, and workplace democracy and empowerment, and social matters such as child labor, bullying, discrimination and gender inequality.
One of the most important parts of the ILO Convention is the Governing Body, which identified eight conventions as fundamental to the rights of human beings at work. These rights are a precondition for all others in that they provide the necessary framework from which to strive freely for the improvement of individual and collective work conditions (International Labour Office, 2002). These rights cover four main areas: (1) freedom of association and collective bargaining – the 1948 Freedom of Association and Protection of the Right to Organize a Convention (C87) and the 1949 Right to Organize a Collective Bargaining Convention (C98); (2) abolition of forced labor – the 1930 Forced Labour Convention (C29) and the 1957 Abolition of Forced Labour Convention (C105); (3) abolition of child labor – the 1973 Minimum Age Convention (C138) and the 1999 Worst Forms of Child Labour Convention (C182); and (4) elimination of discrimination at work – the 1951 Equal Remuneration Convention (C100) and the 1958 Discrimination (Employment and Occupation) Convention (C111).
Figures 5 and 6 show the expansion of labor rights regulation throughout the world.
GSI measured by RCC (Principle Labor Rights)
GSI measured by RPC (Principle Labor Rights)
Another central issue for the ILO since its creation, and which continues to be so today, is occupational safety and health (OSH). Close to 80% of all ILO standards and instruments are either wholly or partly concerned with issues related to OSH (Alli, 2008). The key element of OSH is the protection of workers against sickness, disease, and injury related to the workplace environment by improving working conditions and achieving strong preventive safety cultures. The conventions embody principles that define the rights of workers as well as allocating duties and responsibilities to the competent authorities, to employers, and to workers (Alli, 2008). Based on scope or purpose, the OSH conventions can be categorized into these following groups.
The first one are the fundamental principles to guide policies for OSH promotion, action, and management contained in three international labor conventions (the Occupational Health Services Convention in 1985 [C161], the Promotional Framework for Occupational Safety and Health Convention in 2006 [C187], and the Occupational Safety and Health Convention in 1981 [C155]). These provide for the adoption of national occupational safety and health policies, as well as describing the actions to be taken by governments and within enterprises to promote occupational safety and health and improve working environments (Alli, 2008).
The second OSH convention group comprises a set of general protection measures, for example, guarding of machinery (Guarding of Machinery Convention in 1963 [C119]), or limiting the weight of loads to be transported by a single worker (Maximum Weight Convention in 1967 [C127]).
The third group regulates protection in specific branches of economic activity, such as the building industry (Safety Provisions Building Convention in 1937 [C62], Safety and Health in Construction Convention in 1988 [C167]); commerce and dock work (Hygiene [Commerce and Offices] Convention in 1964 [C120]); mining (Safety and Health in Mines Convention in 1995 [C176]); or agriculture (Safety and Health in Agriculture Convention in 2001 [C184]). The protection of a specific type of workers having specific occupational health needs, such as women (Underground Work [Women] Convention in 1935 [C45]), also forms another aspect of OSH conventions.
Another approach for the OSH is protection against specific risks and substances, such as ionizing radiation, benzene, asbestos (White Lead [Painting] Convention in 1921 [C13], Radiation Protection Convention in 1960 [C115], Benzene Convention in 1971 [C136], Asbestos Convention in 1986 [C162]); prevention of occupational cancer (Occupational Cancer Convention in 1974 [C139]); control of air pollution, noise, and vibration in the working environment (Working Environment [Air Pollution, Noise and Vibration] Convention in 1977 [C148]); measures to insure safety in the use of chemicals (Chemicals Convention in 1990 [C170]), including major industrial accidents (Prevention of Major Industrial Accidents Convention in 1988 [C155]).
Although the slow increase in the number of states committed to OHS related conventions can be observed through the RCC in Figure 7, the RPC in Figure 8 shows a very marginal change in the world population weight that benefit from these regulations.
GSI measured by RCC (Occupational Safety and Health)
GSI measured by RPC (Occupational Safety and Health)
Human rights
The concept of human rights has a rich history, beginning with the early discussions of the seventeenth century (Sweet, Reference Sweet and Sekiguchi2005). However, it is not until the twentieth century that human rights became a central issue at the global discussion table. The issue of suppressing slavery and the slave trade first received international attention at the 1926 Slavery Convention, created under the auspices of the League of Nations. It was then followed by a series of conventions that formed the global human right regimes. It is undoubtedly one of the great achievements of that century to have made human rights and fundamental freedoms a domain of law that has radically transformed the thinking of humankind. Such an achievement could not have materialized without human rights conventions proclaiming rights and freedoms for all (Smis, Reference Smis, Schwabach and Cockfield2004).
With the purpose ‘to achieve international co-operation in solving international problems of an economic, social, cultural, or humanitarian character, and in promoting and encouraging respect for human rights and for fundamental freedoms for all without distinction as to race, sex, language or religion’ (United Nations Charter, United Nations, 2014), the United Nations is the main international organ by which the international standards of human rights have been established and which helps to supervise the implementation of these rights. Since the adoption of the Universal Declaration of Human Rights in 1948, an extensive set of declarations and conventions containing detailed standards on human rights have come into being, at both the global and the regional level.
The most comprehensive development of the Universal Declaration of Human Rights can be found in the two international covenants and in their optional protocols, adopted by the General Assembly in 1966: the International Covenant on Economic, Social, and Cultural Rights (ICESCR) and the International Covenant on Civil and Political Rights (ICCPR). By 2012, 160 states had ratified ICESCR and 167 states were members of ICCPR. The first optional protocol of ICCPR entered into force in 1976 and it now has 114 member states. The General Assembly adopted the second optional protocol against the death penalty, and which currently has 76 member states.
In addition to the Universal Declaration and the two covenants, which cover human rights in general, over the years the General Assembly has adopted a large number of declarations and conventions with regard to specific subjects. One of the first was the prohibition of crimes against humanity that is clarified in the Convention on the Prevention and Punishment of the Crime of Genocide in 1948 (Genocide), the International Convention on the Elimination of All Forms of Radical Discrimination in 1966 (ICERD), the Convention on the Non-Applicability of Statutory Limitations to War Crimes and Crimes Against Humanity in 1968 (War Crimes), the International Convention on the Suppression and Punishment of the Crime of Apartheid in 1973 (ICSPCA).
Discrimination on the basis of gender has also received significant attention. In 1979, the General Assembly adopted the Convention on the Elimination of All Forms of Discrimination against Women (CEDAW). By 2012, 187 states had committed to this treaty.
In 1959, the General Assembly adopted a declaration on the rights of the child, and, more than 30 years later (in 1990), a binding convention on that subject was realized. The Convention on the Rights of the Child (CRC) has been ratified by a record number of 193 states.
Another topic in which the General Assembly has been active is the protection of rights of individual persons who are subject to arrest or detention and of all migrant workers. The Declaration against Torture or Cruel, Inhuman or Degrading Treatment or Punishment, adopted in 1975, was followed by a binding Convention against Torture (CAT) in 1984, which has been ratified by 153 states. The International Convention on the Protection of the Rights of All Migrant Workers and Members of Their Families (MWC) was adopted in 1990, entered into force in 2003, and has 46 states ratify it thus far.
In addition, there are other major human rights treaties recently drafted under the auspices of the UN, such as the Convention on the Rights of Persons with Disabilities in 2006 (CRPD), the International Convention for the Protection of All Persons from Enforced Disappearance in 2006 (Disappearance)
Figures 9 and 10 show the level of commitment by the international community for ten major human right conventions. The measures, both in RCC and RPC, show the steadily increasing support for human right issues since the 1960s.
GSI measured by RCC (Human Rights)
GSI measured by RPC (Human Rights)
Environment
Global environmental issues are the most recent concerns of world leaders. The post-World War II era has truly seen a steady increase in awareness of environmental problems, along with an increase in the severity and incidence of those problems (Schwabach, Reference Schwabach, Schwabach and Cockfield2004). Global environmental problems, such as ozone depletion, climate change, and loss of biodiversity across borders, endanger the entire globe and pose long-term obstacles for all of humanity.
The mid-twentieth century, coupled with the globalization era, experienced a serious degradation of the global environment. The world recognized the importance of working together to solve this transboundary issue. This is strongly illustrated through the historical conference in Stockholm in 1972 that attracted representatives from 114 countries. The Stockholm Conference transformed micro- and macro-perceptions of environmental issues, firmly placed it on the international political agenda, and raised it in prominence, distinguishing the environment as a universal concern. It provided the catalyst that continues to shape international conventions related to environmental protection until today (Varfis and Wilson, Reference Varfis, Wilson and Kutting2004).
The second major milestone in international action on environmental issues was reached in June 1992, when more than a hundred heads of state gathered in Rio de Janeiro for the UN Conference on Environment and Development (UNCED), popularly known as the ‘Earth Summit’ (French, Reference French and Murphy2004). Governments, international organizations, and non-governmental organizations (NGOs) again met to find a common response to transboundary environmental issues, such as climate change and loss of biodiversity.
Among international environment agreements, the International Convention for the Regulation of Whaling (ICRW) has the longest history of all. It was signed in 1946 and entered in force two years later. From being an international convention with a small number of members, it has now expanded with the participation of 86 nations agreeing to regulate commercial whaling and conservation of the remaining whale populations.
Other international environment agreements, in general, focus on a specific natural medium or human activity, such as air, water, land, transfer of wastes, and fishing. Accordingly, they can be first divided into a group dealing with nature conservation and terrestrial living resources, including the 1971 Ramsar Convention on the Conservation of Wetlands (Ramsar), the 1972 World Heritage Convention concerning the Protection of the World Cultural and Natural Heritage (WH), the 1973 Convention on International Trade in Endangered Species of Wild Flora and Fauna (CITES), the 1979 Convention on the Conservation of Migratory Species of Wild Animals (CMS), and the Convention on Biological Diversity (CBD). The next group is the marine environment group that consists of the 1972 Convention on the Prevention of Marine Pollution by Dumping of Wastes and Other Matter (LC72) and the 1982 United Nations Convention on the Law of the Sea (LOS). The atmosphere represents the third group and includes the 1985 Vienna Convention for the Protection of the Ozone Layer (Vienna), the 1987 Montreal Protocol on Substances that Deplete the Ozone Layer (Montreal), the 1992 Framework Convention on Climate Change (FCCC), and the 1997 Kyoto Protocol (Kyoto). Hazardous substance management form the focus of the next group of conventions, including the 1989 Basel Convention on the Control of Transboundary Movements of Hazardous Wastes and Their Disposal (Basel), the 2001 Stockholm Convention on Persistent Organic Pollutants (POPs), and the 1998 Rotterdam Convention on the Prior Informed Consent Procedure for Certain Hazardous Chemicals and Pesticides in International Trade (PIC)
The fourteen environmental agreements, WH, CITES, Ramsar, CMS, Vienna, Basel, CBD, FCCC, PIC, POPs, LC72, LOS, Montreal, Kyoto were selected to represent the trend of global support for environmental issues. Both RCC and RPC illustrate clearly that since the early 1970s, global environmental problems have raised awareness among states throughout the world and extraordinary levels of international cooperation have been implemented. By introducing both country count (RCC) and population weight (RPC), the worldwide spreading of ratification is now being supplemented more clearly (Figures 11 and 12).
GSI measured by RCC (Environment)
GSI measured by RPC (Environment)
Acknowledgment of the environmental impact of nuclear energy after the Ukrainian nuclear power plant accident of Chernobyl, in the former USSR in April 1986, the international legal framework for nuclear energy was developed relatively recently. This is illustrated in Figures 13 and 14.
GSI measured by RCC (Nuclear Safety)
GSI measured by RPC (Nuclear Safety)
Promotion of nuclear safety is achieved mainly through adoption of legally binding agreements, focusing on the basic aspects of nuclear energy: prevention of accidents and communication and management of their effects. Currently, a number of international agreements are in force regulating these aspects. The Convention on Nuclear Safety (CNS), and the Joint Convention on the Safety of Spent Fuel Management and on the Safety of Radioactive Waste Management (JCS) cover the aspects of prevention. The 1986 Vienna Conventions on Early Notification of Nuclear Accident (CEENA) and on Cooperation and Assistance in Cases of Radiological Emergencies (CACNARE) deal with responses to, and management of, nuclear accidents or radiological emergencies.
Peace, arms control, and disarmament
The twentieth century was the most disastrous in the history of humankind due to the World Wars I and II. Toward the end of the twentieth century, approximately 90% of casualties from war were civilians, as opposed to just 10% at the beginning of the century (Fast, Reference Fast and Marquardt2004). Technological development has led to nuclear, biological, and chemical weapons, which have potentially devastating effects, killing unbelievable numbers of people, and destroying the natural environment.
The alarm has been raised to the whole world about the necessity of a safeguard framework to protect civilian lives in times of war. Assigned to be the organization that aims to promote peace, stability, and well-being, the UN has responded to these challenges by strengthening the arms control and disarmament regimes. Multilateral arms control and disarmament agreements are typically exercised for restrictions and/or reductions on the development, production, stockpiling, proliferation, and usage of weapons, especially weapons of mass destruction (Kolodkin, 2012).
The Protocol for the Prohibition of the Use in War of Asphyxiating, Poisonous or Other Gases, and of Bacteriological Methods of Warfare signed in Geneva on 17 June 1925, usually referred to as the Geneva Protocol, is a treaty prohibiting the first use of chemical and biological weapons. It strictly regulates the use of chemical and biological weapons, but did not mention anything about production, storage, or transfer of them. Later, two conventions, the 1972 Convention on the Prohibition of the Development, Production, and Stockpiling of Bacteriological (Biological) and on Toxin Weapons and their Destruction (BWC) and the 1993 Convention on the Prohibition of the Development, Production, Stockpiling, and Use of Chemical Weapons and on their Destruction (CWC) were created to cover these aspects.
Since nuclear weapons entered the realm of world politics during World War II, issues related to the control of nuclear materials, technology, and knowledge have formed one of the most important dimensions of international security. After the atomic bombing of Hiroshima revealed the existence of nuclear weapons to the general public, a mass non-violent protest forced the creation of the first nuclear arms control agreement, the Partial Test-Ban Treaty (PTBT) in which nuclear tests in the atmosphere, in outer space, and under water were banned, but not underground. A major step toward this goal came with the signing of the key agreement, the Non-Proliferation Treaty in 1968 (NPT). A total of 190 parties have joined the treaty, with five states being recognized as nuclear weapons states: the United States, Russia, the United Kingdom, France, and China. Under the regulation of NPT, non-nuclear weapon states were prohibited from possessing, manufacturing, or acquiring nuclear weapons or other nuclear explosive devices.
The subsequent decades witnessed little progress in nuclear disarmament legislation. It was not until the end of the Cold War in 1991 that intensive efforts were made to adopt the 1996 Comprehensive Test-Ban Treaty (CTBT) by which states agree to ban all nuclear explosions in all environments, for military or civilian purposes.
The global Nuclear Non-Proliferation Treaty and other treaties against the spread of nuclear weapons are the responsibility of the International Atomic Energy Agency (IAEA) as the nuclear inspectorate regulated under the Safeguard Agreement. Under this agreement, IAEA can verify that a state is meeting its international commitments to not use nuclear programs for nuclear weapons purposes. Within the world's nuclear non-proliferation regime, the IAEA's safeguards system functions as a confidence-building measure, an early warning mechanism, and a trigger that sets in motion other responses by the international community if and when the need arises (IAEA, nd).
Figures 15 and 16 illustrate the global support level for arms control and disarmament conventions.
GSI measured by RCC (Arms Control and Disarmament)
GSI measured by RPC (Arms Control and Disarmament)
In Article VII of NPT, it states that ‘nothing in this Treaty affects the right of any group of States to conclude regional treaties in order to assure the total absence of nuclear weapons in their respective territories’ (IAEA, 1970: 4). Based on that, the establishment of Nuclear Weapons-Free Zones (NWFZ) is a regional approach to strengthen global nuclear non-proliferation and disarmament norms, and to consolidate international efforts toward peace and security (Gillis, Reference Gillis2009). A NWFZ is a specified region in which countries commit themselves not to manufacture, acquire, test, or possess nuclear weapons (Gillis, Reference Gillis2009). Five such zones exist today, with four of them spanning the entire Southern Hemisphere. The regions currently covered under NWFZ agreements include Latin America (1967 Treaty of Tlatelolco), the South Pacific (1985 Treaty of Rarotonga), Southeast Asia (1995 Treaty of Bangkok), Africa (1996 Treaty of Pelindaba), and Central Asia (2006 Treaty on CANWFZ).
It is said that these five land zones cover 84 million square kilometers, representing more than one-half of the surface of the earth. The above RPC figures show that in terms of world population coverage, it is just around 28%. This may be explained by changes in the population of the area expanding historically.
Cybercrime and terrorism
Terrorism has been on the international agenda since 1934, when the League of Nations took the first major step toward outlawing the scourge by discussing a draft convention for the prevention and punishment of terrorism. Although the Convention was eventually adopted in 1937, it never came into force (United Nations, 2014).
During the second half of the twentieth century, many countries in Europe, Latin America, Africa, and Asia confronted movements of the most diverse kinds that had in common a willingness to resort to the use of violence against innocent civilians to obtain their goals (O’Donnell, Reference O’Donnell2006). In response, the establishment of effective international regimes to combat the criminal activity of terrorism and cyber penetration has taken on a new urgency. Currently there are 13 international treaties against terrorism, and one treaty adopted for cybercrime prevention.
The Convention on Offences and Certain Other Acts Committed on Board Aircraft, adopted in Tokyo in 1963, is considered the first international treaty against terrorism (O’Donnell, Reference O’Donnell2006). Later five more were adopted during the 1970s: the 1970 Convention for the Suppression of Unlawful Seizure of Aircraft; the 1971 Convention for the Suppression of Unlawful Acts against the Safety of Civil Aviation; the 1973 Convention on the Prevention and Punishment of Crimes against Internationally Protected Persons, including Diplomatic Agents; the 1979 International Convention against the Taking of Hostages; and the 1979 Convention on the Physical Protection of Nuclear Material. Three treaties were adopted in 1988: the Convention for the Suppression of Unlawful Acts against the Safety of Maritime Navigation, the 1988 Protocol for the Suppression of Unlawful Acts against the Safety of Fixed Platforms Located on the Continental Shelf, and the Protocol for the Suppression of Unlawful Acts of Violence at Airports Serving International Civil Aviation. The 1990s saw the adoption of the 1991 Convention on the Marking of Plastic Explosives for the Purpose of Detection, the 1997 International Convention for the Suppression of Terrorist Bombings, and the 1999 International Convention for the Suppression of Financing of Terrorism. On 13 April 2005, the UN General Assembly adopted the International Convention for the Suppression of Acts of Nuclear Terrorism. These treaties define crimes against civil aviation, shipping, or continental platforms; crimes involving the use, possession, or threatened use of ‘‘bombs’’ or nuclear materials; and crimes concerning the financing of terrorism.
Over the past decade, cybercrime also has posed a serious threat to national and international security. Cybercrime is one of the fastest-growing areas of crime (Interpol, nd). The global spread of the Internet has enabled criminals to carry out illegal activity throughout the world via cyberspace. The security vulnerabilities systems include not only information systems and the computer systems of governments and major companies but also critical national infrastructures, such as power plants or electrical grids. The Convention on Cybercrime in 2014 is the only binding international instrument on this issue until now. It serves as a guideline for any country developing comprehensive national legislation against cybercrime and as a framework for international cooperation between state parties to this treaty (Council of Europe, nd).
GSI measured by RCC (Non-Nuclear Zones)
GSI measured by RPC (Non-Nuclear Zones)
GSI measured by RCC (Cybercrime and Terrorism)
GSI measured by RPC (Cybercrime and Terrorism)
4. Framework of global leadership analysis
After reviewing the evolution of global norms in the form of multilateral conventions over the past few decades, we now turn to the analysis of world leaders changing over time. First, we define the concept of ‘global leadership’ within the scope of our study of international regimes.
Global leadership within the scope of the study
‘In the world where so many challenges transcend borders – from the stability of the global economy and climate change to cyber attacks, terrorism, and the security of food and water – the need for international cooperation has never been greater’ (Bremmer, Reference Bremmer2012: 3). Indeed, international cooperation is not only fundamental, it has also been recognized as the best and most effective way for governments to tackle transboundary or global problems (UNEP, 2007). International cooperation has been defined as a process through which policies actually followed by governments come to be regarded by their partners as facilitating the realization of their own objectives, as a result of policy coordination. Through this process, hegemony power often helped to create cooperation, partly through constructing international regimes that could organize interstate relations along the lines prepared by the hegemon (Keohane, Reference Keohane1984). By creating international regimes that would provide specific benefits to the hegemon, as well as its partners, hegemonic leadership would facilitate and promote cooperation. Hegemonic leaders can facilitate cooperation though many different pathways. In the early stages, hegemonic leaders invest their power resources in building stable international agreements and institutions with known rules. These rules are constructed in ways that suit the interests and the ideologies of powerful states. In the next stage, there is the need for the leadership to provide incentives to others to strengthen a global consensus. In that way, the hegemon seeks to persuade other states to conform to its vision of world order and to defer to its leadership (Keohane, Reference Keohane1984). Along with the growing complexity of human activities and global affairs, international cooperation has changed to take the form of a stakeholders’ club, where members share interests to cooperate. Among them, some members signal their willingness to hold a central position of global leadership.
This study seeks to measure states’ willingness to take this global leadership position through their behavior in the international regime. Our concept of global leadership aggregates the observation of world power in relation to international treaties across various political domains, such as world peacekeeping, environmental protection, trade and commerce, as well as including those often underrated areas by policy scientists, such as human rights, labor rights, or intellectual property. At the same time, states with global leadership potential play a cutting-edge role in many aspects of social-cultural-political life. More specifically, our global leadership concept is built on the role of the country in facilitating and promoting multilateral treaties by analyzing the timeliness of their ratification behavior. The efforts states make to promptly ratify a treaty represent their willingness to comply with international law, and thus to cooperate with other partners. The more initiative a nation takes in international treaties, the more it shows to the international community its intention to promote international consensus building. The states’ leading role is represented by their willingness to be the first mover, and then to provide positive incentives to other countries to comply with the expected rules of cooperation. In this sense, ratification acts can be seen as concrete instances of states performing global leadership roles.
However, what is important to note is that our analysis of leadership behavior is limited to the level of compliance with international law and does not include any involvement of law enforcement. Elaborating on the global leading role of states in the stage of international treaty enforcement is surely beyond the range of this analysis. Of course, it would be highly desirable, in another study, to analyze the global leadership behavior of states in exercising global norms.
Index of Global Leadership Willingness
To answer the question of whether leadership by a country or a group of countries is decreasing or not, we have constructed a quantitative index to measure the willingness of a state to take a global leadership position in a given area of international cooperation, namely the Index of Global Leadership Willingness.
International agreements have no binding legal power unless, and until, states ratify them. Hence, understanding why some states ratify an agreement immediately after it opens for signature, whereas others wait for many years to approve it is important for understanding the willingness of states to comply with international law and, thus, to cooperate with other partners in solving global challenges. The swifter the ratification act, the stronger the willingness of a country to behave in such a way as to gain a leading role in actor-negotiated international regimes. Therefore, the efforts states make to quickly ratify a treaty to become legally binding in international law can be seen as concrete instances of states performing global leadership roles in a particular issue of international cooperation. In other words, the ratification year itself has meaning as it reflects the intense desire and the quickness or reluctance of national policy in response to a global issue.
For each country, rather than only considering its position in ratification of a certain convention, the research presents empirical analysis focusing on the time patterns of ratification to identify the first movers and, thus, leaders in a particular issue of international cooperation. To measure how fast a country's policy response is to a typical convention, two options can be considered: (1) rank (or order) in a sequence of ratifications and (2) counting the elapsed years between promulgation of a convention and its ratification.
For the first approach using rank, the variation in the number of elapsed years could be wrongly evaluated. For example, country i may have the same rank for two different conventions A and B, although their elapsed year numbers are different. Let us say country i ratified convention A ten years after A's promulgation and i also ratified convention B 20 years after B's promulgation. As long as only one country, say country j, ratified A and B earlier than country i, the rank remains the same despite the different length of elapsed time. Therefore, as with any comparison, the two different quantities in number of elapsed years will not be evaluated. The ranking then itself does not reflect how quickly a country commits to a given convention.
For a typical convention, let Ni denote the effective years between promulgation of a convention and its ratification by country i. If Yp is the year of promulgation, and Yi the year of ratification by country i, the second approach then measures Ni = Yi − Yp that takes account of the number of elapsed years. Figure 21 shows the growth shape formed by Ni for some major multilateral treaties in the different domains of politics. It is clear that the ratification pattern differs very much among treaties. Some treaties quickly reached their peak in the number of memberships in the first ten years, whereas others gradually changed, especially in some cases where countries were still pursuing ratification more than three decades after a convention was promulgated.
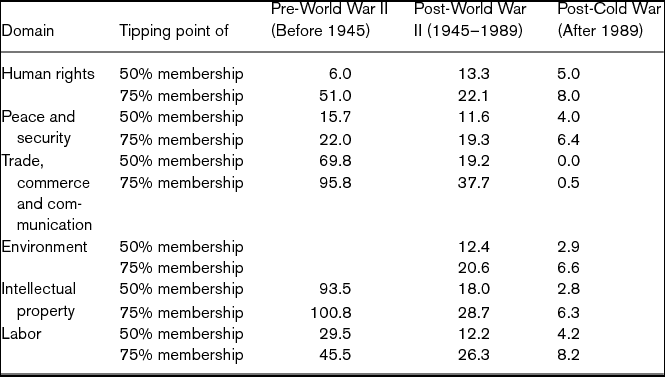
Moreover, across issue areas, we implemented a simple analysis to find out the tipping points of international treaties. The tipping points of 50% and 75% membership are number of years from the promulgation of a given convention until the point in time when 50% and 75% of its member countries ratified that convention. Our interesting results show that there is the significant variation between different global issues in terms of timing (Table 2). Furthermore, the tipping points of different periods in the same domain themselves are different.
Tipping point of 50% and 75% membership (number of years)
Therefore, the gap in time from the convention's date of creation to the year a state committed to follow it is believed to be valuable in understanding state leadership behavior in the international law system. Although this way appears to solve the disadvantage existing in the ranking approach, the demerit point surges when comparing the leadership metric between two pairs of countries. Right after convention A opens for signature, country i ratifies it two years later than country j did. And 20 years later, country x ratified it two years later than country y did. By counting the elapsed years between a convention's promulgation and a country's ratification, one could misinterpret that the country pair i − j behave similarly to the country pair x − y, and yet they act differently.
Therefore, to measure how quickly a country responds to the formulation of a typical convention, a quantitative indicator reflecting the leadership in the ratification year itself is needed. For that reason, the research proposes the metric by the inverse in the number of elapsed years.
Let the reciprocal of the number of elapsed years that reflects the leader role of the country, namely, Index of Global Leadership Willingness (GLW), be defined by the following formula. One is added to Ni to avoid null-division.
 \begin{equation*}
GLW = \frac{1}{{N_{i} + 1 }}
\end{equation*}
The growth of some major international conventions
Index of Global Leadership Willingness
This indicator is applied to a wide range of global regimes that regulate trade, environment, communication, transportation, human rights, collective security and arms control, labor rights, and intellectual property protection based on our collective data of 120 multilateral conventions adopted since the late nineteenth century. The final goal is to empirically validate the world leaders changing over time and the shift towards cooperation without hegemony paradigm from the global norm perspective.
Three time periods and three country groups
Another concern of the study is the selection of specific time periods in world history to observe global leadership change. In our analysis, the conventions studied are divided into three time periods based on their year of creation. Here, the year of creation means the year when the convention was opened to ratification. The three time periods correspond to pre-World War II (before 1945), post-World War II (from 1945 to 1989), and post-Cold War era (after 1989). The years 1945 and 1989 are chosen for the analysis because they are the significant milestones that marked the biggest transformations of the international system. Let us briefly review major changes in world political history that provide a background for why the above-mentioned time periods are selected.
The birth of the world system of states can be traced back to a hundred years prior to World War I with the coalescing of the European system of sovereign states and its expanding sphere of influence. The nineteenth century witnessed tremendous economic progress in the western world. However, the expanding industrial system created unprecedented problems that forced Europe to take political leadership in the establishment of new institutions and international cooperation which helped mute conflicts among the (great) powers, as well as address common interests and concerns. The development of treaties and institutional arrangements among European governments during the nineteenth century set important historical precedents for more contemporary efforts to enhance world order. For example, the first international institutions and global norms were founded during this period, including communications (the Universal Postal Union in 1874 and the International Telegraph Union in 1865); intellectual property (Paris Convention for the Protection of Industrial Property in 1883 and Berne Convention for the Protection of Literary and Artistic Works in 1886); and measure and technical standards (Convention de Metre in 1875). In the late nineteenth century, the world saw the leadership of European nations in pioneering international treaties and global institutions to pursue national interests and advancements in communications and transportation. In the early twentieth century, the leadership to govern human affairs continued with the expansion of the international economy, the threat of war, and an alliance formation among the great powers necessitated the establishment of international institutions and treaties.
A large change in organizing the international system followed the terrible destruction of World War I (1914−1919), which drew all the major European powers into the conflict. The World War I ended with the new world order in which the United Kingdom, France, Italy, Japan, and the United States played the role of chief arbiters. However, it is the Treaty of Versailles in 1919 that marked the ‘Big Three’ or the ‘G3’ – France, United Kingdom, and the United States – holding noticeably more power and influence on the proceedings and outcome of the treaty than Italy or Japan (MacMillan, Reference MacMillan2003; Boemeke et al., Reference Boemeke, Feldman and Boemeke1998). Early in the period between the two great World Wars, these three leading states tried, with a mounting sense of urgency, to construct a global system through the creation of a number of other international organizations and treaties whose purpose was to improve governance and maintain peace among nations. For historical evidence, as we trace leadership in world politics in the pre-World War II period (before 1945), we focus more on the leading role of France, the United Kingdom, and the United States, or referred to collectively as the G3, and test whether they were dominant players in the early days of constructing a system of global norms.
Continuing through the passage of world history, the year 1945 marked the end of the World War II and a decisive shift in the global system followed. World War II ended with the primary victors being the United States, the United Kingdom, and the Soviet Union. Along with these three states, the Republic of China and France gained permanent seats on the United Nations Security Council. World War II produced a new system of global governance and a number of other power representatives joined it. The epoch of World Wars was a transition period from the European system of states to the world system.
Later in power politics, the rise of the ideological estrangement known as the Cold War in 1947 was the most important phenomenon to shadow international affairs after World War II (Anttiroiko, Reference Anttiroiko and Tummala2004). The US struggle for hegemony, the rise of Japan as an Asian power, and the economic recovery of European powers such as the United Kingdom, France, West Germany, and Italy all culminated in the 1975 Summit in Rambouillet, France, and the creation of the G6. Later, Canada, another large industrialized country joined the group to create the G7. The addition of Russia to the group led to the G8 in 1998. The main role of this expanding group has been to provide sound economic policy leadership. For the post-World War II period, the G8 is an important influence in promoting change in national and international policy. To mark this critical milestone in changing world leadership, we select the years from 1945 to 1989 as the years defining our second observation period for interpreting the leading role played in the formation of international conventions among the eight established powers: the United States, Japan, Germany, France, the United Kingdom, Italy, Canada, and Russia.
The year of 1989 is was the biggest year in world history since 1945. It was the year that marked the fall of an iconic symbol of the Cold War – the Berlin Wall. One year later, the Conference on Security and Cooperation in Europe, was held in Paris in November 1990, in which heads of governments produced the treaty that brought a formal end to the Cold War (Anttiroiko, Reference Anttiroiko and Tummala2004). It marked not only the collapse of the Soviet system, but also the decline in US power. The global balance of power is shifting from the United States to the European Union, China, India, Brazil, and other rising states because of the recognized need for cooperative management of world politics. A new map of world power is shaped not only by the contributions from the G8 countries, but also by the other emerging representatives from different continents that marks the formation of the G20.
In sum, to analyze the major changes in world leadership over time, our research is organized around three time periods, before 1945, 1945−1989, and after 1989, in which we study a number of countries representing the world's most influential group of states (G3, G8, and G20).
The following section shows the results of our analysis using the Index of Global Leadership Willingness (GLW). The index value for the G3, G8, G20, and the world average are calculated for these three time periods and shown for each domain of treaties. Based on that, the changes of leadership over time, regime by regime, is clearly visible.
5. Observed changes of leadership by regime categories
Based on our collection of 120 multilateral conventions deposited to the UN on various global issues and by using our framework of global leadership analysis, we have constructed an empirical test to validate what political scientists write about the transformation towards cooperation without hegemony paradigm. The willingness to take a global leadership role by states in six international regime domains, namely peace and security (P), human rights (H), environment (E), intellectual property (I), labor (L), and trade, commerce, and communication (C), is systematically examined. The results are explained in the following sections with the aid of two types of graphs: the line graph representing change in global leadership over time and the hexagonal graph illustrating leading country behavior in the six international regime domains. The meaning of these two types of graphs is first detailed.
Line graphs
A line graph is generated for each of the six selected international regime categories. The graph's purpose is to capture the change in leaders over time. More specifically, global leadership willingness scores are measured for the G3, G8, and G20 groups, and compared with the average score for the world, which is then shown in each graph for each regime domain. Moreover, the upper end of the range bar corresponds to the world average plus standard deviation and the lower end corresponds to the world average minus standard deviation.
Before starting our statistical analysis, we implemented a small test to prove that our set of data is a normal distribution. The simplest method of assessing normality that we first applied is to look at the frequency distribution histograms and we focused on the symmetry and peak of the curve. Moreover, we used the Kolmogorov−Smirnov test to further validate the results of these visual histograms. The Kolmogorov−Smirnov test provided by the Mathlab tool helps us to confirm that our set of international convention data is a normal distribution with the confidence level above 90%.
Using the normal distribution theory, a range of less than one standard deviation away from the mean accounts for about 68% of the members. Therefore, if countries are distinct from each other − for example, they are leaders − their metric should be far away from this range. In that way, the trend of change in global leadership of the most influential group of countries and the world as a whole over time can be observed clearly.
Hexagonal graphs
A country's political attitude is characterized in a hexagonal graph that plots six measurements of its global leadership in six regime domains. The plotting point in each angle of the hexagonal graph reflects how many standard deviations above or below the world mean a country exercised, which is called the z-score. Thus, a positive score represents a country that has experienced a global leadership willingness index value above the world mean, whereas a negative score represents a country that has experienced a global leadership willingness index below the world mean. This kind of score is called standardized or normalized and is used to capture the comparative evaluation among countries. As our set data is under normal distribution, if we have μ the world mean, and σ the standard deviation of all country scores, we can standardize each country's global leadership willingness value, GLW, by converting it into a z-score using the following formula:
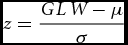 \begin{equation*}
z = \frac{{GLW - \mu }}{\sigma}
\end{equation*}
In that way, a z-score respresents a country's relationship to the world mean, thus it can illustrate whether a country is leading the world or not on a given global issue. For instance, if country A has a z-score of 1.0 (from now A is noted as A(1.0) with her z-score in parentheses), in the normal distribution we can infer that country A achieved better than 68% of countries in the world and ranked roughly among the top 60 countries (32% x 200). Likewise, B (2.0) means that country B achieved better than 95% of the countries in the world and is among the top ten countries of the world. Using the same type of interpretation, when C achieved better than 99.7%, C will be written as (3.0), and C will be the best performer in the world. With that scaling of measurement, it can be interpreted that a country having the z-score in a given regime domain of 2.0 or higher is outstanding and leads the world in that field.
Figure 23 is one example of our generated hexagonal graph. The solid line represents the z-score values achieved by a given state and the dotted line shows the world's average. They highlight the comparable evaluation of the state's policy attitude characterized in six global subject matters.
Example of hexagonal graph of a country
The following sections detail, regime by regime, changes in global leadership. For each category of regime, we also list the countries that perform outstandingly well in this particular global issue along with their achieved score. Their hexagonal graphs can be found in Appendix 2.
We first start our analysis with the peace and security norms category.
Peace and security
The process of shifting towards cooperation without hegemony is most clearly illustrated in the arena of state-to-state conflict, both in real and cyber fields, through our empirical testing with multilateral convention data.
First, we applied our analysis using the Index of Global Leadership Willingness for the group of conventions related to arms control and disarmament, non-nuclear zones, and non-nuclear proliferation. The index value for the G3, G8, G20, and the world average are shown in Figure 24.
Changes of GLW through three periods (Peace and Arms Control)
The figure depicts the dominant role of the G3 and G8 in the domain of peace and arms control for the years of the pre-World War II period. The average of GLW of the G3 and G8 members are 0.67 and 0.56, respectively, and are far above the world average point of 0.09. It means that the G3 and G8 members have taken initiatives by committing themselves very quickly to those conventions representing this time period. An index value of more than 0.5 means that these countries ratified the convention in the space of one year on average (0.5 = 1/(1+1)). The conventions taken for this time period are the two Hague Conventions negotiated at international peace conferences in the Netherlands in 1899 and 1907, followed by the Geneva Protocol in 1925 – a single article permanently bans the use of all forms of chemical and biological warfare. Actually, in most cases, G3/G8 members were the original signatories and legal scriptwriters of those conventions.
The following periods experienced a significant decrease in the GLW score of the G3 and G8 as well. From being distinct in the first period, the G3 and G8 turned, registering around 0.30, whereas the G20 was rating a 0.25, and the world was averaging 0.14 in the second period.
A further decline is calculated in the third period when the G3 is at 0.20 and the world average is at 0.18. Without any distinguishable score in the global leadership willingness, it is obvious that the G3 is not taking the reins in the field of world peace. With the end of the Cold War and shifting centers of power, the effort to protect and enhance world peace has been transformed in a remarkable process and not by great power initiatives, but remarkably by NGOs and their partnerships with governments. The International Campaign to Ban Landmines is a typical example of NGOs advocating for international peace and security. This NGO is working for a world free of anti-personnel mines and cluster munitions, and its founding coordinator, Jody Williams, shared the 1997 Nobel Peace Prize for the organization's efforts in the creation of the Mine Ban Treaty. The successful process that brought about the Mine Ban Treaty has added a new dimension to diplomacy and demonstrates that small and middle powers can work together with civil society and address peace concerns with breathtaking speed (Williams, Reference Williams1999). It shows that such a partnership can present a new kind of ‘global leader’ in the post-Cold War world.
When we examine global leaders with a z-score of more than 2 over three time periods, we find the most active performance from Mexico (3.57). European states such as Hungary (3.39), Denmark (2.96), Bulgaria (2.90), Sweden (2.78), United Kingdom (2.74), Austria (2.65), Russia (2.52), Netherlands (2.25), and Ireland (2.14) also had high achievements in this domain. But the period after the Cold War witnessed significant international legislation from Canada, and especially from several new faces, such as Mauritius, Fiji, Uzbekistan, and Turkmenistan. Swift responses to the Chemical Weapons Convention (CWC), the Comprehensive Test Ban Treaty (CTBT), the Anti-Personal Mines Convention (APM), and the Nuclear Free Zone Treaties pushed up their GLW score to outstanding.
Changes of GLW top ten countries in peace, arms control and disarmament domain
In another aspect of the peace domain, the world has faced the threat of a ‘war on terrorism’. During the second half of the twentieth century, the international community faced threats from terrorists and cyber-threats, and reacted with the adoption of a series of treaties targeting these types of threat to world peace and security (O’Donnell, Reference O’Donnell2006). The pre-Cold War saw the formation of treaties related to safety issues regarding civil aviation and maritime navigation, including five adopted during the 1970s and three treaties adopted in the 1980s. The G3 and G8 quickly demonstrated their support for acts related to criminality on aircrafts and ships – on average within the first two years (GLW score of 0.3) as compared to the seven-year gap for the whole world (GLW score of 0.125).
Changes of GLW through three periods (Cybercrime and Terrorism)
The years after 1989 saw the adoption of treaties against terrorism and cybercrime. For these conventions, all of the needed groundwork had already been laid to galvanize international cooperation and for states to recognize their responsibility to take action against these international threats. In this context, the need for leadership by powerful countries in the initiative phase is critical. However, as Bremmer depicts in his book: ‘Past efforts to develop treaties or common codes of conduct have produced little real progress, mainly because states don't perceive their vulnerabilities in the same way or with the same urgency’ (Bremmer, Reference Bremmer2012: 74); and the ‘G-Zero dilemma is that every government and institution will defend itself at the expense of others rather than cooperate to design an effective system of collective defense against a common threat’ (Bremmer, Reference Bremmer2012: 76). This trend once again is illustrated clearly through our analysis that shows a downward trend in the way states committed to anti-terrorism and cybercrime regime in the 1990s. The G3/G8/G20 all have a low score of around 0.20, an insignificant achievement gap when compared with that of the whole world, showing at 0.14.
The top five countries to take a leading position against terrorism and cybercrime are all European countries: Hungary (4.52), Spain (3.26), Sweden (3.00), Norway (2.90), and Austria (2.87). From the G20 group, the UK (2.09), Mexico (2.02), and USA (1.98) also scored high. Trinidad and Tobago (2.32), along with Mongolia (2.03) also show remarkable achievement in this global regime category.
The period after the Cold War records the top position of Mexico, followed by the participation of developing countries such as Sri Lanka (2.72), Croatia (2.42), and India (2.28).
Changes of GLW top ten countries in terrorism and cybercrime domain
As we observe from our empirical analysis of global leadership through multilateral conventions on global peace and security, no single country shows the desire to drive a truly international agenda as demonstrated through its level of commitment to the peace regime. Although established powers hold a distinct position in the first period, they are continuously losing their leading role by acting like many other players in the world in the ensuing years. World power is evolving so that no one takes the role of leader. This proves the scheme of the cooperation without hegemony. In the arena of world peace and security, it is evident that this is not a G3, G8 or a G20 world; this is the era of G-Zero – a leaderless world.
Human rights
One of the first attempts at human rights protection is the creation of the 1926 Slavery Convention, internationally spawned under the auspices of the League of Nations. The Allied Powers of World War I endeavored to secure the complete suppression of slavery in all its forms and of the slave trade by land and sea (United Nations, 1956). That explains the high GLW score of 0.5 (i.e. ratification within the first year) of G3/G8 members in the period before World War II.
After the establishment of the United Nations, many governments have more actively cooperated to enhance human rights in the structural form of an international regime of treaties, institutions, and norms. Significant challenges to promoting human rights norms remain, however. Western countries, especially the United States, resist international rights cooperation from a concern that it might harm business, infringe on autonomy, or limit freedom of speech (Council on Foreign Relations, 2013). These concerns are reflected in the US attitude and willingness to commit towards human rights conventions in the years from 1945 to 1989. Results from our analysis show that the G3 has a similar score to the world average at the moderate GLW index value of 0.11, slightly lower than the G20 and G8 scores of 0.13 and 0.14, respectively. Neither the G3/G8 nor the G20 is a leader in regulations on human rights protection. A similar situation continuously occurs in the period after the Cold War when the G3/G8 present behaviors comparable to those of many other countries with a score around 0.18 – a very modest score representing the low willingness to take a leader position. This demonstrates that established countries have not played a leading role in the domain of human rights since the end of the World Wars, at least from the perspective of human rights regime activity. On the contrary, for active commitment to the human rights regime, many of the most active participants are not major powers in the history of the world. For example, Bulgaria (3.57) appeared to be active in committing to a human rights regime, followed by Ecuador (3.49), Sweden (2.85), and Hungary (2.70). Among the G20, we found the high score to be with Mexico (2.12) and Australia (2.01). Narrowing our focus to only the post-Cold War period, Spain and Argentina rise to the top as new leading representatives in human rights legislation activities.
Once again, our empirical testing of the human rights regime supports the preposition about a leaderless world. No single country has risen to the forefront to lead the world in facilitating global compromise on human rights issues.
Changes of GLW top ten countries in human rights domain
Trade, commerce, and communication
The world has experienced two waves of globalization since the mid-nineteenth century. The first wave began around the mid-nineteenth century and ended with the commencement of World War I (roughly 1820−1914). The second wave began in the aftermath of World War II and continues until today (1960−present) (Baldwin and Martin, Reference Baldwin and Martin1999). In both these periods of globalization, states figure importantly in the governance of global finance in several ways: as unilateral actors, as participants in multilateral networks, and as members of suprastate institutions (Scholte, Reference Scholte, Held and McGrew2002). It cannot be denied that the G3 and other European countries have played a critical leading role as a catalyst for the record expansion of international trade.
Changes of GLW through three periods (Human Rights)
Changes of GLW through three periods (Trade, Commerce and Communication)
World trade until 1945 was characterized by the initiatives of the G3 and other European countries in the creation of globally uniform standards for measurement, and communication as basis for fairness and efficiency of trade. By measuring the Index of Global Leadership Willingness (GLW) for multilateral commitment in ITU, Metre, UPU, and IEC, the value above 0.60 for the G3 and G8 explains the pioneer positions of these country members compared with others who scored only 0.09.
International trade in the years following World War II entered at a rapid pace never experienced before. Commercial policy and technological factors help explain the causes behind this enormously rapid growth. However, it is largely recognized that the Bretton Woods international monetary system played an important role in providing a stable environment for trade to flourish. The G7 and its policies, the ascendancy of the Bretton Woods institutions over other parts of the UN system are assertions of states power. Coming out of World War II, the United States was the only country left standing and through its help to the Europeans and the Japanese, it created the architecture necessary to pursue Washington's goal. The Bretton Woods Accord, along with the IMF and the World Bank, are all sound global institutions, but they are all US institutions, US values, US priorities, and US allies. In that way, the United States led the way in world trade norms and institutions in the years after World War II. Our empirical testing results strongly support this statement and show evidence for the dominance of the G3, especially the United States, in promoting global trade norms and institutions. Measuring the leadership score for the IMF, the World Bank, the GATT, along with the creation of the most significant developments of the world trading system (ICAO, IMO, and ISO), we found a very high score for the G3 at around 0.8. It means that the G3 countries ratified the convention almost immediately after it opened. In other words, they played a critical role in initiating growth of the world trade system.
The period after the Cold War experienced the rise of many emerging economies. The economic development and political decisiveness of these developing countries have made them become more active players in multilateral and international trade. The establishment of the G20 is one illustration of the ongoing shift and extension of global influence networks from the developed towards the developing world. The G20 score in this period is rising to be equal to G3/G8 performance. However, our results show that the standard deviation value of the GLW Index for this period is an exceptionally high number of 0.46. It illustrates the situation of an increasingly differentiated developing world trade system. Indeed, as Bremmer explains this situation in his book, ‘instead of a global trade framework, we will have a series of commercial agreements between individual countries and among small groups of countries that create new investment limits and new trade barriers for those outside the bloc’ (Bremmer, Reference Bremmer2012: 78). MERCOSUR (1991), Central European Free Trade Agreement (1992), North American Free Trade Agreement (1994), Shanghai Cooperation Organization (1996), Organization of Central Asian Cooperation (2006) are some of the typical examples of such regionalized trends in world trade.
Throughout the history of international trade and communication agreements, among the top ten countries, we find active G20 members from France (3.03), United States (2.96), United Kingdom (2.85), Canada (2.44), and Italy (2.35). Outside of the G20, the active players are from Europe and include Belgium (3.16), Norway (3.05), Netherlands (2.81), Denmark (2.42), and Sweden (2.25). The countries also have important roles in creating and maintaining these world trade organizations.
Changes of GLW top ten countries in trade, commerce, and communication domain
Note: (*) The Technical Barriers to Trade and the World Trade Organization are two regime instruments that we used to measure global leadership of the state in the period after 1989. The data show that more than 100 countries had ratified in the earliest year. Therefore, they have the same highest z-score at 0.88.
Labor
In contrast to the enormous change in the level of commitment the international community paid to trade and commerce regimes, the labor regime appears not to receive any particular attention from states. A very moderate value of the Index of Global Leadership Willingness (around 0.1, i.e., countries ratified nearly ten years after the first ratification) for established powers as well as emerging powers can be observed throughout the history of international labor treaties. A low standard deviation value of around 0.07 for all three periods indicates a small variability within the world scene where states’ behaviors are very similar. Neither the G3/G8 nor the G20 have shown willingness to take a lead role in promoting and committing to fundamental rights and occupational safety in the workplace. Sweden in comparison has an incredibly active attitude with a GLW score of 0.63, much higher than that of the G3 at 0.14, the G8 at 0.12, the G20 at 0.09, or the world average at 0.06. Sweden (8.24) is followed by other European members – Norway (3.94), Finland (3.22), Spain (2.76), and United Kingdom (2.61). Other active levels of commitment on labor rights come from the American continent, including Cuba (2.76), Mexico (2.33), and Ecuador (2.01). For the period after 1989, Slovakia, Finland, Spain, and some other new names also showed a remarkable change in attitude towards the labor regime.
Changes of GLW through three periods (Labor)
Changes of GLW top ten countries in labor domain
Environment
Although the leadership role of the G3/G8 countries in the pre-World War II era is most visible in the domains of peace, arms control, and human rights, the G3/G8 leadership surged in the environment and intellectual property domains in the period from 1945 to 1989.
Changes of GLW through three periods (Environment)
The sudden increase in the exchange of knowledge, trade, and capital around the world in the mid-twentieth century ushered in the era of globalization, which in turn generated many environmental challenges and intellectual property protection concerns.
For the global environmental issue, with a GLW score of nearly 0.50 as compared to 0.14 as the world average, the G3 had a leading role in the environment domain during the years after World War II. Other members that formed the G8 also have taken an active role in promoting the environmental protection regime by gaining 0.42 in the GLW index. It is commonly known that multilateral environmental agreements, adopted in the period from 1945 to 1989, targeted building coherence among countries as the first step towards strengthening environmental management in diverse areas, including freshwater and land resource management; the conservation and sustainable use of biodiversity; and marine and coastal ecosystem management (UNEP, 1999). These conventions are concerned mainly with the nature component of the environment, and, therefore, have widespread support and receive a quick response from the international community. CITES, the Montreal Protocol, and the Basel Convention, among others, all have 170 or more parties. Meanwhile, the post-Cold War era is marked by cooperation in environmental monitoring and assessment of cleaner industrial production and eco-efficiency, which is closely linked with economic benefits, responsibilities, and obligations from member countries. As a result, some international environmental agreements established during the 1990s incorporate trade-related provisions as part of the range of measures designed to effectively address environmental challenges. The UN FCCC, Kyoto Protocol, PIC, and POPs are some examples of agreements that emphasize the trade-related aspects of the environmental issue. Therefore, from the perspective of the country, the decision to ratify these conventions takes into account consideration of trade policies. It makes some governments, which are fearful of strict environmental obligations, unwilling to commit to the conventions adopted in the third period. This explains why our analysis results for the 1990s period saw a marked drop in the leadership score of the G3 countries.
Throughout our empirical testing with multilateral convention data, it is evident that the G20 shows its leading role in global environmental issues. Among the top ten, the most active representatives from the G20 are Canada (3.25), the United States (3.14), Australia (2.38), United Kingdom (2.30), and Russia (2.23). Outside the G20, we find European countries such as Norway (4.18), Sweden (3.18), Denmark (2.57), and Finland (2.18) have taken a leading role. The post-1989 period has seen a rise in commitment from new active players in the environmental regimes such as the Maldives, Germany, Czech Republic, Fiji, and Slovakia among others.
Changes of GLW top ten countries in environment domain
Intellectual property
A similar scenario to that experienced on environmental issues unfolded in the domain of intellectual property. In the first period, the G3 and several other European leaders bore the leadership mantle for the establishment of basic protection mechanisms of intellectual works. The Berne Convention for copyright protection and Paris Convention for patents are the remarkable multilateral conventions governing intellectual property protection in the pre-World War II era. During this period, works are presented in the form of traditional mediums and unauthorized copying was done by other people, not machines.
Changes of GLW through three periods (Intellectual Property)
Later, in the twentieth century, we saw considerable advancement in the production technology of intellectual works. Initially, it appeared as analogue technology, such as phonograms, films, etc., and later in the 1980s, in the form of digital technologies that produce products such as CDs, DVDs, etc. All these technologies have spawned a boom in the media industry and boosted its development in the last few decades. This new situation necessitated a global legal framework for the regulation of technology, in addition to the regulation of human behavior. It leads to a striking change in the global environment for the protection of intellectual property (patents, copyrights, trademarks, trade secrets) rights.
In the period from 1945 to 1989, many conventions were created to extend the global reach of international property regulation, such as Universal Copyright Convention; Rome Convention for the Protection of Performers, Producers of Phonograms, and Broadcasting Organizations; Convention for the Protection of Producers of Phonograms against Unauthorized Duplication of Their Phonograms; and Patent Cooperation Treaty. The G3 and the G8 are still playing a leading role in the formation of international norms in this arena.
In particular, several trends that emerged in the 1970s and accelerated in the early 1980s began to weigh heavily on US policy-makers’ minds. TRIPS is the most typical example of a norm that has become an integral part of the identity of the United States in the global political economy. It is illustrated through our analysis by the impressive score of global leadership for the US in these periods.
But in the period after 1989, we saw a change. After the emergence of digital audio visual technologies, the copying of music and images becomes a great deal easier and far more accurate (we can even say identical). And along with this trend, protection of intellectual properties becomes more and more technically complicated. WIPO Millennium Treaty is another good example. It regulates conflicts between countries regarding contents production, media production, and consumers. Also in the TRIPS case, it represented the high water mark of ‘hard law’ for the commercial intellectual property agenda in a multilateral context, and the momentum of the TRIPS protests, particularly with respect to patents, has created a much more difficult political environment for industry (Sell, 2002). The strict legal enforcement may explain the overall decrease in the leadership index in the third period in this area.
Overall, United Kingdom (4.13), Germany (3.42), France (3.08), the United States (2.75), and Mexico (2.01) are countries among the G20 that show an active role in the intellectual property protection domain. Switzerland (3.53), Spain (3.37), and Sweden (2.29) also achieved a high score in this arena. The 1990s period marks a rise in leadership of Czech Republic, Japan, Slovakia, Hungary, Slovakia, and Romania who have also exercised outstanding scores in intellectual property rights.
Changes of GLW top ten countries in intellectual property domain
Overall assessment
Throughout these three time periods of world history, the overall picture is that although the G3 and the G8 keep their distinct positions through the first two periods, they fall to the range of, and share the same behavior as, other groups. The G3 and the G8 members become like many other players in the world, that is, they lose their leadership role. All countries have converged to the same point where no one takes the lead in international cooperation. That proves what the political authors claimed about the cooperation without hegemony paradigm – that no country exercises global hegemonic leadership.
Changes of GLW through three periods (Overall Assessment)
We next tried to count how many regime categories countries achieved a z-score of more than 2 (e.g. they are global leaders) over the three periods examined of world history. The results show that among the G20, the United Kingdom, and Mexico have been leading the world in five different regime categories (their z-scores in these five categories are more than 2). Needless to say, both the United Kingdom and Mexico are arguably under the strong shadow of the United States, if only because of their historically special relationships. The United States and France have exercised global leadership in three domains. Other G20 countries, Australia, Canada, and Russia, have taken leadership initiative in two domains. The most active country of the world is, however, from outside the G20, Sweden, who has achieved superlatively in all six global arenas. We also have strong international regime commitment from other countries: Norway (four domains), Spain (three domains), Denmark (three domains), Austria (two domains), Bulgaria (two domains), Finland (two domains), and Hungary (two domains). In total, 15 countries are found to be leaders in the formation process of at least two categories of international regimes. Another 12 countries have taken a leading position in one regime domain, they are Belgium, Costa Rica, Cuba, Egypt, Germany, India, Italy, Luxembourg, Mongolia, Netherlands, Philippines, and Switzerland.
We then narrow down the scope by doing the same task for only the multilateral conventions created during the period after the critical year of 1989. The purpose is to observe the change in leadership behavior from states in the years after the Cold War. Surprisingly, we found that only just seven countries achieved a z-score of more than 2 in more than two domains. Among them, new faces in leadership come from Slovakia (four domains), Czech Republic (three domains), and Fiji (two domains). Others to appear again are Mexico (three domains), Sweden (three domains), Norway (two domains), and Spain (two domains). Yet the best player achieved outstanding in only four categories of regimes as compared with the six in the case of Sweden when the three periods are considered. Many G20 members dropped to the group of countries who perform well in only one domain of global norms; they are Argentina, Australia, Canada, Germany, Japan, and the United States. Other states outside of the G20 who also belong in this group are Austria, Botswana, Finland, Egypt, Hungary, Ireland, the Maldives, Mauritius, Panama, Portugal, Romania, and Uzbekistan.
As can be seen clearly, the world has had no consistent leadership throughout the time examined. Established powers for many reasons, in many domains, lack the political will to continue as the role of primary global leadership. Moreover, other emerging countries have appeared and marked their position in world politics. These countries have become much more important economically or politically on the global scene, thus they are much less prepared to follow others. Today, ‘no single country has the political and economic muscle to impose and enforce rules to drive a global agenda’ (Bremmer, Reference Bremmer2012: 68).
From another view corner, we rank the top ten states having the highest Global Leadership Willingness metric (Table 10). Although the ranking list shows that many newcomers are playing the most active roles in the global norm system, it also serves to illustrate that the trend in leadership has faltered among the G3, G8, and G20 through the three periods of world politics.
Changes in overall GLW top ten countries and the G3, G8, G20
To sum up, through the current research the extent of the shift towards cooperation without hegemony paradigm is much more apparent. What we depict about the leaderless era is strongly coherent with what many political scientists have argued about the current world situation. Our analysis of multilateral conventions data has produced positive empirical testing results for the phenomenon of cooperation without hegemony in the world politics.
6. Conclusion
The study has empirically tested and found support for the idea of cooperation without hegemony. This is the preposition about a new world order where no power or group of powers can sustainably set an international agenda. We have constructed a quantitative metric to measure states’ actions in global regimes to evaluate their willingness to take a leadership position in international cooperation for solving shared global issues. Our findings show the current political situation in the world is not led by the G7, G8, or G20. This is a leaderless world. Moreover, our analysis results describe a striking perspective on world politics and provide evidence to argue that our current world is actually without consistent global leadership. By comparing the leadership score for key global players through different stages of world history and in different policy domains, we can identify the divergence in powers that are bound to shape twentieth-first century world politics.
About the authors
Lien Thi Quynh Le - is a Ph.D student at Nagaoka University of Technology, Japan. From this university, she received a Master degree in Management and Information Systems in 2012 with a research of game theory applications to public policy decision making. Her current research focuses on the quantitative methods for the analysis of global governance of science and technology. She is also interested in the network analysis perspective for the understanding of structure and relations between individuals, social institutions or international organizations.
Yoshiki Mikami is professor and vice president for international affairs, Nagaoka University of Technology (NUT), Japan. Until joining to NUT in 1997, he had served for the Ministry of International Trade and Industry (METI) for twenty two years and had held senior positions in trade administration and technology policy sections. He got Ph.D from Graduate School of Media and Governance, Keio University. He has published books and articles mainly in the field of science and technology history and information science, amongst which are The History of Japanese Computers (Ohmsha, 2010), Scientists of India (Iwanami, 2009), A History of character Codes in Asia (Kyoritsu, 2003). He is chief editor of the Journal of Japan MOT (Management of Technology) Society. He also serves as a chairman of ISO/IEC standardization committee for character code.
Takashi Inoguchi is Professor Emeritus of the University of Tokyo and President of the University of Niigata Prefecture. He specializes in Japanese politics, comparative political behavior, and international relations. He has published numerous books and articles, amongst which are American Democracy Promotion (Oxford University Press, 2000), Reinventing the Alliance (Palgrave Macmillan, Reference MacMillan2003), Japanese Politics: An Introduction (Trans Pacific Press, 2005), Political Cultures in Asia and Europe (Routledge, 2006), The Uses of Institutions (Palgrave Macmillan, 2007), Citizens and the State (Routledge, 2008), Globalisation, Public Opinion and the State (Routledge, 2008), The Quality of Life in Confucian Asia (Springer, 2010), Japanese Politics Today (Palgrave Macmillan, 2011), The US−Japan Security Alliance (Palgrave Macmillan, 2011), Quality of Life in Asia (Springer, 2012), Political Parties and Democracy – Contemporary Western Europe and Asia (Palgrave Macmillan, 2013), and The Troubled Triangle: Economic and Security concerns for the United States, Japan and China (Palgrave Macmillan, 2013). He is Executive Editor of the Japanese Journal of Political Science (Cambridge University Press) and Director of the AsiaBarometer project.
List of multilateral conventions covered by the study
Appendix 2: Hexagonal graphs of selected countries
Figure A1.
Figure A2.
Figure A3.
Figure A4.
Figure A5.
Figure A6.
Figure A7.
Figure A8.
Figure A9.
Figure A10.
Figure A11.
Figure A12.
Figure A13.
Figure A14.
Figure A15.
Figure A16.
Figure A17.
Figure A18.
Figure A19.
Figure A20.
Figure A21.
Figure A22.
Figure A23.
Figure A24.