INTRODUCTION
Arid and semi-arid (ASALs) parts of Eastern Kenya continue to experience high atmospheric heat, prolonged dry-spells/droughts, declining soil fertility and erratic rainfall patterns with large and growing population segments. These have in part occasioned continued declines in agricultural productivity with yields at less than 1 Mg ha−1 while the potential is estimated at 6–8 Mg ha−1 (Macharia, Reference Macharia2012; Mugwe et al., Reference Mugwe, Mugendi, Mucheru-Muna, Merckx, Chianu and Vanlauwe2006). Local farmers employ assorted in-situ management strategies to increase overall yield production. Common strategies include the use of inorganic and organic fertilizers, mulching among others (Bationo et al., Reference Bationo, Mokwunye, Vlek, Koala and Shapiro2003; Mucheru-Muna et al., Reference Mucheru-Muna, Pypers, Mugendi, Kung’u, Mugwe, Merck and Vanlauwe2009). However, the farmers’ rationale and attitude towards adoption of such strategies are influenced by the availability of the technology. Besides, access to information on quantities and guidelines on how such technologies ought to be implemented under varying agro-climatic conditions influence adoption (Akponikpè et al., Reference Akponikpè, Michels and Bielders2008; Bationo et al., Reference Bationo, Buerkert, Sedogo, Christianson and Mokwunye1995; Mureithi et al., Reference Mureithi, Taylor and Thorpe1995). ISFM and soil–water conservation (SWC) technologies have been developed and tested with standardized application procedures and rates for the region (Bationo et al., Reference Bationo, Buerkert, Sedogo, Christianson and Mokwunye1995; Micheni et al., Reference Micheni, Kihanda, Warren and Probert2004; Mucheru-Muna et al., Reference Mucheru-Muna, Pypers, Mugendi, Kung’u, Mugwe, Merck and Vanlauwe2009; Mugwe et al., Reference Mugwe, Mugendi, Mucheru-Muna, Merckx, Chianu and Vanlauwe2006 Ngetich, Reference Ngetich2012). Despite their significant impacts, field experiments are quite expensive. Experimentation often allows for a few fertility management options to be tested. The trials are also limited to few sites and years and, thus cannot adequately capture the complex and highly non-linear soil–crop–climate relations. Experimental trials also do not report consistent results from year-to-year, site-to-site as well as amendment-to-amendment. Substantial literatures also argue that investing in the recommended N rates/sources pose high socio-economic risks to poor smallholder farmers due to persistent crop failures (Abdoulaye and Sanders, Reference Abdoulaye and Sanders2005; Shapiro and Sanders, Reference Shapiro and Sanders1998). Indeed, the aim to maximize yields is undisputable among smallholder farmers in ASALs. However, most of the farmers, aim at minimizing inter-seasonal yield variability, failure and production costs. This guarantees some minimum yield to meet subsistence family food requirements (Christianson et al., Reference Christianson, Bationo, Henao and Vlek1990; Shapiro and Sanders, Reference Shapiro and Sanders1998). This case is evident in the drier parts of Eastern Kenya.
Ample studies on optimizing agricultural production have been conducted drawing recommendations globally (Bationo and Buerkert, Reference Bationo and Buerkert2001; Bationo et al., Reference Bationo, Lompo and Koala1998; Lamers et al., Reference Lamers, Bruentrup and Buerkert1998; Sinaj et al., Reference Sinaj, Buerkert, El-Hajj, Bationo, Traoré and Frossard2001). However, adoption of such recommendations is quite low, due to weaknesses in extension service provision, incomplete exchange mechanisms between farmers and research-extension, as well as the complexity and heterogeneity of most agricultural production systems. Decision support systems (DSTs) such as properly calibrated and validated crop-growth simulation models can be used to complement shorter-term experiments. The DSTs will thus enhance adoption and decision making in heterogeneous production systems and processes (Akponikpè et al., Reference Akponikpè, Michels and Bielders2008). The APSIM is a dynamic crop-growth model inbuilt with assorted modules including maize-crop, soil and N modules. The model is capable of simulating both water and soil nutrient dynamics under varying agro-climatic conditions in tandem with prescribed scenarios (Akponikpè et al., Reference Akponikpè, Michels and Bielders2008; Keating et al., Reference Keating, Carberry, Hammer, Probert a, Robertson, Holzworth, Huth, Hargreaves, Meinke, Hochman, McLean, Verburg, Snow, Dimes, Silburn, Wang, Brown, Bristow, Asseng, Chapman, McCown, Freebairn and Smith2003). APSIM has been successfully parameterized and tested based on field data from experimental stations under varying growing conditions, covering a range of plant densities, photoperiods and genotypes across the globe (Keating et al., Reference Keating, Carberry, Hammer, Probert a, Robertson, Holzworth, Huth, Hargreaves, Meinke, Hochman, McLean, Verburg, Snow, Dimes, Silburn, Wang, Brown, Bristow, Asseng, Chapman, McCown, Freebairn and Smith2003). APSIM application in the central highlands of Kenya remains limited yet its utilization may aid in enhancing agricultural productivity in the region. For all these reasons and need for increased replication of experimental trials, APSIM is highly suitable for modelling long-term N management and maize productivity. This study therefore sought to calibrate and validate the APSIM model in line with maize production system under selected soil fertility (in this case nitrogen N) amendments (Manure, Lantana camara, Mucuna pruriens, Tithonia diversifolia and inorganic fertilizers). The model was subsequently used to simulate long-term maize response to N management in the otherwise heterogeneous maize production system of the drier parts of Kenya's central highlands. These objectives were envisaged to guide on better-adapted recommendations to smallholder in the region.
MATERIALS AND METHODS
The study area
The study was conducted in the drier parts of Eastern Kenya, in Mbeere South sub-county, (of Embu County) in the larger central highlands of Kenya. This region lies in the lower midland (LM) 3, 4 and 5, upper midland (UM) 1,2,3 and 4 and inner lowland (IL) 5 (Jaetzold et al., Reference Jaetzold, Schmidt, Hornet and Shisanya2007) at an altitude of approximately 500 m to 1200 m above sea level (a.s.l). The region experiences annual mean temperature and rainfall range of 21.7–22.5 °C and 700–900 mm, respectively. It has a population density of 82 persons per km2 with an average farm size less than 5.0 ha per household. Rainfall is bimodal with long rains (LR) from mid-March to June and short rains (SR) from late October to December hence two annual cropping seasons. The soils are predominantly Ferralsols and Acrisols (Jaetzold et al., Reference Jaetzold, Schmidt, Hornet and Shisanya2007). Mbeere sub-county continues to experience population pressure occasioned by the influx of immigrants from nearby over-populated high potential areas such as Embu. Various agricultural-based studies have been carried out in the region hence the rationale for selecting the study area. The region continues to experience drastic declines in its productivity potential rendering its populace resource poor (Mugwe et al., Reference Mugwe, Mugendi, Mucheru-Muna, Merckx, Chianu and Vanlauwe2006). Nonetheless, there is a secure tenure system on land ownership but underscore in food productivity. This region is a strategic production region, producing about 10% of the country's maize cover (Ngetich et al., Reference Ngetich2012). The inherently lower and erratic rainfall, less fertile, shallow and sandy Ferralsols, and high drought frequency explain predominant crop failures in the region (Jaetzold et al., Reference Jaetzold, Schmidt, Hornet and Shisanya2007). The predominant cropping system is maize intercropped with beans though livestock keeping is equally dominant. These areas represent Kenya's central highlands and those of East Africa, predominant of smallholder rain-fed, non-mechanized agriculture and diminutive use of external inputs.
Experimentation
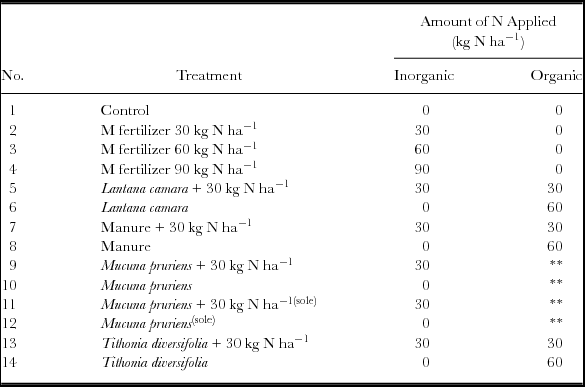
In most SSA countries, including Kenya, use of fertilizer among smallholder farmers is quite low. Low fertilizer use among smallholder farmers is often attributed to high costs of inorganic fertilizers and eventual production risks due to high rainfall variability. The low fertilizer use translates to low per capita agricultural productivity. Experimental trials were conducted for six seasons; from SR2009 to LR2012 at an experimental site in Machang’a Secondary School. This experimentation evaluated the potentials of locally available organic fertility amendments in redressing such challenges. The experimental setup followed a randomized complete block design with the treatments shown in Table 1; replicated thrice.
Fertility amendments and their N and P quantities incorporated into the soil during trial experimentation; for the period between SR2009 to LR2012 cropping seasons.

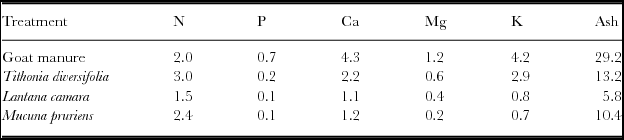
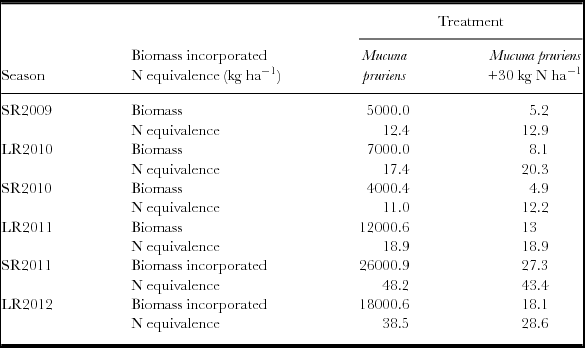
The organic materials (Tithonia diversifolia and Calliandra calothyrsus) were harvested from nearby biomass transfer plots that were established for that purpose. A sample of each organic input was taken, and N content determined (Table 2). The amount of organics to be applied, equivalent to 30 or 60 kg N ha−1 (henceforth referred to as 30N or 60N respectively in this article) was then determined. In this regards, in treatments with sole organic applications, an amount equivalent to 60N was used as the test-amendment. On the other hand, in treatments with N integration, an amount equivalent to 30N was applied. Half rate (30N) organic fertility amendments were then complemented with 30N of mineral fertilizer spot applied as NPK 23:23:0 leading to the recommended full rate of 60N. Application of NPK 23:23:0 also supplied 30 kg P ha−1 (30P). In addition, 60 kg P ha−1 (60P) of phosphorous was applied as Triple Super Phosphate (TSP) to supply a total P of 90 kg P ha−1 (90P) to minimize the possibility of its confounding effects. This study premised that nitrogen was the only macronutrient limiting maize yields. Treatment with Mucuna pruriens adopted a mirror-rotation design. In this system, plots previously grown with sole Mucuna pruriens, the organic was harvested and the residue weighed, N determined and was incorporated into the soil prior to maize planting. The weights of Mucuna pruriens biomass applied from the SR2009 to LR2012 seasons are presented in Table 3. Experiments were conducted on plots, each measuring 6 m by 4.5 m with maize (Zea mays L, DH04 variety) as the test-crop. Three maize seeds per hill were planted with a spacing of 0.9 m by 0.6 m between the plant and within the rows, respectively. Two weeks after germination, thinning was done to two maize seedlings per hill to ensure the recommended plant population density of 37,037 plants ha−1 for this study site (Ngetich, Reference Ngetich2012). Land preparation was done manually, and weeds were regularly controlled using a hand hoe depending on weed intensity and characteristics. Stem borers in maize were controlled by preventive spraying of Buldock™ pesticide (beta-cyfluthrin). No diseases were observed on the maize during the experimental period. Maize grain and stover were harvested at physiological maturity from a net area of 21 m2 (out of the total area of 27 m2). This net area was as a result of leaving out one row on each side of the plot and the first and last maize plants in each row to minimize the edge effect. Maize grains were dried and expressed in terms of dry matter content. After harvesting, all the maize stover was removed from the experimental plots. Removal of stover was to ensure that extra nutrients were not retained in the plots to confound the effects of adding an organic material of different quality into the experimental plots. Stover samples were oven dried at 70 °C for 72 h to determine moisture contents, which were used to correct field stover yields and express them as dry matter produced. Dry matter yields were extrapolated to a hectare basis using plant populations corrected for the emergence rate. Plant emergence rates were not affected by treatments. All other standard agronomic practices were followed for optimal productivity.
Average nutrient composition (%) of organic materials applied to the soil during the experimental period (SR2009 to LR2012 cropping seasons).

N = Nitrogen, P = Phosphorous, Ca = Calcium, Mg = Magnesium, K = Potassium, Source: Mucheru-Muna et al. (Reference Mucheru-Muna, Ngetich, Mugendi, Mugwe, Mairura, Vanlauwe, Jan Diels and Merckx2013).
Total biomass of Mucuna pruriens and N equivalent incorporated during the experimental period (SR2009 to LR2012 cropping seasons).

Variables collected
Site variables collected included; coordinates, soil texture and depth, slope length and elevation (general information). Climatic data used in APSIM calibration included daily maximum and minimum temperature, solar radiation and rainfall. Other variables used in the analyses were; maize phenology (crop type and cultivar, days to germination and flowering, days to maturity). Other variables used during modelling exercise were soil–water, (soil moisture contents per layer, at drained upper limit (DUL) and lower limit (LL), specified NO3-N quantities; both initial and those from fertility treatments, soil carbon per layer, total initial soil N of the top layer, soil bulk density (BD) per layer, P-extractable, P-sorption and available P for each layer, organic incorporations (including Lantana camara, Mucuna pruriens, Tithonia diversifolia and manure type under half and full rate application; (N of 30% and 60%) and resultant grain, stover and biomass yields. Finally, management operations such as; dates of all planting operations, sowing depth, plant density, type and amount of fertilizer, tillage (type, depth and fraction of above-ground materials incorporated) were collected.
APSIM model overview, parameterization and calibration
The APSIM model is a modular modelling framework (Keating et al., Reference Keating, Carberry, Hammer, Probert a, Robertson, Holzworth, Huth, Hargreaves, Meinke, Hochman, McLean, Verburg, Snow, Dimes, Silburn, Wang, Brown, Bristow, Asseng, Chapman, McCown, Freebairn and Smith2003). Five inbuilt modules namely; maize crop module (APSIM-Maize), soil water module (SoilWat), soil nitrogen module (Soiln), residue module (Residue) and the manure module (Manure) were used during this study. Input parameterization data are summarized in Table 4. These include climatic variables (daily minimum and maximum temperatures (°C), solar radiation (MJ m−2) and daily rainfall amount (mm) for a recorded period of 13 years (January 2001 to April 2013). Others were crop genetic parameters, soil chemical and water parameters as well as management (planting, organic matter or fertilizer type and application rates) options. Parameterization of LL water content at 15 bar metric pressure (ll15), BD, and organic carbon content (OC), initial NH4-H and NO3-N and pH was done using measurements obtained from the experiment and published sources (Table 4).
Soil physical and chemical model input parameters for Machang’a research site; Embu County (Source: Experiment).

A: BD = bulk density, LL15 = lower limit at 15 bar metric pressure, DUL = drained upper limit, SwCon = drainage coefficient LL = maize water lower limit, PAWc = plant available water, KL = rate of soil extraction and XF = root development factor.
B: OC = organic carbon content, Fbiom = non-inert fraction of carbon in microbial products, Finert = inert fraction of organic carbon, InertC = inert carbon, BiomC = carbon from microbial products, HumC = humic carbon.
C: EC = electrical conductivity, CEC = cation exchange capacity, Ca = calcium, Mg = copper, K = Potassium, Na = sodium, ESP = exchangeable sodium percentage.
APSIM model evaluation and validation
Model evaluation and validation entailed examination and comparison of measured versus simulated parameter values based on all treatments and six growing seasons’ data from the experiment. Simulated crop parameters were grain yield, total above-ground biomass and LAI as influenced by nitrogen (sources and rates) and soil water, in selected treatments and growing seasons.
Observed values for maize LAI were based on a previous study in the incumbent study area on the influence of rainfall and nitrogen on maize LAI (Mburu and Kamoni, Reference Mburu and Kamoni2003). Since the selected model parameters had to be adjusted or programmed on the basis of the field experimental trials, evaluation of the model performance would be considered a true calibration. Both statistical and graphical techniques were used during model calibration and validation. Statistical analyses were based on goodness of fit between observed and simulated derived values from residual errors. The statistics used were root mean square error (RMSE) (Equation (1)), the square of the coefficient of determination (R2; whose range is; 0≤R2≤ 1) (Equation (2)), model efficiency (EF; which is ≤1) (Equation (3)) and prediction error (Pe ) (Equation (4)).
 $$\begin{equation}
{\rm RMSE} = \sqrt {\frac{1}{n}\sum\nolimits_{i = 1}^n {\left( {S_i - O_i } \right)^2 } }\end{equation}
$$
 $$\begin{equation}
R^2 = \frac{{\left[ {\frac{1}{n}\sum\nolimits_{n = 1}^i {\left( {O_i - O^ - } \right)\left( {S_i - S^ - } \right)} } \right]^2 }}{{\sum\nolimits_{i = 1}^n {\left( {O_i - O^ - } \right)^2 \sum\nolimits_{i = 1}^n {\left( {S_i - S^ - } \right)^2 } } }}\end{equation}
$$
 $$\begin{equation}
EF = 1 - \frac{{\sum\nolimits_{i = 1}^n {\left( {O_i - S_i ^ - } \right)^2 } }}{{\sum\nolimits_{i = 1}^n {\left( {O_i - O^ - } \right)^2 } }}\end{equation}
$$
 $$\begin{equation}
Pe = \frac{{\left( {Si - Oi} \right)}}{{Oi}} \times 100\end{equation}
$$
Where; Si and Oi are the simulated and observed or measured values of considered parameters i.e. grain yield and total above-ground biomass. The S− and O − variables are the respective means of these values, and n is the number of observations.
Co-efficient of Variance (Co-efficient of Variation) statistics was used to test the level of mean variations in seasonal rainfall, number of rainy days (RD) and rainfall amounts (RA). The independent t-test statistic was used to evaluate the significance of variation.
Long-term factorial experiment simulation
The calibrated and validated APSIM model was used in long-term simulations. The simulations were based on 2×2×3 factorial numerical designs combining N from different organic and inorganic sources at 0, 20, 40, 60 and 80 kg N ha−1 (0N, 20N, 40N, 60N and 80N) and mulch (at 0, 1, 3, 5, 6, 8 and 10 Mg ha−1) using maize stover. The stover root CN ratio was set at 40 while that of soil at 10. Calibration of DH04 maize cultivar utilized existing APSIM-Maize cultivar descriptions based on simulation of the crop phenological duration and yield production of the recommended cultivars (Pioneer_3537 = 110) for the study region. This cultivar description was found to simulate adequately the DH04 phenological duration (105–110 days) and yields (grain and stover) under similar treatments in the study area. Residue from different sources was incorporated during planting time, when tillage was set at ‘an event; sowing’, to user_defined depth of 30 cm incorporating surface residue at fraction 1 (all residue).
The bare soil runoff curve number (cn2_bare) was set to 75. The CN of 75 was to account for the relatively high runoff (crusting increasing susceptibility to erosion), gentle sloppy topography and high infiltration rates due to the Cambisols and Ferralsols soils in the experimental site. Other management practices included: fraction of maximum available water set at 25% filled from the top (often case of rain-fed agriculture in the area), diffusivity coefficient at 88 and diffusivity slope at 35 and soil albedo at 0.13. Inter-row and intra-hill spacing were set as those during field experimentation. Initial soil chemical parameters were not reset during the simulation period. During each simulation year, maize sowing was allowed when a total rainfall exceeding 20 mm occurred over five consecutive days between 15th March and 1st April (LRs) and then between 1st October and 1st November (SRs). This allowed for a flexible and open window for sowing as practised among farmers. However, accumulation of only 10 mm of rainfall was required to initiate sowing between 25th March and 20th April (LRs) and between 1st and 20th October (SRs); typical planting dates among most farmers in the region. Crop permanent wilting, possibly occasioning re-sowing, was reached when the simulated crop water deficit factor dropped under 0.5 for 15 consecutive days. Re-sowing of maize in case of crop failure is frequently practiced by farmers in the study area thus was allowed during simulation. Commonly, farmers would re-sow four days to about two weeks after germination. However, no sowing or re-sowing was allowed after 30th May (LRs) and 30th November (SRs) since the subsequent growing season's days would inevitably be too short with predominant dry-spells. Total amount (depending on simulation level) of manure or residue, and N/P fertilizer was applied at sowing, during every season and incorporated into the soil with user_defined tillage operations as specified above. Plant density was set to 37,037 plants ha−1. Total amount (depending on simulation level) of manure or residue, as well as inorganic N fertilizer, was applied at planting time every season. It is common practice among households in the study area to remove dry matter from the fields after harvesting. Thus, the model was set to remove biomass after harvesting. Simulations were run for a period of 12 years (2001–2013) using daily agro-climatic data (rainfall, minimum and maximum temperature, solar radiation, relative humidity) of Machang’a site. The rainfall variability during this period is also presented in the results.
Rainfall distribution, temperature and solar radiation
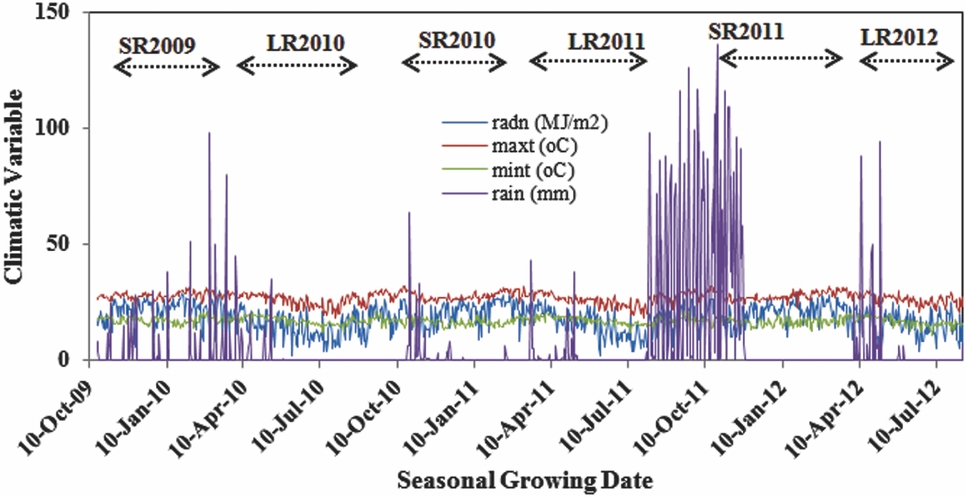
Total seasonal rainfall amount during both SR and LR growing seasons ranged from 90.8 mm to 580 mm (LR2011 and SR2011, respectively). Minimum temperature (mint) ranged from 14 °C–18 °C while max temperature (maxt) varied from 22 °C–29 °C. On average, both seasons recorded a daily maximum solar radiation averaging 24 MJ m−2; ranging from a minimum of 6–27 MJ m−2 (Figure 1).
Daily rainfall, solar radiation, minimum (mint) and maximum (maxt) temperatures of Machang’a (Embu County) during experimentation for the period between SR2009 to LR2012 KEY: radn = radiation, maxt/mint = maximum/minimum temperature.

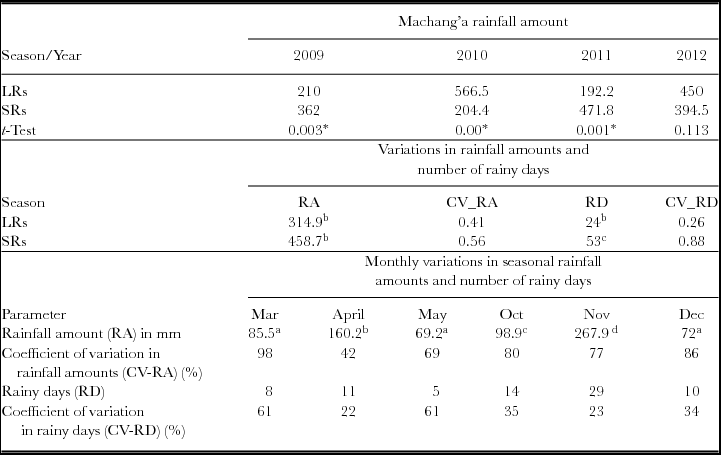
Results on variability in RA and number of RD during the experimentation seasons/months and the model calibration period are summarized in Table 5. Results showed that the total amount of rainfall received was below 900 mm yet LRs contributed 314.9 mm while SRs contributed 438.7 (Table 5). This rainfall amount translates to a total of 754 mm of seasonal rainfall (Table 5). A total of 754 mm of seasonal rainfall account for close to 90% of total rainfall received annually; implying that smaller proportions of RD supplied much of the total amounts of rainfall received in the region.
Variability analyses: coefficient of variations in seasonal rainfall amounts and number of rainy days and seasonal months in the study station during the simulation and experimental period (2009 and 2013).

Values connected with the same superscript letters in the RA column and row denote no significant difference at 0.05 level of significance between the seasonal rainfall amount mean values.
Notably, coefficient of variation in rainfall amounts (CV-RA) was quite high during the months of March (CV-RA = 0.98) and December (CV-RA = 0.86). It has been shown that a Coefficient of Variation (CV) greater than 30% in rainfall data series indicate massive variability in RA and distributional patterns (Araya and Stroosnijder, Reference Araya and Stroosnijder2011). High variability in rainfall amount rendered it relevant to test and validate the performance of the APSIM model in order to utilize it in evaluating long-term maize response to fertility management options in the study area.
RESULTS AND DISCUSSION
APSIM model evaluation
Simulation of the maize leaf area index (LAI)
Performance of the APSIM model in simulation of the maize LAI relied on secondary data. Development of LAI in response to APSIM simulations was a representative of field documented values (between 0.2 and 2.9 m2 m−2) in all treatments and across the test cropping seasons.
These LAI values are typical of maize varieties in dry-land areas under rain-fed production (Mburu and Kamoni, Reference Mburu and Kamoni2003).
Mburu and Kamoni (Reference Mburu and Kamoni2003), observed maize LAI of 1.5 m2 m−2 and 0.57 m2 m−2 for a season that received 350 and 143 mm of rainfall, respectively. These observations were made while studying the influence of rainfall and nitrogen on LAI in the ASALs of Eastern Kenya. These values were also observed during SR2009 simulations by the incumbent study. SR2009 season recorded the highest LAI value (1.5 m2 m−2) while SR2011 simulated the least LAI value (0.6 m2 m−2). The later season (LR2011) had recorded the least seasonal rainfall amount during the experimentation. According to Sprague and Dudley (Reference Sprague and Dudley1988) and Mburu and Kamoni (Reference Mburu and Kamoni2003), seasons with less than 143 mm rainfall experience water stress during establishment and flowering phases (50 days after sowing: DAS), respectively. These findings corroborate the results of the LAI value (0.6 m2 m−2) at 50DAS simulated during LR2011 season. The influence of nitrogen on maize LAI development was also adequately predicted. Full rate N (e.g. 60N manure and 60N inorganic) recorded high simulated maize LAI values (1.5 m2 m−2) at 50 DAS compared to control treatment (0N) (Figure 2). These are values also documented through other experimental trials (Adamtey et al., Reference Adamtey, Cofie, Ofosu-Budu, Ofosu-Anim, Laryea and Forster2010). Adamtey et al. (Reference Adamtey, Cofie, Ofosu-Budu, Ofosu-Anim, Laryea and Forster2010) observed mean maize LAI values in 60N and 0N treatments under arid conditions to range from 0.37 and 2.47 m2 m−2 to 0.14 and 1.31 m2 m−2, at the establishment and flowering phases, respectively. Simulations showed that at the photosynthetic/flowering stage (from 40–50 DAS), LAI values increased steadily, which replicates the field vegetative stage; with high water requirements. Simulated results also showed that LAI values approached peak from 55 DAS towards 70 DAS; stage that reproduced characteristics of tasseling, silking and pollination during the field experimental period. According to Sprague and Dudley (Reference Sprague and Dudley1988), this stage has high water demands that lead to increase in LAI values (at 65DAS) and reaches maximum near tasseling (65 to 70DAS). On the other hand, the LR2011 growing season recorded total crop failure during experimentation. Anticipated low values (0.5 m2 m−2) of LAI during the same season (LR2011) at 40 DAS were satisfactorily predicted during the APSIM simulations.
Simulated seasonal maize LAI under all treatments combining manure, crop residue incorporations and mineral fertilizers (in A), and under selected fertility management rates, in control with 0N (B left), and in Manure (Man60N) and Inorganic Fertilizer (Fert60N) (B-right) during the experimental period (SR2009 to LR2012).

Simulation of total above-ground biomass
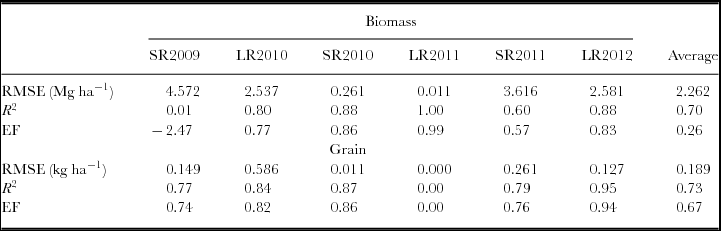
Simulation of grain yield and total above-ground biomass with APSIM recorded high best-fit relationships as summarized in Table 6. The RMSE of total above-ground biomass range was 0.011 Mg ha−1 (LR2011) and 4.572 Mg ha−1 (SR2009). The highest and the lowest R 2 values for biomass prediction during the experimentation seasons were 1.0 and 0.01 for LR 2011 and SR 2009, respectively. Model EF on biomass prediction ranged from −2.47 (SR2009) to 0.99 (LR2011). Grain prediction recorded slightly high EF values (0.74 in SR2009) and (0.99 in LR2011), as well as lower RMSE values (0.149 Mg ha−1 in SR2009 and 0.011 Mg ha−1 in LR 2010). R 2 values were equally higher in grain prediction (0.74 in SR2009) compared to R 2 values recorded under total above-ground biomass.
Root mean square error (RMSE), Coefficient of determination (R2) and modelling efficiency (EF) values of total above-ground biomass and grain yield as affected by combined application of manure, crop residue incorporations and mineral fertilizers during growing seasons from SR2009 to LR2012.

SR = short rain, LR = long rain, RMSE = root mean square error, R 2 = coefficient of determination and EF = modelling efficiency.
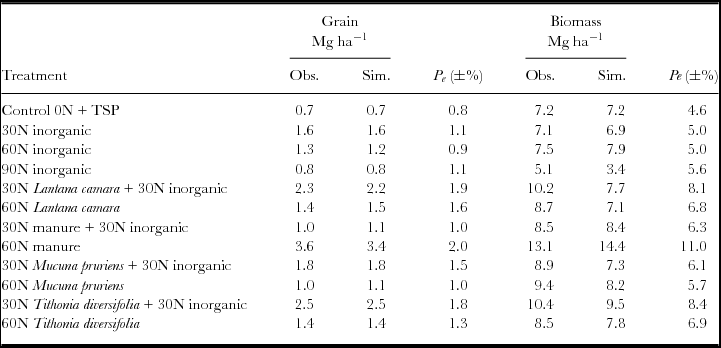
It was also observed that the maximum and minimum error of grain and biomass prediction (Pe ) using APSIM is 2% and 0.8%, and 11% and 4.6%, respectively. Probabilities of errors in prediction were high in biomass simulations (Table 7). The model prediction was however not affected by test treatments and rainfall variability.
Results on biomass and grain yield prediction error under organic and inorganic soil fertility amendments.

30N = 30 Kg N ha−1 and 60N = 60 Kg N ha−1, Obs. = observed, Sim. = simulated, Pe = predication error.
Values of mean residual and mean relative error close to zero indicate small differences between simulated and observed mean values. The small difference shows little systematic deviation or bias in the entire data set translating to high model prediction. Values of RMSE close to zero (LR2011 in Table 6) rather showed precision and reliability of the APSIM model simulations. High values of EF further showed that APSIM predictions adequately reproduced observed yield. Nonetheless, there was observably a negative EF value (−2.74 in biomass prediction of SR2009) indicating that the mean value observed would have been a better predictor than the model (Nash and Sutcliffe, Reference Nash and Sutcliffe1970). Relatively high values of R 2 (>72%) showed lower values of combined dispersions against single dispersions amid the observed and simulated series. The high R 2 values showed the high capacity of APSIM model to predict observed environments (yield) under different soil fertility amendments in the study area. Rainfall variability appeared not to affect APSIM-model performance significantly. In this regard, it can be deduced that simulated and measured data satisfactorily agreed rather well in all tested horizons during model calibration and validation for all seasons and test treatments. Diminutive variations in performance of the model could be ascribed to changes in seasonal RA and distribution. Overall, the model reproduced real and observed trends in maize grain yield in response to N rates. The model adequately reproduced complete crop failure of LR2011 as experienced during the field experimentation despite the better rainfall amount that was received in later months (from mid-May to August 2011). Thus, the model was accepted for use in subsequent scenario tests.
Long-term maize grain yield under varied N rates and sources
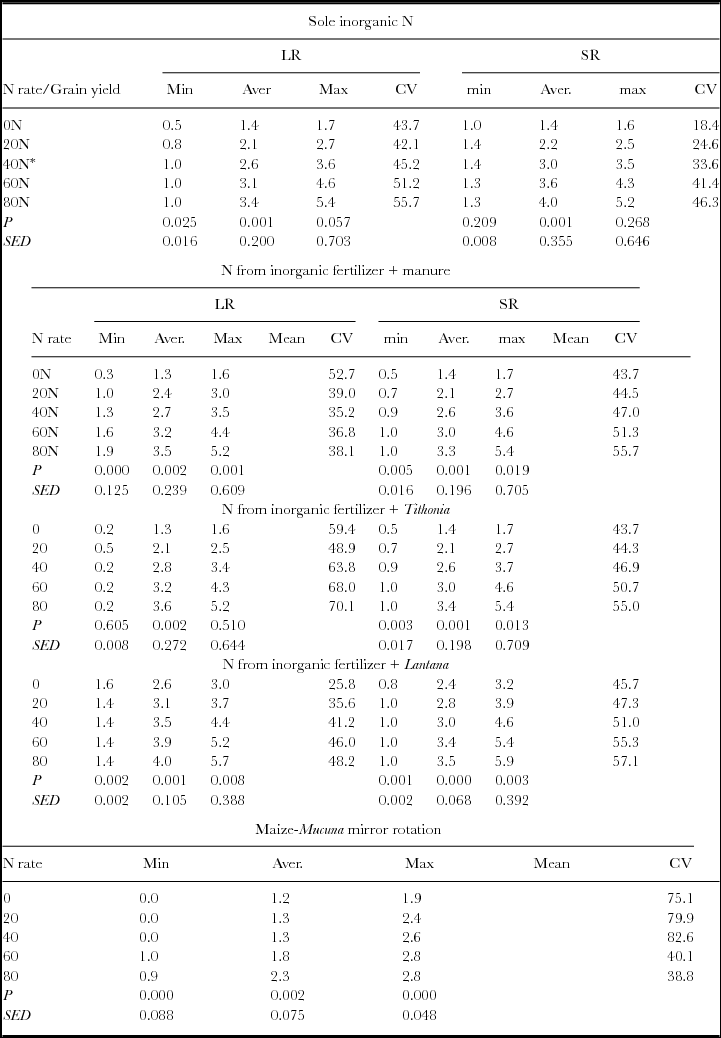
Parabolic trends in grain yields in response to integrated N amendments were observed during long-term factorial and numerical simulations. The N amendments included use of sole mineral (inorganic) fertilizers. Other amendments included combination of mineral fertilizer with organic residues as soil incorporations. The organic residues were manure (CN = 80), Lantana camara (CN = 25), Tithonia diversifolia (CN = 25) and Mucuna pruriens (CN = 25) (Table 8). Application sole inorganic N at 0N, 20N and 40N reported least inter-seasonal grain yield variations (CV = 43.7–45.2 during LRs and CV = 18.4–33.6 during SRs). Contrary, high inter-seasonal grain yield variations (CV = 51.2–55.7 during LRs and CV = 41.4–46.3 during SRs) were observed in applications of 60N and 80N (Table 8). In addition, it was observed that grain yield variations would be high during LRs (CV = 43.7–55.7) but less during SRs (CV = 18.4–46.3). Besides, application of sole inorganic N at 40N yielded relatively constant average grain (2.5 Mg ha−1) as compared to the other simulated N rates. The minimum harvestable grain was also observed to rise from 0.5 Mg ha−1(at 0N) to over 1 Mg ha−1 (at 40N) across most treatments (Table 8). Conversely, application of sole mineral N at 60N yielded consistently less average grain as compared to yields under integrated N applications (with manure, Lantana camara and Tithonia diversifolia) (Table 8).
Long-term simulations of maize grain yield (maximum, average and minimum) response to different N rates (0–80 kg N ha−1) supplied as sole inorganic/mineral N, combined organic (Manure/Tithonia/Lantana) and inorganic/mineral N and as combined organic (Mucuna) and inorganic/mineral N in a Mucuna-maize mirror-rotation system.

LRs = long rain seasons and SRs = short rain seasons, N = nitrogen, Min = minimum, Aver = average, Max = maximum, CV = coefficient of variation.
Sole mineral N at 40N could yield maximum grain of up to 2.9 Mg ha−1 compared to yield (3.4 Mg ha−1) under integrated N supplied as combined manure and mineral fertilizer (Table 8). Besides, sole N appeared not to guarantee better minimum yields (less than 0.6 Mg ha−1) compared to minimum yields (1.2 Mg ha−1) guaranteed under integrated N supplies through organic incorporations (Table 8). Combining mineral fertilizers with manure and either Tithonia diversifolia or Lantana camara at 40N had high grain yields (2.4 Mg ha−1 or 3.1 Mg ha−1, respectively) compared to those under sole N application. Application of N as combined manure plus mineral fertilizer at 40N guaranteed minimum yields across all seasons with lower variability (CV = 35.2). Same source application at 0N, 60N and 80N recorded high yield variability (CV = 52.7 for 0N, CV = 51.3 and 55.7 for 60N and 80N respectively) (Table 8). Maize grain yields under Maize-Mucuna pruriens mirror-rotation were low. In this system, 0N, 20N and 40N N rates reported high yield (1.2 Mg ha−1, 0.3 Mg ha−1 and 1.2 Mg ha−1) variability (CV = 75.1–82.6). The maximum harvestable grain yield under the low rates (0–40N) of N was found to be 2.6 Mg ha−1 (at 40N). Additionally, it appeared that application of 40N supplied through combined manure, mineral and Mucuna pruriens residue (through rotation) could occasion crop failure (with minimum grain yield < 0.1 Mg ha−1) (Table 8). However, application of 60N under the system showed better yields with guaranteed minimum harvestable yield of 1.2 Mg ha−1 and low yield variability (CV = 40.1) in the long-term (Table 8).
Economically, grain yield among poor households can thus be optimized and guaranteed by the use of combined manure and mineral fertilizer to supply N at 40N as a better option. According to Akponikpè et al. (Reference Akponikpè, Michels and Bielders2008), low N application rates (0N–15N) from manure and fertilizer recorded the least inter-annual variation in grain yield. Mupangwa et al. (Reference Mupangwa, Dimes, Walker and Twomlow2011) observed that the application of N at 15N increased long-term grain yields by 38% as compared to harvests under 0N. Combining manure and mineral fertilizer to supply 15N could guarantee a minimum and a maximum of 1.402 Mg ha−1 and 1.742 Mg ha−1 grain yield every year, respectively (McCarthy et al., Reference McCarthy, Canziani, Leary, Dokken and White2007). These observations agree with the findings of this study; when N is supplied through combined manure and mineral fertilizers but at higher rates of 40N. Indeed, long-term effects of manure on soils cannot be underestimated as exhibited in the results. When plant residues and manure are incorporated into the soils, they buffer soil acidification which is often caused by intensive use of inorganic fertilizers. Buffering soil acidification enhances fertilizer use efficiency (FUF) by combating P immobilization (Hafner et al., Reference Hafner, Bley, Bationo, Martin and Marschner1993). It has been reported that incorporating manure in the soils offers residual effects that last for two or more years thus stabilizing its productivity (De Rouw and Rajot, Reference De Rouw and Rajot2004; Schlecht et al., Reference Schlecht, Buerkert, Tielkes and Bationo2006). Studies by Buerkert and Lamers (Reference Buerkert and Lamers1999), Esse et al. (Reference Esse, Buerkert, Hiernaux and Assa2001) and Bielders et al. (Reference Bielders, Michels and Bationo2002) showed that short-term (2 years) and long-term (more than 5 years) application of organic residues (maize stover) significantly increased maize grain yield while their omission triggered immediate reduction in harvestable grain yield. Conversely, Yamoah et al. (Reference Yamoah, Bationo, Shapiro and Koala2002) reported that water use efficiency (WUE) could rise from 0.78 kg grain ha−1 mm−1 (control with no inputs) to 3.61 kg grain ha−1 mm−1 under application of maize residue combined with mineral fertilizer at 35 kg ha−1 in ASALs. Thus, use of manure and mineral fertilizers at economically viable rates reported in this study (40N) can significantly contribute to sustained maize production at the household level.
It was apparent that the use of this rotation system impacted appreciably on grain yield than in yield under the control system (with harvests < 500 kg ha−1). Various studies (such as Cobo et al., Reference Cobo, Barrios, Kass and Thomas2002; Ibewiro et al., Reference Ibewiro, Sanginga, Houngdandan, Vanlauwe, Okogun, Akobundu and Versteeg2000), have reported negative and positive effects of maize-Mucuna pruriens rotation on maize performance. Bonsu and Asibuo (Reference Bonsu and Asibuo2013) established that Mucuna pruriens residue decomposes rapidly losing more than 60% of dry weight within 28 days after incorporation, explaining high yields at 60 kg ha−1 N in this study. After this duration, Ibewiro et al. (Reference Ibewiro, Sanginga, Houngdandan, Vanlauwe, Okogun, Akobundu and Versteeg2000) reported that Mucuna pruriens releases up to 154 kg N ha−1 in an in-situ mulch systems accounting for more than 50% N that affects final yield. Cobo et al. (Reference Cobo, Barrios, Kass and Thomas2002) reported similar results that after 20 weeks, Mucuna pruriens leaves release high amounts of N and P (144.5 and 11.4 kg ha−1, respectively) in a rotation system. Nonetheless, high competition for nutrients amid corn and the legume requires supplementary N especially when maize sequentially follows the legume (Mucuna pruriens) in the rotation (Cobo et al., Reference Cobo, Barrios, Kass and Thomas2002). This could explain lower yields under this system when compared to other direct organic incorporation as reported above.
Probability of yield exceedance under different rates of N supplied from different sources
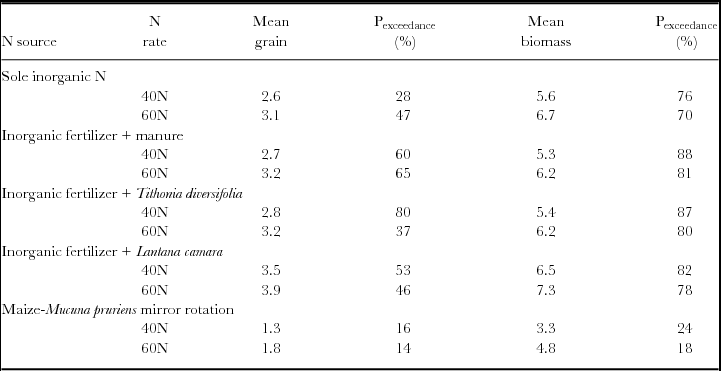
Results showed 90% probability that yields would exceed 1 Mg ha−1 in all treatments of 40N and 60N. Application 40N and 60N from sole inorganic fertilizers showed 76% and 70% probabilities of total maize biomass exceeding 5.6 Mg ha−1 and 6.7 Mg ha−1, respectively (Table 9). Combining mineral fertilizers with manure at to supply 40N and 60N reported higher probabilities (88% and 81%) of biomass yield (5.3 Mg ha−1 and 6.2 Mg ha−1, respectively) exceedance. Inorganic fertilizers plus Lantana camara or Tithonia diversifolia recorded better grain yields (2.8 Mg ha−1 and 3.5 Mg ha−1) but at varied probabilities of exceedance (80% and 53%), respectively. On the other hand, use of maize-Mucuna pruriens rotation appeared to yield more at 60N (4.8 Mg ha−1) than at 40N (3.3 Mg ha−1).
Probability of maize grain and total biomass yield exceedance in response to N (at 40 and 60 kg ha−1 N) supplied from different sources (sole inorganic N, inorganic fertilizer + manure, inorganic fertilizer + Tithonia diversifolia, inorganic fertilizer + Lantana camara and Mucuna pruriens residue incorporation into the soil in a mirror maize-Mucuna pruriens rotation system).

N = nitrogen, 60N = 60 kg ha−1 N and 40N = 40 kg ha−1 N., P exceedance (%) = probability of exceedance.
The probabilities of yields exceeding these tonnage quantities were however found to be very low (14–24%) compared to other treatments reported above. Incorporating 60N in this system yielded slightly high probabilities (24%) of yields exceeding 1.8 Mg ha−1 of grain yield and 4.8 Mg ha−1 of total biomass (18%).
High yields reported at 60N in this study could be ascribed to Mucuna pruriens residue attributes as a nitrogen-fixing legume. Bonsu and Asibuo (Reference Bonsu and Asibuo2013) established that Mucuna pruriens residue decomposes rapidly losing more than 60% of dry weight within 28 days after incorporation. After this duration, Ibewiro et al. (Reference Ibewiro, Sanginga, Houngdandan, Vanlauwe, Okogun, Akobundu and Versteeg2000) reported that Mucuna pruriens releases up to 154 kg N ha−1 in an in-situ mulch systems accounting for more than 50% N, which affects final yield. Cobo et al. (Reference Cobo, Barrios, Kass and Thomas2002) reported that after 20 weeks, Mucuna pruriens leaves release high amounts of N and P (1.445 and 0.114 Mg ha−1, respectively) in a rotation system. High competition for nutrients between corn and the legume thus require supplementary N especially when maize sequentially follows the legume (Mucuna pruriens) in the mirror rotation (Cobo et al., Reference Cobo, Barrios, Kass and Thomas2002). This could explain lower yields under this system when compared to other direct organic (manure, Lantana camara and Tithonia diversifolia) incorporation as reported above. Lower yields at 40N (1.2 Mg ha−1) compared to those at 60N (1.8 Mg ha−1) show that high return rates can be realized in this cropping system when N is applied at the rate of 60N.
Grain yield prospects under combined mineral and manure with mulch
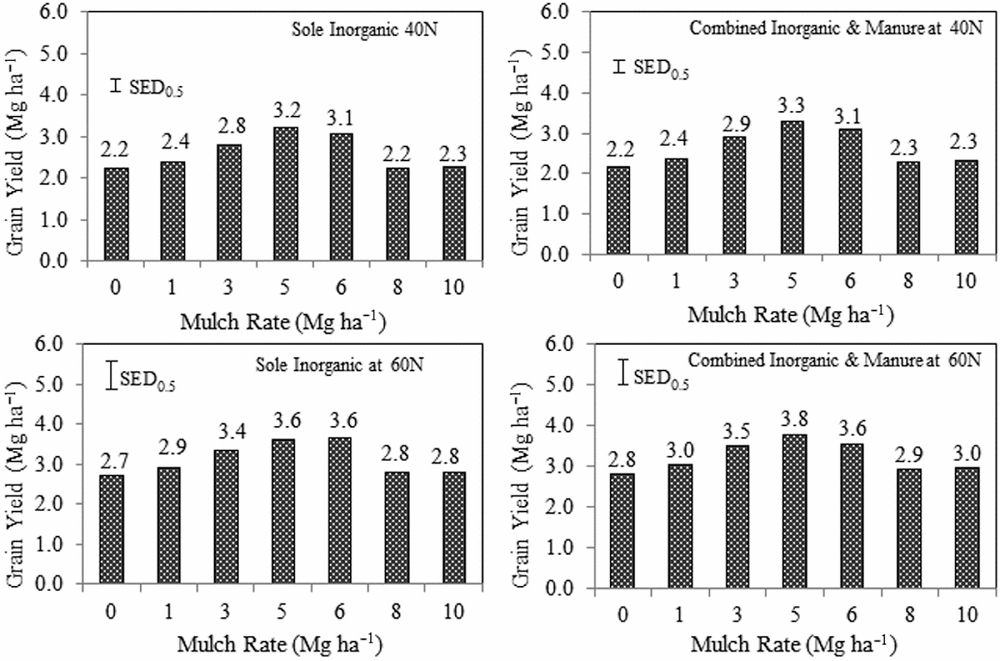
Maize grain yield responded variedly to the amount of mulch applied and N source and rate treatment.
Maize stover mulching at 5 and 6 Mg ha−1 recorded high grain yields (above 3 Mg ha−1) than mulching at 8 and 10 Mg ha−1 (Figure 3). These results are irrespective of N source and rate. High rates of mulch have been associated with N immobilization, explaining low long-term yields under such treatments.
Long-term maize grain yield response to different rates (40 and 60 kg ha−1 N) and sources (sole mineral fertilizer or when combined with manure) of N and different mulch rates (0–10 Mg ha−1) in Machang’a. The Error bars denote standard deviation of the means.

Simulations showed that use of combined manure and mineral fertilizer at 40N and 60 kg ha−1 N with mulch at 6 Mg ha−1 guaranteed long-term yields (3.5 Mg ha−1 to 4.0 Mg ha−1) harvested seasonally. Simulations further showed that seasonal yield variability increased with increase in N rate applied (CV values). These are results consistent with findings of Subbarao et al. (Reference Subbarao, Renard, Bationo, van Duivenbooden and Bielders1999) and Akponikpè et al. (Reference Akponikpè, Michels and Bielders2008) on millet productivity in the Sahel. Thus, combining inorganic fertilizers with manure to supply 40N and mulching at 5–6 Mg ha−1 guarantees over 3.5 Mg ha−1 of seasonal grain yield in the long-term. Beyond mulching at 8 Mg ha−1, yields remained lower, which could be attributed to N immobilization (Mupangwa et al., Reference Mupangwa, Twomlow and Walker2007).
CONCLUSION AND RECOMMENDATION
APSIM-model simulations adequately reproduced observed maize grain and total biomass in response to N rates. For instance, the model reproduced the complete crop failure of LR2011 as experienced during the field experimentation. Long-term simulations showed that application of low rates of N (0N, 20N and 40N) had low inter-seasonal variations in yields compared to the use of high N rates (60N and 80N). While the recommended 60N application yielded slightly more than 40N, variations in yield were found to be markedly high (CV = 56%). Additionally, minimum guaranteed yields at 60N were very low, despite its cost implications. There was 90% chance that maize grain yields would exceed 1 Mg ha−1 whenever N was supplied at 40N. Application of 40N by combining mineral fertilizer and manure increased chances (80%) of harvesting more than 2.5 Mg ha−1 of maize grain yield. There was 80% chance that grain yields would exceed 2.5 Mg ha−1 even during seasons with below average rainfall-cropping threshold. Use of Tithonia diversifolia and Lantana camara as organic incorporations had higher yields, but chances of having minimum yields during poor rainfall seasons were found to be very low. On the other hand, maize grain yields under Maize-Mucuna pruriens rotation was found to be consistently low (1 Mg ha−1 at 40 kg ha−1 N) whose chances of re-harvesting was similarly low. Use of mulch at a rate of 5 and 6 Mg ha−1 under combined mineral and manure at 40N increased harvestable grain yield to 3.5 Mg ha−1 (with less yield variability). These harvests substantially guarantee better yields for small-holder farmers. In subsistence maize farming systems, fertilizer recommendations should be geared towards yield stability and achievement of a minimum ‘guaranteed’ grain yield each year. Such recommendations underpin low-cost technologies that reduce production risks among small-holder farmers to improve food security. Thus, farmers faced with intermittent financial problems, should consider a low-cost application of N at 40N supplied through combined mineral fertilizer and locally available manure. This should then be complemented with full rate of P (90P) and mulch at 5 to 6 Mg ha−1. This application would guarantee minimum yield even during extreme dry seasons especially in the ASALs regions. However, there is need to evaluate and verify that the nutrient balance in the above recommended fertility and soil water management option remain positive, for the main nutrients such as N, P and K as well as influence on C:N levels.
Acknowledgement
This study was part of a research conducted through funding from the Regional Universities Forum for Capacity Building in Agriculture (RUFORUM), Call ID RU/CGC/GRG/15/10/109.