INTRODUCTION
The central East European plains are famous for their Epigravettian sites that date to around 15–12 14C ka BP (ca. 18.2–13.8 cal ka BP) and display impressive large structures made from the bones of woolly mammoth (Mammuthus primigenius; e.g., Gladkih et al., Reference Gladkih, Kornietz and Soffer1984; Soffer, Reference Soffer1985; Hoffecker, Reference Hoffecker2002). The origin of the large accumulations of mammoth remains is still a matter of debate, with the main hypotheses being the collection of natural occurrences versus active hunting (e.g., Soffer, Reference Soffer1985; Haynes Reference Haynes1989; Svoboda et al., Reference Svoboda, Péan and Wojtal2005). In favor of this second scenario, studies of the mammoth remains of Yudinovo (Germonpré et al., Reference Germonpré, Sablin, Khlopachev and Grigorieva2008) concluded that the mammoths were hunted and, at Mezhyrich, mammoths were obtained by combined procurement via collection of carcasses and active hunting (Péan, Reference Péan2015). Hunting practices were observed in older sites of the Gravettian culture in the Dnieper and Desna valleys (Demay et al., Reference Demay, Belyaeva, Kulakovksa, Patou-Mathis, Péan, Stupak, Vasil’ev, Otte and Noiret2016).
Between ca. 22 and 12 14C ka BP (ca. 26.2–13.8 ka cal BP), the Dnieper and Desna basins correspond to the southern part of the geographical distribution of the woolly mammoth (Markova et al., Reference Markova, Puzachenko, Van Kolfschoten, Van der Plicht and Ponomarev2013; Kahlke, Reference Kahlke2014). Over time their distribution shifted northwards, while the density of the mammoth population decreased (Markova et al., Reference Markova, Puzachenko, Van Kolfschoten, Van der Plicht and Ponomarev2013). According to Markova et al. (Reference Markova, Puzachenko, Van Kolfschoten, Van der Plicht and Ponomarev2013), the combined effect of gradual warming and growing human pressure is most likely to have had a negative impact on the mammoths, resulting in their local extinction in the Russian and Ukrainian plains around 14–12 14C ka BP (ca. 17.0–13.8 ka cal BP; Stuart et al., 2005).
Through investigating the diet and habitat of mammoth specimens collected by Epigravettian human groups, it may be possible to detect signals of ecological stress. For decades, stable isotopes have been applied as ecological trackers of animal species typical of the Upper Paleolithic ecosystem (review in Bocherens, Reference Bocherens2015). Studies considering carbon and nitrogen stable isotopes (δ13C and δ15N) in bone collagen have revealed a typical isotopic pattern reflecting niche partitioning among the herbivore and carnivore species of the so-called “mammoth steppe”. Typically, horse and mammoth were among the most 13C depleted of the herbivore species of the mammoth steppe ecosystems with a typically enriched 15N signature for the mammoth. The enrichment on average collagen δ15N values of the woolly mammoth compared with those of horse and reindeer ranges from ca. +3 to +6‰, which places the mammoth in a similar range to that of a carnivore such as the wolf (e.g., Bocherens et al., Reference Bocherens, Fizet, Mariotti, Gangloff and Burns1994; Iacumin et al., Reference Iacumin, Nikolaev and Ramigni2000; Fox-Dobbs et al., Reference Fox-Dobbs, Leonard and Koch2008; Szpak et al., Reference Szpak, Gröcke, Debruyne, MacPhee, Guthrie, Froese, Zazula, Patterson and Poinar2010). The cause of the 15N enrichment in mammoth collagen has been debated, with physiological adaptation to aridity and niche specificity being postulated (Bocherens et al., Reference Bocherens, Fizet, Mariotti, Gangloff and Burns1994; Bocherens, Reference Bocherens2003). The first of these hypotheses can be reasonably ruled out because (1) the effect of aridity has been demonstrated to impact directly on plants rather than animals, and should thus affect all the herbivores (e.g., Murphy and Bowman, Reference Murphy and Bowman2006; Hartman et al., Reference Hartman2011); (2) modern elephant, rhinoceros, and zebra fed with the same food in term of isotopic signature display the same enrichment (Kuitems et al., Reference Kuitems, van Kolfschoten and van der Plicht2015); and (3) the trophic position of the mammoth calculated from the δ15N values of glutamic acid (Glu) and phenylalanine (Phe) amino acids is equivalent to that of other herbivores (TP=2; Schwartz-Narbonne et al., Reference Schwartz-Narbonne, Longstaffe, Metcalfe and Zazula2015; Naito et al., Reference Naito, Chikaraishi, Drucker, Ohkouchi, Semal, Wißing and Bocherens2016). Hence, dietary specialization, such as the consumption of mature grasses in disturbed areas (Bocherens, Reference Bocherens2003), explains the specific isotopic position of the mammoth. As a result, a degradation of the habitat, when the species has no possibility to shift its distribution, should lead to a change in its isotopic signature.
The results of the isotopic analyses of the mammoths from Mezhyrich seem to confirm a scenario of a population subject to environmental stress and thus being especially vulnerable to human predation (Drucker et al., Reference Drucker, Bocherens and Péan2014). Indeed, these specimens have unusually low δ15N values making them equivalent to, or even lower in range of values than, the associated horses. A change in the environment may have led to the loss of the ecological niche specific to the mammoth and, thus, to the possible direct competition for forage between mammoths and horses. Interestingly, data published by Iacumin et al. (Reference Iacumin, Nikolaev and Ramigni2000) for the contemporaneous sites of Yudinovo and Eliseevichi, about 400 km north of Mezhyrich, yielded δ15N values on average higher than at Mezhyrich. However, the lack of comparable data on other animal species did not allow us to evaluate if the higher 15N content of the mammoth of Yudinovo and some of Eliseevichi specimens corresponds to those expected from a “classic” mammoth steppe isotopic pattern.
In this paper, we undertook a more complete analysis of samples from Yudinovo and Eliseevichi, including specimens from herbivore species other than mammoth and carnivores. Unpublished data from Buzhanka 2, that delivered a lithic industry comparable to that from the site of Mezhyrich, were also added. We aim to determine the extent to which the isotopic position, and thus ecological niche, of the mammoth specimens has shifted at Yudinovo and Eliseevichi, and how this compares to the results from Mezhyrich. In addition to a difference in diet, possible contrasts in mobility of the mammoths found in the mentioned sites is addressed by using bone collagen sulfur isotopes (δ34S) to explore how some individuals may have been able to maintain access to their specific niche.
MATERIAL AND METHODS
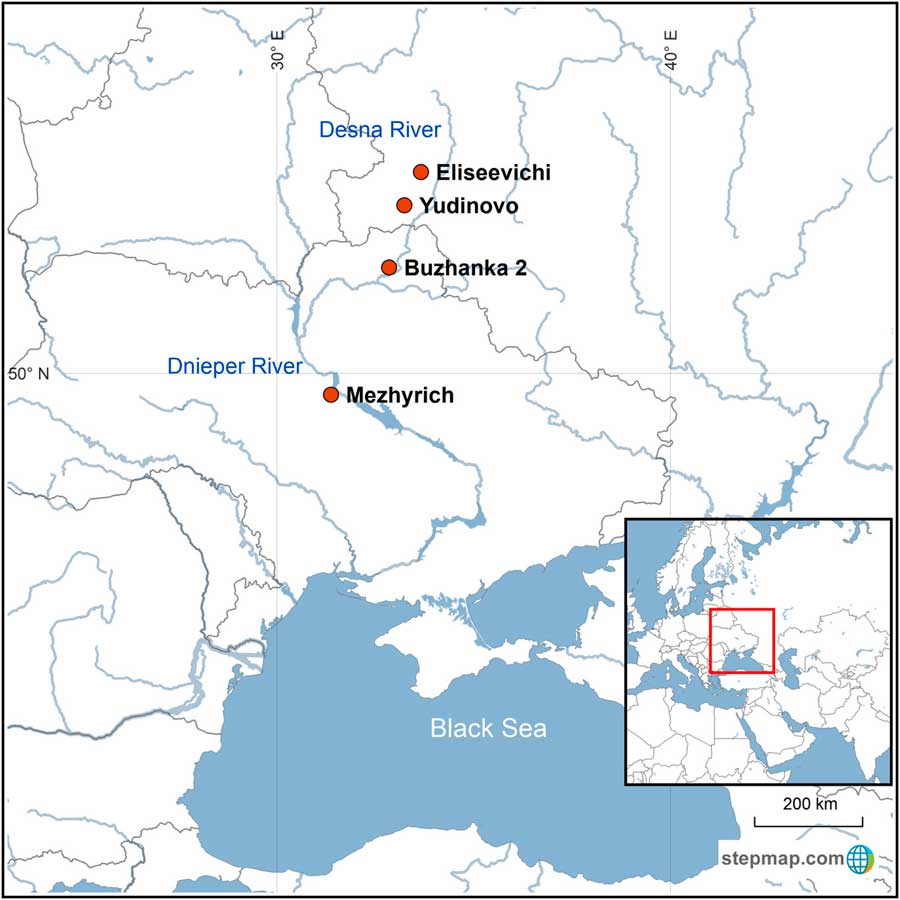
The Epigravettian Yudinovo site is located on the right bank of the Sudost’ River, a tributary of the Desna (Fig. 1), where several mammoth-bone complexes were discovered. In addition to the numerous mammoth bones, the site yielded huge quantities of ivory hunting tools and ivory ornaments. Several production areas were revealed: for flint processing, ivory processing, and polar-fox skinning and butchering (Khlopachev, Reference Khlopachev2006; Khlopachev et al., Reference Khlopachev, Grigorieva, Kulkova and Sablin2006). The faunal assemblage is dominated by remains from arctic fox (Alopex lagopus) and mammoth. The Yudinovo mammoths were hunted to obtain large quantities of bones, meat, fat, organs, and brain (Germonpré et al., Reference Germonpré, Sablin, Khlopachev and Grigorieva2008). The skeletal remains of the adult mammoths were used to build the complexes (Soffer, Reference Soffer1985; Germonpré et al., Reference Germonpré, Sablin, Khlopachev and Grigorieva2008; Germonpré and Sablin, Reference Germonpré and Sablin2017). A recent ancient DNA study produced new radiocarbon dates obtained on mammoth teeth from the site (Table 1 in Palkopoulou et al., Reference Palkopoulou, Dalén, Lister, Vartanyan, Sablin, Sher and Edmark2013).
(color online) Location of the sites considered in this study.

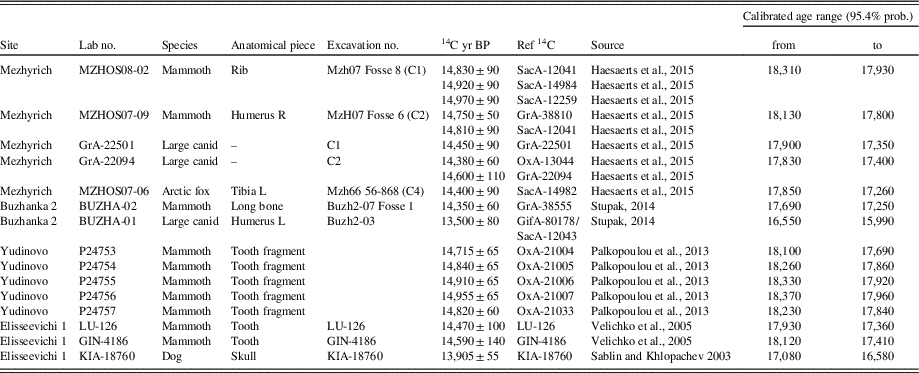
Selected direct radiocarbon ages of mammoth, wolf, and arctic fox specimens from Mezhyrich, Buzhanka 2, Yudinovo, and Eliseevichi. Calibrations were performed using OxCal 4.2.4 (Bronk Ramsey, 2001, 2009a, Reference Bronk Ramsey2009b). The radiocarbon ages are calibrated using the INTCAL09 dataset (Reimer et al., Reference Reimer, Baillie, Bard, Bayliss, Beck, Blackwell and Bronk Ramsey2009). For Eliseevichi, radiocarbon dates with strong outlying values, performed on burnt material, or with a standard deviation of 200 yr or more have been excluded (see Discussion).

The Epigravettian Eliseevichi site is located on the right bank of the Sudost’ River about 65 km northeast of Yudinovo (Fig. 1). The site is characterized by a specific lithic industry, including backed microliths and portable art. Remains of several pits with mammoth skulls and large quantities of worked ivory were discovered here. The faunal assemblage is dominated by remains of arctic fox, mammoth and large canids (Demay et al., Reference Demay, Patou-Mathis, Péan, Khlopachev and Sablin2017). Eliseevichi is also famous for the discovery of two complete skulls of Paleolithic dogs (Sablin and Khlopachev, 2002, Reference Sablin and Khlopachev2003). Radiocarbon dates on mammoth correspond to the Epigravettian period (Table 1).
The site of Mezhyrich is located 15 km west of the Dnieper River in central Ukraine (Fig. 1). This Epigravettian site provided four mammoth bone dwelling structures surrounded by several large pits (e.g., Kornietz et al., Reference Kornietz, Gladkikh, Velichko, Antonova, Gribchenko, Zelikson, Kurenkova, Khalcheva and Chepalyga1981; Soffer et al., Reference Soffer, Adovasio, Kornietz, Velichko, Gribchenko, Lenz and Suntsov1997; Pidoplichko, Reference Pidoplichko1998; Péan et al., Reference Péan, Nuzhnyi and Prat2015). The site has yielded more than 15,000 artifacts attributed to the Epigravettian made of flint, bone, mammoth ivory, and antler: tools, weapons, portable art, and body ornaments. Ongoing fieldwork has aimed to determine the function of the pits and activity areas in relation to the bone dwelling structures 1, 2, and 4 (Nuzhnyi, Reference Nuzhnyi2002, Reference Nuzhnyi2008; Péan et al., Reference Péan, Nuzhnyi and Prat2015, Shydlovskyi et al., Reference Shydlovskyi, Nuzhnyi, Péan and Lyzun2015). Mammoth is the most represented species through the remains of a minimum of 149 individuals, associated with hares (Lepus sp.) and carnivores (wolf, fox, and bear) and other herbivores (mainly reindeer, bison, and horse; Kornietz et al., Reference Kornietz, Gladkikh, Velichko, Antonova, Gribchenko, Zelikson, Kurenkova, Khalcheva and Chepalyga1981; Soffer, Reference Soffer1985). A recent study of the site of Mezhyrich that included a detailed examination of the faunal remains of pit 7 related to dwelling 1 concluded that mammoth was used as a food resource in addition to providing raw and fuel materials (Péan, Reference Péan, Nuzhnyi and Prat2015). Accelerator Mass Spectrometry (AMS) dating on mammoth and carnivores suggest three settlement phases during the Epigravettian period (Table 1; Haesaerts et al., Reference Haesaerts, Péan, Valladas, Damblon and Nuzhnyi2015).
The site of Buzhanka 2 is an Epigravettian site discovered in 2003 on the northern bank of the Middle Desna valley (Fig. 1). The archaeological excavation in 2003 and 2006 under the direction of Stupak (Reference Stupak2005, Reference Stupak2014) revealed three archaeological layers in loessic sediments, notably a pit filled with mammoth tusks, mandibles, and ribs, and many lithic artifacts. The tool industry presents a striking similarity with the one found at Mezhyrich (Stupak, Reference Stupak2014). Beside mammoth remains, large canid (cf. wolf), fox (Alopex lagopus/Vulpes vulpes), bear (Ursus sp.), and reindeer (Rangifer tarandus) were identified. Two AMS dating results confirmed the Epigravettian attribution based on the tool industry (Table 1).
We compiled previously published carbon and nitrogen stable isotope data of mammoth and associated fauna from Mezhyrich (Iacumin et al., Reference Iacumin, Nikolaev and Ramigni2000; Drucker et al., Reference Drucker, Bocherens and Péan2014), and of mammoth from Yudinovo and Eliseevichi (Iacumin et al., Reference Iacumin, Nikolaev and Ramigni2000). We expanded the data set with 18 new specimens, including mammoth (n=1) and large canid (n=1) from Buzhanka 2; large canids (Canis sp.) and arctic fox (Alopex lagopus) from Eliseevichi (n=3); and mammoth (n=6) with associated herbivores (n=2), namely reindeer (Rangifer tarandus) and muskox (Ovibos moschatus), and carnivores (n=5), namely large canid, arctic fox, and brown bear (Ursus arctos), from Yudinovo. We measured δ34S when the quantity of collagen left after the δ13C and δ15N analyses allowed (n=35).
The collagen was purified in the Department of Geosciences at the University of Tübingen, Germany for the samples of Buzhanka 2 (Bocherens et al., Reference Bocherens, Billiou, Patou-Mathis, Bonjean, Otte and Mariotti1997) and at the University of Oxford for the Yudinovo and Eliseevichi samples (Stevens and Hedges, Reference Stevens and Hedges2004). In both cases, the extraction procedure is based on an acid-base-acid method inspired by Longin (Reference Longin1971), which consists of a first step of demineralization with HCl (1 M in Tübingen, 0.5 M in Oxford), a second step in NaOH to remove humic acids and lipids (0.125 M in Tübingen), and a final step of gelatinization at a low pH (2 in Tübingen, 3 in Oxford) for several hours at high temperature (17 h at 100°C in Tübingen, 48 h at 75°C in Oxford).
The elemental and isotopic measurements were performed at the geochemical unit of the Department of Geosciences at the University of Tübingen, using an elemental analyzer NC 2500 connected to a Thermo Quest Delta+XL mass spectrometer. Only δ13C and δ15N analyses on the new Eliseevichi and Yudinovo samples were conducted at the Research Laboratory for Archaeology and the History of Art at the University of Oxford. The δ34S analyses of the extracted collagen of these specimens were carried out at the University of Tübingen. Samples analyzed at Oxford were processed using a Carlo Erba elemental analyzer coupled to a PDZ Europa Geo 20/20 mass spectrometer.
The elemental ratios C:N, C:S, and N:S were calculated as atomic ratios. The isotopic ratios are expressed using the “δ” (delta) value as follows: δ13C=[(13C/12C)sample/(13C/12C)reference-1]×1000‰; δ15N=[(15N/14N)sample/(15N/14N)reference-1]×1000‰; and δ34S=[(34S/32S)sample/(34S/32S)reference-1]×1000‰. The international references are V-PDB for δ13C values, atmospheric nitrogen (AIR) for δ15N values, and CDT for δ34S values. At Oxford, measurements were made relative to in-house reference standards Nylon (Nylon 66, BDH, UK) and Alanine (L-Alanine, Fluka, UK), whose isotopic ratios are calibrated against IAEA standards. In Tübingen, measurements were normalized to δ13C values of USGS24 (δ13C=–16.00‰) and to δ15N values of IAEA 305A (δ15N=+39.80‰). The reproducibility was ± 0.1‰ for δ13C measurements and ± 0.2‰ for δ15N measurements, based on one standard deviation of the mean of multiple analyses of purified collagen from modern bones and international standards (Tübingen) and in-house standards (Oxford).
Samples were calibrated to δ34S values relative to CDT of NBS 123 (δ34S=+17.10‰), NBS 127 (δ34S=+20.31‰), IAEA-S-1 (δ34S=−0.30‰), and IAEA-S-3 (δ34S= +21.70‰). The reproducibility is ± 0.4‰ for δ34S measurements, and the error on amount of S measurement is 5%. Reliability of the collagen δ13C and δ15N values can be established by measuring the chemical composition of collagen, with C:N ranging from 2.9 to 3.6 (DeNiro, Reference DeNiro1985), percentage of C and N above 8% and 3%, respectively (Ambrose, Reference Ambrose1990). We retained δ34S values of samples for which the atomic C:S and N:S in collagen were included in the range of 300–900 and 100–300, respectively (Nehlich and Richard, Reference Nehlich and Richards2009).
RESULTS AND DISCUSSION
Tracking diet and habitat using δ13C and δ15N
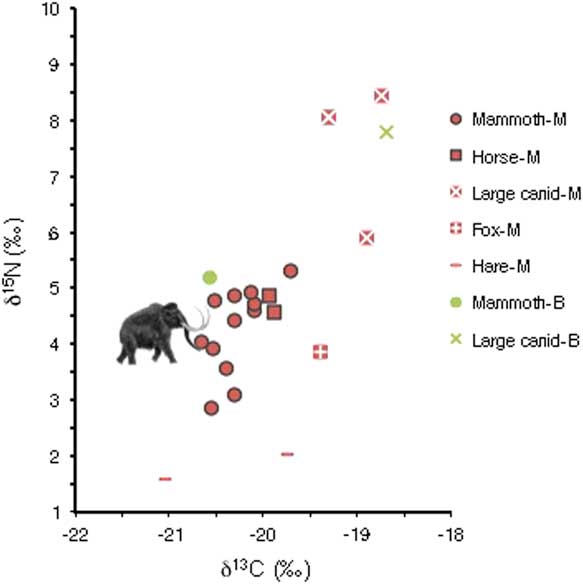
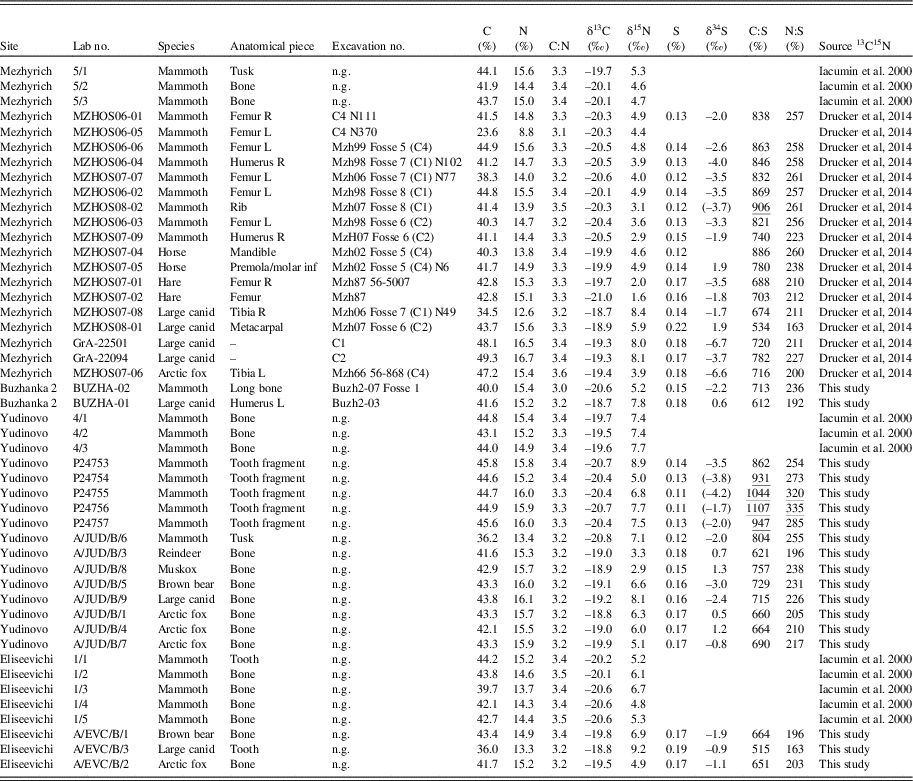
Based on the compiled data from Iacumin et al. (Reference Iacumin, Nikolaev and Ramigni2000) and Drucker et al. (Reference Drucker, Bocherens and Péan2014), the mammoth of Mezhyrich displayed δ13C and δ15N values spanning from −20.6 to −19.7‰ and +2.9 to +5.3‰, respectively (Table 2; Fig. 2). The isotopic values of horse (–19.9‰ for δ13C, +4.6 and +4.9‰ for δ15N) overlap with the highest values provided by the mammoth. Such a pattern is very unusual for the mammoth steppe ecosystem, where typically mammoth δ15N values are systematically higher than those of associated ungulates, such as horse, reindeer, and large bovids (see review in Bocherens, Reference Bocherens2015). The classic isotopic pattern of the mammoth steppe implies comparable δ15N values between mammoth and large predators (e.g., Bocherens et al., Reference Bocherens, Fizet and Mariotti1994, Reference Bocherens, Billiou, Patou-Mathis, Bonjean, Otte and Mariotti1996, Reference Bocherens, Pacaud, Lazarev and Mariotti1997, Reference Bocherens, Drucker, Bonjean, Bridault, Conard, Cupillard and Germonpré2011, Reference Bocherens, Drucker, Germonpré, Lázničková-Galetová, Naito, Wissing, Brůžek and Oliva2015; Fox-Dobbs et al., Reference Fox-Dobbs, Leonard and Koch2008; Bocherens, Reference Bocherens2015). At Mezhyrich, large canids showed higher δ15N values (+5.9 to +8.4‰) than both horse and mammoth, and higher δ13C values (−19.3 to −18.7‰), which are consistent with carnivore’s trophic enrichment. Interestingly, the fox analyzed at Mezhyrich showed lower δ13C and δ15N values compared with the large canids (Fig. 2). This indicates that they are likely to have consumed small mammals such as hare, which have low δ15N values (Mezhyrich hare: −21.0 and −19.7‰ for δ13C, +1.6 and +2.0‰ for δ15N), which is consistent with other contexts where small game were targeted by small canids (e.g., Drucker et al., Reference Drucker, Naito, Péan, Prat, Crépin, Patou-Mathis and Chikaraishi2017). Two additional data from Buzhanka 2, from one mammoth (δ13C=−20.6‰, δ15N=+5.2‰) and one large canid (δ13C=−18.7‰, δ15N=+7.8‰), were consistent with the results obtained at Mezhyrich.
(color online) Measured δ13C and δ15N values on bone collagen of mammoth, horse, hare, large canid, and fox from Mezhyrich (M) and Buzhanka 2 (B).

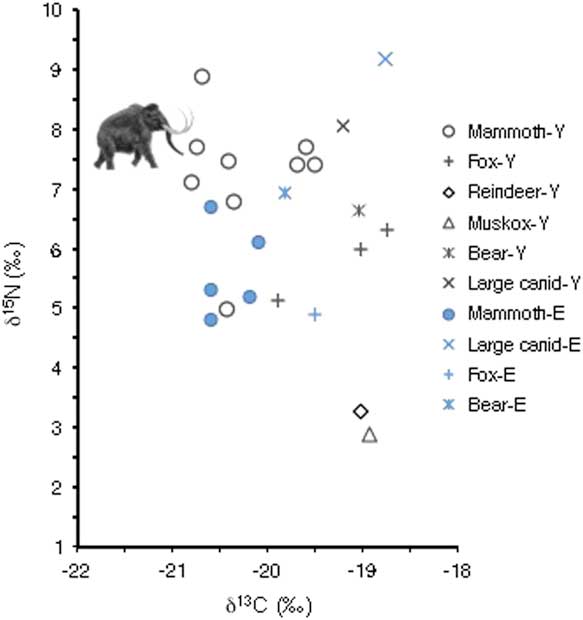
The δ13C and δ15N values of the Yudinovo mammoths varied from −20.8 to −19.5‰ and from +5.0 to +8.9‰, respectively (Fig. 3). The range of δ13C (–20.6 to −20.1‰) and δ15N (+4.8 to +6.7‰) values of the Eliseevichi mammoths overlapped with the isotopic range of the Yudinovo mammoths. This is mainly due, however, to one individual from Yudinovo with significantly lower δ13C and δ15N values than its counterparts from the same site. But even the lowest Yudinovo mammoth δ15N value (+5.0‰) was clearly higher than the reindeer and muskox δ15N values obtained from the site (+3.3 and +2.9‰ respectively). Both reindeer and muskox provided the highest δ13C values of the large herbivores (−19.0 and −18.9‰, respectively). Similar results are reported from late Pleistocene sites in Belgium (Germonpré et al., Reference Germonpré, Sablin, Stevens, Hedges, Hofreiter, Stiller and Després2009) and the Czech Republic (Bocherens et al., Reference Bocherens, Drucker, Germonpré, Lázničková-Galetová, Naito, Wissing, Brůžek and Oliva2015) and were attributed to a high consumption of lichen, as still observed nowadays for reindeer (e.g., Drucker et al., Reference Drucker, Hobson, Ouellet and Courtois2010).
(color online) Measured δ13C and δ15N values on bone collagen of mammoth, horse, reindeer, muskox, bear, large canid, and fox from Yudinovo (Y) and Eliseevichi (E).

In comparison with the mammoth, the Yudinovo and Eliseevichi canids had higher δ13C values (large canid, −19.2 and −18.8‰; fox, −19.9 to −18.8‰) but equivalent δ15N values (Fig. 3; large canid, +8.1 and +9.2‰; fox, +4.9 to +6.3‰). This corresponds again to the expected “mammoth steppe” configuration, since mammoth has been the only herbivore species of the late Pleistocene found to have δ15N values as high as associated carnivores (review in Bocherens, Reference Bocherens2015). Two brown bear specimens, one from Yudinovo and the other from Eliseevichi, showed relatively high δ13C (−19.1 and −19.8‰, respectively) and δ15N (+6.6 and +6.9‰, respectively) values that were consistent with a meat-dominated diet (Bocherens, Reference Bocherens2015). In northwest Europe, carnivorous diets are a common feature before the last glacial maximum, while vegetarian diets are more dominant in late Pleniglacial brown bears (Bocherens et al., Reference Bocherens, Drucker, Bonjean, Bridault, Conard, Cupillard and Germonpré2011; Münzel et al., Reference Münzel, Hofreiter, Stiller, Mittnik, Conard and Bocherens2011; Bocherens, Reference Bocherens2015).
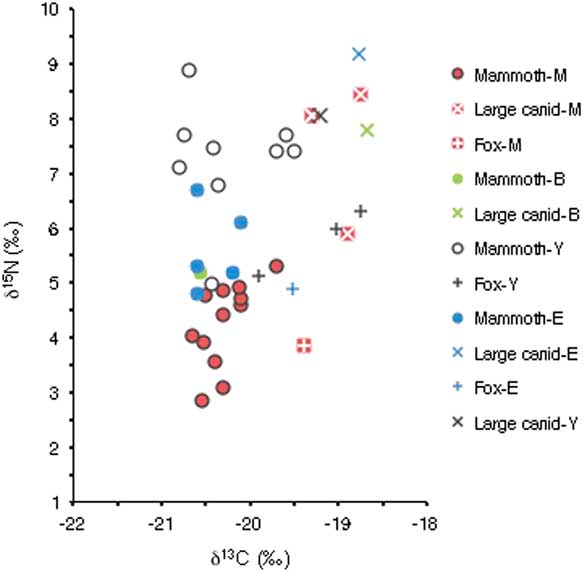
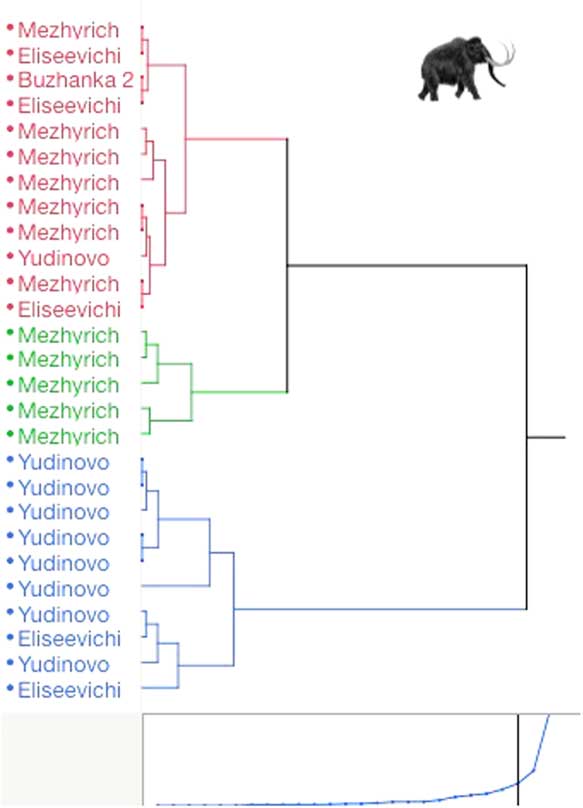
When considering mammoth, large canids, and fox from the different sites, a huge range of δ15N values appears for the proboscideans with an apparent correlation to the site of origin (Fig. 4). On average, the highest values are found at Yudinovo, while the lowest correspond to Mezhyrich, with intermediate values observed at Eliseevichi. A cluster analysis reveals two distinct groups among the mammoth samples based on δ15N values: one is composed of most of the Yudinovo samples and two specimens from Eliseevichi with values higher than 6‰, and another is composed of all the specimens from Mezhyrich and Buzhanka 2 and those from Eliseevichi and Yudinovo with values lower than 6‰ (Fig. 5). Since this second group is in the same range as the ungulates (horse, reindeer, and muskox) analyzed so far for the same sites, we can conclude that it corresponds to individuals that shifted from their usual ecological niche rather than a general shift in the δ15N baseline, as was the case for the Magdalenian site of Kesslerloch in Switzerland (Bocherens et al., Reference Bocherens, Drucker, Bonjean, Bridault, Conard, Cupillard and Germonpré2011).
(color online) Measured δ13C and δ15N values on bone collagen of mammoth, large canid, and fox from Mezhyrich (M), Buzhanka 2 (B), Yudinovo (Y), and Eliseevichi (E).

(color online) Cluster analysis using the Ward’s minimum variance method performed on δ15N values of mammoth bone collagen, with the software SAS JMP version 12.2.0.

The canids exhibit among the highest δ15N values, with the exception of one individual from Mezhyrich, whose δ15N value is particularly low at +5.9‰, in a range similar to the foxes, which tend to show lower values than the large canids (Fig. 4). Interestingly, the group of large canids shows δ15N values consistent with those of the high δ15N mammoth group, as observed previously in classic mammoth steppe of the late Pleistocene in eastern Beringia (e.g., Fox-Dobbs et al., Reference Fox-Dobbs, Leonard and Koch2008). We thus conclude that the low δ15N mammoth group represents an unusual case.
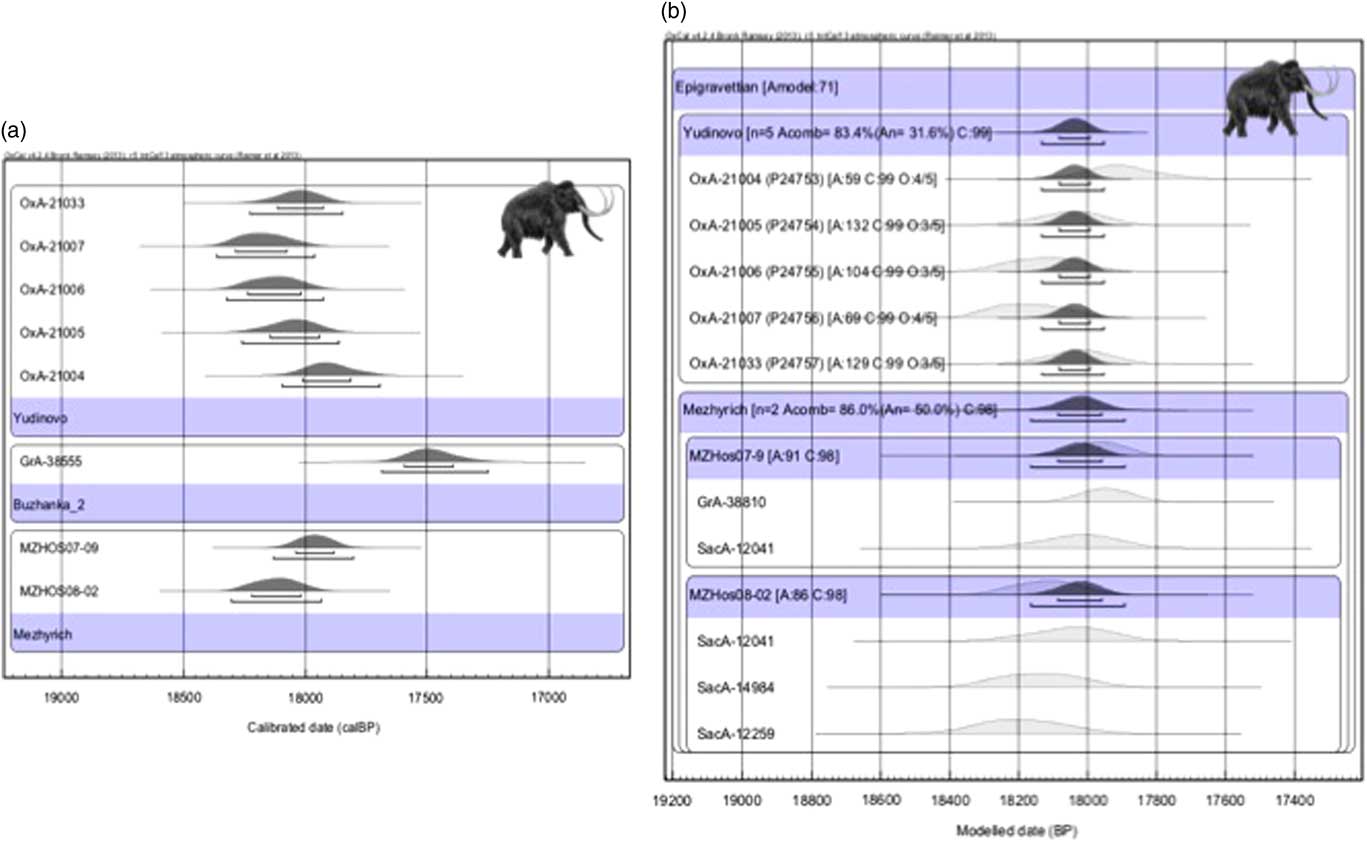
If the most likely hypothesis to explain the low mammoth δ15N is a drastic change in their usual diet and habitat, the loss of their typical niche could be related to a geographical and/or chronological change in environment. This change of diet compared to the usual one of mammoths is not a short-term event before the death of the individuals, but rather reflects years of change, since bone collagen remodeling takes years if not decades, especially in adult proboscideans (e.g., Merwe et al., Reference Merwe, Lee-Thorp and Bell1988; Sukumar and Ramesh, Reference Sukumar and Ramesh1992; Kilgallon et al., Reference Kilgallon, Flach, Boardman, Routh, Strike and Jackson2008). Chronological variation is difficult to assess because, although some of the studied specimens are directly dated, the precision of radiocarbon measurements is not high enough to allow a fine correlation with global climatic events recorded through the NGRIP curve. Except for the slightly more recent mammoth specimen of Buzhanka 2 (Fig. 6a), the calibration of the few radiocarbon dates of the mammoth specimens of this study does not reveal any clear diachronic pattern. As a matter of fact, after recombination of the several dates on the same bone for Mezhyrich, the posterior probability distribution produced by a Bayesian model using OxCal 4.2.4 (Bronk Ramsey, 2001, 2009a, Reference Bronk Ramsey2009b) shows a possible contemporaneity amongst the dated mammoth specimens (Fig. 6b). Given that the time range of the faunal accumulation is the same at the 14C scale between the different sites, geographical differences could explain the δ15N contrast as the result of the different territories roamed by mammoth and/or exploited by human through either collection or hunting. We have thus investigated the δ34S values of bone collagen that can be used as a tracker of mobility in the context of continental terrestrial-based diets, where the δ34S in plants consumed by animals should be primarily controlled by the geochemical composition of the underlying bedrock (e.g., Richards et al., Reference Richards, Fuller and Hedges2001; Jay et al., Reference Jay, Montgomery, Nehlich, Towers and Evans2013; Drucker et al., Reference Drucker, Vercoutère, Chiotti, Nespoulet, Crépin, Conard and Münzel2015).
(color online) (a) Calibrated radiocarbon for the dated mammoth specimens of Mezhyrich, Buzhanka 2, and Yudinovo. (b) Bayesian age model for the dated mammoth specimens of Mezhyrich and Mezhyrich produced using OxCal 4.2.4 (Bronk Ramsey, 2001, 2009a, Reference Bronk Ramsey2009b). The radiocarbon ages are calibrated using the INTCAL09 dataset (Reimer et al., Reference Reimer, Baillie, Bard, Bayliss, Beck, Blackwell and Bronk Ramsey2009). See Table 1 for details.

Tracking mobility using δ34S
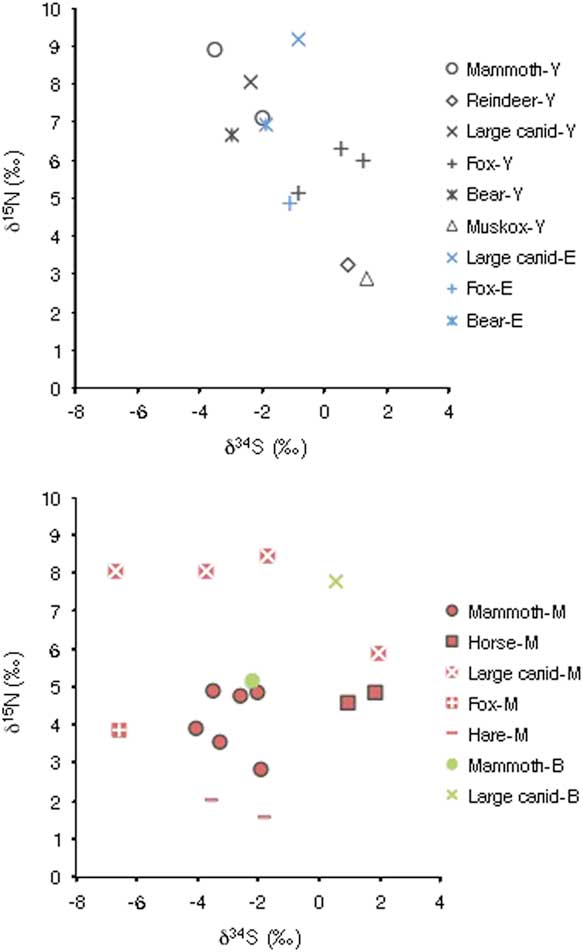
The δ34S values of the Mezyrich and Buzhanka 2 mammoth clustered between –4.0 and +2.9‰ and encompassed the two values of the hare from Mezhyrich (–3.5 and −1.8‰) and those of the mammoth from Yudinovo (–3.5 and –2.0‰; Table 2; Fig. 7). The horse from Mezhyrich and Yudinovo reindeer and muskox covered a range of higher δ34S values (+0.7 to +1.3‰, respectively). No obvious correlation appeared between the δ15N and δ34S values of the mammoth. If the Mezhyrich and Yudinovo mammoths had different mobility behavior, it was not reflected in the δ34S values recorded and averaged over years in the collagen. The mammoth δ34S values are different from those of the associated horses at Mezhyrich, and a habitat partitioning between the two species can be suggested, possibly in response to the direct forage competition suggested by their comparable δ13C and δ15N values. The Yudinovo mammoths also showed δ34S values very different from those of the reindeer and muskox. Reindeer may have migrated over areas delivering the same δ34S range as the more local muskox at Yudinovo and horse at Mezhyrich. As for Mezhyrich, the mammoths of Yudinovo were probably feeding on territories different from those used by the other ungulates, including other reputed migratory ones.
(color online) Measured δ34S and δ15N values on bone collagen of mammoth, large canid, and fox from Mezhyrich (M), Buzhanka 2 (B), Yudinovo (Y), and Eliseevichi (E).

The range of δ34S values of the large canids and foxes was −6.7 to +1.9‰ and −6.6‰, respectively, at Mezhyrich and Buzhanka 2 and −2.4 to −0.9‰ and −1.1 to +1.2‰, respectively, at Yudinovo and Eliseevichi (Table 2; Fig. 7). Brown bears from Yudinovo and Eliseevichi plotted between −3.0 to −1.9‰, very close to the large canids of the same sites. As a result, the range of sulfur isotope values seen in the carnivores overlapped with that of the herbivores at the same sites. The general ranges of δ34S values were also comparable between the two groups of sites, except for one large canid and one fox from Mezhyrich, which exhibited the lowest δ34S values measured in this study (−6.7 and −6.6‰, respectively). This large spectrum of δ34S values at Mezhyrich reflects the variability of the bioavailable sulfur isotopic values from the territories surrounding the site. The relatively low variability in δ34S values among the mammoths gives favor to the scenario of the use of the same areas by all the analyzed individuals and a chronological shift in environmental conditions leading to the loss of the typical mammoth habitat. In this case, the change may be too fast to be detected by significantly different radiocarbon dating. On the other hand, the low δ15N values measured on the mammoth of Buzhanka 2, which is significantly younger by several hundred years than the other dated specimens, tend to confirm a long lasting ecological phenomenon.
Radiocarbon ages of the last mammoths of the central East European plains have been estimated to be around 12.6–12.9 14C ka BP partly based on direct dating on molars from Eliseevichi and Mezhyrich (Stuart et al., Reference Stuart, Sulerzhitsky, Orlova, Kuzmin and Lister2002). In this context, our data would indicate a significant change of the mammoth habitat about two millennia before the species extinction at the onset of the late glacial interstadial around 12.5 14C ka BP (14.7 ka cal BP). Several elements, however, point to a possible earlier disappearance in the region. Indeed, new sets of radiocarbon dates at Mezhyrich (Haesaerts et al., Reference Haesaerts, Péan, Valladas, Damblon and Nuzhnyi2015) and Yudinovo (Palkopoulou et al., Reference Palkopoulou, Dalén, Lister, Vartanyan, Sablin, Sher and Edmark2013) have reduced the time range of mammoth occurrence to around 15.1 to 14.3 14C ka BP (18.3–17.4 ka cal BP). A range of 15 to 14 14C ka BP (ca. 18–17 ka cal BP) is confirmed for the central European plains when excluding dates obtained on burnt bone or strong outliers, as well as results with 200 yr or more as standard deviation (Iakovleva and Djindjan, Reference Iakovleva and Djindjian2005: Lister and Stuart, Reference Lister and Stuart2013; Haesaerts et al., Reference Haesaerts, Péan, Valladas, Damblon and Nuzhnyi2015). Thus, low δ15N mammoths of this study could correspond to late if not the last survivors of the species in the region. In contrast to the late glacial interstadial, the range of 15.1– 14.3 14C ka BP (18.3 to 17.4 ka cal BP) covered by low δ15N individuals corresponds to the beginning of the Heinrich 1 and thus a cold episode, which should have been beneficial to the re-expansion of mammoth steppe vegetation and presumably the associated herbivores, including the mammoth itself. The studied region is close to the southern limit of the permafrost, which supports an open landscape described as a periglacial steppe with open woodlands of birch, pine, and larch in the river valleys, meadows in wetter habitats, and grasses on the flat interfluves (Velichko and Zelikson, Reference Velichko and Zelikson2005). The mean annual precipitation is estimated to have been around 350 mm/yr with some summer rains and a thin snow cover in winter (Velichko and Zelikson, Reference Velichko and Zelikson2005). The margin of the permafrost was probably sensitive to climatic shifts, even when relatively limited in amplitude. An increase in rainfall amounts would lead to an increase in snow thickness that would hamper the access to forage, especially in the floodplains that were easily accessible to the mammoths during winter (Velichko and Zelikson, Reference Velichko and Zelikson2005). An increase in aridity would have resulted in a lower plant food supply due to the development of a pure periglacial steppe (Velichko and Zelikson, Reference Velichko and Zelikson2005).
Humans could have taken advantage of the mammoth vulnerability, as reflected by lower δ15N values, to access animals that died naturally, collect bones, and hunt the most fragile individuals. This, with the possible assistance of domesticated dogs as hunting partners, could have countered a possible return to more suitable conditions for mammoth (Sablin and Khlopachev, Reference Sablin and Khlopachev2002; Shipman, Reference Shipman2015). Our results confirm at least that mammoth specimens from Mezhyrich, Buzhanka 2, and, to a lesser extent, Eliseevichi were part of late mammoth populations surviving in sub-optimal conditions. They were thus most likely vulnerable to any pressure from environmental and/or human origin. Detecting further such cases among the late surviving mammoth populations using stable isotopic tracking may be a way to test if mammoth populations still had an optimal ecology or were metastable and, therefore, vulnerable to extinction. For instance, the insular Holocene population of mammoth on Saint Paul Island exhibited low and variable δ15N values, indicating suboptimal ecological conditions preceding their final disappearance (Graham et al., Reference Graham, Belmecheri, Choy, Culleton, Davies, Froese and Heintzman2016).
CONCLUSION
The expanded data set of mammoth and other animal species from four sites of the Dnieper and Desna Basin confirmed the anomalously low δ15N values of the mammoths at Mezhyrich, as well as one individual from Buzhanka 2, with both sites sharing the same typology of lithic artifacts (Stupak, Reference Stupak2014). In contrast, most of the analyzed mammoths from Yudinovo exhibited the high δ15N values comparable to those of the associated large canids, a phenomenon typically seen in late Pleistocene mammoth-steppe populations. The Eliseevichi mammoths were found to have intermediate δ15N values. Lower than usual δ15N values in mammoth bone collagen probably reflect the loss of their specialized niche due to change in the environmental conditions. The results of δ34S analyses showed no differences among mammoth according to the site but possibly a forage range partitioning between mammoth and coexisting large ungulates. Thus, variability in the mobility pattern for the mammoth between the high and low δ15N groups, such as migratory versus sedentary individuals, is not supported so far. We consider that rapid environmental modifications over time, probably not detectable through radiocarbon dating, can be a valid alternative explanation. Combined with direct competition with other large herbivores, such as the horse, and hunting of the most vulnerable individuals, the loss of their optimal habitat was likely to be the driving factor behind the local extinction of the mammoth in the central East European plains.
Results of stable isotope analyses of collagen (δ13C, δ15N, and δ34S) from the mammoth and associated animal species. The carbon, nitrogen, and sulfur composition of the collagen is given through elemental composition (C, N, and S) and atomic ratio (C:N, C:S, and N:S). Values of C:S and N:S were underlined when they were out of the acceptable range established by Nehlich and Richard (Reference Nehlich and Richards2009).

ACKNOWLEDGMENTS
This work was supported by the ANR “Mammouths-La disparition de la steppe à mammouths: Relations homme/environnements à la fin du Pléniglaciaire supérieur en Europe orientale” Research Project No. ANR-05-JCJC-0240-01 (director S. Péan) of the French National Research Agency (Agence Nationale de la Recherche). Thanks are due to Pavel Shydlovskyi (Department of Archaeology and Museology, National University Taras Shevchenko, Kiev, Ukraine) and Dmytro Stupak (Institute of Archaeology, National Academy of Sciences of Ukraine, Kiev, Ukraine) for their contribution in the field. The collagen preparation and analysis benefited from the technical assistance of Martin Cotte, Andrea Orendi, Bernd Steinhilber, Christoph Wißing (University of Tübingen), and Peter Ditchfield (University of Oxford). We are thankful to Peter Tung (Senckenberg Centre HEP at the University of Tübingen) for proofreading the manuscript. The European Social Fund and the Ministry of Science, Research, and Arts of Baden-Württemberg funded DGD during the conduct of this study. RES is supported by a European Research Council Consolidators Grant (617777). MVS implication in the project involved the participation of ZIN RAS (state assignment No. АААА-А17-117022810195-3). This study is a tribute to our late colleague Dmytro Nuzhnyi (Institute of Archaeology, National Academy of Sciences of Ukraine), who excavated Mezhyrich until 2008 and was a strong supporter of interdisciplinary research.