The solid solution from muscovite, KAl2(Si3Al)O10(OH)2, to aluminoceladonite, KAl(Mg,Fe)Si4O10(OH)2, is one of the basic composition series conventionally distinguished in K-dioctahedral micas (Rieder et al., Reference Rieder, Cavazzini, D'yakonov, Frank-Kamenetskii, Gottardi, Guggenheim, Koval, Muller, Neiva, Radoslovich, Robert, Sassi, Takeda, Weiss and Wones1998). Natural high- and low-temperature Al-rich K-dioctahedral micas, however, differ in the ranges of compositional variations. High-temperature K-dioctahedral 2M 1 and 3T micas only form a series between muscovite and the intermediate member phengite, KAl1.5Mg0.5(Si3.5Al0.5)O10(OH)2 (Bailey, Reference Bailey and Bailey1984; Brigatti & Guggenheim, Reference Brigatti, Guggenheim, Mottana, Sassi, Thompson and Guggenheim2002; Ferraris & Ivaldi, Reference Ferraris, Ivaldi, Mottana, Sassi, Thompson and Guggenheim2002). Micas of muscovite-like compositions with 3.0–3.3 Si cations per half formula unit (phfu) occur in granitoides and in greenschists or low to intermediate amphibolite facies (low-pressure Barrow-type metamorphism). Phengites having Si contents of 3.3–3.6 cations phfu are formed during high-pressure metamorphism, such as blueschist or eclogite facies (Schmidt et al., Reference Schmidt, Dugnani and Artioli2001). Neither 2M 1 nor 3T aluminoceladonites have been found in nature; dioctahedral Al,Mg-bearing mica samples consisting of 2M 1 and/or 3T polytypes with >3.8 Si cations phfu were only synthesized at extremely high temperatures and pressures (at ~700–900°C and 10–11 GPa; Domanik & Holloway, Reference Domanik and Holloway1996; Smyth et al., Reference Smyth, Jacobsen, Swope, Angel, Arlt, Domanik and Holloway2000; Schmidt et al., Reference Schmidt, Dugnani and Artioli2001). In a few instances, samples with a phengite-like composition were called aluminoceladonites (e.g. Pe-Piper, Reference Pe-Piper1985; Ripp et al., Reference Ripp, Doroshkevich, Karmanov and Kanakin2009; Beyer et al., Reference Beyer, Kyser, Hiatt and Fraser2010), probably because of a certain ambiguity and controversy in the existing nomenclature of micas.
In contrast, low-temperature Al-rich K-dioctahedral micas, which normally occur as finely dispersed, mostly interlayer-deficient 1M and 1M d varieties, form a continuous series from illite to aluminoceladonite (Środoń & Eberl, Reference Środoń, Eberl and Bailey1984; Drits & Kossovskaya, Reference Drits and Kossovskaya1991; Brigatti & Guggenheim, Reference Brigatti, Guggenheim, Mottana, Sassi, Thompson and Guggenheim2002; Drits et al., Reference Drits, McCarty and Zviagina2006, Reference Drits, Zviagina, McCarty and Salyn2010; Wilson, Reference Wilson2013; Zviagina et al., Reference Zviagina, Drits, Środoń, McCarty and Dorzhieva2015). All natural aluminoceladonite samples known to date are 1M polytypes that formed at relatively low temperatures (up to 200°C) and pressures, mostly under the action of highly mineralized solutions in evaporite basins (Seifert, Reference Seifert1968; Sokolova et al., Reference Sokolova, Drits, Sokolova and Stepanov1976; Rasskazov, Reference Rasskazov1984; Drits & Kossovskaya, Reference Drits and Kossovskaya1991; Petrova & Amarjargal, Reference Petrova and Amarjargal1996; Murao et al., Reference Murao, Yubuta, Miyawaki and Sugiyama2009; Drits et al., Reference Drits, Zviagina, McCarty and Salyn2010; Środoń et al., Reference Środoń, Paszkowski, Drygant, Anczkiewicz and Banas2013). Drits et al. (Reference Drits, McCarty and Zviagina2006) analysed the structural and crystal-chemical factors that control the occurrence and relative stability, under the given physicochemical conditions, of cis-vacant (cv) and trans-vacant (tv) layers in dioctahedral 2:1 phyllosilicates. In particular, they showed that the interlayer arrangement in tv 1M micas, where the grooves formed by the rows of the depressed oxygen anions in the basal tetrahedral surfaces across the interlayer have the same orientation, should be less favourable than that in cv 1M micas, where the tetrahedral sheets across the interlayer are rotated by 120° with respect to each other. The latter arrangement, which is similar to that in tv 2M 1 micas, ensures reduced differences between individual K–O bond lengths and minimization of repulsion of the basal oxygen anions across the interlayer. On the other hand, the symmetrical arrangement of the octahedral sheet should stabilize the tv structure as compared to the cv structure. Decreasing contents of tetrahedral and octahedral Al and increasing contents of larger octahedral Mg and Fe cations lead to a decrease in the tetrahedral rotation and corrugation, as well as a decrease in the size difference between the occupied and vacant octahedra. As a result, the role of the symmetry of the octahedral sheet begins to prevail over that of the interlayer structure. Therefore, Fe-rich and Mg-rich dioctahedral micas (Mg-rich illites, aluminoceladonites, Fe-illites, Al-glauconites, glauconites and celadonites) always occur as tv varieties, whereas (Mg,Fe)-poor illites can have either tv or cv structures (Drits et al., Reference Drits, McCarty and Zviagina2006; Zviagina et al., Reference Zviagina, Drits, Środoń, McCarty and Dorzhieva2015, Reference Zviagina, Drits, Sakharov, Ivanovskaya and Dorzhieva2017).
Factors controlling the occurrence of the various polytypes of high-pressure K-dioctahedral micas have been analysed by several authors. Velde (Reference Velde1965) suggested that 2M 1 is the most stable phengite polytype and that an important role in polytype stability is played by kinetics. Stöckert (Reference Stöckert1985) suggested that the 3T polytype is more common in Mg-rich phengites, which contain at least a minor amount of Fe and/or Na, whereas the 2M 1 polytype may be more typical for Mg-poor compositions. Sassi et al. (Reference Sassi, Guidotti, Reider and de Pieri1994) and Curetti et al. (Reference Curetti, Ferraris and Ivaldi2008) suggested that high-pressure conditions may favour the 3T over the 2M 1 polytype, and Sassi et al. (Reference Sassi, Brigatti, Gomez-Pugnaire, Peruzzo, Tellini and Sassi2010) concluded that the growth of the 3T polytype was not a function of mica composition. The synthetic micas in the muscovite–phengite–aluminoceladonite series (Schmidt et al., Reference Schmidt, Dugnani and Artioli2001) contain 60–100% of the 2M 1 polytype, 3–40% of the 1M polytype and 5–26% of the 3T polytype. The 3T polytype was only present in three samples synthesized at ≥800°C and ≥8 GPa. There was no clear dependence of the presence or abundance of any polytype on the Si and Mg contents; the three 3T-bearing samples, however, had ≥3.8 Si and ≥0.85 Mg cations phfu. Unlike Massonne & Schreyer (Reference Massonne and Schreyer1986), who observed decreases in the 2M 1 and increases in the 1M polytype contents with decreasing pressure, temperature, and Mg contents in the ‘white mica’ samples synthesized at ~400–800°C and ~0.3–3.0 GPa, Schmidt et al. (Reference Schmidt, Dugnani and Artioli2001) observed no correlation between the estimated abundance of the 1M polytype and any of the controlled experimental variables in the muscovite–phengite–aluminoceladonite samples synthesized at ~700–1000°C and 2–10 GPa. This discrepancy may be associated with the differences in the experimental conditions (particularly the much higher pressures used by Schmidt et al., Reference Schmidt, Dugnani and Artioli2001). Schmidt et al. (Reference Schmidt, Dugnani and Artioli2001) concluded that kinetics and/or other uncontrolled experimental variables may play a major role in polytype stabilization.
To date, no explanation has been found for the different composition variation ranges in high-temperature Al-rich K-dioctahedral 2M 1 and 3T micas and low-temperature 1M varieties. The objective of the present study was to reveal the structural and compositional factors that prevent the formation of high-temperature 2M 1 aluminoceladonite and favour the formation of relatively low-temperature 1M aluminoceladonite. For this purpose, the relationships between structural parameters and cation composition were analysed for two groups of samples: (1) a series of synthetic 2M 1 muscovite–phengite–aluminoceladonite samples of Schmidt et al. (Reference Schmidt, Dugnani and Artioli2001) (Tables 1, 2); and (2) Al-rich, K-dioctahedral 2M 1 micas with previously published refined structural data (Tables 3, 4). 3T muscovite–phengite micas were not considered because of the scarcity of experimental data, and also because they would have overcomplicated the analysis. For the same reason, mixtures of 1M and 2M 1 polytypes, which occur, for example, in fine-grained aggregates of mica-like phases previously called ‘sericites’, were not considered either. For both sets of samples, dependences of the unit-cell parameters on cation composition were analysed and compared with those found for the series of 1M tv illite–aluminoceladonite by Zviagina et al. (Reference Zviagina, Drits, Środoń, McCarty and Dorzhieva2015). In addition, the variations in tetrahedral and octahedral lateral dimensions and sheet thicknesses, interlayer distances and tetrahedral rotation angles were considered for the refined structures (group 1) and for structure models of synthetic samples (group 2) obtained using the structure modelling algorithm of Zviagina & Drits (Reference Zviagina and Drits2012).
Cation compositions of synthetic 2M 1 micas in the series muscovite–phengite–aluminoceladonite (per O10(OH)2) (Schmidt et al., Reference Schmidt, Dugnani and Artioli2001).

Σoct = sum of octahedral cations.
Unit-cell parameters of synthetic 2M 1 micas in the series muscovite–phengite–aluminoceladonite (Schmidt et al., Reference Schmidt, Dugnani and Artioli2001).

Cation compositions (atoms phfu) of 2M 1 micas with refined structures (natural muscovites and phengites and synthetic aluminoceladonite).

Σoct = sum of octahedral cations.
Unit-cell parameters of refined 2M 1 mica structuresa (natural muscovites and phengites and synthetic aluminoceladonite).

a Sample numbers as in Table 3.
Initial data and methods
Two sets of data were analysed for relationships between structural characteristics and cation composition. The series of micas in the muscovite–aluminoceladonite join synthesized by Domanik & Holloway (Reference Domanik and Holloway1996) and analysed for polytype contents and unit-cell parameters by Schmidt et al. (Reference Schmidt, Dugnani and Artioli2001) (group 1, Tables 1, 2) are ideal for such analysis, as the composition variation in the series is solely determined by the coupled heterovalent Tschermak substitution VIAlIVAl ↔ VIMgIVSi. Moreover, the K content is close to 1 cation phfu in all the samples, which minimizes the potential influence of the interlayer cation composition. The 13 samples selected for the analysis were those with the greatest contents of the 2M 1 polytype (79.3–100%; Table 2) and the sum of octahedral cations, Σoct, closest to 2 cations phfu (1.97–2.06; Table 1). The Si and Mg contents in the group 1 samples range from 3.11 to 3.99 cations phfu and from 0.10 to 0.97 cations phfu, respectively, so that five samples have muscovite and near-muscovite compositions, four samples have phengite-like compositions and four samples have aluminoceladonite and aluminoceladonite-like compositions (Table 1).
Group 2 comprises refined structural data of 18 natural micas (muscovites, phengitic muscovites and phengites) and one aluminoceladonite synthesized by Domanik & Holloway (Reference Domanik and Holloway1996) and refined by Smyth et al. (Reference Smyth, Jacobsen, Swope, Angel, Arlt, Domanik and Holloway2000) (see Table 3 for cation compositions and references to structural data, and see Table 4 for unit-cell parameters). The data were selected according to the same criteria as in Zviagina & Drits (Reference Zviagina and Drits2012): high precision in the published structural data (R < 10%); Σoct from 1.9 to 2.1 cations phfu; overall cation charge phfu from 21.85 to 22.15; Li and/or F < 0.25 atoms phfu. The synthetic sample of Smyth et al. (Reference Smyth, Jacobsen, Swope, Angel, Arlt, Domanik and Holloway2000) was included in group 2 as it is the only refined 2M 1 aluminoceladonite structure reported to date.
The results obtained for the 2M 1 mica structures were compared with those for 1M micas in the illlite–aluminoceladnite series studied by Drits et al. (Reference Drits, Zviagina, McCarty and Salyn2010) and Zviagina et al. (Reference Zviagina, Drits, Środoń, McCarty and Dorzhieva2015).
Regression analysis
Regression equations relating unit-cell parameters with cation composition were obtained using the standard procedures in MS Excel. The quality of the regressions was evaluated based on the coefficient of determination, R 2, estimated standard deviation values, esd, and ANOVA quality-of-fit p-values. Conventionally, the acceptable level of significance of a regression corresponds to R 2 ≥ 0.8 and p ≤ 0.05. The acceptable esd values should be comparable with the precision in the experimental structure determinations (i.e. ≤0.01 Å for distance parameters).
Structure modelling
As Schmidt et al. (Reference Schmidt, Dugnani and Artioli2001) did not refine the structures of synthetic micas (group 1), the algorithm of Zviagina & Drits (Reference Zviagina and Drits2012) was used to calculate the unit-cell atomic coordinates from the data on unit-cell parameters and cation composition (Supplementary Table S1). The esd values for the modelled x, y and z coordinates vary for different atomic positions and range from 0.0001 to 0.003 (fractional units). The esd values for the structure details obtained from the calculated atomic coordinates are 0.002–0.007 Å for mean and individual tetrahedral bond and edge lengths, 0.004–0.013 Å for mean and individual octahedral bond and edge lengths, 0.013–0.015 Å for K–O distances and 0.5° for the tetrahedral ditrigonal rotation angle, αtet. The structure parameters for the 1M micas used for comparison were taken from the structure models obtained by Drits et al. (Reference Drits, Zviagina, McCarty and Salyn2010). The unit-cell atomic coordinates for 1M samples Mal-4 and Mal-6 (Supplementary Table S1) were calculated using the algorithm of Smoliar-Zviagina (Reference Smoliar-Zviagina1993), revised by Drits et al. (Reference Drits, Zviagina, McCarty and Salyn2010).
Results and discussion
Relationships between unit-cell parameters and cation composition
Layer-to-layer distance
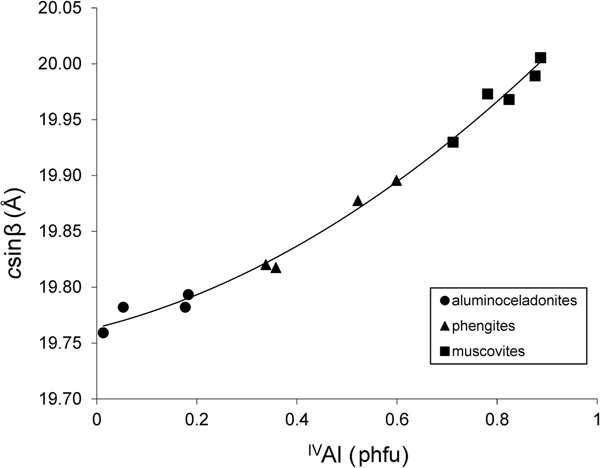
The compositional variation from muscovite to aluminoceladonite through phengite is accompanied by a consistent decrease in the layer-to-layer distance, csinβ. For group 1 samples, this decrease is nearly linear from muscovites (csinβ = 20.005–19.930 Å) to phengites (csinβ = 19.896–19.820 Å) and then slows down from phengites to aluminoceladonites (csinβ = 19.793–19.759 Å) (Fig. 1), so that the dependence of csinβ on the contents of tetrahedral Al cations is described by the regression equation:
 $$c\!\sin\! {\rm \beta} = 19.766 + 0.280(^{{\rm IV}}{\rm A}1)^{1.5}$$
(esd = 0.008 Å; R2 = 0.993; p < 10–12), where IVAl is the tetrahedral Al content.
Cross-plot of the csinβ values in group 1 samples against tetrahedral Al contents (cations phfu).

In group 2 samples, a similar trend is observed, although the point scatter is much wider; the csinβ values for natural 2M 1 micas plot onto or below the curve for synthetic 2M 1 micas (Fig. 2). This may be associated with the more heterogeneous octahedral cation composition in natural mica samples, which, apart from Al and Mg, contain Fe, Mn, Cr, etc., as well as with the different methods of determination of unit-cell parameters (single-crystal X-ray, electron and neutron diffractions vs X-ray powder diffraction and Rietveld refinement used by Schmidt et al., Reference Schmidt, Dugnani and Artioli2001).
Cross-plot of the csinβ values in the 1M K-dioctahedral micas and the csinβ/2 values in group 1 and group 2 samples against tetrahedral Al contents (cations phfu).

The decrease in the csinβ parameter over the total composition range in natural and synthetic K-dioctahedral 2M 1 and 3T micas, which belong to the solid-solution muscovite–aluminoceladonite, was previously noted by several authors (Massonne & Schreyer, Reference Massonne and Schreyer1986, 1989; Guidotti et al., Reference Guidotti, Mazzoli, Sassi and Blencoe1992; Ivaldi et al., Reference Ivaldi, Ferraris, Curetti and Compagnoni2001; Schmidt et al., Reference Schmidt, Dugnani and Artioli2001, Ferraris & Ivaldi, Reference Ferraris, Ivaldi, Mottana, Sassi, Thompson and Guggenheim2002), who explained it by a decrease in the tetrahedral rotation angle leading to increasing ditrigonal rings of the tetrahedral sheets across the interlayers, which allow the interlayer cation to ‘sink’ deeper into the interlayer cavity. Drits et al. (Reference Drits, Zviagina, McCarty and Salyn2010), however, showed that the mean interlayer distance, which determines the layer-to-layer distance value, depends primarily on Al-for-Si substitution. Decreasing tetrahedral Al-for-Si substitution leads to a decrease in the undersaturation of the basal oxygen atoms with respect to negative charge and, consequently, to weakening of their mutual repulsion. Accordingly, aluminoceladonites with little or no tetrahedral Al have shorter interlayer distances and, as a result, reduced csinβ values. The decrease in the interlayer distance with decreasing IVAl is balanced by a particular increase in the 2:1 layer thickness as a result of increasing octahedral sheet thickness with increasing contents of larger Mg (group 1) and Mg and Fe (group 2) cations (Table 5), which probably explains the non-linear character of the dependence of csinβ on IVAl.
Structure parameters in group 1 structure models and selected group 2 refined structures.a

a Sample numbers as in Table 3.
b ΣR2+ = Mg for group 1.
(O–O)basal = tetrahedral basal edge length; (O–O)lateral = octahedral lateral edge length; b t/b oct = tetrahedral/octahedral misfit; αtet = tetrahedral rotation angle; <h T> = mean tetrahedral sheet thickness; <h oct> = mean octahedral sheet thickness; ΔOH = corrugation of the octahedral basal anion surface (hydroxyl depression); <h TOT> = 2 < h T> + <h oct> + 2ΔOH/3 = mean thickness of the 2:1 layer; <h int> = mean interlayer distance.
The dependence of csinβ on cation composition in natural and synthetic 2M 1 micas of the muscovite–phengite–aluminoceladonite series is very similar to that observed in the low-temperature 1M micas in the series (Mg,Fe)-poor illite–Mg-rich illite–aluminoceladonite (Zviagina et al., Reference Zviagina, Drits, Środoń, McCarty and Dorzhieva2015):
 $$c\!\sin\! {\rm \beta} = 9.896 + 0.172(^{{\rm IV}}{\rm A}1)^{1.5}$$
(esd = 0.004 Å; R 2 = 0.991, p < 10–8). The respective trends are nearly parallel but the csinβ/2 values of 2M 1 micas of the muscovite–aluminoceladonite series are systematically lower than the csinβ values of natural 1M micas of the same tetrahedral composition (Fig. 2). This may be associated with the lower interlayer cation occupancy in the 1M micas (≤0.8 cations phfu as compared to ~1 cations phfu in the 2M 1 varieties). The presence of K cations in the interlayer cavities should partially compensate for the mutual repulsion between the basal oxygen anion planes across the interlayer, so that interlayer deficiency should lead, for the same tetrahedral cation compositions, to larger interlayer distances and therefore larger layer-to-layer distances. High-pressure formation conditions could be another reason for lower layer-to-layer distances in the 2M 1 muscovite–phengite–aluminoceladonite micas as compared to those in the 1M illite–aluminoceladonite micas.
Layer displacement
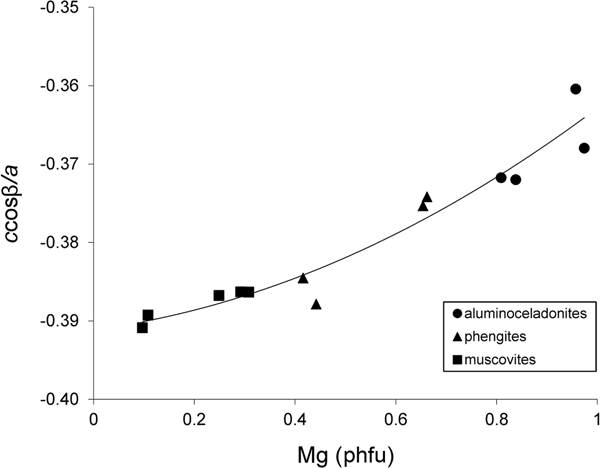
With increasing Mg contents in the series of tv 1M illite–aluminoceladonite micas, the absolute value of the layer displacement |ccosβ/a| decreases from ~0.40 in (Mg,Fe)-poor illite to ~0.36 in aluminoceladonite (Drits et al., Reference Drits, McCarty and Zviagina2006; Zviagina et al., Reference Zviagina, Drits, Środoń, McCarty and Dorzhieva2015). Drits et al. (Reference Drits, McCarty and Zviagina2006) showed that this effect is associated with the decreasing size difference between the occupied and vacant octahedra leading to ccosβ/a values closer to the idealized value of –1/3. A similar trend is observed in the synthetic 2M 1 micas (group 1) (Fig. 3). The relationships between ccosβ/a and cation composition are described by Eq. 3 (Zviagina et al., Reference Zviagina, Drits, Środoń, McCarty and Dorzhieva2015) and Eq. 4 for the 1M micas and group 1, respectively:
 $$c\!\cos\! {\rm \beta} /a = 0.084{\rm M}{\rm g}^2 + 0.002{\rm Mg}-0.396$$
(esd = 0.005; R2 = 0.888; p < 10–4), and:
 $$c\!\cos\! {\rm \beta} /a = 0.020{\rm M}{\rm g}^2 + 0.008{\rm Mg}-0.391$$
(esd = 0.002; R2 = 0.937; p < 10–7). For group 1, the relationship between ccosβ/a and Mg can be described by a linear function:
 $$c\!\cos\! {\rm \beta} /a = 0.030{\rm Mg}-0.395$$
with only slightly less precision (esd = 0.003; R 2 = 0.915; p < 10–6). The refined structures (group 2) display a similar but fairly loose trend with a much wider point scatter (Fig. 4): the |ccosβ/a| values are 0.38–0.39 for muscovites and phengites and ~0.37 for aluminoceladonite. Similarly to the csinβ values, the wide scatter of points is associated with the more heterogeneous cation composition of the group 2 samples, which contain other octahedral cations (Fe, Mn, Cr, etc.) in addition to Al and Mg, as well as with the different methods of determination of unit-cell parameters (see above).
Cross-plot of the ccosβ/a values in group 1 samples against Mg contents (cations phfu).

Cross-plot of the ccosβ/a values in group 2 samples against Mg contents (cations phfu).

Lateral dimensions
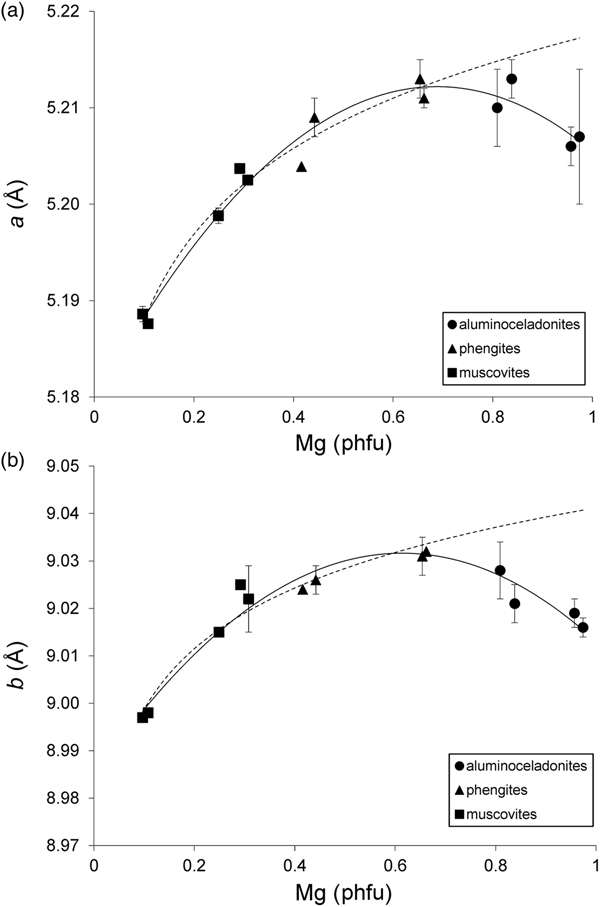
Schmidt et al. (Reference Schmidt, Dugnani and Artioli2001) noted that the a and b parameters of their synthetic samples increased from muscovites to phengites having IVAl ≈ 0.4 and Mg ≈ 0.6 cations phfu and decreased from phengites to aluminoceladonites. However, no quantitative treatment of this trend was provided. Regression analysis of the a and b values in group 1 samples yields the following relationships:
 $$a = -0.069({\rm Mg}-0.688)^2 + 5.212$$
(esd = 0.002 Å; R2 = 0.964; p < 10–7) (Fig. 5a), and:
 $$b = -0.125({\rm Mg}-0.614)^2 + 9.032$$
(esd = 0.003 Å; R2 = 0.942; p < 10–6) (Fig. 5b). Equations 5 and 6 show that the reversal of the trend in the variation of the a and b parameters indeed takes place at Mg = 0.6–0.7 cations phfu. The trends in the variation of the lateral cell dimensions with cation composition in group 2 samples are similar to those in group 1 samples, but the point scatter is wider (Fig. 6) and the correlations are not as strong. As hypothesized for csinβ, this may be associated with the presence of octahedral cations other than Al and Mg (in the first place, Fe2+ and Fe3+), as well as with differences in unit-cell determination techniques. Specifically, the b parameter increases from ~8.98–9.03 Å in muscovites to ~9.05 Å in phengites and then decreases to 9.037 Å in aluminoceladonite (Fig. 6, Table 4). This trend can be described by a regression similar to Eq. 6 but with lower statistical significance:
 $$b = 9.055-0.299\lpar {\Sigma_{{\rm Mg,Fe(II),Fe(III)}}-0.551} \rpar ^2$$
(esd = 0.015 Å; R2 = 0.70; p < 10–4), where ΣMg,Fe(II),Fe(III) is the total amount of Mg, Fe2+ and Fe3+ cations phfu. Equation 7a shows that the maximum b value is achieved for the sum of Mg and Fe of ~0.55 cations phfu. If the same trend is analysed without including the data on the only aluminoceladonite sample in group 2, a very similar equation is obtained:
 $$b = 9.050-0.292\lpar {\Sigma_{{\rm Mg,Fe(II),Fe(III)}}-0.538} \rpar ^2$$
(esd = 0.015 Å; R2 = 0.68; p < 10–4). For 2M 1 aluminoceladonite (Smyth et al., Reference Smyth, Jacobsen, Swope, Angel, Arlt, Domanik and Holloway2000), Eq. 7b predicts b = 9.028 Å, which is less than 0.01 Å lower than the observed b value (9.037 Å) and is identical to that of sample P18-2 (group 1) of similar cation composition.
Cross-plot of the (a) a and (b) b values in group 1 samples against Mg contents (cations phfu). Solid line = actual trend; dotted line = extrapolation of the dependences observed in the series muscovite–phengite to aluminoceladonite composition. Error bars: experimental esd values for (a) a and (b) b (esd values ≤ 0.0008 Å for a and ≤ 0.001 Å for b are not displayed).

Cross-plot of the b values in group 2 samples against total amount of Mg, Fe2+ and Fe3+ (cations phfu). Solid line = actual trend; dotted line = extrapolation of the dependence observed in the series muscovite–phengite to aluminoceladonite composition. Error bars: experimental esd values for b (esd values ≤ 0.001 Å are not displayed).

A similar trend was reported for 1M Al-rich, K-dioctahedral micas. In the illite–aluminoceladonite series, b increases from ~9 Å in (Mg,Fe)-poor illites up to ~9.03–9.04 Å in Mg-rich illites and then decreases to ~9.01–9.02 Å in aluminoceladonites, so that:
 $$\eqalign{b & = 9.039-0.121({\rm Mg}-0.287)^2-0.689({\rm F}{\rm e}^{2 +} -0.116)^2 \cr & -1.994({\rm F}{\rm e}^{3 +} -0.154)^2}$$
(esd = 0.006 Å; R2 = 0.963, p = 0.008) (Zviagina et al., Reference Zviagina, Drits, Środoń, McCarty and Dorzhieva2015).
Schmidt et al. (Reference Schmidt, Dugnani and Artioli2001) suggested that the reduction of a and b cell parameters ‘at high aluminoceladonite contents’ (i.e. for Si > 3.6 and Mg > 0.6 cations phfu) could be associated with a possible partial trioctahedral character of aluminoceladonite-like micas. This hypothesis, however, is not convincing, as according to the crystal-chemical formulae the occupancies of the trans-octahedron are negligible (Tables 1; Tables 2, sample #19). A more plausible explanation is based on the analysis of the evolution of tetrahedral and octahedral edge lengths and sheet thicknesses. The actual lateral dimensions of the mica structure can be seen as a compromise between the larger dimensions of the idealized unrotated tetrahedral sheet and the smaller dimensions of the idealized octahedral sheet, b t and b oct, which are related to the mean tetrahedral basal and octahedral unshared lateral edge lengths, (O–O)basal and (O–O)lateral, respectively, by: b t = 2√3(O–O)basal; b oct = 3(O–O)lateral. With increasing Si contents, the tetrahedral size decreases while tetrahedral elongation increases (Drits et al., Reference Drits, Zviagina, McCarty and Salyn2010; Zviagina & Drits, Reference Zviagina and Drits2012), and, as a result, (O–O)basal decreases. Simultaneously, increasing contents of larger octahedral cations (Mg, Fe2+, Fe3+) lead to increasing (O–O)lateral values (Table 5). In both muscovite–phengite and (Mg,Fe)-poor illite–Mg-rich illite series, the second of these trends dominates and b increases; from phengite to 2M 1 aluminoceladonite, as well as from Mg-rich illite to 1M aluminoceladonite, the decrease in (O–O)basal begins to dominate and b decreases. The a parameter behaves in a similar way. The change of the trends in question may be associated with a decrease in mutual repulsion of octahedral cations with increasing contents of divalent cations. As a result, the octahedral sheet becomes less flattened and its lateral dimensions increase more slowly. Accordingly, the decreasing lateral dimensions of the tetrahedral sheet begin to dominate.
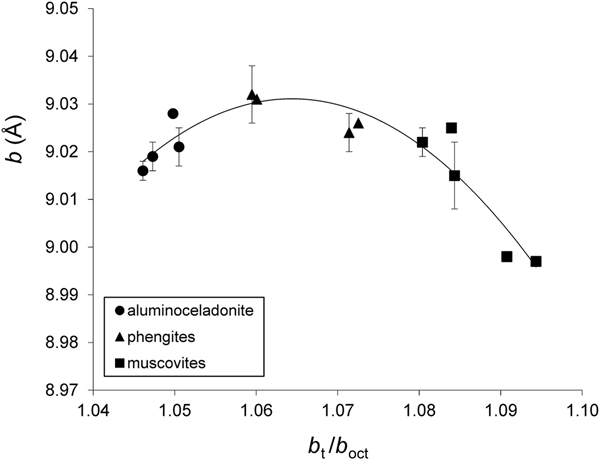
On the whole, the variation of the b parameter with b t/b oct can be described by regression Eqs. 9a and 9b for group 1 and group 2 samples, respectively;
 $$b = 9.031-39.330(b_{\rm t}/b_{{\rm oct}}-1.064)^2$$
(esd = 0.004 Å, R2 = 0.869, p < 10–4) (Fig. 7), and:
 $$b = 9.059-94.019(b_{\rm t}/b_{{\rm oct}}-1.069)^2$$
(esd = 0.009 Å, R2 = 0.864, p < 10–8) (Fig. 8). For regressions (9a) and (9b), the b t/b oct values were obtained from structural models and from experimental (O–O)basal and (O–O)lateral values, respectively (Table 5).
Cross-plot of the b values in group 1 samples against b t/b oct (see text for explanation). Error bars: experimental esd values for b (esd values ≤0.001 Å are not displayed).
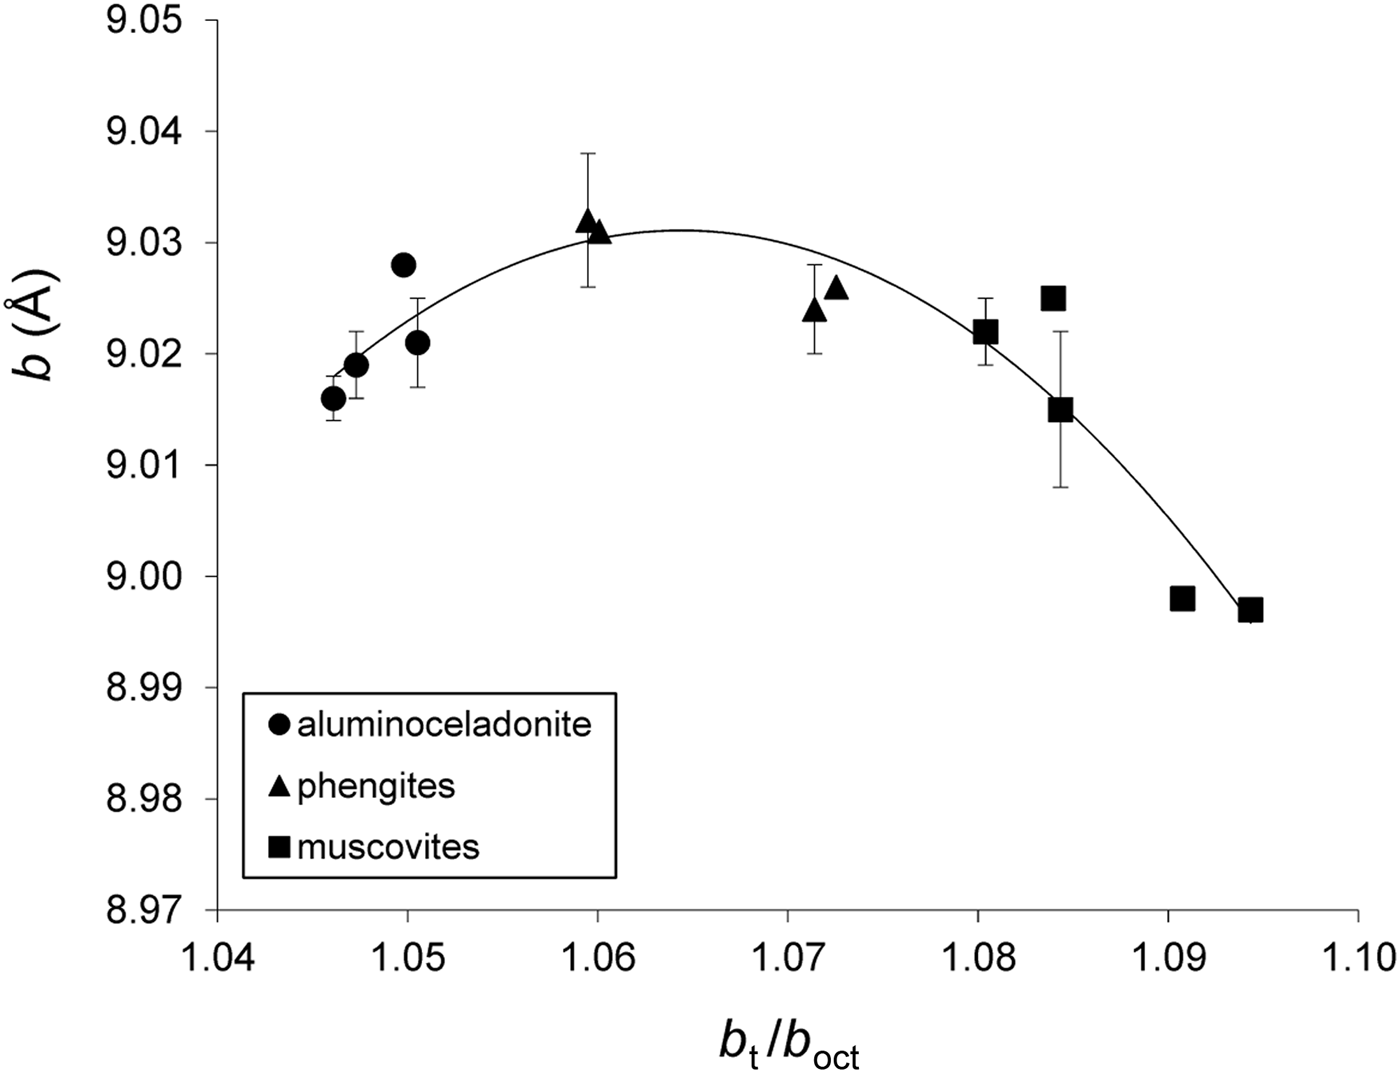
Cross-plot of the b values in group 2 samples against b t/b oct (see text for explanation). Error bars: experimental esd values for b (esd values ≤ 0.001 Å are not displayed).

For 1M micas in the illite–aluminoceladonite series, the correlation between the b parameters and b t/b oct values is weaker and displays a wider scatter of points than in the case of 2M 1 micas (Fig. 9) (the b t and b oct parameters (Table 6) were calculated using the structure modelling algorithm for 1M dioctahedral micas of Smoliar-Zviagina (Reference Smoliar-Zviagina1993) and Drits et al. (Reference Drits, Zviagina, McCarty and Salyn2010)). This may be associated with the higher structural and crystal-chemical heterogeneity of the low-temperature micas and, in particular, interlayer cation deficiency and the presence of expandable interlayers, the higher Fe contents in some samples, the high dispersion and the lower structural order. The general trend, however, is similar: with increasing contents of tetrahedral Si and larger octahedral cations, b increases up to Mg ≈ 0.4 cations phfu and then decreases (Fig. 10). The similar trends in the variations of the unit-cell parameters (layer-to-layer distance, layer displacement and lateral dimensions) with cation composition observed in 2M 1 Al-rich, K-dioctahedral micas and in 1M micas of the illite–aluminoceladonite series suggest that these variations should be controlled by similar structural factors.
Cross-plot of the b values in the 1M K-dioctahedral micas against b t/b oct (see text for explanation). Error bars: experimental esd values for b (esd values ≤ 0.001 Å are not displayed).

Cross-plot of the b values in the 1M K-dioctahedral micas against Mg contents (cations phfu). Error bars: experimental esd values for b (esd values ≤ 0.001 Å are not displayed).

Tetrahedral basal and octahedral lateral edge lengths, tetrahedral/octahedral lateral misfit values and tetrahedral rotation angles in 1M mica structure models.a

a Cation compositions of 1M micas: Drits et al. (Reference Drits, Zviagina, McCarty and Salyn2010), Zviagina et al. (Reference Zviagina, Drits, Środoń, McCarty and Dorzhieva2015). 1M structure models: Mal-4 and Mal-6 from this work; other samples from Drits et al. (Reference Drits, Zviagina, McCarty and Salyn2010).
b b t/b oct = 2√3(O–O)basal/3(O–O)lateral.
Tetrahedral rotation angle and interlayer structure
In agreement with the estimates of Schmidt et al. (Reference Schmidt, Dugnani and Artioli2001), the calculated ditrigonal tetrahedral rotation angle values, αtet, decrease from muscovite to aluminoceladonite. The αtet values are ~3–4° for aluminoceladonite, ~5–8° for phengite and ~9–11° for muscovite structure models (group 1, Table 5). The decrease in αtet is associated with a decrease in the tetrahedral basal edge lengths with increasing Si and can be described by the empirical relationship  $\alpha _{{\rm tet}} = arccos\left( {\displaystyle{{0.8672b} \over {3({\rm O}-{\rm O}){\rm basal}}}} \right)$ (Zviagina & Drits, Reference Zviagina and Drits2012). The modelled αtet values are lower than those predicted for the same samples by Schmidt et al. (Reference Schmidt, Dugnani and Artioli2001) based on the empirical relationship of Radoslovich & Norrish (Reference Radoslovich and Norrish1962) (~5–7° for aluminoceladonites, ~9–11° for phengites and ~12–15° for muscovites), but agree well with the observed αtet values in refined mica structures of respective compositions: aluminoceladonite, 2.4°; phengites and phengitic muscovite, ~5–8°; and muscovite, ~11° (group 2, Table 5). The decrease in αtet values leads to a decrease in the differences between the mean inner and outer K–O distances (<K–O>in and < K–O>out) and, at the same time, to an increase in the individual and mean inner K–O distances (Table 7). The longer inner K–O distances imply weaker bonding between the interlayer cation and the basal oxygen anions, therefore leading to a less stable interlayer configuration.
K–O distances (Å) in selected structure models (group 1) and refined structures (group 2).a

a Sample numbers as in Table 3.
b ΣR2+ = Mg for group 1.
αtet = tetrahedral rotation angle; <K–O>in = mean inner K–O distance; <K–O>out = mean outer K–O distance; <K–O> = mean total K–O distance; Δ<K–O> = <K–O>out – <K–O>in.
The αtet values obtained for the structure models of 1M aluminoceladonites are close to those for the 2M 1 structures of similar tetrahedral composition: 3–5° for aluminoceladonites, 6–8° for Mg-rich illites and 10–11° for (Mg,Fe)-poor illites (Table 6).
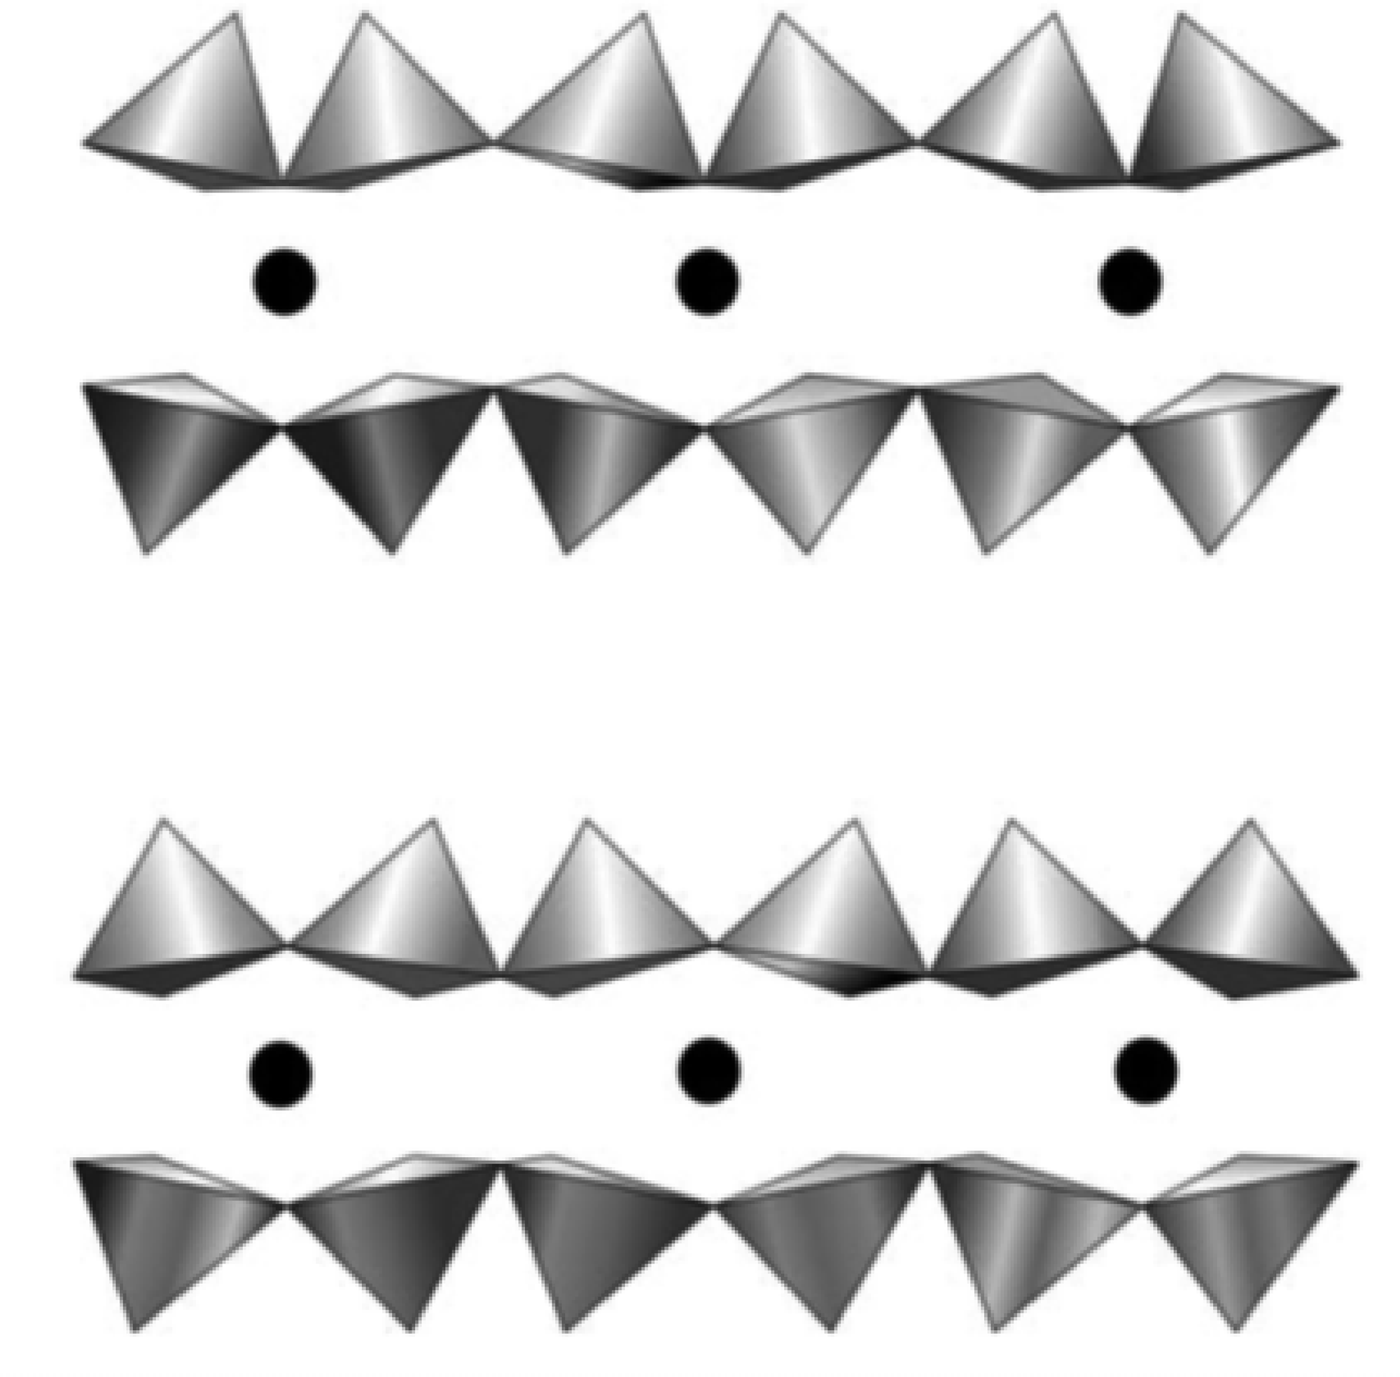
Along with the decrease in αtet values and the increase in inner K–O distances, the increasing contents of Si and Mg (R2+) lead to a decrease in the tetrahedral basal anion surface corrugation (tetrahedral tilt), as well as in the O–O distances across the interlayer (Table 8). Comparison of the interlayer structure in selected 2M 1 and 1M structures (Table 8) shows that 1M micas tend to have longer mean O–O distances across the interlayer and larger interlayer distances, <h int>, than those for 2M 1 varieties of similar cation compositions. The distribution of individual anion–anion distances in the interlayer in tv 2M 1 mica structures is similar to those in cv 1M structures, but differs from those in tv 1M structures because of a different mutual arrangement of depressed (O*) and non-depressed (O) basal oxygen anions in the tetrahedral sheets across the interlayer (Fig. 11). A 2M 1 structure has two longer O–O* distances and one shorter O–O distance, whereas in a 1M structure, there are two shorter O–O distances and one longer O*–O* distance (Table 8). At the same time, the shorter O–O distances in 1M micas are still longer than the shorter O–O distances in 2M 1 micas of similar composition because of shorter interlayer distances, possibly due to higher occupancy of the interlayer site. For aluminoceladonite-like varieties having the shortest O–O distance, this could favour the occurrence of the 1M structure as compared to the 2M 1 polytype.
Comparison of interlayer cavities in tv 2M 1 (upper) and 1M (lower) structures. In contrast to the 1M structure, distances between the nearest depressed and non-depressed basal oxygens atoms across the interlayer in the 2M 1 structure are partially equalized (see text for explanation) (modified after Drits et al., Reference Drits, McCarty and Zviagina2006).
Typical characteristics of the interlayer in 2M 1 refined structures,a a 2M 1 aluminoceladonite structure modelb and 1M structure models.c

a #12 = muscovite; #18 = phengite; #19 = aluminoceladonite; sample numbers as in Table 3.
b P13-1 = 2M 1 aluminoceladonite structure model.
c RM30, KJMC3 = illites; Mal-6, 136 = aluninoceladonites; sample names for 1M micas are in italics.
<h int> = mean interlayer distance; h imin = interlayer distance calculated over non-depressed basal oxygen anions; ΔZ = tetrahedral tilt.
Structure models with extrapolated unit-cell parameters
To elucidate the possible structural factors leading to a reduction of lateral dimensions from phengite to aluminoceladonite, the dependences of a and b parameters on Mg contents observed in the series of synthetic muscovite–phengite samples (group 1) were extrapolated to aluminoceladoite composition, and aluminoceladonite structures were modelled using the extrapolated a and b cell parameters. The increase in a and b from muscovites to phengites can be approximated as:
 $$a = 5.218 + 0.013\ln ({\rm Mg})$$
(esd = 0.002 Å; R2 = 0.970; p < 10–5) (Fig. 5a, dotted line), and:
 $$b = 9.041 + 0.018\ln ({\rm Mg})$$
(esd = 0.003 Å; R2 = 0.953; p < 10–5) (Fig. 5b, dotted line). For aluminoceladonite samples with Mg approaching 1 cation phfu (samples P13-1. P17, P11-2 and P18-2, Mg = 0.81-0.97 cations phfu), Eqs. 11 and 12 predict a = 5.215–5.218 Å and b ≈ 9.04 Å instead of the observed values of 5.20–5.21 Å and 9.016–9.028 Å, respectively. Attempts to model the structures of Si-rich (Si ≈ 4 cations phfu) synthetic micas (samples P13-1 and P17) using extrapolated a and b cell parameters show that the models (P13-1e and P17e, Supplementary Table S1) can only be realized with αtet forced to 0° and additional distortions of the tetrahedra, such as additional elongation of the bridging bonds T1–O3 and T2–O5 (1.645(5) Å and 1.642(7) Å, as compared to 1.641(5) Å and 1.635(7) Å, respectively, for the structure models based on the observed unit-cell parameters with αtet ≈ 3°). Moreover, forcing αtet to 0° leads to a redistribution of individual K–O bond lengths, leading to further minimization of the difference between the inner and outer K–O distances and further increases in the inner K–O distances (Table 7). As a result, the interlayer configuration, as well as the structure as a whole, should become less stable.
In group 2 micas, the increase in the b parameter from muscovites to phengites can be approximated as:
 $$b = 9.075 + 0.134\ln ({\rm Mg})$$
(R2 = 0.66) (Fig. 6, dotted line), which would predict b = 9.067 Å and 9.075 Å for Mg = 0.8 and 1 cations phfu, respectively. Obviously, such extremely large lateral dimensions in a mica with aluminoceladonite-like composition would require zero tetrahedral rotation, leading to structural effects similar to those in the P13-1e and P17e structure models.
Therefore, ensuring a larger αtet in order to stabilize the structure may serve, along with tetrahedral elongation and tetrahedral size reduction, as an additional factor leading to a decrease in the lateral dimensions.
Conclusion
The similarities in the variations of unit-cell parameters with cation composition observed in 2M 1 and 1M natural and synthetic K-dioctahedral micas imply that these variations should be controlled by similar structural factors. These factors, which are related to the ability of tetrahedral and octahedral sheets having different lateral dimensions to form a layer with uniform two-dimensional periodicity, are realized in a different manner in micas formed under different pressure and temperature conditions; that is, these structural factors are similar but not identical. Extremely high temperatures and pressures in a closed system under laboratory conditions allow structural readjustment of the differently sized tetrahedral and octahedral sheets for a wide range of cation compositions (from muscovite to aluminoceladonite through phengite). In nature, under the conditions of metamorphism, the temperatures and pressures are not high enough to enable this readjustment for the formation of micas with aluminoceladonite-like compositions, which, in particular, would require reductions of the a and b parameters to ensure higher tetrahedral rotation. Therefore, under high-pressure metamorphic conditions in Mg-rich environments, phengites are frequently formed in association with chlorites, which accumulate high quantities of Mg cations (Vidal & Parra, Reference Vidal and Parra2000, and references therein).
Unlike muscovites and phengites, micas in the illite–aluminoceladonite series are formed under low-temperature and low-pressure non-equilibrium conditions in systems with highly heterogeneous compositions. This suggests that, along with the structure, other factors might have a significant effect on the occurrence of 1M aluminoceladonite. At the same time, the readjustment of the lateral dimensions of tetrahedral and octahedral sheets in 1M K-dioctahedral micas may be facilitated by the more heterogeneous composition of the environment, leading to a wide range of cation compositions. Additional factors that could favour the occurrence of the 1M aluminoceladonite structure as compared to the 2M 1 polytype could be the relatively longer O–O distances across the interlayer and the relatively higher <h int> values.
Supplementary material
To view supplementary material for this article, please visit https://doi.org/10.1180/clm.2019.26
Author ORCIDs
Bella B. Zviagina, 0000-0001-6493-4361
Acknowledgements
The authors acknowledge the financial support of the budget project #0135-2016-0010. Thanks are due to O.V. Dorzhieva for help and discussion and to the anonymous reviewers for valuable comments.