The generally accepted definition of amblyopia is reduced visual acuity, despite best optical correction, when measured with an optotype chart, such as the LogMAR chart. Typically, a two-line difference between the eyes is taken as evidence of unilateral amblyopia. Special pediatric charts with single letters or pictures are used to test preschool children. Estimates of the prevalence of unilateral amblyopia in preschool children range between one and 3%, with the proportion depending somewhat on the ethnic composition of the study sample (MEPEDS, 2008; Friedman et al., Reference Friedman, Repka, Katz, Giordano, Ibironke, Hawse and Tielsch2009; Ying et al., Reference Ying, Maguire, Cyert, Ciner, Quinn, Kulp, Orel-Bixler and Moore2014). It is the most common cause of monocular visual impairment in children (Webber & Wood, Reference Webber and Wood2005; Gunton, Reference Gunton2013). A similar proportion of adults suffer from unilateral amblyopia (Attebo et al., Reference Attebo, Mitchell, Cumming, Smith, Jolly and Sparkes1998). Bilateral amblyopia is much less common (0.1-0.45%; Roboaei et al., Reference Robaei, Rose, Ojaimi, Kifley, Huynh and Mitchell2005; MEPEDS, 2008) and is generally associated with a history visual deprivation produced by cataracts, ptosis, or high refractive errors in both eyes.
Amblyopia has been subdivided traditionally based on the condition thought to be its cause, primarily strabismus (misaligned eyes) or anisometropia (difference in refractive error between the two eyes) or some combination of both, yielding the common labels of strabismic amblyopia, anisometropic amblyopia, and strabismic-anisometropia or mixed amblyopia. Amblyopia in patients with the rare history of deprivation is labeled deprivation amblyopia.
Does this classification, based on purported etiology, produce different functional types of amblyopia, or are there different functional types that would arise from some other classification scheme, or is amblyopia, however caused, essentially the same abnormality? This answer to these questions is especially important in determining the treatment because the etiology may not be fully apparent at the time that amblyopia is diagnosed, and different forms of amblyopia may require different management.
Classification based on visual function
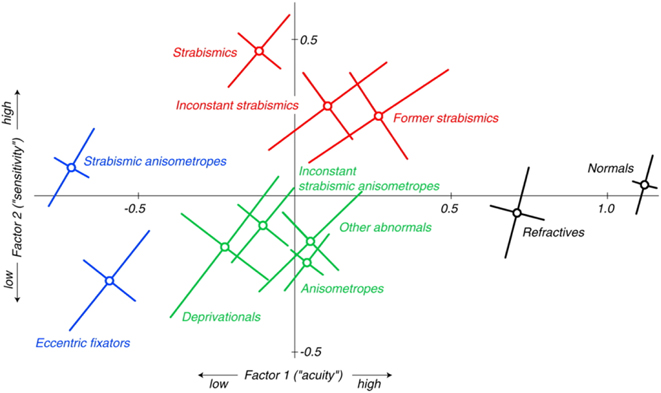
Numerous behavioral studies, made almost exclusively on adults with amblyopia, have suggested strongly that strabismus and anisometropia do indeed lead to different patterns of visual loss (Levi & Klein, Reference Levi and Klein1982a,Reference Levi and Kleinb, Reference Levi and Klein1985; Hess & Pointer, Reference Hess and Pointer1985). In the largest study to date, McKee et al. (Reference McKee, Levi and Movshon2003) measured the acuity and contrast sensitivity of 427 individuals either with amblyopia or with risk factors for amblyopia, e.g., strabismus or anisometropia, plus 68 normal control observers. Participants were assigned to one of eleven groups, based on their history and a detailed clinical examination of their oculomotor and refractive characteristics. Participants were not classified on the basis of their optotype (LogMAR) visual acuity; instead the study explored the relationships between optotype acuity and four other measures (grating acuity, vernier acuity, edge contrast sensitivity, and contrast sensitivity measured with Pelli-Robson chart). Statistical analysis of this large data set revealed that two factors accounted for about 80% of the variance separating the 11 clinical groups: an acuity factor and a sensitivity factor. In Fig. 1, the average sensitivity factor of the nonpreferred eyes (the eyes with the poorer acuity) is plotted versus the average acuity factor of the nonpreferred eyes for each of these clinically defined groups. Note that these groups include both amblyopic and nonamblyopic observers, e.g., all patients with pure strabismus whether amblyopic or not.
McKee et al. (Reference McKee, Levi and Movshon2003). The pattern of visual deficits in amblyopia. Journal of Vision 3, 380–405 (used with permission).

Figure 1 represents a kind of ‘map’ of amblyogenic conditions with the normal control group (black symbol) on the right showing the best acuity and the strabismic-anisometropic group (blue symbol) on the left showing the poorest acuity. Clearly, the strabismic groups (red symbols) and the anisometropic group (green symbol) fall in different sectors of this map, suggesting that different patterns of visual loss are associated with these different conditions. The difference between the red and green groups is largely dependent on a significant difference in contrast sensitivity. The strabismic groups are more sensitive than the anisometropes; indeed, they are significantly more sensitive than the normal controls, a curious hypersensitivity that may arise from the loss of binocularity. McKee et al. (Reference McKee, Levi and Movshon2003) speculated that the reorganization produced by the loss of binocularly-driven neurons would lead to a greater visual input to monocularly driven neurons, which would thus enhance their thresholds at lower contrast. Thus, they predicted that monocular contrast sensitivity in both eyes of the strabismic groups would be slightly better than normal, which is indeed what their results showed. Another item of interest in this map is that the deprivation group falls near the anisometropic groups, which may arise from the degraded retinal image produced by both anisometropia and deprivation.
What is missing from this map is an important functional difference between the strabismic groups and the anisometropic group—namely the quality of their binocular performance. In addition to their measures of contrast and acuity, McKee et al. (Reference McKee, Levi and Movshon2003) made two measurements of the binocular function. The first was a widely used clinical test of stereopsis—the Randot “Circles” test. Observers viewed the test circles with the best optical correction, but without prisms. The second test, binocular motion integration (BMI), was an experimental measure of the cortical capacity to integrate or fuse diverse images into a coherent motion. This test used the dichoptic quadrature motion stimulus devised by Reference Shadlen and CarneyShadlen and Carney (l986). Briefly, each eye viewed a horizontal sinusoidal grating whose contrast was modulated sinusoidally at 2 Hz. The stimuli presented to the two eyes were spatially and temporally 90 deg out of phase; the direction of the phase shift determined whether the gratings appeared to move up or down. Observers were asked to judge the direction of motion for 30 trials. Performance on each of these two tests was graded as ‘pass–fail’. If an observer had any measureable stereopsis based on the Circles test, he or she was given a pass. In the BMI test, an observer was given a pass if he or she correctly judged the direction of motion on more than 70% of trials. About 80% of participants either passed both tests or failed both; all normal observers passed both. Most members of the strabismic groups (∼90%; red and blue symbols) failed both measures, but a significant proportion of anisometropes (∼64%) passed both. In short, based on these tests, most of the strabismic participants had difficulty combining the information binocularly, while the majority of anisometropic participants retained this capability.
Although the classification scheme shown by the ‘map’ is based on rigorous psychophysical measurements made on a large sample of the participants, it can be criticized on many grounds. First, the psychophysical measurements tested only acuity, contrast sensitivity, and binocular functioning. A different configuration might emerge if more functions had been tested. Some types of motion judgments (Simmers et al., Reference Simmers, Ledgeway, Hess and McGraw2003; Ho & Giaschi, Reference Ho and Giaschi2006; Thompson et al., Reference Thompson, Richard, Churan, Hess, Aaen-Stockdale and Pack2011), subitizing (counting number of items seen during a brief presentation; Sharma et al., Reference Sharma, Levi and Klein2000), and attentional control (Popple & Levi, 2008; Farzin & Norcia, Reference Farzin and Norcia2011) have been shown to be abnormal in amblyopia. The inclusion of oculomotor measurements might also alter the classification scheme since they appear to vary with amblyogenic conditions. Many studies have found that strabismic patients with amblyopia show poorer oculomotor control than anisometropic patients with amblyopia; their fixation is much more unsteady, and the latency of their saccades is also longer (Schor & Hallmark, Reference Schor and Hallmark1978; Cuiffreda et al., Reference Cuiffreda, Kenyon and Stark1979; Zhang et al., Reference Zhang, Stevenson, Cheng, Laron, Kumar, Tong and Chino2008; Niechwiej-Szwedo et al., Reference Niechwiej-Szwedo, Goltz, Chandrakumar, Hirji and Wong2010; Gonzalez et al., Reference Gonzalez, Wong, Niechwiej-Szwedo, Tarita-Nistor and Steinbach2012; Niechwiej-Szwedo et al., Reference Niechwiej-Szwedo, Chandrakumar, Goltz and Wong2012; Chung et al., Reference Chung, Kumar, Li and Levi2015; McKee et al., Reference McKee, Levi, Schor and Movshon2016). It is also possible to break down the clinical groups shown in the map into further subgroups. For example, there is considerable evidence that the early onset (infantile) strabismus produces different functional deficits than those of the late onset (refractive) strabismus (Schor et al., Reference Schor, Fusaro, Wilson and McKee1997; Brosnahan et al., Reference Brosnahan, Norcia, Schor and Taylor1998; Sloper, Reference Sloper2016).
Another problem with the ‘map’ is the categorical designation of the clinical groups. These designations were based on measurements made by ophthalmologists and optometrists who had been trained on an extensive clinical protocol. Strabismus and anisometropia were defined by the conventional criteria at the time of the study: a difference between the eyes of 1 diopter in refractive error at the maximum anisometropic meridian for anisometropia; eye movement seen under unilateral and alternating cover tests at near (0.3 m) and distance (6 m) for constant strabismus. The dichotomy between these two conditions might have been less obvious if more precise measurements of ocular alignment had been used (Hunter et al., Reference Hunter, Patel and Guyton1999; Gramatikov et al., Reference Gramatikov, Zalloum, Wu, Hunter and Guyton2007). Were the two eyes of the amblyopic members of the anisometropic group really aligned within the normal range? About half of the patients with anisometropic amblyopia passed both of our binocular tests, so we do know that their binocular functioning was better than that of the amblyopic members of the designated strabismic groups. However, it is intriguing that other functional characteristics (vernier acuity, saccadic latency) of the patients with anisometropia who failed both of our binocular tests were somewhat similar to strabismic patients (McKee, Reference McKee1998; McKee et al., Reference McKee, Levi, Schor and Movshon2016). Generally, the nonbinocular anisometropic patients were those with the poorest acuity in their nonpreferred eye—individuals suffering from severe unilateral amblyopia. If they had no capacity for binocular integration, what mechanism was keeping their eyes aligned? A more sensitive measure of alignment might have revealed that these nonbinocular anisometropic patients were microstrabismic.
The fluidity of these categories probably reflects the complex interaction between refractive error (spherical, astigmatic and anisometropic), spatial visual performance, and eye alignment during development. Apparently similar infants can develop along quite different paths (Babinsky & Candy, Reference Babinsky and Candy2013; Barrett et al., Reference Barrett, Bradley and Candy2013). Thus a patient with strabismic amblyopia may present with quite different forms (ranging from intermittent exotropia, or microtropia to constant alternating or unilateral esotropia) and different forms of neural adaptation or consequence (from suppression to diplopia). We are yet to fully understand the factors that predict the developmental path different infants will take and that define the range of untreated visual function that presents for an examination in a clinic.
In conclusion, it may be more useful to describe prototypes that differ but have unclear boundaries between them, rather than to assign amblyopic individuals or individuals at risk for amblyopia to distinct clinical categories.
Does classification matter?
Despite the vast amount of basic research demonstrating that different patterns of functional loss are associated with different amblyogenic conditions, the presenting condition does not predict treatment outcome. Following patching or penalization, which force use of the amblyopic eye by depriving the fellow eye of vision, patients classified as suffering from strabismic and anisometropic amblyopia, treated before age 7, both show the same amount of improvement in acuity (PEDIG, 2003a,b,c,d). One could argue either that the patients were misclassified due to insensitive measures of misalignment or that this analysis was too narrowly focused on acuity and that more extensive testing including measures of contrast sensitivity and binocularity (Bosworth & Birch, Reference Bosworth and Birch2003; Birch, Reference Birch2013) would show that the associated condition does matter to the outcome. Using a battery of tests to classify the patients might lead to a better prediction of the outcome, although obtaining reliable behavioral measures in preschoolers, the age at which amblyopia or an amblyogenic condition is diagnosed, is challenging. However, a test battery might be prognostic in older patients with amblyopia in whom a later intervention is being contemplated and provide insight on treatment of young patients with amblyopia if more reliable behavioral measures in preschoolers become available.
Future directions
• It would be useful to agree on a common set of sensitive tests that can be used clinically and in research to classify patients with amblyopia. That list should include measures of crowded acuity (acuity measured with symbols spaced as in words), contrast sensitivity, and binocular functions (stereopsis and binocular interactions). Models of binocular interactions are necessary to understand patterns of empirically observed binocular suppression in different behavioral paradigms (Huang et al., Reference Huang, Zhou, Lu and Zhou2011). Normative data for agreed-upon measures are needed at different ages. Although some of the measures may not be possible with very young children, the patterns found in older children can inform the understanding of etiology and possibly effective treatments. There is an urgent need for both more efficient and precise behavioral measurements of the functional vision (e.g., Lesmes et al., Reference Lesmes, Lu, Baek and Albright2010) as well as theoretical models that link core visual deficits in amblyopia to the observed poor visual performance of patients with amblyopia.
• One of the major problems in amblyopia is regression—a return to amblyopic acuity levels following successful treatment. Clinical classification, based on amblyogenic condition, may be useful in determining who is likely to regress, and thus, who may benefit from additional treatment or alternative treatments during elementary school years.
• Currently, there are a variety of new experimental treatments, involving perceptual learning, video game play, and dichoptic presentation (Zhou et al., Reference Zhou, Huang, Xu, Tao, Qiu, Li and Lu2006; Li et al., Reference Li, Ngo, Nguyen and Levi2011; Hess et al., Reference Hess, Thompson, Black, Machara, Zhang, Bobier and Cooperstock2012). These new treatments might be especially useful for improving acuity in older children and young adults who have residual amblyopia following treatment as children. Here again, a new classification system may predict who will benefit from these new treatments.
• As part of a new classification system, it would be worthwhile to pursue research on genetic markers and epigenetic factors, which may predict which patients with amblyopia are likely to resist treatment or to regress to poor acuity following treatment. Special treatment protocols could be developed for those individuals whose risk profiles, based on a new classification, will make them more likely to suffer from persistent amblyopia.
Acknowledgments
The authors would like to thank Michael Richards,* who served as scribe for this discussion section. We would also like to thank all discussion group participants: Rowan Candy, Alistair Fielder, Irene Gottlob, Creig Hoyt, Paul Harris, Jonathan Holmes, Zhong-Lin Lu, John Sloper, and Ben Thompson.
*Department of Ophthalmology and Vision Science, University of Toronto, Hospital for Sick Children, Toronto, ON, Canada.