Introduction
It has been nearly 60 years since I thought of the chemistry of solid materials as an area that provided great scope for research, because the subject was in its infancy.Reference Rao and Gopalakrishnan1,Reference Rao and Biswas2 It was also an area where I could make some contribution from India, where laboratory facilities were meager. There was little support at that time to buy instruments or set up a well-equipped laboratory. There were no spectrometers or x-ray diffractometers. Having returned from the US after several years of productive stay, it was a testing time for me to initiate a meaningful research program in the late 1950s in India. Instead of spectroscopy and molecular structure being the main focus of my research, I started working on simple materials chemistry problems. Some aspects of electronic as well as vibrational spectroscopy were still pursued, using whatever facility was available in India, often depending on help from friends abroad.
The first problem that we addressed was the transformation of the anatase and brookite forms of TiO2 to the rutile form.Reference Czanderna, Rao and Honig3–Reference Rao, Yoganarasimhan and Faeth5 We studied kinetics and other aspects of the transformations using a tiny powder diffraction camera. Phase transformation of alkali halides was next, including an experimental study of the transformation of CsCl and its solid solutions with KCl.Reference Rao, Rao and Rao6 The Born model was used to explain the stability of phases. We also started to carry out calculations on point defects in ionic solids. My interest in phase transitions in solids continued, and I eventually wrote a bookReference Rao and Rao7 on the subject with K.J. Rao.
From 1950 to 1970, one of the main preoccupations of chemists working on solids was understanding nonstoichiometry. The problem was explaining the structures and stabilities of materials such as Ti4O7, Pr6O11, and Fe7S8 (in contrast to NaCl or ZnO). I wanted to study praseodymium and terbium oxides, which exhibit a series of compositions between Pr2O3 (Tb2O3) and PrO2 (TbO2). By treating these oxides as belonging to the homologous series, LnnO2n–2 or 2Ln2O3·mLnO2 (Ln = rare earth), we could leach out the trivalent ions by dilute acid and obtain PrO2 and TbO2 as solid residues.Reference Sastry, Mehrotra and Rao8
 $${\rm{P}}{{\rm{r}}_{\rm{6}}}{{\rm{O}}_{{\rm{11}}}} \equiv {\rm{P}}{{\rm{r}}_{{\rm{12}}}}{{\rm{O}}_{{\rm{22}}}}\,\,\buildrel {{{\rm{H}}^{\rm{ + }}}} \over \longrightarrow \,\,8{\rm{Pr}}{{\rm{O}}_{\rm{2}}}({\rm{s)}} + 4{\rm{P}}{{\rm{r}}^{{\rm{3 + }}}}({\rm{aq)}}$$
 $${\rm{Tb}}_{\rm{4}}^{}{{\rm{O}}_{\rm{7}}} \equiv {\rm{T}}{{\rm{b}}_{\rm{8}}}{{\rm{O}}_{{\rm{14}}}}\,\,\buildrel {{{\rm{H}}^{\rm{ + }}}} \over \longrightarrow \,\,4{\rm{Tb}}{{\rm{O}}_{\rm{2}}}({\rm{s}}) + 4{\rm{T}}{{\rm{b}}^{{\rm{3 + }}}}({\rm{aq}})$$
This simple procedure helped us to obtain these dioxides, which are otherwise difficult to prepare. I believe this to be one of the earliest examples of chimie douce (soft chemistry).
For a few years after my return to India, I felt that transition-metal oxides would be an ideal area to study, on a long-term basis, since they exhibit a variety of interesting properties and phenomena.Reference Goodenough9–Reference Rao and Raveau13 By the late 1960s, nonstoichiometry was no longer a puzzle, and new structural principles such as shear planes, block structures, and defect complexes had been discovered.
My experimental work depended on gifted chemicals, simple fabricated devices, and occasional measurements using sophisticated equipment elsewhere. I had to build my own furnaces, a thermobalance using a quartz spring, and develop simple means of measuring electrical properties of materials from liquid-nitrogen temperature to 1000°C. In what follows, I first discuss my explorations of oxide materials and then describe various important areas of materials science to which I have been able to contribute in recent years. These include hybrid materials (metal–organic frameworks), fullerenes, nanotubes, and a variety of nanomaterials, including two-dimensional (2D) nanosheets of inorganics. In carrying out these studies, we employed a variety of synthetic strategies and several means of characterization and structure elucidation.Reference Rao and Gopalakrishnan1,Reference Rao and Biswas2
Transition-metal oxides
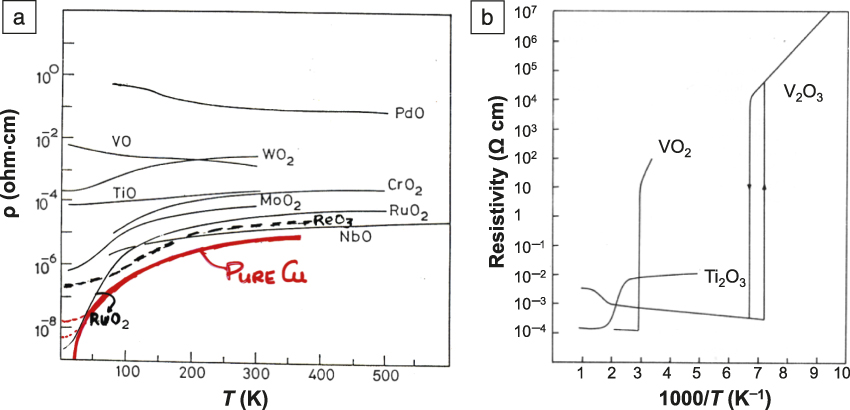
When research on transition-metal oxide systems began in the 1960s, many metallic oxides were discovered (Figure 1a).Reference Rao11–Reference Rao and Raveau13 For example, ReO3 had the appearance of and conducted like copper. Oxides exhibiting metal–insulator (M–I) transitions (Ti2O3, VO2, V2O3) were soon discovered (Figure 1b). V2O3 undergoes a transition with a 10-million-fold jump in resistivity at 150 K, when there is also a transition to the antiferromagnetic state. Work was conducted on metallic oxides as well as oxides showing M–I transitions.Reference Rao11,Reference Edwards, Ramakrishnan and Rao12
(a) Electrical resistivities of highly conducting (metallic) oxides. (b) The well-known metal–insulator transition in metal oxides. Note: ρ, resistivity; T, temperature.

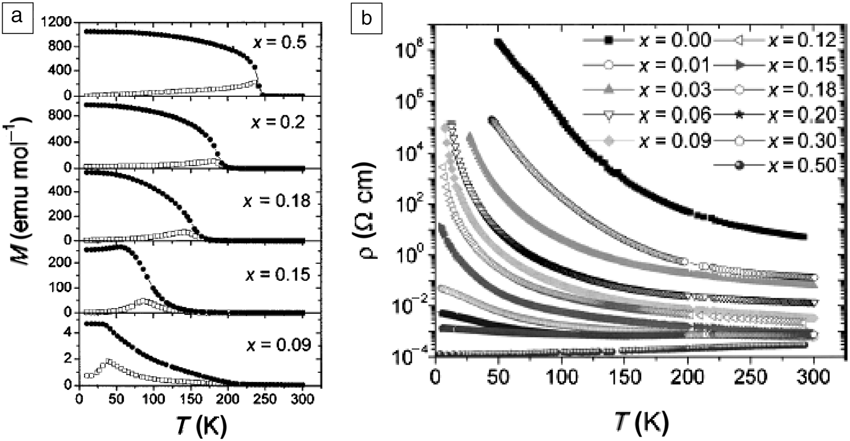
Around 1965, work on properties and phenomena exhibited by perovskite oxides began, in particular, on perovskites of the type LnBO3 (Ln = La–Lu or Y and B = Ti-Cu), which exhibit a fantastic variety of properties.Reference Goodenough9–Reference Rao and Raveau13 LaCrO3 and other chromites are antiferromagnetic insulators. LaCoO3 shows an interesting spin-state transition involving low and intermediate spin states of Co3+, whereas LaNiO3 is a metal. We worked on the effect of various types of substitutions (e.g., Sr2+ in LaCoO3, as well as solid solutions of different perovskites) on the magnetic and electronic properties. Particularly noteworthy is the La1–xSrxCoO3 system, which shows a decrease in electrical resistivity with increase in x, the x = 0.5 composition being a ferromagnetic metal (Figure 2).Reference Wu and Leighton14 Mössbauer studies showed that rapid electron transfer occurs between the 3+ and 4+ states of cobalt.Reference Bhide, Rajoria, Rao, Rao and Jadhao15 My resolve to pursue research in materials chemistry got strengthened by my one-year stay at the University of Oxford as a visiting professor in 1974. It was in Oxford that I had for the first time all of the facilities I needed, and I could carry out many studies, including high-resolution electron microscopy and photoemission spectroscopy. I then decided to build a laboratory with similar facilities in India.
(a) Magnetic and (b) electrical resistivity behavior of La1–xSrxCoO3. LaCoO3 is a semiconductor, but with the substitution of Sr in place of La with x > 0.2, La1–xSrxCoO3 exhibits a metal-like temperature dependence. Note: M, magnetization; T, temperature; ρ, resistivity. Reproduced with permission from Reference Wu and LeightonReference 14. © 2003 American Physical Society.

High-temperature superconductivity
The discovery of high-temperature superconductivity in 1986 created a sensation, having broken the apparent 23 K barrier. This was discussed at an international conference at Bangalore. Soon after I gave my lecture, P. Anderson, from Princeton University, asked “Have you heard of the high T c (35 K; T c is critical temperature) superconductor?” When I asked him what the material was, he said that it is an oxide with lanthanum and copper. I got curious and asked him “Is it La2CuO4?” When he nodded yes, I got truly excited since I had worked on La2CuO4 as early as 1970 and shown it to be an antiferromagnetic insulator.Reference Ganguly and Rao16,Reference Ganguly and Rao17 Upon doping with holes (Sr, Ba, or O) it becomes a 35 K superconductor.
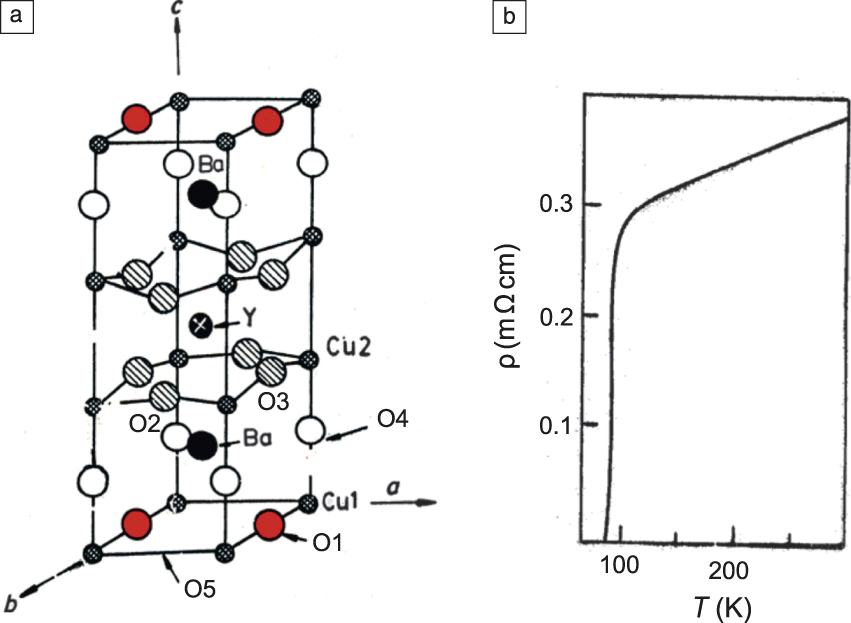
I started working on a number of Ln2CuO4 compounds with the 2D K2NiF4 structure as well as related structures. While this yielded interesting results, I worked with other researchers around the world looking for a liquid-nitrogen superconductor (T c > 77 K). Wu et al. reported a cuprate that showed high T c close to 90 K, however, the composition and structure were not known. In February 1987, we successfully characterized YBa2Cu3O7 (123) in all respects (Figure 3).Reference Rao, Ganguly, Raychaudhuri, Ram and Sreedhar18 We made magnetic measurements using Raychaudhuri’s home-built apparatus.
YBa2Cu3O7, the first liquid-nitrogen superconductor. (a) Crystal structure.Reference Rao11 (b) Resistivity versus temperature plot.Reference Rao, Ganguly, Raychaudhuri, Ram and Sreedhar18 Cu1 and Cu2 represent Cu at different crystallographic sites and O1, O2, O3, and O4 represent O at different crystallographic sites. O5 represents O vacancy site. Note: T, temperature; ρ, resistivity.Reference Rao, Ganguly, Raychaudhuri, Ram and Sreedhar18

We worked on the various properties of 123 compounds, including the nonresonant microwave absorption. Chemists prepared a number of novel cuprates during that time, and we contributed to this effort.Reference Rao and Ganguli19 Superconductors became chemicals and chemistry was recognized as an important part of materials science.Reference Rao20
Colossal magnetoresistance
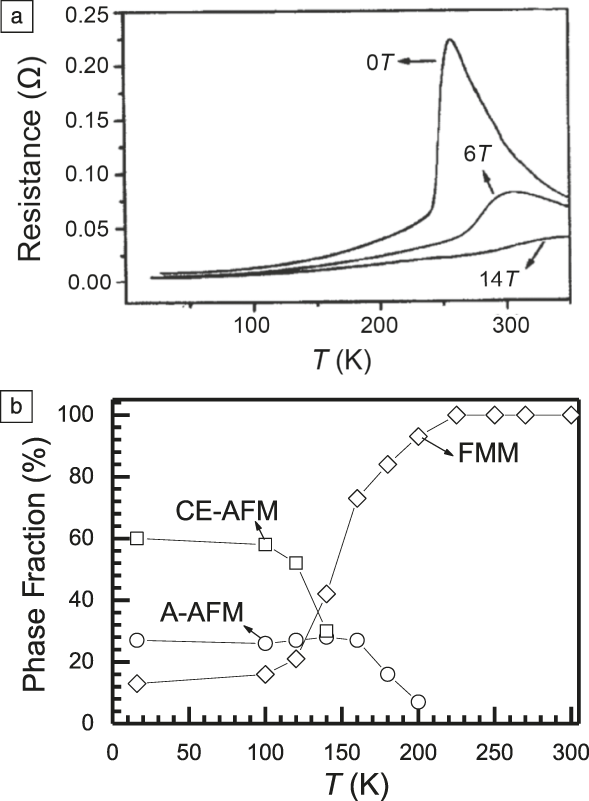
We studied magnetic and other properties of rare-earth manganites in the late 1970s and early 1980s. Substitution of La in LaMnO3 by Sr makes it metallic and ferromagnetic, while substitution by Ca gives rise to a charge-ordered antiferromagnetic state. Observation of large magnetoresistance around the magnetic transition of La1–xCaxMnO3 and related materials caused great interest (Figure 4a).Reference Rao and Raveau21 These materials exhibit interesting properties such as charge ordering and orbital ordering,Reference Rao22,Reference Shenoy and Rao23 aspects that Goodenough had discussed earlier.Reference Goodenough24
(a) Rare-earth manganites and CMR. The manganites exhibit a peak in resistivity indicating insulator–metal transition and colossal magentoresistance on application of a magnetic field. (b) Electronic phase separation in Nd0.5Sr0.5MnO3. Volume fraction of phases as a function of T indicates the simultaneous existence of CE-AFM, A-AFM, and FMM. Here, CE and A represent different types of AFM phases.Reference Rao and Raveau21,Reference Woodward, Cox, Vogt, Rao and Cheetham25 Note: CMR, colossal magnetoresistance; T, temperature, FMM, ferromagnetic and metallic; AFM, antiferromagnetic.

While colossal magnetoresistance itself was of great interest, properties of the charge-ordered (CO) state revealed many fascinating features. The robust CO state can be melted into a metallic ferromagnetic state by magnetic fields, chemical substitution, and electric fields. The most interesting aspect is that many of the CO manganites exhibit electronic phase separation, wherein a seemingly pure single-phase material at room temperature, on cooling to lower temperatures exhibits more than one phase.Reference Rao22,Reference Shenoy and Rao23 This is a reversible phenomenon. The most vivid example is that of Nd0.5Sr0.5MnO3 (Figure 4b), which is ferromagnetic and metallic (FMM) at 300 K and transforms to an antiferromagnetic state at 200 K, and to another antiferromagnetic CO state at 150 K. At low temperatures close to 0 K, the FMM state coexists along with the two antiferromagnetic states.Reference Woodward, Cox, Vogt, Rao and Cheetham25 When we first discovered this phenomenon, we had difficulty in getting the work accepted. Various aspects of electronic phase separation in manganites have since been discussed in the literature.Reference Rao and Raveau21–Reference Shenoy and Rao23
Magnetoelectrics
Coexistence of ferroelectricity and ferromagnetism in a material was considered difficult or impossible because of the entirely different requirements of the two phenomena. Many oxides have since been found to be multiferroic or magnetoelectric because of the coupling between the two order parameters.Reference Rao, Sundaresan and Saha26 This can arise from different causes with an interesting case being ferroelectricity having a magnetic origin. An example of this is TbMnO3.
We have worked on TbMnO3 as well as the better-known BiFeO3. We had proposed that rare-earth chromites, LnCrO3, were ferroelectric although they possess a centrosymmetric structure. We could establish the presence of local noncentrosymmetry by pair distribution function analysis of neutron diffraction data.Reference Ramesha, Llobet, Proffen, Serrao and Rao27 It was proposed that BiMnO3 is both ferromagnetic and ferroelectric, the former due to orbital ordering. Again, the problem was the centrosymmetric structure. It was found that slight oxygen nonstoichiometry renders the material noncentrosymmetric.Reference Eggeman, Sundaresan, Rao and Midgley28 A serious problem with many of the studies of multiferroics has to do with the leaky nature of the materials. Stringent procedures have been proposed recently to ensure that a material is ferroelectric in spite of its leaky nature.
Hybrid frameworks and other novel materials
Organic–inorganic hybrids have been of interest to me for some time and have emerged to provide a variety of novel materials with interesting properties.Reference Cheetham and Rao29 In particular, we have synthesized, characterized, and studied properties of several metal–organic frameworks and also examined the mechanism of formation of these materials starting from zero-dimensional molecular species to three-dimensional networks.Reference Rao, Natarajan, Choudhury, Neeraj and Ayi30 Besides investigating frameworks based on phosphates,Reference Murugavel, Choudhury, Walawalkar, Pothiraja and Rao31 carboxylates,Reference Rao, Natarajan and Vaidhyanathan32 and sulfates,Reference Rao, Behera and Dan33 we have provided a method of classifying these materials.Reference Cheetham, Rao and Feller34
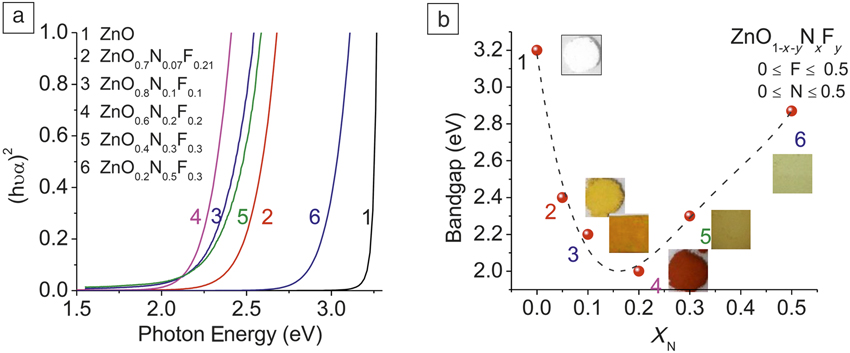
One of the main objectives of the chemistry of materials is not only to synthesize new and novel materials, but also to explore new ways of doing so. One of the strategies that we have employed to design inorganic materials with significantly different electronic and other properties has been to carry out aliovalent anion substitution, rather than isovalent anion substitution or cation substitution (e.g., Zn2NF35). We can vary the bandgap of ZnO by this means, as illustrated in Figure 5. We replaced sulfur in CdS or ZnS by P and Cl to alter the bandgap and associated properties.Reference Rao36
N, F-doped ZnO and their properties. (a) Tauc plots of N, F-doped ZnO and (b) variation of bandgap with the N content (x N). Bandgap of the material varies with the composition of N, F-doped ZnO. Inset represents photographs of the materials.Reference Lingampalli, Manjunath, Shenoy, Waghmare and Rao35 Note: x N, fraction of N; h, Planck’s constant; ν, wave number; α, extinction coefficient.

Nanomaterials
My interest in nanomaterials was stimulated by the question, “How many atoms make a metal?” We started investigating this problem in the mid-1980s by employing photoemission spectroscopy along with electron microscopy.Reference Rao, Vijayakrishnan, Sarma and Chainani37,Reference Vijayakrishnan, Chainani, Sarma and Rao38 A study of gold clusters showed that particles close to 1 nm in diameter were nonmetallic. Such nonmetallic gold and nickel have active surfaces. We also examined thiol-covered metal particles and the lattices they formed.Reference Rao, Kulkarni, Thomas and Edwards39
Kratchmer et al. reported the laboratory preparation of C60 and C70 in 1990, and we started examining several of their properties. Phase transitions of C60 and C70, especially under pressure, were investigated.Reference Rao and Seshadri40,Reference Chandrabhas, Sood, Muthu and Rao41 An aspect of this study, which included Raman spectroscopy, was to understand why C60 became irreversibly amorphous under pressure while C70 was reversibly amorphous. In 1991, soon after the discovery of carbon nanotubes (CNTs), we started making them by arc discharge and other methods and examined many chemical and physical properties.Reference Rao and Govindaraj42 Functionalization of CNTs and using them as templates were some aspects of these studies. Synthesis and characterization of inorganic fullerenes and nanotubes, especially the latter, were major efforts in the laboratory.Reference Rao and Govindaraj43
As nanomaterials gained great popularity, we started working on a variety of nanoparticles and nanowires of oxides, nitrides, and sulfides as well as nanotubes (specifically of chalcogenides).Reference Rao, Matte, Voggu and Govindaraj44,Reference Rao, Deepak, Gundiah and Govindaraj45 Some of the nanomaterials were novel, as exemplified by metallic ReO3 nanoparticles.Reference Biswas and Rao46 Functionalization of inorganic nanoparticles was accomplished. Novel methods of synthesis were discovered, the use of the liquid–liquid interface being one of them.Reference Rao and Kalyanikutty47 By this method, we could make ultrathin films containing nanoparticles or 2D sheets, some of which were single crystalline (e.g., CuS). The mechanism of formation of these nanostructures was examined by the study of ultrathin films at the interface by x-ray and neutron techniques.
CNTs doped with B or N as well as Y-junction nanotubes were made using appropriate reactants.Reference Panchakarla, Subrahmanyam, Saha, Govindaraj, Krishnamurthy, Waghmare and Rao48,Reference Voggu, Govindaraj and Rao49 A simple method to separate semiconducting and metallic carbon nanotubes was discovered,Reference Voggu, Rao, George and Rao50 in addition to a method of making metallic nanotubes exclusively. Doping CNTs by molecular charge-transfer was also accomplished.Reference Rao and Voggu51 A major result from this laboratory is that all inorganic nanomaterials are weakly ferromagnetic, although they do not possess intrinsic magnetism.Reference Sundaresan and Rao52 Proper theory for this observation is still lacking.
Two-dimensional nanomaterials
Discovery of one-atom-thick 2D graphene with its amazing properties has prompted research on other 2D nanomaterials. We examined several aspects of graphene, such as functionalization, gas adsorption, and interactions with electron donors and acceptors.Reference Rao and Voggu51,Reference Rao, Sood, Subrahmanyam and Govindaraj53,Reference Rao and Sood54 Early in the game, we fabricated the first supercapacitor with graphene and initiated a major program on the inorganic analogues of graphene.Reference Rao and Waghmare55–Reference Late, Liu, Matte, Dravid and Rao59 Graphene, along with nanodiamond and CNTs, exhibits synergy in mechanical properties.
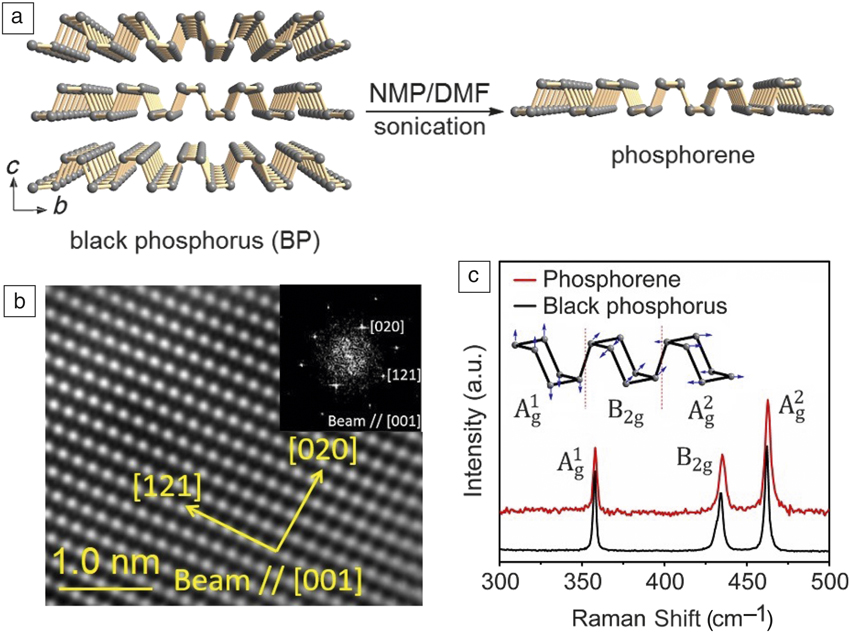
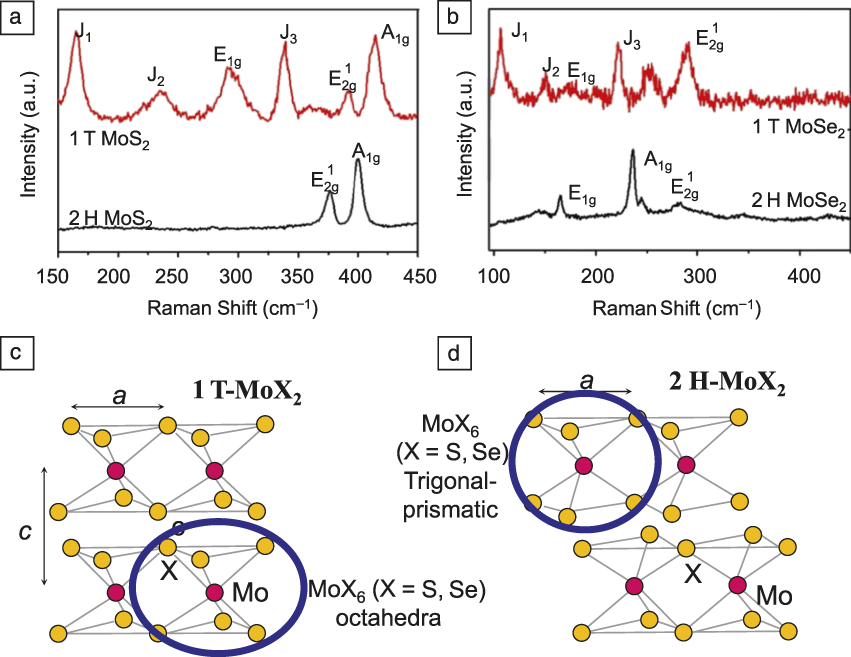
We have synthesized 2D nanosheets of various metal dichalcogenides, including MoS2, by various methods. Unlike graphene, simple layers of many other inorganic layered compounds are not planar sheets (see Figure 6 showing a single layer of phosphorene).Reference Vishnoi, Rajesh, Manjunatha, Bandyopadhyay, Barua, Pati and Rao60 While single layers of MoS2 prepared by mechanical exfoliation or ultrasonication are in the 2 H form (hexagonal unit cell), those obtained by lithium intercalation followed by exfoliation are in the 1 T form (trigonal unit cell), which is metallic. The coordination of Mo in the two forms is different, and Raman spectra show distinct differences (Figure 7). The single-layer 2 H nanosheets exhibit many novel properties,Reference Rao and Maitra56,Reference Rao, Maitra and Waghmare57 such as highly intense photoluminescence since it is a direct bandgap semiconductor. The 2 H form has been used for many applications, including gas sensors and supercapacitors. Batteries and field-effect transistors have been fabricated using 2 H sheets.Reference Rao, Maitra and Waghmare57–Reference Late, Liu, Matte, Dravid and Rao59 The 1 T forms of MoS2 and MoSe2 are excellent photochemical catalysts for generating hydrogen.Reference Rao and Maitra56,Reference Rao, Maitra and Waghmare57 MoS2 and MoSe2 sheets in the 1 T form can be functionalized through nucleophilic substitution.Reference Vishnoi, Sampath, Waghmare and Rao61
Single layer of phosphorene. (a) Schematic of synthesis, (b) transmission electron microscope image (inset: Fourier transform), and (c) Raman spectrum (inset: blue arrows indicate optical phonon modes) of a single layer of phosporene. Note: NMP, N-methyl-2-pyrrolidone; DMF, N,N-dimethylformamide.Reference Vishnoi, Rajesh, Manjunatha, Bandyopadhyay, Barua, Pati and Rao60

Raman spectra of 1 T and 2 H phases of (a) MoS2 and (b) MoSe2 sheets. Due to the difference in structure, new Raman modes arise in the 1T form, named as J1, J2, and J3. (c–d) Metal coordination in 1 T and 2 H phases, respectively. Red and yellow balls represent Mo and S atoms, respectively.Reference Rao, Maitra and Waghmare57 Note: 1 T, trigonal unit cell; 2 H, hexagonal unit cell.

Single and few layers of oxides such as MoO3 and Bi5Ti3O12 have been generated using ultrasonication or Li intercalation. Single layers of BN and many other layered materials (e.g., GaS, GaSe) have been investigated.Reference Rao and Waghmare55 An especially noteworthy case is that of the borocarbonitrides, BxCyNz, which contain BN and graphene domains in addition to BCN rings.Reference Rao and Gopalakrishnan62 They exhibit impressive gas adsorption and catalytic properties and also have potential applications in energy devices.
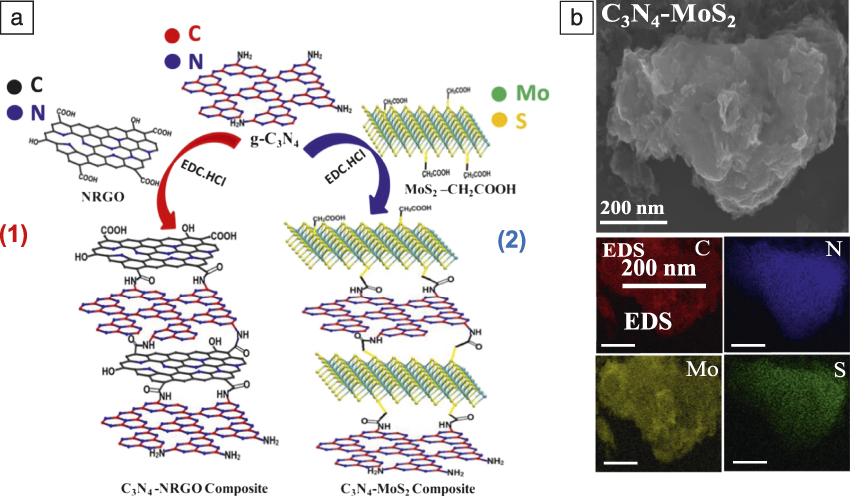
A recent development has been to covalently link layers of the same material (graphene, MoS2) or two different materialsReference Rao, Pramoda and Kumar63 (graphene-BN, graphene-MoS2, MoS2-C3N4) as shown in Figure 8. These nanocomposites possess unique properties that are distinctly different from those of van der Waals heterostructures. Thus, MoS2-C3N4 is a good electrocatalyst for hydrogen generation.Reference Rao, Pramoda and Kumar63,Reference Pramoda, Gupta, Chhetri, Bandyopadhyay, Pati and Rao64 The best example of an electrocatalyst comparable to platinum is the nanocomposite, BC7N-MoS2.Reference Pramoda, Ayyub, Singh, Chhetri, Gupta, Soni and Rao65 Making sheets of the stable 2 H-MoS2 is therefore useful for the purpose.Reference Pramoda, Gupta, Chhetri, Bandyopadhyay, Pati and Rao64
(a) Schematic of synthesis of covalently cross-linked C3N4-MoS2 and C3N4-NRGO nanocomposites. EDC is used as a coupling reagent. (b) (Top) FESEM image showing that 3D assemblies are generated due to cross-linking and (bottom) elemental mapping of C3N4-MoS2. Scale bars in the EDS images = 200 nm. Note: NRGO, nitrogenated reduced graphene oxide; EDC, N-(3-(dimethylamino)propyl)-N′-ethylcarbodiimide hydrochloride; FESEM, field-emission scanning electron microscope; EDS, energy-dispersive spectroscopy; g-C3N4, graphitic carbon nitride.Reference Pramoda, Gupta, Chhetri, Bandyopadhyay, Pati and Rao64

Concluding remarks
Six decades is a long period and materials research has changed in many ways during this time, periodically providing many astounding discoveries. In trying to cover my long journey in a limited time and space, I could not cover many interesting aspects. For example, the entire area of thermal, electrochemical, and photochemical water splittingReference Rao, Lingampalli, Dey and Roy66–Reference Chhetri, Sultan and Rao68 has not been included here.
Chemistry of materials has emerged to become a major stream of chemistry. It has been fascinating to see the subject grow over the decades and to grow with it. It has been pure pleasure working in this area with my young students. This article attempts to provide the flavor of the research work that I have carried out for 60 years.
Acknowledgments
I thank the funding agencies, especially the CSIR and the Department of Science and Technology of India, for continued support. I thank Sheikh Saud of Ras Al Khaimah, UAE, for supporting my research work. I express my gratitude to all of my students and other coworkers. I gratefully remember the encouragement and inspiration received from C.V. Raman, H.C. Brown, L. Pauling, K.S. Pitzer, J.S. Anderson, and N.F. Mott.

C.N.R. Rao is the Linus Pauling Research Professor at the Jawaharlal Nehru Centre for Advanced Scientific Research, India. He obtained his PhD degree from Purdue University, and DSc degree from the University of Mysore, India. He has published more than 1000 research articles in the area of materials chemistry, and has authored or edited nearly 30 books. He is a member of The Royal Society, US National Academy of Sciences, and the American Philosophical Society, as well as the French, Russian, Japanese, Chinese, Brazilian, and other science academies. He has received the Hughes and Royal Medals from The Royal Society, the Dan David Prize for materials research, and the August Wilhelm von Hofmann Medal from the German Chemical Society. He was awarded India’s highest civilian honor, Bharat Ratna (Jewel of India), by the president of India in 2013. Rao can be reached by email at cnrrao@jncasr.ac.in.