Introduction
The combination of neontological and paleontological data has consistently been shown to produce more accurate estimates of phylogeny, divergence times, species diversity, radiation, extinction, and trait evolution (Etienne and Apol Reference Etienne and Apol2009; Norell Reference Norell1992; Pyron Reference Pyron2011; Rabosky Reference Rabosky2010; Shaul and Graur Reference Shaul and Graur2002; Slater et al. Reference Slater, Harmon and Alfaro2012; Wiens Reference Wiens2009; Wiens et al. Reference Wiens, Kuczynski, Townsend, Reeder, Mulcahy and Sites2010). Increased accuracy resulting from the addition of data representing extinct species is not surprising given that extant species represent a miniscule fraction of the temporal duration of most lineages and that extinct species and lineages are often characterized by greater variation in size, morphology, and species diversity than that of extant species (e.g., Smith and Clarke Reference Smith and Clarke2011; Smith 2011). Although paleontologists and neontologists are frequently interested in the same broad evolutionary questions, these disciplines often use different tools and language, or analyze data at qualitatively different scales. However, growing consensus regarding the importance of combining all viable sources of evolutionary data has resulted in an ever expanding body of interdisciplinary and integrative literature (e.g., Parham et al. Reference Parham, Donoghue, Bell, Calway, Head, Holroyd, Inoue, Irmis, Joyce, Ksepka, Patane, Smith, Tarver, van Tuinen, Yang, Angielczyk, Greenwood, Hipsley, Jacobs, Makovicky, Muller, Smith, Theodor, Warnock and Benton2012; Slater et al. Reference Slater, Harmon and Alfaro2012; Smith and Clarke Reference Smith and Clarke2012). Macroevolutionary inferences made in the absence of data from the fossil record run the risk of producing results that are biased by extant distributions of trait data and morphological diversity (Rabosky Reference Rabosky2010; Slater et al. Reference Slater, Harmon and Alfaro2012). Working within the ‘extant bubble’ can produce misleading results because extant species diversity and range of body mass or other bodily dimensions is often only a fraction of the total range of morphological diversity represented by the millions of years of evolutionary history contained in the fossil record.
Body mass is one of the most basic metrics by which extant and extinct animals can be categorized; however, assessment of this basic metric facilitates more detailed inferences regarding a host of other, more elusive aspects of biological evolution. Correlations between body mass and a variety of other life history traits and evolutionarily influential parameters have been documented across Metazoa (e.g., McClain and Boyer Reference McClain and Boyer2009; Smith and Lyons Reference Smith and Lyons2013). Owing to demonstrated links between body mass and population size, geographic range size, extinction risk, biomechanical constraints, and other life history traits, body mass remains an important aspect of evolutionary and ecological investigations (Smith and Lyons Reference Smith and Lyons2013).
Aves is the most speciose clade of terrestrial vertebrates and the avian literature is replete with studies focused on aspects of avian body mass, bodily dimensions (e.g., wingspan), and correlations of body size data with a plethora of evolutionary hypotheses (e.g., Blackburn and Gaston Reference Blackburn and Gaston1994, Reference Blackburn and Gaston1996; Maurer Reference Maurer2013; Smith et al. Reference Smith, Lyons, Jones, Maurer and Brown2013; Wojczulanis-Jakubas et al. Reference Wojczulanis-Jakubas, Jakubas, Welcker, Harding, Karnovsky, Kidawa, Steen, Stempniewicz and Camphuysen2010). It has been shown that allometric relationships between a large suite of bodily dimensions and body mass are variable among Aves (Field et al. Reference Field, Lynner, Brown and Darroch2013; Rahn et al. Reference Rahn, Paganelli and Ar1975; Serrano et al. Reference Serrano, Palmqvist and Sanz2015). Therefore, investigation of body mass evolution and allometry in individual avian clades has the advantage of more easily accounting for phylogeny than broad scale analyses of Aves, and holds the potential to reveal clade specific trends related to ecological aspects such as flight style and habitat preference that have influenced trait evolution in birds. With respect to body mass estimates, phylogenetically contextualized comparative methods provide a means to identify dimensions that are strongly correlated with body mass in extant birds. Subsequently, if the predictive variable(s) are preserved in the often incomplete fossils of extinct species, then the body mass of extinct species can be estimated and used to investigate a clades’ body mass evolution in deep time.
Whereas body mass is a key life history trait used to investigate the evolution of many clades of extant birds (e.g., McClain and Boyer Reference McClain and Boyer2009), discussions of body size evolution in extinct birds are often restricted by the lack of body mass estimates. As a result, discussions of body size in extinct birds frequently focus on direct comparisons between the raw dimensions of skeletal elements shared among the taxa of interest (i.e., interspecies comparisons between humeral length of two or more extinct birds; e.g., Smith and Clarke Reference Smith and Clarke2011; Stewart Reference Stewart2007). However, the allometric relationship between body mass and any particular skeletal dimension (or set of skeletal dimensions) is variable among Aves and absolute size of skeletal elements only serves as a rough proxy for body mass (Anderson et al. Reference Anderson, Rahn and Prange1979; Campbell and Marcus Reference Campbell and Marcus1992; Field et al. Reference Field, Lynner, Brown and Darroch2013; Serrano et al. Reference Serrano, Palmqvist and Sanz2015). For example, the humeri of the large (4500–5000 g) flightless Great Auk (†Pinguinus impennis) are not significantly greater in size than those of some closely related, smaller volant taxa (e.g., Thick billed Murre Uria lomvia, ~1000 g). Therefore, identification of dimensions that facilitate direct estimation of body mass in extinct species is an important area of ongoing inquiry.
Pan-Alcidae (crown clade Alcidae+stem lineage †Mancallinae=Pan-Alcidae sensu Smith Reference Smith2011a) is a monophyletic group of wing-propelled diving seabirds with 23 extant species and an extensive fossil record that spans approximately 34 Myr and includes ≥31 extinct species (Smith Reference Smith2011a). The relatively high species diversity and long temporal duration of pan-alcids is complemented by robust phylogenetic hypotheses of relationships including extinct taxa and estimates of divergence times (Smith Reference Smith2011a,Reference Smithb, Reference Smith2014; Smith and Clarke Reference Smith and Clarke2015), making Pan-Alcidae an ideal clade to investigate body size evolution and to test the effect of including extinct taxa on inferred patterns of body mass evolution. Additionally, wing-propelled diving is a relatively uncommon form of avian locomotion, and whether or not the specialized ecology and ethology of pan-alcids results in phylogenetically conserved allometric relationships has not been explored, in part because most extinct species of pan-alcids are known from isolated and fragmentary remains (Smith Reference Smith2011b). Because more than half of Pan-Alcidae species diversity is represented by extinct species, estimation of body mass for extinct pan-alcids is key to evaluating trends in body mass evolution for the clade. Body mass estimates for extinct pan-alcids will complement recent advances in knowledge of pan-alcid long bone histology and sensory system evolution (Smith and Clarke Reference Smith and Clarke2012, Reference Smith and Clarke2014) and contribute significantly to a more synthetic view of the evolutionary history of the clade.
Herein, measurement data representing the 23 extant alcids and the recently extinct, flightless Great Auk are analyzed to identify optimal variables for estimating the body mass of extinct pan-alcids. Body mass estimates for 25 extinct pan-alcids are provided, including those for 19 volant pan-alcids and 6 flightless species. These newly generated estimates of body mass for extinct species of Pan-Alcidae and subsequent evaluation of the species level phylogenetic distribution of body mass values for Pan-Alcidae provided a means to test hypotheses regarding the following: (1) the body mass dependent threshold for volancy and other constraints on maximum and minimum body size in Pan-Alcidae; (2) trends in body mass evolution across Pan-Alcidae and within pan-alcid sub clades including comparison of hypotheses inferred using both extant and extinct species to evaluate the effect of integrating neontological and paleontological data; (3) comparison of Pan-Alcidae body mass range with that of other clades of Charadriiformes, other clades of wing-propelled divers, and other clades across Aves.
Materials and Methods
Body Mass Estimation
Measurements of 48 continuous variables representing the 23 extant species of Alcidae and the recently extinct Great Auk were collected directly from museum specimens or assembled from previously published sources. These variables include body mass (dependent variable), body length, egg volume, egg length, egg diameter, and 44 skeletal dimensions (Table 1; Supplementary Appendix 1). Because the sex of fossil specimens for which body masses were estimated is not known, male and female body mass averages for extant Alcidae (Dunning Reference Dunning2008) were further averaged to produce an ‘extant species average’. Measurements of fossils representing extinct species were taken directly from holotype and referred specimens (i.e., not collected from literary sources). Measurement data for all extant and extinct taxa evaluated herein are provided in Supplementary Appendix 1.
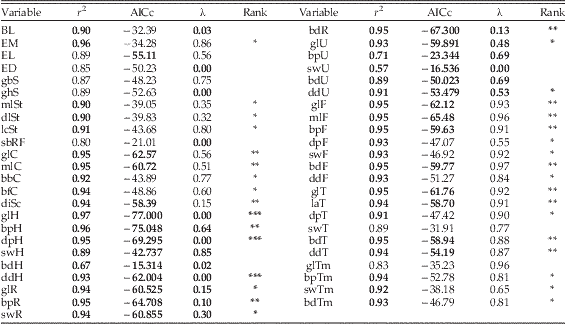
Summary of results from PGLS analyses of extant Alcidae and Great Auk measurement data. Note that analysis of forelimb values (humeri, ulnae, radii) did not include data for P. impennis. Values considered highly predictive are bolded (r 2≥0.90; λ=0.0; AICc≤−53.12 for non- forelimb variables and≤−61.58 for forelimb variables). All p-values were highly significant (i.e., <0.001). Rank notations are as follows: “*”, only r 2 values meet acceptance criteria; “**”, r 2 and AICc values meet criteria; “***”, r 2, AICc and λ values meet criteria (i.e., considered to have strong predictive values with respect to body mass estimation). Note that only greatest length of humerus, depth of proximal humerus and depth of distal humerus meet all 3 three criteria.

Abbreviations: BL, body length; EM, egg mass; EL, egg length; ED, egg diameter; gbS. greatest breadth of skull; ghS, greatest height of skull; mlSt, maximum length of sternum; dlSt, dorsal length of sternum; lcSt, length of sternal carina; sbRF, smallest breadth between costal rib facets (on sternum); glC, greatest length of coracoid; mlC, medial length of coracoid; bbC, basal breadth of coracoid; bfC, breadth of facies articularis basalis of coracoid; diSc, diagonal of scapula; glH, greatest length of humerus; bpH, breadth of proximal humerus; dpH, depth of proximal humerus; swH, shaft width of Humerus (at midpoint); bdH, breadth of distal humerus; ddH, depth of distal humerus; glR, greatest length of radius; bpR, breadth of proximal radius; swR=greatest width of radial shaft at midpoint; bdR, breadth of distal radius; glU, greatest length of ulna; bpU, breadth of proximal ulna; swU, width of ulnar shaft; bdU, breadth of distal ulna; ddU, diagonal of distal ulna; glF, greatest length of femur; mlF, medial length of femur; bpF, breadth of proximal femur; dpF, depth of proximal femur; sbF, width of femoral shaft; bdF, breadth of distal femur; ddF, depth of distal femur; glT, greatest length of tibiotarsus; laT, axial length of tibiotarsus; dpT, diagonal of proximal tibiotarsus; swT, width of tibial shaft; bdT, breadth of distal tibiotarsus; ddT, depth of distal tibiotarsus; glTm, greatest length of tarsometatarsus; bpTm, breadth of proximal tarsometatarsus; swTm, width of tarsometatarsal shaft; bdTm, breadth of distal tarsometatarsus.
Because species do not represent independent data points in statistical analyses (Harvey and Pagel Reference Harvey and Pagel1991), linear regression analyses comparing known body mass values of extant alcids to the 47 independent variables (i.e., measurement data) were performed using a phylogenetic generalized least squares model (PGLSλ; Grafen Reference Grafen1989, Harvey and Pagel Reference Harvey and Pagel1991, Martin and Hansen Reference Martins and Hansen1997, Revell Reference Revell2010) to explore the relationship between these variables and phylogeny using the software packages caper (v0.5; Orme et al. Reference Orme, Freckleton, Thomas, Petzoldt, Fritz, Isaac and Pearse2011) and ape (v3.0-8; Paradis et al. Reference Paradis, Claude and Strimmer2004) in R (v3.1.2; R 2014). Phylogenetic regressions and estimate of phylogenetic signal in the residual errors (i.e., Pagel’s Lambda) were performed jointly. It should be noted that although Pagel’s Lambda is a measure of phylogenetic relationship between the variables and phylogeny, it is used herein as an indirect measure of the predictive strength of variables with respect to body mass because the hypothesis of extant alcid relationships and associated branch lengths that were used to individually evaluate the variables (i.e., see PGLS analyses below) are labile when extinct taxa are included (Smith Reference Smith2011a,Reference Smithb, Smith and Clarke Reference Smith and Clarke2015). All raw measurement data were natural log transformed to normalize distribution and variance and Pagel’s λ was estimated to assess the potential influence of phylogeny in the data (Pagel Reference Pagel1999, Whitlock and Schluter Reference Whitlock and Schluter2008). The phylogenetic hypothesis of extant alcid relationships and associated branch lengths used to account for statistical non-independence of species are from the results of a Bayesian analysis of previously published molecular sequence data (ND2, ND5, ND6, COI, cyt-b, 12S, 16S, RAG1; Smith Reference Smith2011a: Fig. 1.22). Each independent variable (e.g., greatest length of humerus) was evaluated in a separate PGLS analysis and fit of the data to the resulting regression line was evaluated using r-squared values (i.e., coefficient of determination), p-values and values of the Akaike information criterion corrected for small sample size (AICc; Hurvich and Tsai Reference Hurvich and Tsai1989). The range of AICc values were divided into quartiles, and those in the lowest quartile were considered evidence of relatively tight fit of the data to the model. Multiple variable models (i.e., multi step regressions) were not explored because of the incompleteness and lack of shared elements between many extinct species known from fragmentary and isolated fossil material. For example, the Miocene (~14 Ma) pan-alcid †Divisulcus demerei (Smith Reference Smith2013) is known only from an isolated partial humerus. Because of the different allometry of the forelimb bones of flightless pan-alcids, measurement data for †Pinguinus impennis was excluded from analyses of forelimb elements (i.e., humeri, ulnae, and radii) and regressions resulting from analysis of forelimb values were not used to estimate the body mass of flightless species.
Following the identification of variables that are strongly correlated with body mass in extant Alcidae, measurements of pan-alcid fossils were combined with the slope and intercept of resulting regressions and used to estimate the body mass of extinct species. Regressions based on single dimensions run the risk of generating imprecise body mass estimates for extinct avian taxa (Field et al. Reference Field, Lynner, Brown and Darroch2013; Serrano et al. Reference Serrano, Palmqvist and Sanz2015). Therefore, the percent predictive error (PPE) was calculated for variables identified as highly predictive (based on r 2, Pagel’s λ, and AICc values) following the suggestions and methods of Field et al. (Reference Field, Lynner, Brown and Darroch2013) and Campione and Evans (Reference Campione and Evans2012).
Ancestral State Reconstruction
Subsequent to estimation of body mass for extinct taxa, maximum likelihood based ancestral state reconstruction of body mass for Pan-Alcidae was performed using the software packages ape (Paradis et al. Reference Paradis, Claude and Strimmer2004) and phytools (v0.4-31; Revell Reference Revell2012) in R (R 2014), and compared to estimation of ancestral mass inferred when including only extant alcids. Ancestral body mass optimization including only extant species utilized branch length data from a Bayesian analysis of molecular sequence data (Smith Reference Smith2011a: Fig. 1.22). Because the topology used for ancestral state reconstruction including extinct species is a combination of previous phylogenetic results including both molecular sequence and morphological data (Smith Reference Smith2011a: Figs. 1.22, 8.8; Smith Reference Smith2011b: Fig. 15; Smith and Clarke Reference Smith and Clarke2011: Fig. 6), all branch lengths were assigned a value of 1.0 in the ancestral state reconstruction (i.e., Grafen’s method; Grafen Reference Grafen1989). It should be noted, however, that the topology of the tree including extinct species differs slightly from recent hypotheses of relationships inferred in a combined analysis of morphological and molecular data (Smith and Clarke Reference Smith and Clarke2015). Because the intent herein was to demonstrate the effect of inclusion of extinct taxa on estimates of body mass rather than the effect of including extinct taxa on phylogenetic hypotheses, the topologies of the two trees used to reconstruct ancestral states were held constant (i.e., clade interrelationships are the same but taxon sampling differs). The mean and associated 95% confidence intervals resulting from the maximum likelihood estimation of node values are reported in Supplementary Appendix 3, Tables 1, 2).
Range of Body Mass Comparisons
Intraclade range of body mass (i.e., maximum − minimum value) was assessed using three different metrics: (1) range of body mass of extant taxa within a clade; (2) total range of body mass of all extinct and extant taxa; (3) sympatric range of body mass for subsets of species with overlapping geographic and temporal distributions. The magnitude of differences of body mass range across extant Aves was calculated for Alcidae and 62 other clades of birds representing >8000 species based on the data provided in Dunning (Reference Dunning2008) (Supplementary Appendix 2). Range of body mass was also estimated for Pan-Alcidae (i.e., including extinct species), Pan-Spheniscifomres (stem+crown penguins) and the extinct †Plotopteridae to facilitate comparisons between the ranges of body mass among clades of wing-propelled divers.
Results
Body Mass Estimation
Phylogenetic generalized least squares analysis of the 47 independent variables identified three humeral variables with highly predictive relationships to body mass in Alcidae (Table 1). The p-values of all 47 regressions were statistically highly significant (i.e., <0.001). AICc values ranged from −21.01 to −65.5 for non-forelimb variables (lowest quartile ≤−53.1) and from −15.3 to −75.0 for forelimb variables (lowest quartile ≤−61.58; Table 1). Pagel’s λ values ranged from 0.0 (no phylogenetic signal) to 0.98 (suggestive of trait evolution consistent with Brownian motion) and indicate variable phylogenetic relationship with body mass among pan-alcid skeletal variables. Based solely on r 2 values, the relatively strong relationship between egg mass and body mass recovered by Birkhead (Reference Birkhead1993) was also recovered herein (EM r 2=0.96); however, other measures of predictive strength did not support egg mass as a reliable predictor of body mass (AICc=−34.28, λ=0.86; Table 1). Additional non-skeletal variables including body length, egg length and egg diameter did not meet all three proposed criteria to qualify as strong predictors of body mass (i.e., r 2≥0.9, AICc≤−53.1, λ=0.0; Table 1). However, analysis of several variables including body length (BL), greatest length of the coracoid (glC), width of the proximal scapula (diSc), greatest length of the femur (glF) and greatest length of the tibiotarsus (glT) resulted in regressions with r 2 values≥0.94 and met or exceeded the proposed criteria in one of the other two categories (i.e., low AICc or low λ in addition to high r 2). Although not as strongly supported as the humeral variables identified as highly reliable predictors of body mass for Pan-Alcidae, femoral length proved useful for estimating body mass in extinct pan-alcid taxa for which humeri are not yet known.
The greatest length of the humerus (glH) was identified as the skeletal dimension most highly correlated with body mass in volant alcids (r 2=0.97, AICc=−77.0, λ=0.0; Fig. 1A; Table 1). This result is congruent with the relationship between humeral length and body mass in extant Alcidae that was previously recovered using a smaller taxonomic sample (Martin et al. 2001). The percent predicted error associated with estimates based on the glH regression is relatively low (PPE: range=0.9–24.0%, average=8.2%, median=5.5%). The highest PPE values were for Fratercula arctica (24%) and Alle alle (22%), with both resulting values being underestimates. Therefore, glH based estimates can be considered conservative. PPE values did not reflect taxonomic bias, as subclades throughout Alcidae displayed variable values. For example, PPE values for the 4 species of Synthliboramphus ranged from 1.0–14.4%. Given that body mass values used for regressions are averages of male and female values, the predicted range of body mass values for most taxa based on PPE are within the range of body mass for many species. For example, the predicted body mass of Uria aalge (1001 g) is within the documented range for that species (979 g, female, 1006 g male) (Dunning Reference Dunning2008).
Scatterplots showing the relationship between humeral length and body mass (A), and femoral length and body mass (B) in Alcidae. All values were natural log transformed prior to analyses but are plotted on scales corresponding to raw values for ease of interpretation. Taxonomic abbreviations: Aethia cristatella (AC); Aethia psittacula (AP); Aethia pusilla (APU); Aethia pygmaea (APY); Alca torda (AT); Alle alle (AA); Brachyramphus brevirostris (BB); Brachyramphus marmoratus (BM); Brachyramphus perdix (BP); Cepphus columba (CC); Cepphus carbo (CCA); Cepphus grylle (CG); Cerorhinca monocerata (CM); Fratercula arctica (FA); Fratercula cirrhata (FC); Fratercula corniculata (FCO); Ptychoramphus aleuticus (PA); †Pinguinus impennis (PI); Synthliboramphus antiquus (SA); Synthliboramphus craveri (SC); Synthliboramphus hypoleucus (SH); Synthliboramphus wumizusume (SW); Uria aalge (UA); Uria lomvia (UL).
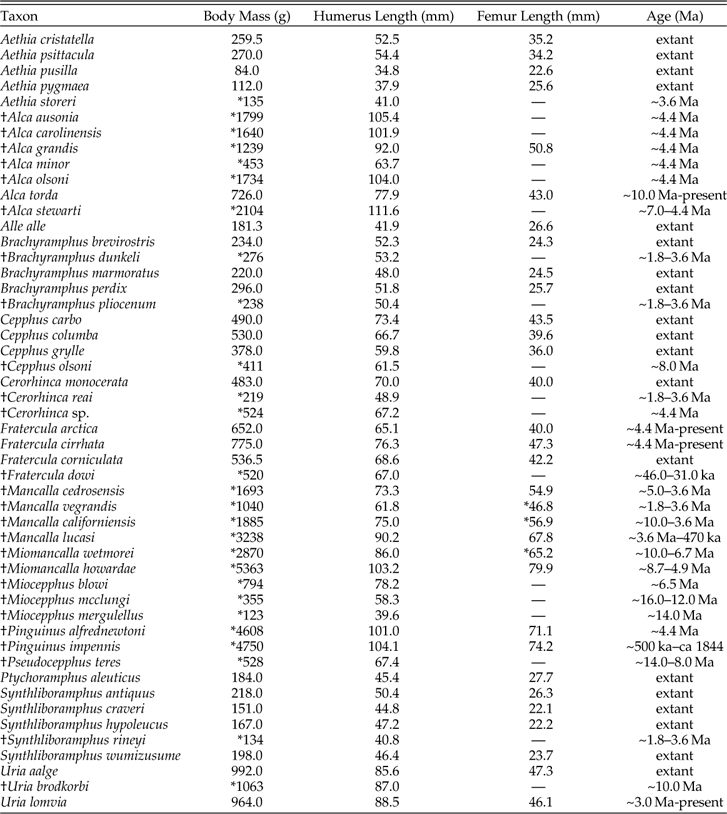
The predictive power of humeral length with respect to body mass is a fortuitous result given that complete humeri representing 19 extinct volant pan-alcid species are known. Body mass was not estimated for †Aethia barnesi, †Aethia rossmoori, †Alcodes ulnulus, †Cerorhinca minor, †Divisulcus demerei, †Mancalla emlongi, or †Miocepphus bohaski because those species are known exclusively from fragmentary humeri or other skeletal elements that are not strongly correlated with body mass. For example, †Mancalla emlongi is known exclusively from ulnae (contra Chandler Reference Chandler1990; see Smith Reference Smith2011b). The linear regression equation based on the relationship between natural log transformed body mass and natural log transformed values of the greatest length of the humerus of extant alcids was then used to generate estimates of body masses for 19 extinct alcids that have been interpreted as volant based on their forelimb osteological characteristics (Table 2). Estimates of body mass for extinct volant species range from 123 g in †Miocepphus mergulellus to 5363 g in †Miomancalla howardae, providing evidence that pan-alcids have maintained a substantial range of body sizes for at least the last 10–14 Myr (i.e., Middle Miocene; Table 2). As in the results of a previous study that identified femur length as a reliable predictor of body mass in a larger sample of charadriiforms (Field et al. Reference Field, Lynner, Brown and Darroch2013, figure 6, r 2=0.935), body mas estimates for the six flightless species of †Mancallinae included herein were made based on the greatest length of the femur, which was identified as the non-forelimb variable with the strongest predictive power (glF, r 2=0.95, AICc=−62.1, λ=0.9, PPE: 1.1–66%; Fig. 1B; Table 1; see Supplementary Appendix 3 for additional details and discussion).
Body mass, greatest length of humerus, greatest length of femur and age of pan-alcid species. With one exception (see footnote), body mass data for extant species are averages from Dunning (Reference Dunning2008). Values for the humerus and femur are averages from Appendix 1 (standard deviation provided in Supplementary Appendix 1). Extinct species are denoted by “†”, estimates (rounded to nearest gram or 0.1 mm) derived from PGLS analyses are denoted by “*” and missing data owing to damage of lack of element (i.e., no known femora) are denoted by “—”. Cerorhinca sp. refers to the Pliocene specimens described by Smith et al. (2007). Age ranges for pan-alcid fossils are from Smith (Reference Smith2011a, 2013a, b, Smith in press) and Olson (2013). Species ranges labeled “extant” have no pre-Holocene fossil records.
Table 2 footnote: The Spectacled Guillemot (Cepphus carbo) is considerably larger than its congeners C. grylle and C. columba and the stated body mass of C. carbo (490 g) in Dunning (Reference Dunning2008) and del Hoyo ((del Hoyo et al. 1996)) appears to be incorrect. Therefore, the average of body mass measurements for C. carbo (639 g) provided in Gaston and Jones (1998) is used herein.
Ancestral State Reconstruction
Ancestral state reconstruction utilizing the estimated body mass values for extinct species and known average values for extant species suggests that Pan-Alcidae evolved from an ancestral lineage with a body mass of ~1200 g (Fig. 2). The †Mancallinae lineage, which is the sister taxon to the alcid crown clade, is characterized by relative body mass stasis in four species (i.e., 1001–3000 g) and an inferred increase in body mass in the lineage leading to Miomancalla. The weak trend towards increased size in †Mancallinae is contrasted by an apparent trend towards decreased body mass (i.e., ~1000 g) at the base of Alcidae (i.e., the common ancestor of the crown). Otherwise, increases in body size above 1000 g in Alcidae are only evident in the lineage leading to Alcini (sensu Smith and Clarke Reference Smith and Clarke2011; Smith Reference Smith2011a), the clade including Alca, Alle, †Miocepphus, †Pinguinus, and Uria. However, shifts towards decreased body mass are twice as prevalent as shifts towards increasing body mass (Fig. 2; only 15 of 46 total inferred changes along branches indicate evolution towards larger body mass). In direct contrast to the results inferred by including estimates of body mass for extinct species, the body mass evolution trend inferred using only extant species suggests an overall increase in body mass over time across Alcidae (Fig. 3; 12 of 21 total inferred changes along branches indicate evolution towards increased body mass). Moreover, the ancestral optimization of body mass including only extant species estimated a value of 415 g for the lineage leading to the common ancestor of the crown, less than half of the >1000 g estimate proposed for that node based on the ancestral optimization including extinct species.
Reconstruction of ancestral body mass for Pan-Alcidae including extinct species. Note that only 15 of the 46 inferred shifts in body mass are relative increases in estimated body mass (in comparison to the preceding node), indicating a strong trend of decreasing body mass throughout the evolution of the clade (red up arrows indicate relative increases and blue down arrows indicate relative decreases in estimated body mass). The topology is a combination of previous phylogenetic results (Smith, Reference Smith2011a figures 1.22, 8.8; Smith, Reference Smith2011b: Figure 15; Smith and Clarke, Reference Smith and Clarke2011: Figure 6), Silhouettes were scaled relative to 4750 g estimate for †P. impennis.
Reconstruction of ancestral body mass for Alcidae excluding extinct species. Note that 12 of the 21 inferred shifts in body mass are relative increases in estimated body mass (in comparison to the preceding node), indicating a general trend of increasing body mass based on extant species. The topology is congruent with the hypothesis of relationships recovered by Smith (Reference Smith2011a: Figure 1.22) and used to constrain the PGLS analyses of continuous trait data.
Range of Body Mass Comparisons
The smallest and largest extant birds are the Peruvian Sheartail (Thaumastura cora, 2 g; although the Bee Hummingbird, Mellisuga helena is of similar size) and the Ostrich (Struthio camelus, 111,000 g) respectively, resulting a body mass range of 110,998 g for extant species of birds (n=~10,000). However, the Kori Bustard (Ardeotis kori; males ~11,300 g) is the largest living volant bird, resulting a range of for 11,298 g among extant flying birds. At 18 g, the smallest clade specific range of sampled taxa is that of Trochilidae (hummingbirds; n=372 species; Supplementary Appendix 2). Penguins have the largest range (~37,000 g) in Aves and alcids have the largest range (~900 g) among extant Charadriiformes. By comparison, body mass range in sampled species of Passeriformes (n=6593), which comprise more than half of extant avian diversity, is only 1132 g.
At 84 g, the smallest pan-alcid is the extant auklet Aethia pusilla. The largest living alcid is the Thick billed Murre Uria lomvia at 992 g, and the resulting range of body mass in extant alcids is 908 g. However, inclusion of the recently extinct Great Auk, which was driven into extinction by humans less than 200 years ago (ca. 1840 CE; Fuller Reference Fuller1999), increases the range to 4666 g, a value for body mass range that is greater than that of all other clades of Charadriiformes (Supplementary Appendix 2). Of the 62 extant clades of birds for which range of body mass was calculated, only nine clades display greater ranges of body mass than Pan-Alcidae. Penguins (Spheniscidae) are characterized by the greatest range of body mass among all modern birds. Extant penguins vary in size from the ~842 g Eudyptula minor to the ~38,200 g Aptenodytes forsteri. Thus, extant penguins have a body mass range of 37,358 g, more than three times the range of the next most variable clade, Anatidae (266–11,900 g; range=11,634 g; Dunning Reference Dunning2008; Supplementary Appendix 2).
When extinct pan-alcids are included, the range of body mass for the clade is increased from 4666 g to 5279 g, an increase of >13% (Supplementary Appendix 2). With an estimated body mass of 5363 g, †Miomancalla howardae is the largest known species of Pan-Alcidae and the largest known species of Charadriiformes (Fig. 4; Table 2). The next largest species of charadriiform is the Great Auk, with an estimated body mass of ~4750 g. Thus, the 908 g range of body mass displayed by the 23 living species of alcids (i.e., not including the Great Auk) represents only ~17 % of the total range for the clade and the importance of including extinct taxa for accurate evaluation of pan-alcid body mass evolution cannot be overstated.
Selected species demonstrating the range of Pan-Alcidae body sizes (scaled based on body mass estimates): †Miomancalla howardae (A); †Pinguinus impennis (B); †Pinguinus alfrednewtoni (C); †Alca stewarti (D); †Mancalla vegrandis (E); Uria aalge (F); †Miocepphus blowi (G); Alca torda (H); †Alca minor (I); Alle alle (J); †Aethia storeri (K); Aethia pusilla (L). Image sources: A, D, E, G, H, I modified from Gryz (Reference Gryz2013); B, C, F, J, K, L modified from images licensed under creative commons.
Discussion
Evolution of Pan-Alcidae Body Mass Variation
The results of the ancestral state reconstruction including extinct species suggest that the common ancestor of Alcidae and †Mancallinae had a body mass in the range of ~1200 g (Fig. 2). That value falls within the range of body mass observed in the sister taxon to Pan-Alcidae (i.e., extant species of Stercorariidae, 270–1935 g; Supplementary Appendix 2; Baker et al. 2007; Smith Reference Smith2011a,Reference Smithb). In order to further evaluate the hypothesis that the pan-alcid ancestral body mass was in the range of ~1100–1300 g (based on 95% CI, see Supplementary Appendix 3), the body mass of the taxon represented by the oldest known pan-alcid fossil was independently estimated. Because that Eocene fossil (~34 Ma; GCVP 5690; Chandler and Parmley 2002; Pan-Alcidae incertae sedis sensu Smith Reference Smith2011b) is an incomplete humerus, a body mass of 1394 g was generated based on the distal depth of the specimen. Thus, the ancestral state reconstruction, the estimated body mass of the oldest pan-alcid taxon and the range of body mass in the sister taxon to Pan-Alcidae are all in agreement with an ancestral Pan-Alcidae lineage with a range of body mass spanning ~1100–1300 g. Evolution towards smaller (e.g., auklets) and larger forms (e.g., †Mancallinae) likely proceeded from this intermediate range.
The reconstruction of ancestral body size in Pan-Alcidae suggests a decrease in body mass in the alcid crown—relative to †Mancallinae and the outgroup to Pan-Alcidae. The uniformly small body mass of auklets and murrelets stand out from other pan-alcid clades with more variable ranges of body mass and the basal position of murrelets in Alcinae contributes to the optimization of smaller body mass at the base of the crown. However, this apparent trend may be an artifact, as the early fossil record of the clade is quite sparse (i.e., only one Eocene and no Oligocene fossils). Records of murrelets are no older than 3.6 Ma and are superseded in age by mid to late Miocene (~14–6 Myr) fossils of Alcini (e.g., Alca, †Miocepphus) that occupy a more derived systematic position within Alcinae (Fig. 2). Given that Alcini, Cepphini, Fraterculinae and †Mancallinae all display greater ranges of intra clade size variation (Table 2) than that of murrelets, the lineages leading to Synthliboramphus and Brachyramphus murrelets were likely larger in size than their modern counterparts. The lineage leading to Alcinae is reconstructed in the range of ~900–1100 g, larger than any extant or extinct murrelet currently known (Fig. 2). This suggests that early alcids may have relied on their relatively large size to assist them in diving, and that smaller body sizes evolved only after the wing became more anatomically specialized and efficient for underwater propulsion. The evolution of relatively small body sizes in volant Alcidae contrasts with the independent evolution of large body sizes in flightless pan-alcids (Fig. 2). However, both body mass related strategies were successfully exploited by lineages of pan-alcids and are necessarily preceded by the aforementioned specializations related to wing-propelled diving that all extant alcids share. Although volant pan-alcids must maintain a balance between increased body mass, often in the form of increased bone density, that contributes to overcoming buoyancy and a threshold of wing-loading that allows for powered flight (Habib Reference Habib2010), like penguins, flightless pan-alcids are released from the constraints associated with aerial flight and can evolve towards larger body sizes that are primarily constrained by the mechanics of underwater flight and reproduction on shore.
When considered in chronological context, the phylogenetic distribution of body mass in Pan-Alcidae does not conform to Cope’s Rule (Cope Reference Cope1887; Fig. 2). The opposite interpretation (i.e., overall increase in body mass concurrent with Cope’s rule) is recovered when considering the results from the analysis of extant species data. The largest species of pan-alcid, †Miomancalla howardae, and the clade with the largest average body size, †Mancallinae, are extinct. Evolution of the largest body sizes in Pan-Alcidae (i.e., †Pinguinus and †Mancallinae) is correlated with loss of flight. Within subclades of Pan-Alcidae, a range of body sizes are recovered, often including examples of extinct species that are larger than extant congeners (e.g., Alca). Moreover, some clades such as Aethiini (comprising Aethia and Ptychoramphus auklets), exhibit remarkable stasis with respect to body size, as evidenced by Miocene species (e.g., †Aethia storeri) with body mass values quite similar to those of extant congeners. The biophysical constraints of wing-propelled diving and the apparent strategy of size-based niche partitioning (discussed below) have likely precluded any consistent observed trend toward evolution of greater body mass in Pan-Alcidae.
It has been previously noted that, as a clade, extant alcids do not conform to Bergman’s Rule (Bedard Reference Bedard1985; Bergmann Reference Bergmann1847). However, examples of species (e.g., Alle alle, Uria aalge) with more northern populations that are statistically larger have been documented (Hipfner and Greenwood Reference Hipfner and Greenwood2008; Wojczulanis-Jakubas et al. Reference Wojczulanis-Jakubas, Jakubas, Welcker, Harding, Karnovsky, Kidawa, Steen, Stempniewicz and Camphuysen2010). More prevalent than a latitudinal trend of increasing north south body mass in alcids is a longitudinal increase from west to east (Barrett et al. Reference Barrett, Anker-Nielsen and Krasov1997; Wojczulanis-Jakubas et al. Reference Wojczulanis-Jakubas, Jakubas, Welcker, Harding, Karnovsky, Kidawa, Steen, Stempniewicz and Camphuysen2010). For example, the eastern Pacific is more nutrient rich than the western Pacific and higher primary productivity there may contribute to the overall higher species diversity of eastern Pacific alcids. There is no correlation between latitude and the distribution of small (<300 g; e.g., Aethia cristatella), medium (300–800 g; e.g., Cepphus grylle) and larger sized extant alcids (>800 g; e.g., Uria lomvia; Table 2). Furthermore, within these size-based categories, species are distributed throughout the latitudinal range of Alcidae. Even among clades such as Aethia that are distributed throughout the majority of the geographic range of Pacific Ocean endemic alcids, there is no positive relationship between body mass and latitude. Aethia psittacula is the largest auklet and is also the most widely distributed (del Hoyo et al. 1996) and Aethia pusilla is the smallest auklet species but also has a range that extends further northward than any other species of auklet. Other alcid clades with a range of differently sized species have distributions that overlap one another (e.g., Synthliboramphus) or that appear geographically separated along longitudinally oriented boundaries (e.g., Cepphus). Body mass in alcids appears to be correlated with other factors such as competition for nest sites and partitioning of prey resources at varying depths (Ainley Reference Ainley1990; Ainley et al. Reference Ainley, Strong, Penniman and Boekelheide1990; Hipfner and Greenwood Reference Hipfner and Greenwood2008). Additional support for the lack of a link between body mass and latitude comes from a recent study that found no evidence of correlations between body mass and sea surface temperature or air temperature in populations of the Dovekie Alle alle (Wojczulanis-Jakubas et al. Reference Wojczulanis-Jakubas, Jakubas, Welcker, Harding, Karnovsky, Kidawa, Steen, Stempniewicz and Camphuysen2010). With respect to the fossil record of Pan-Alcidae, the large flightless taxa †Mancallinae and †Pinguinus had ranges that extended over large portions the Northern Atlantic and Northern Pacific Ocean basins respectively, and that overlapped with the ranges of smaller coeval species of pan-alcids (Smith Reference Smith2011b; Smith and Clarke Reference Smith and Clarke2011). Thus, latitudinally influenced temperature gradients do not appear to be a significant factor influencing the evolution of body mass distributions in extant or extinct pan-alcids.
Range of Body Mass in Wing-Propelled Divers
From a biological or ecological perspective, there are at least three distinct ways to consider the ‘range of body mass’ of any given clade, each with different evolutionary connotations. The range of body mass displayed by all of the extant species in a clade can be an informative metric because of the possibilities to combine those data with detailed knowledge of ecological interactions with other living species and their environment, details that are often not available for paleofaunas. Comparisons of this type can lead to insights about the current environmental constraints on extant body size diversity in a clade. Secondly, the simultaneous consideration of both extant and extinct species provides temporal context that working inside the ‘extant bubble’ simply cannot. Inclusion of data from the fossil record facilitates evaluation of body mass evolution on geologic timescales and allows for potential correlation with broad scale evolutionary drivers (e.g., paleoclimate, geologic events, anthropogenic influence). Moreover, consideration of the entire range of body mass for a clade throughout its evolutionary history may provide insights related to the overarching constraints on body mass within a given clade. However, a third, potentially more informative way to evaluate range of body mass is to consider groups of extant or extinct species with overlapping temporal and geographic ranges (i.e., sympatric species). In an ecological context, this type of comparison may be preferred because the taxa being considered are species that may have interacted or competed in some fashion. What follows is a brief evaluation of Pan-Alcidae, and comparisons with the marine wing-propelled diving clades Pan-Sphenisciformes and †Plotopteridae, using each of the three aforementioned lenses for range of body mass.
Extant Range of Body Mass
The rather striking differences between the ranges of body mass in alcids (908 g) and penguins (37,358 g) and that of other birds may be a function of potential geographic range size. Five of the ten clades with body mass ranges equal to or exceeding Pan-Alcidae are characterized by aquatic or at least partially marine ecologies (albatross, pelicans, ducks and geese, pan-alcids, penguins). Continent size is positively correlated with increased variability in body size ranges of terrestrial birds (Maurer Reference Maurer2013), and given that the geographic extent of the Holarctic oceans (i.e., Northern Pacific, Northern Atlantic, and Arctic Ocean) inhabited by alcids is far greater (>100 million km2) than that of the largest continental area (Eurasia=~51 million km2), the large range of body mass in alcids and other marine birds is consistent with that observed trend. Moreover, the large geographic area inhabited by penguins (Southern Atlantic, Southern Pacific, and Antarctic Oceans) and the great range of body mass in Spheniscidae is also congruent with an association between increased body mass range and absolute size of potential geographic range. However, it should be noted that neither alcids nor penguins, utilize 100% of the ocean areas they could potentially inhabit; although the same is true, albeit to a lesser extent, for continental avifaunas on which these correlations of body size variation and geographic range size are based.
Total Range of Body Mass
As defined herein, the total range of body mass for a clade includes all extant and extinct taxa for which body mass data are available (i.e., non-contemporaneous species), and when compared to the range of body mass of extant taxa, can provide additional information regarding the upper and lower observed limits of body mass for a clade. However, in contrast with comparisons restricted to extant taxa or sympatric species, comparison of body mass ranges including extinct taxa do not assume homogeneity or stasis with respect to potentially important factors affecting body mass evolution. These factors include different environmental conditions (e.g., temperature, sea level), interspecies interactions (e.g., evolution of predator-prey relationships, ecological segregation along axes of prey or nest choice), population size fluctuations, and extinction events. Regardless of differences between the evolutionary history and the temporal duration of clades in the fossil record, evaluation of the total range of body mass for a clade can be informative in that potential limitations and trends toward smaller or larger body mass may be identified.
Calculation of body mass ranges including extinct taxa for clades other than Pan-Alcidae is largely beyond the scope of the current study but should be attempted as methods are refined (e.g., Field et al. Reference Field, Lynner, Brown and Darroch2013) and as additional body mass estimates for extinct species of birds become available. However, to facilitate comparisons with Pan-Alcidae, a brief summary of body mass range in the other two major clades of marine wing-propelled divers, Pan-Sphenisciformes, and †Plotopteridae, is warranted. Comparison of extant versus total body mass range in penguins provides another compelling example of why working in the ‘extant bubble’ can be misleading (i.e., the majority of all species that have ever existed are extinct). Consideration of extinct penguins more than doubles the interspecific range of body mass for that clade. Body mass estimates for extinct species of penguins include taxa such as †Anthropornis nordenskjoeldi, with an estimated body mass of ~81,000 g (Jadwiszczak Reference Jadwiszczak2001; Livezey Reference Livezey1989). Moreover, if body mass estimates were available for extinct penguins of potentially larger size than †Anthropornis (e.g., †Pachydyptes ponderosus), the range of size would likely be even more pronounced. However, the apparently different allometry of stem versus crown penguins may complicate the estimation of body mass for some extinct species of penguin (Ksepka et al. Reference Ksepka, Fordyce, Ando and Jones2012). Likewise, as is evident from the results presented herein, the complexities of estimating body mass for species of †Mancallinae (i.e., stem alcids) may indicate that similar differences between crown and stem allometry are shared by Pan-Alcidae and Pan-Sphenisciformes.
The †Plototeridae are an extinct lineage of flightless, wing-propelled diving seabirds known from Eocene-Miocene aged deposits of the northern Pacific Ocean basin. Plotopterids display a range of body mass quite similar to that of Pan-Sphenisciformes. However, direct estimation of body mass is only available for a single species of †Plotopteridae. The mass of †Tonsala buchanani was estimated at 30,880 g (Dyke et al. Reference Dyke, Wang and Habib2011). Based on femoral length and assuming shared femoral to body mass allometry among Plotopteridae, †Copepteryx hexeris (femoral length=192–198 mm) and †Copepteryx titan (223 mm; Olson and Hasegawa Reference Olson and Hasegawa1996) may have been nearly twice the size of †T. buchanani (134 mm; Dyke et al. Reference Dyke, Wang and Habib2011). Based on humeral dimensions, an additional undescribed taxon is reportedly twice the size of C. hexeris (proximal width of humerus=87 mm versus 38 mm in †C. hexeris; (see Kawano and Kawano Reference Kawano and Kawano2001; Olson and Hasegawa Reference Olson and Hasegawa1996). Thus, body mass estimates for the largest plotopterids would likely equal or possibly exceed those for the largest extinct species of penguins. †Plotopterum joaquinensis is the smallest species of plotopterid, with an approximate size similar to that of the extant Brandt’s Cormorant (Phalacrocorax penicillatus; 2570 g; Dunning Reference Dunning2008; Olson and Hasegawa Reference Olson and Hasegawa1979). Thus, the estimated range in body mass for †Plotopteridae is ~2500–80,000 g (tentative approximate range=~77,500 g). Although the temporal duration of plotopterids overlaps with that of Pan-Alcidae, co-occurrence of these taxa in the same geologic formations is rare (N. A. Smith personal observation) and the possibility that the maximum body mass of early Pacific Ocean basin pan-alcids was restricted by competition with large plotopterids should be considered. However, the †Plotopteridae were restricted to the Northern Pacific Ocean basin and potential explanation of the lack of larger bodied pan-alcids (e.g., Alca stewarti) in the Northern Atlantic Ocean basin prior to the Miocene will require an alternative explanation.
Regardless of what the exact body mass of giant extinct species were, the plotopterids and the largest of penguins and pan-alcids are now extinct and the cause(s) of the preferential extinction of these large taxa and the resultant decrease in body mass range in wing-propelled divers remain unclear. Competition with large marine mammals has been frequently proposed as a driver of extinction in flightless wing-propelled divers (Olson Reference Olson1985; Olson and Hasegawa Reference Olson and Hasegawa1979; Simpson Reference Simpson1946; Warheit and Lindberg Reference Warheit and Lindberg1988). However, temporal patterns of biodiversity suggest that no universal driver of extinction exists among giant penguins, flightless pan-alcids and plotopterids, and that competitive displacement by marine mammals was likely less important than environmental drivers (e.g., climate changes) for some taxa (Ando and Fordyce Reference Ando and Fordyce2013). As with the increased body mass variability documented in terrestrial birds in relation to continent size, a link between the relative abundance of “large” species and continent size has also been proposed (Maurer Reference Maurer2013). Larger species generally require larger or more abundant prey, usually inhabit larger geographic ranges and are, therefore, more prone to extinction because of lower population densities throughout their ranges. Even the smallest of the Earth’s ocean basins are larger than the largest of continents and some aspects of the well studied dynamics of terrestrial megafaunal extinctions may also apply to the preferential extinction of avian pelagic giants. For example, although they were not wing-propelled divers, giant psuedotoothed seabirds (†Pelagornithidae; some with wingspans >4 m) inhabited the shores and oceans adjacent to every continent but went extinct at or near the Pliocene/Pleistocene boundary, an unexpected occurrence given their survival since the Paleocene (Mayr Reference Mayr2009, Boessenecker and Smith Reference Boessenecker and Smith2011, Ksepka Reference Ksepka2014).
Sympatric Range of Body Mass
The range of body mass (or any other size-based trait) for a clade across its entire geographic range has different evolutionary connotations (i.e., dispersal and local selection potentially resulting in morphospace expansion) than the range of body mass for species with geographic ranges that overlap in both time and space (i.e., sympatric species with in situ evolution potentially driven by interspecies competition). Limiting similarity, a concept in theoretical and community ecology that proposes the existence of a maximum level of niche overlap between two or more given species, is a corollary of the competitive exclusion principle (Hardin Reference Hardin1960; Macarthur and Levins Reference Macarthur and Levins1967). One strategy that many charadriiforms and other birds, including pan-alcids, have employed to reduce interspecies competition and niche overlap is size-based niche differentiation (e.g., Ashmole Reference Ashmole1968). Because of the biomechanical constraints inherent in maintaining a very specialized mode of locomotion such as wing-propelled diving, size-based niche differentiation may be strongly selected for among sympatric populations of pan-alcids. Foraging and nesting strategies of extant Alcidae are strongly correlated with body size and similar size-based niche divisions have been proposed for volant and flightless clades of extinct pan-alcids (Ainley Reference Ainley1990; Smith Reference Smith2014). Furthermore, the range of sizes displayed by sympatric species of pan-alcids such as the Pliocene radiation of Alca in the Atlantic or the Pliocene species of †Mancalla endemic to the Pacific are striking when compared to that of most avian clades (Smith Reference Smith2011b; Smith and Clarke Reference Smith and Clarke2011). For example, potentially coeval species of Alca in the Early Pliocene (~4.4. Ma) range from 453 g in the relatively small Alca minor, to 2104 g in Alca stewarti, the largest volant pan-alcid. Thus, the >1500 g range in the seven species of Pliocene Alca exceeds that of all 23 species of extant Alcidae, who’s ranges do not all overlap (range=908 g; Supplementary Appendix 2). Among extant Alcidae, the highest density of sympatric species occurs in the five species of auklets (Aethia+Ptychoramphus=Aethiini, sensu Smith, Reference Smith2011b, Reference Smith2014). The range of body mass in Aethiini spans only 186 g (A. pusilla, 84 g – A. psittacula, 270 g). Thus, similar to Alca, the >2100 g range of body mass among the four Pliocene species of †Mancalla (Table 2) is more than 11 times that of auklets, the largest cluster of sympatric species among extant Alcidae—a geographic cluster of auklet species that occupy a similar Pacific range to that once inhabited by †Mancalla. Moreover, when extinct taxa are considered, the two fold increase in body size among species of †Mancallinae (Smith Reference Smith2011b) and species of Alca (Smith and Clarke Reference Smith and Clarke2011) provide particularly impactful examples of size based niche differentiation because they are drawn from relatively restricted sub clades of Pan-Alcidae. The range of body mass in the genera Alca and †Mancalla contrasts with the more general, Aves wide, genus level patterns of body mass homogeneity recovered by Smith et al. (Reference Smith, Lyons, Jones, Maurer and Brown2013), who concluded based on data for extant clades of birds, that when species diverge, that they tend to stay relatively the same size as congeners. However, the fossil record is incomplete and some degree of time averaging cannot be excluded. More complete and detailed sampling of extinct species stratigraphic ranges would likely decrease the starkness of the contrast between the fossil record of Pan-Alcidae and those of extant birds.
Body Mass Constraints in Pan-Alcidae
Aethia pusilla is the smallest alcid and the smallest marine wing-propelled diving bird (Fig. 4). Only the five species of freshwater dippers (Passeriformes, Cinclidae) are smaller wing-propelled divers, the smallest being Cinclus shulzi at ~37 g (Dunning Reference Dunning2008). However, dippers do not dive as deeply or for as long as alcids or penguins (Omerod and Tyler Reference Omerod and Tyler2005), and the unidirectional stream currents in which dippers dive may impose different biomechanical constraints than the multidirectional ocean currents adapted to by diving seabirds. The diving mechanics of Cinclidae have not been studied in detail and there is no fossil record of the clade (Omerod and Tyler Reference Omerod and Tyler2005), making it difficult to determine if comparisons between marine wing-propelled divers and Cinclidae are informative regarding the biomechanical and physiological minimum limits on body mass of wing-propelled divers in general.
When considered in combination, that Pan-Alcidae display the most body mass variability among Charadriiformes and that penguins display the most variation among Aves (Supplementary Appendix 2) suggests that the upper constraints on body mass have been loosened when it comes to flightless wing-propelled divers. Whereas, the body mass of most volant pan-alcids is <1000 g, the largest volant pan-alcid is †Alca stewarti, with an estimated body mass of ~2104 g. Because only flightless pan-alcids are known to exceed 2500 g, a proposed upper limit of 2000–2500 g in which alcids can maintain the ability to fly through both air and water is supported by these data (Fig. 4). A recent study also drew parallels between the loss of flight in penguins (Pan-Sphenisciformes) and the Great Auk †Pinguinus, and argued in favor of functional constraints on wing-shape and size that support the theory of an evolutionary trade off between aerial and aqueous flight (Elliott et al. Reference Elliott, Ricklefs, Gaston, Hatch, Speakman and Davoren2013), an idea originally proposed by Storer (Reference Storer1960). Conversely, it has been suggested that the fast, straight line aerial flight of volant pan-alcids is an adaptation that enables them to traverse long distances between foraging and nesting locations (Kovacs and Meyers Reference Kovacs and Meyers2000). Although the data presented on energetics of flight in extant alcids by (Elliott et al. Reference Elliott, Ricklefs, Gaston, Hatch, Speakman and Davoren2013) is compelling, conclusions regarding flight costs and its relation to body mass and subsequent loss of flight were drawn in the absence of consideration of the entire fossil record of Pan-Alcidae. Specifically, the large (~2100 g) volant auk †Alca stewarti and the relatively small flightless auk †Mancalla vegrandis (~1000 g) contradict the ~1000 g threshold for flightlessness proposed by Elliot et al. (Reference Elliott, Ricklefs, Gaston, Hatch, Speakman and Davoren2013). Volant pan-alcids should not be viewed as an evolutionary stage along a trajectory towards flightlessness and complex behavioral and functional convergence between penguins and flightless pan-alcids should be drawn with caution as these taxa are not closely related in Aves (Hackett et al. Reference Hackett, Kimball, Reddy, Bowie, Braun, Braun, Chojnowski, Cox, Han and Harshman2008; Mayr and Clarke Reference Mayr and Clarke2003; McCormack et al. Reference McCormack, Harvey, Faircloth, Crawford, Glenn and Brumfield2013). The fossil record reveals that penguins achieved body masses that far exceed those of even the largest of flightless pan-alcids (Ksepka et al. Reference Ksepka, Fordyce, Ando and Jones2012; Livezey Reference Livezey1989). However, the constraints that have influenced the evolution of such contrasting ranges of body mass in these relatively ecologically equivalent wing-propelled diving clades of the Northern and Southern Hemispheres, remain unclear. Additional investigation of the relative contributions and interactions of biomechanical, physiological and ecological factors that have affected the variance in body mass of wing-propelled divers is warranted.
Conclusions
The greatest length of humerus was identified as the best estimator of body mass for volant pan-alcids and length of femur was the most reliable estimator identified for flightless species. The identification of these clade specific body mass estimators within Pan-Alcidae suggests that additional research is needed to identify optimal estimators for other clades of birds with highly specialized anatomy and ethology (e.g., crown versus stem penguins). Subsequently, these data suggest that the application of a ‘single best estimator’ across Aves may be less precise than clade specific body mass estimation and that particular care should be used when estimating body mass for extinct species with ambiguous ethologies. Because of the potential influence of phylogeny, estimation of body mass for extinct species of birds with ambiguous systematic relationships or for which phylogenetic hypotheses of the clade are lacking, should be approached with some caution and at minimum should include estimation of confidence intervals.
The results of the ancestral optimizations of body mass clearly show that with respect to Pan-Alcidae, inferences regarding body size evolution based exclusively on extant species data are spurious. Furthermore, the range of body mass variation present in extant Alcidae is now realized to be a fraction of the total range represented by the total clade. While not all clades have fossil records that facilitate the inclusion of extinct taxa, many clades do and collaboration between neontologists and paleontologists is key to asking appropriate questions and collating the data needed to answer questions that span evolutionary biology.
Overall, an evolutionary trend of decreasing body mass is recovered in Pan-Alcidae. This decreasing trend suggests that large size evolved early in the lineage, potentially as a means of overcoming physical constraints imposed by diving, and that body mass was decreased over time as pan-alcids evolved a more efficient underwater flight apparatus. Multiple episodes of size-based niche differentiation are evident in Pan-Alcidae. The clades Alca, †Mancallinae, Alcinae, and Fraterculinae all include species representing a relatively broad range of body mass (Fig. 2). Intraclade body mass variability is present in both volant and flightless clades whether considering sympatric species or species across geologic time and this variability appears to be one of the characteristics of Pan-Alcidae. The largest pan-alcids are flightless and although examples of much larger wing-propelled divers are known (i.e., some stem penguins and plotopterids), flightless pan-alcid species represent the largest known species among the diverse and speciose Charadriiformes. Additionally, body mass estimates indicating large volant species (e.g., Alca stewarti) provide new context regarding the body mass dependent threshold for flightlessness in Pan-Alcidae, now estimated at ≥2100 g (Fig. 4). Moreover, the smallest pan-alcids are also the smallest known marine wing-propelled divers. Thus, the increased knowledge regarding the minimum limits on body mass for marine wing-propelled divers presented herein bears on future investigations of physical and biomechanical constraints imposed on diving birds. Furthermore, the similarities and differences between body mass ranges of marine and terrestrial birds identified herein, and the correlation of shared and dissimilar factors (e.g., geographic range size) that may have influenced the evolution of body mass in these ecologically disparate groups will facilitate additional research on avian body mass evolution. Evaluation of body mass evolution in wing-propelled divers provides new insights regarding the potential constraints and historically advantageous strategies utilized by these birds that occupy a singular and ecologically informative niche that straddles the marine and terrestrial realms.
Acknowledgements
I thank J. Gerwin, B. O’Shea and V. Schneider at NCSM, J. Dean, M. Florence, H. James, B. Milensky and S. Olson at USNM, S. McLeod at LACM, T. Deméré, K. Randall and P. Unitt at SDSNH, M. Goodwin and P. Holroyd at UCMP, and J. Hinshaw at UMMZ for access to materials, M. Burd, C. Francis, J. Mitchell, and E. Sbrocco for conversations about and assistance with comparative methods in R, J. Clarke, J. Conner and C. McClain for insights regarding body mass evolution and constructive comments on the manuscript. J. Hinshaw kindly provided measurements of the skull of S. wumizusume. Financial support from the Frank M. Chapman Memorial Fund, Section of Ornithology, American Museum of Natural History, the Smithsonian Institution Office of Fellowships is gratefully acknowledged. This project was also supported as part of National Science Foundation DEB 0949897 (J. Clarke) “Collaborative Research: Wings to Flippers - Phylogenetics, character acquisition, and feather biomechanics in the evolution of wing-propelled diving”, as part of a postdoctoral fellowship at The National Evolutionary Synthesis Center (National Science Foundation EF-0905606), and the John Caldwell Meeker postdoctoral fellowship at the Field Museum of Natural History.
Supplementary Material
Supplemental materials deposited at Dryad: doi:10.5061/dryad.3k7v7