I. Introduction
A large and growing literature documents that connections between firms and politicians are widespread in the United States and worldwide and shows that these connections significantly affect firm value (e.g., Fisman (Reference Fisman2001), Johnson and Mitton (Reference Johnson and Mitton2003), Faccio (Reference Faccio2006), Goldman, Rocholl, and So (Reference Goldman, Rocholl and So2009), Cooper, Gulen, and Ovtchinnikov (Reference Cooper, Gulen and Ovtchinnikov2010), Amore and Bennedsen (Reference Amore and Bennedsen2013), and Akey (Reference Akey2015)). Extant literature also shows that politically connected firms on average avoid more taxes and are subject to less tax scrutiny (e.g., Kim and Zhang (Reference Kim and Zhang2016), Lin, Mills, Zhang, and Li (Reference Lin, Mills, Zhang and Li2018)). In this article, we contribute to the literature by hypothesizing and providing empirical evidence that the effect of political connections on corporate taxation depends critically on firms’ financial conditions and that political connections can reduce the tax planning of financially constrained firms.
Our hypothesis builds on two strands of literature. One is the literature on the effect of political connections on firms’ financial constraints. This literature shows that political connections can increase the likelihood of firms being bailed out when they experience financial distress (Faccio, Masulis, and McConnell (Reference Faccio, Masulis and McConnell2006)) and can lead to lower costs of debt financing (Houston, Jiang, Lin, and Ma (Reference Houston, Jiang, Lin and Ma2014)), thereby mitigating firms’ financial constraints (Cull, Li, Sun, and Xu (Reference Cull, Li, Sun and Xu2015), Bussolo, de Nicola, Panizza, and Varghese (Reference Bussolo, de Nicola, Panizza and Varghese2019)). The second literature studies the role of tax planning as a source of internal financing. This literature shows that financially constrained firms pursue more aggressive tax strategies than their unconstrained counterparts (Law and Mills (Reference Law and Mills2015)) and that changes in financial constraints are positively associated with changes in future tax planning (Edwards, Schwab, and Shevlin (Reference Edwards, Schwab and Shevlin2016)), consistent with internal financing being an important motive for financially constrained firms to avoid taxes.Footnote 1 We thus expect that by mitigating firms’ financial constraints and consequently reducing the relative benefit of using tax planning as a source of internal financing, political connections have the potential to reduce tax planning, especially for financially constrained firms (financing effect).
Besides the financing effect, political connections can also influence corporate taxation through weakened enforcement of tax laws and regulations (protection effect) and the provision of confidential information regarding future changes in tax laws (information effect) (e.g., Kim and Zhang (Reference Kim and Zhang2016), Lin et al. (Reference Lin, Mills, Zhang and Li2018)). The protection and information effects are associated with lower expected cost of tax planning and consequently should increase firms’ incentives to engage in such an action. To the extent that these two effects overwhelm the financing effect, political connections can result in more tax planning. Thus, the effect of political connections on corporate taxation is an empirical question and likely depends critically on firms’ financial conditions.
To empirically identify the effect of political connections on firms’ tax planning and the role of their financial constraints, we exploit close congressional elections as exogenous shocks to firms’ political connections. The idea of this approach is that although the outcome of a congressional election is determined by many factors, such as candidate, region, and time, an element of randomness shapes the outcome of a close election, in which candidates marginally win or lose (Lee (Reference Lee2008), Akey (Reference Akey2015)). Thus, firms that contribute to politicians who just win a close election can be considered to experience an exogenous increase in political connections, while those that donate to politicians who narrowly lose the election can be considered to experience an exogenous decrease in political connections. The effect of political connections on tax planning can then be identified by comparing changes in the tax planning of financially constrained firms connected to marginally winning politicians versus those connected to politicians who just lose. Moreover, changes in tax planning of financially unconstrained firms in response to shocks to political connections provide a benchmark for how firms’ tax behavior would have evolved in the absence of financial constraints, which enables us to disentangle the role of financial constraints in shaping the effect of political connections on corporate tax planning.
We first study the tax behaviors of a full sample of firms regardless of whether they are financially constrained. We measure firms’ tax planning using both cash effective tax rates (Cash ETR) and book–tax differences (BTD). Cash ETR captures the extent to which firms reduce cash tax payments and thereby preserve internal financing, while BTD reflects discrepancies between accounting income and taxable income that arise from tax planning activities. We find that exogenous increases in political connections arising from winning or losing of close elections are not associated with significant changes in cash effective tax rates, which appears to be inconsistent with prior studies that document positive associations between politicians’ campaigns and corporate lobbying expenditures and corporate tax planning (Richter, Samphantharak, and Timmons (Reference Richter, Samphantharak and Timmons2009), Brown, Drake, and Wellman (Reference Brown, Drake and Wellman2015)). These conflicting results could arise for several reasons. First, political connections are endogenous (Hillman and Hitt (Reference Hillman and Hitt1999)). The positive cross-sectional relation between political connections and tax planning in prior studies is likely to be a manifestation of firms that avoid more taxes investing more in political connections or driven by unobserved firm characteristics that are related to both political connections and tax planning (Faccio (Reference Faccio2016)). Second, political connections may affect the tax behaviors of firms with different financial conditions in different ways. To the extent that the financing effect of decreased tax planning dominates in financially constrained firms and the protection and information effects of increased tax planning dominate in firms without financial constraints, we may observe no changes in tax planning in response to shocks to political connections for an average firm using the full sample.
Accordingly, we partition the full sample by firms’ financial conditions and examine changes in corporate tax planning for financially constrained and unconstrained firms separately in response to shocks to political connections. Following Hadlock and Pierce (Reference Hadlock and Pierce2010), we measure financial constraints using the Hadlock–Pierce (HP) index, which is constructed mainly based on firm size and age. Consistent with our prediction, we find that, after obtaining more political connections in closely won elections, financially constrained firms experience a significant increase in cash effective tax rates, suggesting that firms with financial constraints engage in less tax planning in response to increases in political connections. As more direct evidence, constrained firms’ tax-related spending on auditor provided tax services declines following increases in political connections. In contrast, financially unconstrained firms engage in more tax planning and more tax-related expenditures in response to increases in political connections, as evidenced by a lower Cash ETR and a tax-related fee measure, consistent with findings in prior studies.
We next examine the mechanisms through which political connections affect the tax planning of financially constrained firms. The financing effect builds on the idea of more and cheaper external financing after obtaining more political connections. We thus study changes in bank loans and bond issuances in response to shocks to political connections and the effect of these changes on the tax planning of constrained firms. We find that after increases in political connections, financially constrained firms are more likely to obtain new bank loans and issue new public bonds. Their cost of debt financing, defined as the loan spread quoted in basis points over a floating benchmark and bond yield, is also significantly lower. More importantly, decreases in tax planning are only present among financially constrained firms that obtain new bank loans and public bonds in the year after increases in political connections. We do not find corresponding changes for financially unconstrained firms. These findings support the idea that financially constrained firms have better access to external debt financing after becoming more politically connected and consequently have less incentive to use tax planning as an internal source of financing.
Dhaliwal, Judd, Serfling, and Shaikh (Reference Dhaliwal, Judd, Serfling and Shaikh2016) argue that government contractors are less risky and find that these firms have lower cost of capital. Goldman (Reference Goldman2020) documents that government contractors receive more bank credit during the financial crisis, suggesting that government contracts can improve firms’ credit quality as perceived by lenders, which helps firms access bank credit. In addition, government contracts can also increase firms’ cash flows. We thus study changes in government contracts for financially constrained firms, which could be an indirect way through which connected politicians mitigate firms’ financial constraints. We find that after obtaining more political connections, constrained firms are more likely to receive government contracts and that the value of government contracts awarded to these firms also increases. Again, we find weak evidence on changes in government contracts for unconstrained firms.
To provide further evidence that changes in tax planning are driven by changes in political connections, we explore variation in the characteristics of connected politicians and firms that make campaign contributions. First, we examine whether the impact of political connections on tax planning is more pronounced when the connected politicians serve on committees related to banking and financing matters. We focus on the Senate Committee on Banking, Housing, and Urban Affairs and the House Committee on Financial Services (financing-related committees). The former has jurisdiction over matters related to banks and financial aid to the industry. The latter oversees the entire financial services industry, such as the banking and securities industries, as well as the work of financial regulators. Consistent with our expectation, we find that decreases in the tax planning of financially constrained firms are significantly greater when the winning connected politicians are on financing-related committees. In contrast, we show that increases in the tax planning of unconstrained firms are not related to whether the connected politicians serve on financing-related committees but are more pronounced when the newly connected politicians are on tax-related committees. These findings provide further support to the idea that political connections reduce the incentives of financially constrained firms to engage in tax planning by providing more and cheaper external financing opportunities.
Second, favorable treatments in financing are valuable resources that are unlikely to be granted to everyone. As banks and regulators are interested in maximizing their economic benefits, they are more likely to favor firms connected with more powerful politicians. We find that the effects of political connections on corporate tax planning are significantly stronger when the connected politician holds a leadership position in the Congress,Footnote 2 he or she belongs to the majority party in both the Senate and the House, and his or her seniority is among the top 25% of the members of the two bodies.
Third, a politician may not uniformly cater to his or her contributors and is likely to pay more attention to firms that are more important to her. We find that the relation between political connections and tax planning is significantly greater when the firm is a top donor for a winning candidate and when the firm is in one of the top 3 important industries in its headquarters state. Taken together, the results on politician power and firm importance support our argument that it is the change in political connections that drives the decrease in tax planning of financially constrained firms.
This study makes several contributions to the literature. First, it contributes to the understanding of the tax behaviors of politically connected firms (Hanlon and Heitzman (Reference Hanlon and Heitzman2010), Faccio (Reference Faccio2016)). Existing research focuses exclusively on the role of political connections in reducing the expected costs of tax planning (e.g., Richter et al. (Reference Richter, Samphantharak and Timmons2009), Brown et al. (Reference Brown, Drake and Wellman2015), Kim and Zhang (Reference Kim and Zhang2016)), leaving unexplored the possibility of political connections decreasing the relative benefits of tax planning and thus reducing firms’ incentives to engage in such activity. We fill this void and show that after obtaining more political connections, although financially unconstrained firms increase tax planning, constrained firms decrease their tax planning, and this decrease is driven by better access to external debt financing. These findings highlight the importance of financial constraints and the financing effects, which have been largely ignored in prior literature, in understanding the tax planning of politically connected firms. In this regard, our article answers the call of Faccio (Reference Faccio2016) for research to use plausibly exogenous shocks to better understand the driving forces behind the relation between political connections and corporate taxation.
Second, this article adds to the literature on the consequences of political connections. Prior studies show that political connections improve firm value and consider some mechanisms through which firms benefit from political connections (e.g., Fisman (Reference Fisman2001), Johnson and Mitton (Reference Johnson and Mitton2003), Khwaja and Mian (Reference Khwaja and Mian2005), Faccio (Reference Faccio2006), Faccio et al. (Reference Faccio2006), Leuz and Oberholzer-Gee (Reference Leuz and Oberholzer-Gee2006), Duchin and Sosyura (Reference Duchin and Sosyura2012)). As taxes have a first-order effect on firm value, studying changes in tax planning in response to shocks to political connections provides further insights into how firms benefit from connections with politicians. We contribute to the literature by showing that political connections benefit financially unconstrained firms by lowering their taxes and help constrained firms obtain external financing and government contracts that substitute for costly internal financing through tax strategies. These findings suggest that political connections do not necessarily benefit all firms in the same way.
The remainder of this article is organized as follows: Section II links our article to the literature, discusses its contribution, and develops our hypotheses. Section III describes our setting and measures of main variables. Section IV presents the empirical results. Section V concludes.
II. Related Literature and Hypotheses Development
In this section, we review the literature from which our study draws and develop our hypotheses. The first stream of literature examines the economic consequences of political connections. Fisman (Reference Fisman2001) documents that the market value of Indonesian firms connected with former President Suharto significantly declined in response to bad news about Suharto’s health. Faccio (Reference Faccio2006) studies the political connections of firms in 47 countries and finds that the announcements of large shareholders or officers entering politics are associated with significantly positive market reactions. Goldman et al. (Reference Goldman, Rocholl and So2009) show that the announcement of the nomination of politically connected board members is associated with positive abnormal stock returns. Cooper et al. (Reference Cooper, Gulen and Ovtchinnikov2010) find that firm contributions to U.S. political campaigns are positively associated with the cross section of future returns. These findings suggest that political connections boost firm value. Recent studies examine the mechanisms through which political connections improve firm value and document that politically connected firms have preferential access to finance, either because banks grant favorable terms to politically connected firms (Khwaja and Mian (Reference Khwaja and Mian2005), Claessens, Feijen, and Laeven (Reference Claessens, Feijen and Laeven2008)) or because these firms are more likely to be bailed out and have a lower bankruptcy probability (Faccio et al. (Reference Faccio2006), Duchin and Sosyura (Reference Duchin and Sosyura2012), and Houston et al. (Reference Houston, Jiang, Lin and Ma2014)), and receive favorable treatment in the allocation of procurement contracts (Goldman, Rocholl, and So (Reference Goldman, Rocholl and So2013), Tahoun (Reference Tahoun2014)). They also show that political connections are associated with weaker enforcement of laws and regulations (Hunter and Nelson (Reference Hunter and Nelson1995), Young, Reksulak, and Shughart (Reference Young, Reksulak and Shughart2001), Yu and Yu (Reference Yu and Yu2011), Correia (Reference Correia2014), Lin et al. (Reference Lin, Mills, Zhang and Li2018), and Fulmer, Knill, and Yu (Reference Fulmer, Knill and Yu2023)).
The second strand of literature studies the costs and benefits that affect firms’ incentives to engage in tax planning. On the one hand, tax avoidance is typically associated with potential future costs such as tax repayments, penalties, and interests. Firms with a large difference between book and tax income are likely to face greater scrutiny by tax authorities (Mills (Reference Mills1998), Rego and Wilson (Reference Rego and Wilson2012)). Using a sample of 14 tax shelters that were successfully challenged by the tax authorities, Wilson (Reference Wilson2009) shows that the interest and penalties associated with tax sheltering are economically significant. Consistent with firms avoiding more taxes when the expected cost of tax enforcement is lower, studies document that the rate of Internal Revenue Service (IRS) tax audit is negatively associated with corporate tax planning (Hoopes, Mescall, and Pittman (Reference Hoopes, Mescall and Pittman2012)) and that firms in countries where tax enforcement is perceived to be weaker engage in more tax planning (Atwood, Drake, Myers, and Myers (Reference Atwood, Drake, Myers and Myers2012)). On the other hand, tax planning is also associated with immediate cash tax savings that can be used by financially constrained firms, which face more frictions and higher costs in raising external funds, as a source of internal financing. In particular, Law and Mills (Reference Law and Mills2015) use a linguistic measure of financial constraints based on firms’ qualitative disclosures and find that financially constrained firms pursue more aggressive tax planning strategies and have lower effective tax rates. Edwards et al. (Reference Edwards, Schwab and Shevlin2016) show that increases in firm-specific and macroeconomic measures of financial constraints are associated with increases in cash tax planning. Dyreng and Markle (Reference Dyreng and Markle2016) suggest that the benefits of shifting income from the United States to foreign jurisdictions are lower for financially constrained firms because they have higher costs of external financing and thus are less able to defer the repatriation, which face the same U.S. tax as nonshifted income. Campbell, Goldman, and Li (Reference Campbell, Goldman and Li2021) show that firms engage in more tax planning after an exogenous increase in financial constraints arising from the immediately required pension contributions in response to the Pension Protection Act of 2006. Overall, these studies suggest that internal financing is an important motive for tax planning by financially constrained firms.
Existing research on the tax planning of politically connected firms has focused exclusively on the role of political connections in reducing the expected costs of tax planning. This research argues that politicians can protect connected firms by reducing regulatory oversight (protection effect) and provide firms with policy-relevant information regarding future regulatory or policy changes (information effect). A growing literature in political economy and accounting documents that political connections can lead to regulatory forbearance and weaker enforcement of laws and regulations (e.g., Mehta, Srinivasan, and Zhao (Reference Mehta, Srinivasan and Zhao2020), Mehta and Zhao (Reference Mehta and Zhao2020), Akey, Heimer, and Lewellen (Reference Akey, Heimer and Lewellen2021), Bourveau, Coulomb, and Sangnier (Reference Bourveau, Coulomb and Sangnier2021), Baker, Frydman, and Hilt (Reference Baker, Frydman and Hilt2023)). Another related line of research shows that political connections can provide firms with policy-relevant information and insights about regulatory priorities or future policy changes (e.g., Gao and Huang (Reference Gao and Huang2016), Christensen, Mikhail, Walther, and Wellman (Reference Christensen, Mikhail, Walther and Wellman2017), Ovtchinnikov, Reza, and Wu (Reference Ovtchinnikov, Reza and Wu2020)). As a result, politically connected firms should have stronger incentives to avoid taxes given the lower detection risk and less uncertainty about tax enforcement. Consistent with this prediction, Richter et al. (Reference Richter, Samphantharak and Timmons2009) document that firms spending more on lobbying in a given year have lower effective tax rates in the next year. Brown et al. (Reference Brown, Drake and Wellman2015) find that firms making campaign contributions to tax policy makers have lower future cash and GAAP ETRs and their future Cash ETRs are also less volatile. They also show that tax-specific lobbying has an incremental tax benefit for firms that build connections with tax policymakers via campaign contributions. Kim and Zhang (Reference Kim and Zhang2016) use campaign contributions, lobbying, and employment of connected directors to measure political connections and find that politically connected firms engage in more aggressive tax planning activities. Using Chinese data, Lin et al. (Reference Lin, Mills, Zhang and Li2018) find that the relation between tax enforcement and effective tax rates is lower for firms with politically connected board members, supporting the idea that lower detection risk and penalties are one mechanism through which political connections affect corporate tax planning. Overall, the extant literature is consistent with politically connected firms avoiding more taxes.
Besides lowering the expected costs of tax planning, political connections can also affect corporate tax planning by lowering the costs of external financing and relaxing firms’ financial constraints and consequently, reducing the relative benefits of using tax planning as a source of internal financing. This financing effect has been largely ignored in the literature and would suggest decreases in firms’ incentives to avoid taxes after increases in political connections.
Because the protection and information effects and the financing effect are in opposite directions, changes in tax planning in response to shocks to political connections likely depend on the degree of firms’ financial constraints. We expect the financing effect to be more important for financially constrained firms, because they are more likely to use cash flows from tax planning as a source of internal financing. Thus, they face decreases in both the costs of tax planning (protection and information effects) and the relative benefits of using it as a financing tool (financing effect) in response to shocks to political connections. To the extent that financing is the primary motive for tax planning of financially constrained firms, the financing effect is likely to be more pronounced and outweighs the protection and information effects for these firms. In such a scenario, constrained firms are likely to pursue less tax planning in response to increases in political connections. We thus test the following two hypotheses in alternative forms.
Hypothesis 1. Political connections have differential effects on the tax planning of financially constrained and unconstrained firms.
Hypothesis 2. Political connections reduce the tax planning of financially constrained firms by alleviating their financial constraints.
III. Data and Variable Construction
A. Measures of Tax Planning
We construct two measures to proxy for corporate tax planning. The first one is cash effective tax rate (CASH_ETR). We follow a similar definition to that of Graham, Hanlon, Shevlin, and Shroff (Reference Graham, Hanlon, Shevlin and Shroff2014) and measure CASH_ETR, as follows:

where TXPD refers to total cash taxes paid and PI refers to pretax income. We drop observations with negative pretax income because the effective tax rates of these loss firms are difficult to interpret when pooled with profitable firm-year observations. We also truncate effective tax rates at 0 and 1. We multiply the measure by −1 so that CASH_ETR is increasing in firms’ tax planning.
Our second measure, book–tax differences (BTD), following Goh, Lee, Lim, and Shevlin (Reference Goh, Lee, Lim and Shevlin2016), is defined in equation (2) as follows:

where PI refers to pretax income, TXFED refers to current federal tax expense, TXFO refers to current foreign tax expense, and STR refers to the statutory tax rate. The book–tax differences are then scaled by lagged total assets. Firms that engage in more tax planning are expected to have higher book–tax differences.Footnote 3
B. Measures of Political Connection
As suggested by Hillman and Hitt (Reference Hillman and Hitt1999), political strategies are endogenously adopted by firms to achieve favorable public policy outcomes that lead to sustainable success. To isolate the effect of political connections on the tax planning of financially constrained firms from other firm characteristics, we follow Akey (Reference Akey2015) and use changes in political connections arising from close elections to establish causality. The identification assumption of this approach is that there is some randomness in determining the outcome of a close election (Lee (Reference Lee2008)). We compare the outcomes of firms contributing to candidates who marginally win to those of firms donating to candidates who marginally lose and document the causal effect of political contributions on firms’ tax planning. Following Do, Lee, Nguyen, and Nguyen (Reference Do, Lee, Nguyen and Nguyen2012) and Do, Lee, and Nguyen (Reference Do, Lee and Nguyen2015), we define close elections as those that are won or lost by 5 percentage points or fewer.Footnote 4
We manually collect federal congressional election results from the Federal Election Commission (FEC) and Constituency-Level Elections Archive (CLEA). To make a political contribution to a candidate in a federal congressional election, a firm must first establish a political action committee (PAC). The candidate must also establish a PAC to receive contributions because they cannot personally receive money from firms’ PACs. After the Supreme Court ruling in Citizens United v. Federal Election Commission on Jan. 21, 2010, the “Super PAC” was created, which allows donors to shield their identities. Thus, our sample is restricted to 1980–2010 because we cannot clearly map Super PAC donors to recipient politicians after 2010.
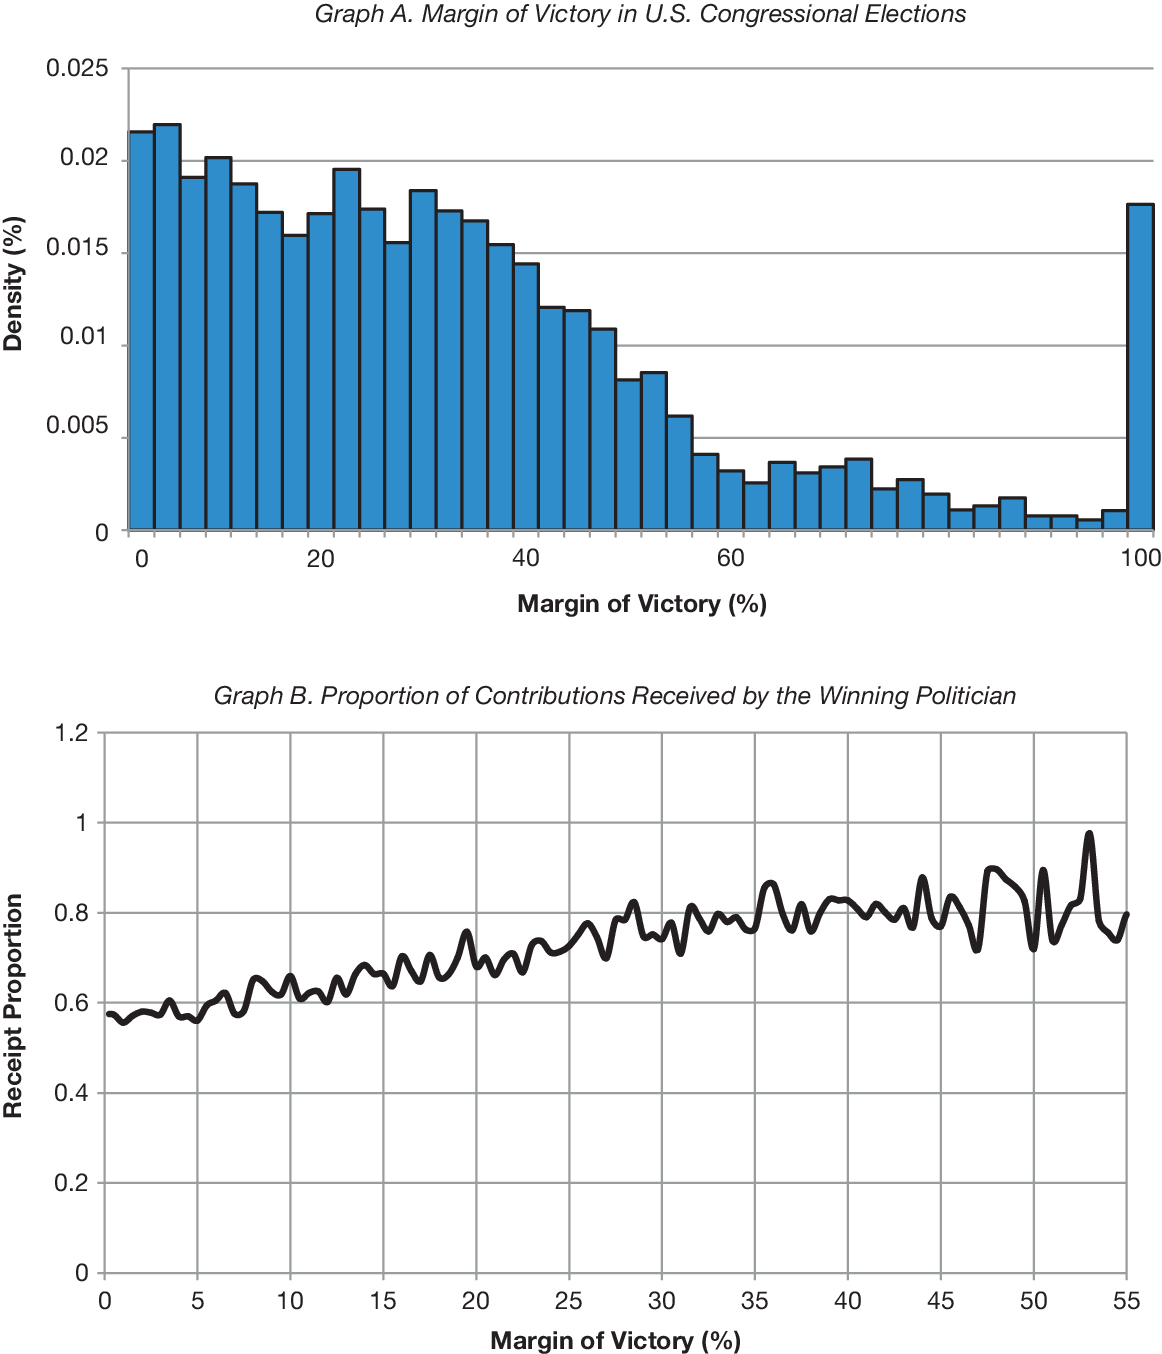
Figure 1 presents a histogram of the margin of victory for all elections in the United States from 1980 to 2010. The average election was won by a margin of 31.4%, whereas the median election was won by 26.8%, comparable to the numbers reported in Akey (Reference Akey2015). The 5% cutoff we impose for our analysis falls at about the sixth percentile. Thus, in comparison with a typical election, these elections are close.
Graph A of Figure 1 presents a histogram of the margin of victory for all U.S. general congressional elections from 1980 to 2010. Graph B plots the average proportion of total contributions made to the winning candidate of an election (y-axis) against the margin of victory by which the candidate won the election (x-axis).

FIGURE 1 Long description
The image consists of two vertically stacked panels.
Top Panel: Graph A. Margin of Victory in U.S. Congressional Elections.
* The x-axis is labeled Margin of Victory % and ranges from 0 to 100.
* The y-axis is labeled Density % and ranges from 0 to 0.025.
* The histogram shows a high density of elections with a margin of victory between 0 and 40 percent, peaking near 0.022 at the low end. The density gradually declines as the margin increases toward 80 percent. There is a notable spike in density at the 100 percent margin mark, reaching approximately 0.018.
Bottom Panel: Graph B. Proportion of Contributions Received by the Winning Politician.
* The x-axis is labeled Margin of Victory % and ranges from 0 to 55.
* The y-axis is labeled Receipt Proportion and ranges from 0 to 1.2.
* The data is represented by a jagged black line showing a positive linear correlation. At a 0 percent margin of victory, the proportion of contributions is approximately 0.6. As the margin of victory increases to 55 percent, the proportion of contributions trends upward with significant fluctuations, ending near 0.8.
We identify the flow of money from firm PAC to candidate PAC by examining PAC money transfer records from FEC bulk data sets. We first match the firm names in the contribution-level data and Compustat and obtain 1,580,770 contribution records donated by Compustat-firm PACs. The PAC-level data define six PAC designations.Footnote 5 We merge the Federal Election Commission-level data with the contribution-level data and require that the recipient must be a Senate or House election candidate’s PAC, and its designation must be either authorized by a candidate, authorized by the principal campaign committee of a candidate, or unauthorized.Footnote 6 After excluding records with missing candidate IDs and dropping contributions that are donated to neither Democratic nor Republican candidates, we are left with 1,255,415 contribution records.
Next, we merge the contribution-level data with the election results data from the Federal Election Commission (FEC) and the Constituency-Level Elections Archive (CLEA), which have candidate-level information, such as election outcomes and voting shares. From the election outcomes, we define an election as “close” if the winner’s vote share differs from that of his or her closest competing candidate by less than 5 percentage points. We manually match candidate names when merging the contribution-level data with election result data. When candidate names are missing, we drop the observations. After the merger, we are left with 984,604 direct contribution records of which 119,369 records relate to Senate elections and 865,235 records relate to House elections. Out of these contribution records, 90,071 are close elections.
We then aggregate the contribution amount for each firm PAC-candidate PAC-election cycle observation and obtain 45,726 observations from 1980 to 2010.Footnote 7 We further aggregate the contribution amount into firm-cycle-level data. We record the number of winning and losing candidates j that each firm f supported in one cycle prior to each close election at time t. Specifically, we compute the following two variables for each firm-cycle-candidate combination:

where
$ Donate{d}_{fjt} $
 equals 1 if firm f’s PAC donated to candidate j’s election PAC in cycle t and 0 otherwise.
$ Election\ Outcom{e}_{jt} $
 takes the value of 1 if candidate j wins (loses for
$ Lose{P}_{ft} $
 ) the close election in cycle t and 0 otherwise. We divide WinP and LoseP by 100 to have sizeable coefficients in empirical analysis. We then construct a variable
$ {TotalP}_{ft} $
 as the difference between
$ Win{P}_{ft} $
 and
$ Lose{P}_{ft} $
 to measure a firm’s net political connection portfolio.
C. Measures of Financial Constraint
We proxy financing frictions using two established indices: an index based on firm size and age developed by Hadlock and Pierce (Reference Hadlock and Pierce2010), the HP index, and the text-based financial-constraint measures of Hoberg and Maksimovic (Reference Hoberg and Maksimovic2015), the Hoberg and Maksimovic (HM) index. The HP index is computed from Compustat as follows:

where Size is the log of inflation-adjusted total assets (2004 dollars) capped at log($4.5 billion) and Age is the number of years the firm has a nonmissing stock price on Compustat, capped at 37. Higher HP values indicate tighter constraints.
The HM Index is obtained from the authors’ data library.Footnote 8 We focus on the DelayCon score, which captures the degree to which a firm resembles those prone to delaying investment due to liquidity constraints. Higher values of the HM Index indicate greater external financing frictions.Footnote 9 Table 1 reports summary statistics for all variables.Footnote 10

TABLE 1 Long description
The table presents summary statistics for 4,999 observations in the full sample, divided into 2,282 financially constrained and 2,717 financially unconstrained observations.
1. Tax avoidance measures:
- C A S H underscore E T R: Full sample mean -0.2793, Std. Dev. 0.2200.
- B T D: Full sample mean 0.0294, Std. Dev. 0.0442.
- T X P D underscore A T: Full sample mean -0.0248, Std. Dev. 0.0258.
2. Political connection measures:
- Total P: Full sample mean 0.0099.
- Win P: Full sample mean 0.0383.
- Lose P: Full sample mean 0.0284.
- Amount Total P: Full sample mean 0.0172.
- Amount Win P: Full sample mean 0.0960.
- Amount Lose P: Full sample mean 0.0788.
3. Interaction variables:
- Banking underscore Committee: Full sample mean 0.2753.
- Tax underscore Committee: Full sample mean 0.3151.
- Leadership: Full sample mean 0.0568.
- Majority underscore Seats: Full sample mean 0.4101.
- Seniority: Full sample mean 0.2573.
- Top 5 underscore Donor: Full sample mean 0.1268.
- Donate 10 Pct: Full sample mean 0.0418.
- Crucial underscore Industry underscore Emp: Full sample mean 0.2080.
- Obtain underscore Finance: Full sample mean 0.4195.
- Tax Reform Year: Full sample mean 0.2605.
- Corporate Tax Change: Full sample mean 0.0888.
4. Control variables:
- S I Z E: Full sample mean 7.9866 (Constrained: 6.5513, Unconstrained: 9.1922).
- R O A: Full sample mean 0.0871.
- L E V E R A G E: Full sample mean 0.3188.
- S G A: Full sample mean 0.1596.
- R underscore D: Full sample mean 0.0170.
- N O L C F: Full sample mean 0.0344.
- C H G underscore N O L C F: Full sample mean 0.0019.
- F O R underscore I N C O M E: Full sample mean 0.0136.
- L O S S: Full sample mean 0.2126.
- S T R: Full sample mean 0.0606.
5. Other dependent variables:
- P R E T A X underscore M A R G I N: Full sample mean 0.1007.
- C A P E X: Full sample mean 0.0645.
- R D underscore I N T E N S I T Y: Full sample mean 0.0156.
- M A underscore D U M M Y: Full sample mean 0.3019.
- M A underscore D E A L underscore V A L: Full sample mean 1.6969.
- T A X underscore F E E S: Full sample mean 0.0992 (Count 2,126).
- O B T A I N underscore L O A N: Full sample mean 0.3477.
- I S S U E underscore B O N D: Full sample mean 0.1568.
- O B T A I N underscore C O N T R A C T: Full sample mean 0.0261 (Count 2,450).
- C O N T R A C T underscore V A L U E: Full sample mean 0.3414.
- P O T E N underscore C O N T R A C T underscore V A L: Full sample mean 0.3905.
IV. Empirical Results
A. The Impact of Political Connections on Tax Planning
To examine the effect of political connections on tax planning, we estimate the following regression model:

where
$ {TP}_{ft+1} $
 represents our measures of tax planning in the year after election cycle t for firm f.
$ {Con}_{ft} $
 is our proxy for the political connections of firm
$ f $
 in an election cycle
$ t $
 . We use two different measures of
$ Co{n}_{ft} $
 . The first one uses a net change in firms’ political connection portfolio (TotalP), and the second one uses separate measures of obtaining political connections (WinP) and losing such connections (LoseP). We also include firm fixed effects,
$ {\varPhi}_f $
 , which control for the effects of time-invariant firm characteristics on tax planning, and year fixed effects,
$ {\varPhi}_t $
 , which control for the time trend in tax planning and changes in the top federal corporate statutory tax rate across years.
$ {\chi}_{ft} $
 represents a vector of control variables following prior studies (e.g., Chen et al. (Reference Chen, Chen, Cheng and Shevlin2010)). Detailed definitions of control variables are provided in the Appendix.
Using the full sample, we present our first set of estimation results in Table 2. In column 1, we use CASH_ETR and find that the coefficient on TotalP is positive but not statistically significant, suggesting that changes in political connections are not associated with significant changes in cash effective tax rates. In column 2, we decompose TotalP into WinP and LoseP and regress CASH_ETR on WinP and LoseP. Consistent with the result in column 1, we do not find statistically significant coefficients on WinP and LoseP. In columns 3 and 4, we use BTD as the dependent variable and find that BTD is not related to TotalP, WinP, and LoseP. Taken together, the results in Table 2 suggest that corporate tax planning does not change on average in response to shocks to political connections arising from connected politicians winning or losing close elections.

TABLE 2 Long description
The table consists of four columns of regression results. Columns 1 and 2 use CASH_ETR as the dependent variable, while columns 3 and 4 use B T D.
Key independent variables include:
* Total P: 0.058 in column 1 and 0.008 in column 3.
* Win P: 0.076 in column 2 and 0.008 in column 4.
* Lose P: -0.000 in column 2 and -0.008 in column 4.
Significant control variables across all models include:
* S I Z E: Negative coefficients ranging from -0.011 to -0.016, significant at 1% or 10% levels.
* R O A: Positive coefficients ranging from 0.034 to 0.349, significant at 1% or 5% levels.
* L O S S: Positive coefficients ranging from 0.006 to 0.035, significant at the 1% level.
* N O L C F: Positive and significant at 1% in columns 1 and 2 (0.106).
* F O R _ I N C O M E: Positive and significant at 5% in columns 1 and 2 (0.482 and 0.483).
Model statistics at the bottom indicate:
* Year F E and Firm F E are included in all models.
* Standard errors are clustered at the Firm level.
* Number of observations: 4,999 for columns 1 and 2; 4,052 for columns 3 and 4.
* Adjusted R-squared: 0.25 for columns 1 and 2; 0.38 for columns 3 and 4.
Next, we separate our sample into two subsamples based on firms’ financial constraints. The financially constrained subsample consists of firms whose HP Index is above the sample median in the year preceding election cycle t, while the unconstrained subsample includes those with scores below the median. We present the regression results for financially constrained firms in Panel A of Table 3. In column 1, we use CASH_ETR to measure tax planning and find that the coefficient of TotalP is significantly negative, suggesting that financially constrained firms pursue less tax planning after they obtain more political connections. In terms of economic significance, a net increase in one connected politician is associated with a 0.835-percentage-point decrease in CASH_ETR (≈2.97% of the sample mean in absolute terms).Footnote 11 In column 2, we regress CASH_ETR on WinP and LoseP and find results consistent with those in column 1. In columns 3 and 4, we present the results of using BTD to measure tax planning and find consistent results. Taken together, the results in Panel A of Table 3 suggest that financially constrained firms decrease tax planning after obtaining more political connections.
Panel B of Table 3 presents the results for financially unconstrained firms. We find that political connections have opposite impacts on the tax planning of unconstrained firms. In particular, using TotalP as the measure of shocks to political connections, we find that unconstrained firms reduce cash effective tax rates and increase book–tax differences. Moreover, winning (losing) close elections by connected politicians leads to lower (higher) cash effective tax rates and higher (lower) book–tax differences for financially unconstrained firms. These results suggest that financially unconstrained firms pursue more tax planning after obtaining more political connections.

TABLE 3 Long description
Panel A. Financially Constrained Firms.
* Column 1 and 2: Dependent variable is CASH underscore E T R. Total P has a coefficient of minus 0.835 (significant at 1 percent). Win P is minus 0.729 (significant at 5 percent) and Lose P is 1.149 (significant at 1 percent).
* Column 3 and 4: Dependent variable is B T D. Total P is minus 0.110 (significant at 5 percent). Win P is minus 0.097 (significant at 10 percent) and Lose P is 0.148 (significant at 5 percent).
* Fixed effects for Year and Firm are included. Number of observations ranges from 2,022 to 2,282. Adjusted R-squared is 0.29 for CASH underscore E T R and 0.42 for B T D.
Panel B. Financially Unconstrained Firms.
* Column 1 and 2: Dependent variable is CASH underscore E T R. Total P has a coefficient of 0.351 (significant at 5 percent). Win P is 0.317 (significant at 5 percent) and Lose P is minus 0.461 (significant at 10 percent).
* Column 3 and 4: Dependent variable is B T D. Total P is 0.075 (significant at 5 percent). Win P is 0.069 (significant at 5 percent) and Lose P is minus 0.092 (significant at 5 percent).
* Fixed effects for Year and Firm are included. Number of observations ranges from 2,030 to 2,717. Adjusted R-squared is 0.24 for CASH underscore E T R and 0.31 for B T D.
As a robustness test, we use the HM Index as an alternative measure of financial constraints in Table 4 and find results consistent with those in Table 3. Collectively, these results are consistent with our conjecture that, for financially constrained firms, more political connections lead to less tax planning, while, for their financially unconstrained counterparts, similar increases lead to an increase in tax planning.

TABLE 4 Long description
Panel A. Financially Constrained Firms.
Columns 1 and 2 use C A S H underscore E T R as the dependent variable. Columns 3 and 4 use B T D.
Total P: -1.111 in column 1 and -0.249 in column 3, both significant at 1 percent.
Win P: -1.135 in column 2 and -0.254 in column 4, both significant at 1 percent.
Lose P: 1.043 in column 2 and 0.231 in column 4, both significant at 5 percent.
Controls, Year F E, and Firm F E are included across all models.
Number of observations: 844 for C A S H underscore E T R and 520 for B T D.
Adjusted R-squared: 0.34 for C A S H underscore E T R and 0.52 for B T D.
Panel B. Financially Unconstrained Firms.
Total P: 0.699 in column 1 and 0.273 in column 3, both significant at 1 percent.
Win P: 0.641 in column 2 and 0.269 in column 4, both significant at 5 percent and 1 percent respectively.
Lose P: -0.849 in column 2 and -0.282 in column 4, both significant at 5 percent.
Number of observations: 844 for C A S H underscore E T R and 575 for B T D.
Adjusted R-squared: 0.46 for C A S H underscore E T R and 0.42 for B T D.
B. Tax-Related FeesFootnote 12
Previous literature suggests that higher fees paid to auditors for tax services enable firms to achieve their tax planning objectives through greater tax avoidance (e.g., McGuire, Wang, and Wilson (Reference McGuire, Wang and Wilson2014), Hogan and Noga (Reference Hogan and Noga2015), Klassen, Lisowsky, and Mescall (Reference Klassen, Lisowsky and Mescall2016), Cook, Kim, and Omer (Reference Cook, Kim and Omer2020)). To provide more direct evidence of firms’ tax planning activities, following Francis, Neuman, and Newton (Reference Francis, Neuman and Newton2019) and Brown, Guo, and Zheng (Reference Brown, Guo and Zheng2024), we construct the variable TAX_FEES as the ratio of tax fees paid to the auditor divided by total auditor fees to measure audit fees allocated to tax services. The data are from Audit Analytics.Footnote 13
We regress TAX_FEES on TotalP, WinP, and LoseP, together with controls, estimating the model separately for financially constrained and unconstrained firms classified by the HP index. The results are presented in Table 5. Net increases in political connections induced by close elections are associated with significant reductions in tax-related expenditures for constrained firms but significant increases for unconstrained firms.

TABLE 5 Long description
The table consists of four columns under the dependent variable T A X underscore F E E S. Columns 1 and 2 represent Financially Constrained Firms, while columns 3 and 4 represent Financially Unconstrained Firms.
Key independent variables include:
* Total P: -0.361 (significant at 1%) in column 1 and 0.271 (significant at 5%) in column 3.
* Win P: -0.318 (significant at 5%) in column 2 and 0.245 (significant at 10%) in column 4.
* Lose P: 0.436 (significant at 5%) in column 2 and -0.336 (significant at 5%) in column 4.
Control variables and their coefficients across columns 1 through 4:
* S I Z E: -0.001, -0.002, 0.025, 0.026 (significant at 10%).
* R O A: 0.142 (significant at 5%), 0.141 (significant at 5%), 0.076, 0.076.
* L E V E R A G E: -0.007, -0.007, 0.060 (significant at 10%), 0.060 (significant at 10%).
* S G A: -0.040, -0.040, 0.039, 0.042.
* R underscore D: 0.272, 0.275, 1.542 (significant at 5%), 1.542 (significant at 5%).
* N O L C F: -0.022, -0.022, -0.078, -0.078.
* C H G underscore N O L C F: -0.018, -0.018, -0.060, -0.059.
* F O R underscore I N C O M E: 0.010, 0.010, -0.303, -0.303.
* L O S S: -0.003, -0.002, -0.008, -0.009.
* S T R: 0.721, 0.731, 0.156, 0.152.
Model specifications for all columns:
* Firm F E: Yes.
* Year F E: Yes.
* Cluster: Firm.
* Number of observations: 989 for columns 1 and 2; 1,137 for columns 3 and 4.
* Adjusted R-squared: 0.49 for columns 1 and 2; 0.58 for columns 3 and 4.
C. Alternative Explanations
1. Performance or Investment Policy Change
We conduct a number of additional empirical tests to rule out plausible alternative explanations. Political connections could boost the performance and profits of financially constrained firms, increasing tax liabilities; they might also enhance bargaining power and prompt changes in capital expenditures, innovation, and mergers and acquisitions (M&A) that result in higher taxes.
To test these possibilities, we construct year t + 1’s pretax profit margin, capital expenditure, R&D expenditure, merger and acquisition indicator, and a measure of M&A value as five additional dependent variables. We regress these five variables on TotalP, WinP, and LoseP separately for financially constrained and unconstrained firms. The estimated coefficients on our political connection variables are not significantly different from 0 for all five dependent variables and for both constrained and unconstrained samples, indicating that the aforementioned alternative possibilities about firms’ performance and investment policy change cannot explain the results we find. The regression results are provided in Table OA1 in the Supplementary Material.
2. Tax Policy Change
Another possible explanation for our results is that tax policy changes in our sample period. To address this concern, we refer to Romer and Romer (Reference Romer and Romer2010) and use the corresponding congressional election years to define TaxReformYear and CorporateTaxChange dummies. We classify 1980, 1982, 1984, 1986, 1988, 1992, 1996, 2000, and 2002 as TaxReformYear reflecting election years associated with major federal tax reforms. In addition, following Mertens and Ravn (Reference Mertens and Ravn2013), we identify 1980, 1982, 1984, 1986, and 2002 as CorporateTaxChange years, capturing elections tied to reforms with significant corporate tax components.Footnote 14 In Table OA3 in the Supplementary Material, we regress the two tax planning variables on TotalP and the interaction term between TotalP and either TaxReformYear (Panel A) or CorporateTaxChange (Panel B). We find that the coefficients of TotalP are significantly negative for constrained firms and significantly positive for unconstrained firms, while the estimated coefficients of all eight interaction terms are statistically insignificant, suggesting that our findings cannot be explained by tax policy changes in specific years.
3. Firm Lifecycle
In addition, one might argue that unconstrained firms are already at a lifecycle stage where political connections are no longer needed to finance growth and are instead used to optimize other dimensions (e.g., lobbying for favorable tax provisions). To mitigate this concern, we control for variables that proxy for firms’ lifecycle stage—SIZE, ROA, LEVERAGE, and R_D—so that comparisons of tax-planning measures between more and less politically connected firms are made among otherwise similar firms. Prior studies support the use of these firm characteristics as lifecycle indicators (Ho, Tjahjapranata, and Yap (Reference Ho, Tjahjapranata and Yap2006), Dickinson (Reference Dickinson2011)). We also implement a matched-sample test: for each constrained firm, we select unconstrained counterparts in the same industry and with founding years equal to, or within 2 years of, the constrained firm’s founding year.
The matched-sample regression results are reported in Table OA4 in the Supplementary Material: Columns 1–4 cover constrained firms and columns 5–8 cover the matched unconstrained firms. The estimates are robust and consistent with those in Table 3, indicating that after gaining political connections, financially constrained firms reduce tax planning, whereas unconstrained peers in the same industry and with similar founding years increase it.
4. Firms with Pretax Loss
In the main analysis, we exclude firm-years with negative pretax earnings. One might question whether this restriction disproportionately affects constrained versus unconstrained firms; moreover, loss years may at times reflect optimal tax-planning choices.
To address this concern, we re-estimate the regressions including firms with negative pretax earnings. As shown in Table OA5 in the Supplementary Material, the results remain robust: the signs and statistical significance of the coefficients are unchanged. Net increases in political connections arising from close elections are associated with significant reductions in tax planning for financially constrained firms and significant increases for unconstrained firms.
D. Changes in Bank Loans and Public Bonds
In this section, we provide evidence that political connections decrease the tax planning of constrained firms by alleviating their financial constraints. In particular, we examine i) the effects of political connections on changes in the probability of obtaining new bank loans and issuing new public bonds and the costs of these new bank loans and public bonds, and ii) the role of obtaining new bank loans and bond financing in explaining decreases in the tax planning of financially constrained firms.
In Panel A of Table 6, we construct two indicator variables, OBTAIN_LOAN and ISSUE_BOND, which are equal to 1 if the firm obtains any new bank loans and issues any new bonds in the next year after the federal election and 0 otherwise, respectively, and regress these two variables on political connections for financially constrained and unconstrained firms separately.Footnote 15 In columns 1 and 2, we focus on constrained firms and use OBTAIN_LOAN as the dependent variable. We find that the coefficients on TotalP and WinP are significantly positive and the coefficient on LoseP is significantly negative. These results suggest that after connected politicians win (lose) close elections, financially constrained firms are more (less) likely to obtain bank loans. In columns 3 and 4, we use ISSUE_BOND as the dependent variable and find that constrained firms are more likely to issue new public bonds after obtaining more political connections. In columns 5–8, we focus on unconstrained firms and find no changes in the probability of obtaining new bank loans and issuing new public bonds for these firms after increased political connections.

TABLE 6 Long description
The table is divided into three panels.
Panel A, titled The Likelihood of Obtaining New Bank Loans and Issuing New Public Bonds, contains 8 columns. Columns 1 through 4 focus on Financially Constrained Firms, while columns 5 through 8 focus on Financially Unconstrained Firms. The dependent variables are O B T A I N underscore L O A N and I S S U E underscore B O N D. For constrained firms, Total P has a positive coefficient of 1.200 for loans and 0.865 for bonds, both significant at the 5 percent level. Win P is positive and Lose P is negative, both significant at the 10 percent level. For unconstrained firms, these variables are statistically insignificant.
Panel B, titled The Costs of New Bank Loans and Public Bonds, uses A I S D and O F F E R I N G underscore Y I E L D as dependent variables. For constrained firms, Total P shows a negative correlation with loan costs (minus 2.971) and bond yields (minus 13.202), significant at the 5 percent level. Win P is also negative and significant. For unconstrained firms, the coefficients are insignificant.
Panel C, titled External Financing and the Relation Between Tax Planning and Political Connections, examines C A S H underscore E T R and B T D. The interaction term Win P times Obtain underscore Finance is negative and significant for constrained firms (minus 0.650 for C A S H underscore E T R and minus 0.141 for B T D), but insignificant for unconstrained firms.
All panels include Controls, Year F E, and Firm F E, with standard errors clustered at the Firm level. Observation counts range from 2,000 to 2,717 across the different models.
In Panel B of Table 6, we follow Frank and Shen (Reference Frank and Shen2016) and Shevlin, Urcan, and Vasvari (Reference Shevlin, Urcan and Vasvari2020) and measure the cost of new bank loans (AISD) as the loan spread quoted in basis points over a floating benchmark (typically, the London Interbank Offered Rate), divided by 100, and the cost of new public bonds by (OFFERING_YIELD) as the bond’s percentage yield to maturity at issuance. In column 1, we regress AISD on TotalP for financially constrained firms and find that the coefficient on TotalP is significantly negative. In column 2, we replace TotalP with WinP and LoseP and find that the coefficient on WinP is significantly negative and the coefficient on LoseP is significantly positive. These results suggest that increases (decreases) in political connections are associated with significant decreases (increases) in the cost of new bank loans. In columns 3 and 4, we use OFFERING_YIELD as the dependent variable and find that the cost of new public bonds issued after obtaining (losing) political connections is significantly lower (higher). We focus on unconstrained firms in columns 5–8 and find that the costs of new bank loans and public bonds of these firms do not appear to change after obtaining or losing political connections.
If political connections reduce corporate tax planning of financially constrained firms by providing better access to external financing, such decreases in tax planning in response to increases in political connections should be more pronounced for firms that obtain new bank loans and issue public bonds. We test this idea by constructing an indicator variable, Obtain_Finance, which is equal to 1 for firms that obtain new bank loans or issue new public bonds in the next year after federal elections and 0 otherwise. We regress measures of tax planning on WinP, Obtain_Finance, and their interactions, WinP × Obtain_Finance for financially constrained firms in columns 1–2 of Table 6, Panel C. Consistent with our expectation, we find that the coefficients on WinP × Obtain_Finance are significantly negative in both columns where we use different measures of tax planning. In columns 3 and 4, we focus on unconstrained firms and find that the coefficients on WinP × Obtain_Finance are not significantly different from 0, indicating that changes in the tax planning of unconstrained firms in response to changes in political connections do not depend on whether these firms obtain new bank loans or issue new bonds.
Collectively, the results in Table 6 support the idea that alleviating financial constraints is one mechanism through which political connections affect the tax planning of financially constrained firms.
E. Changes in Government Contracts
Dhaliwal et al. (Reference Dhaliwal, Judd, Serfling and Shaikh2016) argue that government contractors are less risky and find that these firms have lower costs of equity capital. Goldman (Reference Goldman2020) documents that government contractors receive more bank credit during the financial crisis, suggesting that government contracts can improve firms’ credit quality as perceived by the lenders, which helps firms access bank credit. In addition, government contracts can also increase firms’ cash flows. These arguments suggest that government contracts could be an indirect avenue through which connected politicians mitigate firms’ financial constraints.Footnote 16 In this section, we study whether financially constrained firms receive more government contracts after obtaining more political connections.
We collect data on government contracts from the USAspending.gov website, which provides data from the Federal Procurement Data System (FPDS) starting in 2000. We create one indicator variable, OBTAIN_CONTRACT, which equals 1 if firms obtained any government contract in a given year and 0 otherwise. We also construct two variables based on the number and dollar amount of government contracts, CONTRACT_VALUE, which is the natural logarithm of 1 plus the dollar value of contracts awarded to the firm in a given year, and POTEN_CONTRACT_VAL, which is the natural logarithm of one plus the maximum potential dollar value of contracts awarded to the firm in a given year (i.e., if performance/target bonuses are earned). We regress each of the three government contract measures on TotalP, WinP, and LoseP and present the estimation results for financially constrained and unconstrained firms in Panels A and B of Table 7, respectively.

TABLE 7 Long description
The table is divided into two vertical sections. Both panels use six columns grouped into three dependent variables: OBTAIN_CONTRACT (columns 1 and 2), CONTRACT_VALUE (columns 3 and 4), and POTEN_CONTRACT_VAL (columns 5 and 6).
Panel A: Financially Constrained Firms (1,123 observations).
* Total P: Shows positive significant coefficients across all three variables: 0.395 (column 1), 3.717 (column 3), and 3.986 (column 5), all significant at the 5 percent level.
* Win P: Shows positive significant coefficients: 0.371 (column 2, 10 percent level), 3.363 (column 4, 5 percent level), and 3.686 (column 6, 10 percent level).
* Lose P: Shows negative significant coefficients: minus 0.440 (column 2), minus 4.351 (column 4), and minus 4.526 (column 6), all significant at the 5 percent level.
* Adjusted R-squared ranges from 0.35 to 0.47.
Panel B: Financially Unconstrained Firms (1,327 observations).
* Total P: Coefficients are 0.118, 2.790, and 2.635, none of which are statistically significant.
* Win P: Coefficients are 0.280, 5.973, and 6.168, none of which are statistically significant.
* Lose P: Coefficients are 0.293, 5.283, and 6.323, none of which are statistically significant.
* Adjusted R-squared ranges from 0.40 to 0.58.
Both panels include Controls, Year F E, Firm F E, and clustering at the Firm level.
In column 1 of Table 7, we use OBTAIN_CONTRACT as the dependent variable. We find that the coefficient on TotalP is significantly positive, suggesting that after obtaining more political connections, financially constrained firms are more likely to receive government contracts. In column 2, we regress OBTAIN_CONTRACT on WinP, LoseP, and control variables. We find that the coefficient on WinP is significantly positive and the coefficient on LoseP is significantly negative. These results suggest that financially constrained firms are more (less) likely to obtain government contracts after connected politicians win (lose) close elections.
In columns 3–6, we present the results of using CONTRACT_VALUE (columns 3 and 4) and POTEN_CONTRACT_VAL (columns 5 and 6) to measure the value of government contracts, respectively. Consistent with the results in the first 2 columns, we find that the value of government contracts awarded to financially constrained firms significantly increases (decreases) in response to connected politicians winning (losing) close elections. Taken together, the results in Panel A of Table 7 suggest that financially constrained firms are more likely to be awarded government contracts, and the contract value is also higher after obtaining more political connections. To the extent that government contracts increase firms’ cash flows and help decrease firms’ cost of capital and access to external financing, these results provide further support for the argument that mitigating financial constraints is one mechanism through which political connections decrease the tax planning of firms with financial constraints.
In Panel B of Table 7, we present results for changes in government contracts of financially unconstrained firms in response to changes in political connections. All coefficients on TotalP, WinP, and LoseP are not significantly different from 0, indicating that the likelihood and value of government contracts awarded to financially unconstrained firms are not sensitive to winning or losing connected politicians.
F. The Committees of Connected Politicians
If political connections reduce financially constrained firms’ tax planning incentives by alleviating their financial constraints, we expect these connections to have a greater impact on their tax planning when the politicians are more likely to help with their financing activities. In this section, we test this prediction by exploring variations in connected politicians’ committee assignments. As discussed in the introduction, the banking-related committees oversee the entire financial services industry and have jurisdiction over matters related to banks and banking and financial aid to the industry.Footnote 17 Thus, politicians serving on the banking-related committees should have more direct power to help connected firms access external financing and lower their financing costs than politicians on other committees. As a result, the negative relation between political connections and tax planning for financially constrained firms should be more pronounced when the connected politicians serve on banking-related committees. Because unconstrained firms have less difficulty in obtaining external financing, the impact of political connections on their tax planning should not depend on whether connected politicians serve on banking-related committees. We use the following regression model to examine these predictions:

where
$ {TP}_{ft} $
 ,
$ {WinP}_{ft} $
 ,
$ {\chi}_{ft} $
 ,
$ {\varPhi}_f $
 , and
$ {\varPhi}_t $
 are defined in Section IV.A.Footnote 18 Note that here we only use
$ WinP $
 instead of TotalP as our measure of shocks to political connections because
$ Banking\_{Committee}_{ft} $
 is an indicator variable that takes the value of 1 if at least one of the winning candidates supported by firm f is assigned to a banking-related committee in election cycle t and 0 otherwise. The variable of interest is
$ {WinP}_{ft}\times Banking\_{Committee}_{ft} $
 . The coefficient
$ {\beta}_1 $
 captures the incremental impact of political connections on tax planning when the connected politicians serve on banking-related committees. We expect
$ {\beta}_1 $
 to be negative for financially constrained firms and not significantly different from 0 for unconstrained firms.
We present the regression results for financially constrained firms in the first 2 columns of Table 8. We find that the coefficients on the interaction term, WinP × Banking_Committee, are significantly negative in both columns, suggesting that the impact of political connections on decreases in constrained firms’ tax planning is significantly greater when the connected politicians are on banking-related committees. In contrast, the regression results for unconstrained firms reported in the last 2 columns of Table 8 indicate that the coefficients on WinP × Banking_Committee are not significantly different from 0, suggesting that the impact of political connections on the tax planning of unconstrained firms does not depend on whether the connected politicians are on banking-related committees. These results provide further support to the argument that political connections lead to less tax planning of financially constrained firms by alleviating their constraints.

TABLE 8 Long description
The table is organized into four columns. Columns 1 and 2 focus on Financially Constrained Firms, while Columns 3 and 4 focus on Financially Unconstrained Firms. The dependent variables are C A S H underscore E T R (Columns 1 and 3) and B T D (Columns 2 and 4).
Key regression results for the interaction term WinP times Banking_Committee:
* Column 1: -0.542 (significant at 10 percent level) with a standard error of 0.288.
* Column 2: -0.131 (significant at 5 percent level) with a standard error of 0.058.
* Column 3: 0.077 with a standard error of 0.184.
* Column 4: -0.017 with a standard error of 0.036.
For the variable WinP:
* Column 1: -0.005 (0.314).
* Column 2: 0.030 (0.058).
* Column 3: 0.110 (0.161).
* Column 4: 0.037 (0.028).
For the variable Banking_Committee:
* Column 1: 0.019 (0.018).
* Column 2: 0.002 (0.003).
* Column 3: -0.007 (0.016).
* Column 4: 0.003 (0.003).
Fixed effects and controls:
* Controls, Year F E, and Firm F E are included (Yes) across all columns.
* Standard errors are clustered at the Firm level.
* Number of observations: 2,282 (Col 1), 2,022 (Col 2), 2,717 (Col 3), and 2,030 (Col 4).
* Adjusted R-squared values: 0.28 (Col 1), 0.42 (Col 2), 0.24 (Col 3), and 0.31 (Col 4).
In Section IV.A, we find that financially unconstrained firms pursue more tax planning after they obtain more political connections. If these firms have lower detection risk or receive more information regarding tax law and enforcement changes, we expect political connections to have a greater impact on their tax planning when their connected politicians serve on tax-related committees, which oversee the IRS and all bills regarding taxation.Footnote 19 We expect that politicians assigned to these committees can better provide protection against tax enforcement and more information to connected firms than politicians on other committees can. As a result, the positive association between political connections and tax planning for financially unconstrained firms should be more pronounced when the connected politicians serve on tax-related committees. To the extent that alleviating firms’ financial constraints is the primary way political connections affect the tax planning of constrained firms, changes in tax planning of these firms do not necessarily depend on connected politicians’ serving on tax-related committees. We estimate the following regression model to test these predictions:

where
$ {TP}_{ft} $
 ,
$ {WinP}_{ft} $
 ,
$ {\chi}_{ft} $
 ,
$ {\varPhi}_f $
 , and
$ {\varPhi}_t $
 are defined in Section IV.A.
$ Tax\_{Committee}_{ft} $
 is defined as an indicator variable that takes the value of 1 if at least one of the winning candidates supported by firm f is assigned to the tax-related committees in election cycle t and 0 otherwise. The variable of interest is
$ {WinP}_{ft}\times Tax\_{Committee}_{ft} $
 . The coefficient
$ {\beta}_1 $
 captures the incremental impact of political connections on tax planning when the connected politicians serve on tax-related committees. We expect
$ {\beta}_1 $
 to be not significantly different from 0 for constrained firms and positive for financially unconstrained firms.
We present the estimation results for financially constrained firms in the first 2 columns of Table 9. We find that the coefficients on WinP × Tax_Committee are not significantly different from 0 in both columns, suggesting that the effect of political connections on the tax planning of financially constrained firms is not related to whether connected politicians serve on tax-related committees. In the last 2 columns of Table 9, we report the estimation results for financially unconstrained firms. We find that the coefficients on the interaction term, WinP × Tax_Committee, are significantly positive in both columns, indicating that political connections have a greater impact on the tax planning of financially unconstrained firms when the connected politicians serve on tax-related committees. Collectively, the results in Table 9 provide evidence consistent with political connections increasing the tax planning of financially unconstrained firms by providing more protection against tax enforcement or more tax-related information.Footnote 20

TABLE 9 Long description
A data table with four columns of results. Columns 1 and 2 represent Financially Constrained Firms, while Columns 3 and 4 represent Financially Unconstrained Firms. The dependent variables are C A S H _ E T R (Columns 1 and 3) and B T D (Columns 2 and 4).
Key variable results include:
* WinP times Tax_Committee: 0.553 (0.398) in column 1; -0.056 (0.071) in column 2; 0.349* (0.200) in column 3; 0.062* (0.033) in column 4.
* WinP: -0.483* (0.283) in column 1; -0.024 (0.063) in column 2; -0.035 (0.163) in column 3; -0.004 (0.032) in column 4.
* Tax_Committee: -0.011 (0.021) in column 1; 0.006* (0.004) in column 2; -0.017 (0.017) in column 3; 0.001 (0.003) in column 4.
All columns include Controls, Year F E, and Firm F E (all marked Yes) and are clustered at the Firm level.
Summary statistics:
* Number of observations: 2,282 (Col 1); 2,022 (Col 2); 2,717 (Col 3); 2,030 (Col 4).
* Adjusted R-squared: 0.28 (Col 1); 0.42 (Col 2); 0.24 (Col 3); 0.31 (Col 4).
G. The Power of Connected Politicians
Favorable treatment in financing and tax enforcement is a valuable resource that is unlikely to be provided to all firms with political connections. As banks and regulators are concerned with maximizing their own benefits, they are more likely to favor firms connected to more powerful politicians (Heitz, Wang, and Wang (Reference Heitz, Wang and Wang2023)). In this section, we test this prediction by carrying out an additional cross-sectional analysis, as follows:

where
$ {TP}_{ft} $
 ,
$ {WinP}_{ft} $
 ,
$ {\chi}_{ft} $
 ,
$ {\varPhi}_f $
 , and
$ {\varPhi}_t $
 are defined in Section IV.A.
$ {Power}_{ft} $
 represents our proxies for the power of connected politicians. In Panel A of Table 10, we use Leadership, which takes the value of 1 if at least one of the candidates supported by the firm wins the close election and holds a leadership position in the Congress and 0 otherwise. A leadership position is defined as a majority leader, majority whip, speaker, minority leader, or minority whip. Around half of the firms (47% for financially constrained sample and 50% for financially unconstrained sample) have connections with members of the Congress holding leadership positions. The variable of interest in this regression is
$ {WinP}_{ft}\times {Power}_{ft} $
 . The coefficient on this variable,
$ {\beta}_1 $
 , captures the incremental impact of politicians’ power on the relation between political connections and tax planning. We find that
$ {\beta}_1 $
 is significantly negative for financially constrained firms and significantly positive for unconstrained firms. These results suggest that political connections have a greater impact on corporate tax planning when these connections are with more powerful politicians.

TABLE 10 Long description
The table is divided into three panels, each with four columns. Columns 1 and 2 represent Financially Constrained Firms, while Columns 3 and 4 represent Financially Unconstrained Firms. The dependent variables are C A S H _ E T R (Columns 1 and 3) and B T D (Columns 2 and 4).
* Panel A (Leadership): The interaction term WinP times Leadership shows coefficients of -0.809 (significant at 10 percent) and -0.315 (significant at 1 percent) for constrained firms, and 0.568 (significant at 10 percent) and 0.108 (significant at 10 percent) for unconstrained firms.
* Panel B (Majority_Seats): The interaction term WinP times Majority_Seats shows coefficients of -0.628 (significant at 10 percent) and -0.183 (significant at 1 percent) for constrained firms, and 0.387 (significant at 10 percent) and 0.109 (significant at 1 percent) for unconstrained firms.
* Panel C (Seniority): The interaction term WinP times Seniority shows coefficients of -0.955 (significant at 5 percent) and -0.149 (significant at 5 percent) for constrained firms, and 0.382 (significant at 5 percent) and 0.083 (significant at 5 percent) for unconstrained firms.
All panels include controls for Year F E, Firm F E, and clustering at the Firm level. The number of observations ranges from 2,022 to 2,717 across the models, with Adjusted R-squared values between 0.24 and 0.43.
In Panel B of Table 10, we use whether the connected politicians are members of Congress who belong to the majority party in both the Senate and the House to measure political power. The indicator variable, Majority_Seats, takes the value of 1 if at least one of the candidates supported by the firm wins the close election and belongs to the Majority party and 0 otherwise. In our sample, 80% of financially constrained firms and 85% of financially unconstrained firms are politically connected to senators or representatives whose party holds the majority of seats. Consistent with the results of using Leadership to measure power, we find that the coefficients on
$ {WinP}_{ft}\times Majority\_ Seats $
 are significantly negative for financially constrained firms and significantly positive for unconstrained firms, consistent with the argument that more powerful politicians have a greater impact on the tax planning of connected firms.
In Panel C of Table 10, we use whether the connected politicians are senior members of the Senate and the House to measure political power. To measure member seniority, we use Seniority, an indicator variable that takes the value of 1 if at least one of the candidates supported by the firm is a senior member and 0 otherwise. A member of Congress is considered a senior member if that person has seniority in the top 25%.Footnote 21 Consistent with the results in Panels A and B, we find that the effect of political connections is more pronounced when the connected politicians are senior members of Congress. Taken together, the regression results in Table 10 further support the view that it is the connection with politicians that drives the change in corporate tax behavior after the election.
H. The Importance of Firms
A politician may not uniformly cater to contributors. That is, a candidate who wins an election may pay more attention to the potentially more-valuable connected firms. In this analysis, we use two sets of proxies to measure the importance of firms and examine the role of firm importance in shaping the change in tax planning after an increase in political connections. In particular, we estimate the following regression model:

where
$ {TP}_{ft} $
 ,
$ {WinP}_{ft} $
 ,
$ {\chi}_{ft} $
 ,
$ {\varPhi}_f $
 , and
$ {\varPhi}_t $
 are defined in Section IV.A.
$ {Importance}_{ft} $
 represents our measures of the firm importance. Political contributions are a major source of campaign funding for politicians. Thus, politicians may expend more effort on more generous donors to encourage these donors to donate in the future. Following this line of reasoning, we construct two indicator variables based on a firm’s donation to proxy for its importance. The first one, Top5_Donor, takes the value of 1 if the firm is one of the top 5 donors by amount for at least one of the winning candidates supported by the firm and 0 otherwise. The second one, Donate10Pct, takes the value of 1 if the firm’s donation to at least one of the winning candidates is over 10% of the total donations received by that candidate and 0 otherwise. In Panel A of Table 11, we present the results of using Top5_Donor to measure firm importance. We find that the coefficients on WinP × Top5_Donor are significantly negative for financially constrained firms and significantly positive for unconstrained firms, consistent with political connections having a greater impact on corporate tax planning when the firms are more important to the politicians. In Panel B of Table 11, we use Donate10Pct to measure firm importance and find consistent results.

TABLE 11 Long description
The table is divided into three panels: Panel A (Top 5 Donor), Panel B (Donate 10 Pct), and Panel C (Crucial Industry E M P). Each panel contains four columns: Columns 1 and 2 for Financially Constrained Firms, and Columns 3 and 4 for Financially Unconstrained Firms. The dependent variables are C A S H underscore E T R (Columns 1 and 3) and B T D (Columns 2 and 4).
* Panel A (Top 5 Donor): The interaction term Win P times Top 5 Donor shows coefficients of -0.604 (significant at 10%) and -0.186 (significant at 5%) for constrained firms, and 0.381 (significant at 10%) and 0.083 (significant at 5%) for unconstrained firms.
* Panel B (Donate 10 Pct): The interaction term Win P times Donate 10 Pct shows coefficients of -1.027 (significant at 10%) and -0.154 (significant at 10%) for constrained firms, and 0.984 (significant at 1%) and 0.131 (significant at 5%) for unconstrained firms.
* Panel C (Crucial Industry E M P): The interaction term Win P times Crucial Industry E M P shows coefficients of -0.762 (significant at 10%) and -0.185 (significant at 10%) for constrained firms, and 0.472 (significant at 5%) and 0.114 (significant at 1%) for unconstrained firms.
All panels include Controls, Year F E, and Firm F E (all marked ‘Yes’). Standard errors are clustered at the Firm level. The number of observations ranges from 2,022 to 2,717 across the columns, with Adjusted R-squared values between 0.24 and 0.42.
In Panel C of Table 11, we measure firm importance by whether the firm is in an important industry, following Cohen, Diether, and Malloy (Reference Cohen, Diether and Malloy2013). For each state, we first aggregate the employment in each industry and then rank industries by the aggregated number of employment. Important industries are those ranked as the top 3 in aggregate employment in that state. We construct an indicator variable, Crucial_Industry_Emp, which is equal to 1 if the firm is in one of the important industries in its headquarter state and 0 otherwise. Consistent with the results in Panels A and B, we find that the coefficients on the interaction term, WinP × Crucial_Industry_EMP, are significantly negative for financially constrained firms and significantly positive for unconstrained firms.
I. Additional Tests
1. Weighted Campaign Contributions
In our main analyses, we construct the measures of political connections without considering the amount of firms’ contributions to politicians’ campaigns. However, firms that donate more to winning candidates would be expected to receive greater access to those politicians. In this section, we construct alternative measures of political connections by weighing firm campaign donations using equation (10):

where
$ Donated\_ Amoun{t}_{fjt} $
 captures the amount of firm f’s PAC donation to candidate j’s election PAC in cycle t.
$ Election\ Outcom{e}_{jt} $
 equals 1 if candidate j wins (loses) the close election in cycle t and 0 otherwise.
$ AmountWin{P}_{ft} $
 (
$ AmountLose{P}_{ft} $
 ) is then the campaign contribution weighted measure of increase (decrease) in political connections. The variable AmountTotalP, which looks at a firm’s net change in contribution-weighted political connection portfolio, is calculated as the difference between AmountWinP and AmountLoseP.
We present the estimation results for financially constrained and unconstrained firms in columns 1–4 and 5–8 of Table OA6 in the Supplementary Material, respectively. Consistent with our main results in Table 3, after obtaining more political connections, financially constrained firms decrease their tax planning, while their unconstrained counterparts do the opposite.
2. An Alternative Measure of Tax Planning
As financially constrained firms are motivated to save cash taxes as a source of internal financing to fund operations, we also use total cash taxes paid scaled by lagged total assets, TXPD_AT, as an alternative measure of tax planning. Again, we multiply this measure by −1 so that TXPD_AT is increasing in firms’ tax planning. In Table OA7 in the Supplementary Material, we regress TXPD_AT on changes in political connections arising from close elections and continue to find that after obtaining more political connections, financially constrained firms decrease tax planning, while unconstrained firms increase tax planning.
3. Special Elections
When a member of Congress dies or resigns before the completion of his or her term, a special election is held to fill the vacant seat. This kind of election is unanticipated, which means that close special elections offer an even more exogenous setting to explore the impact of political connections. In Table OA8 in the Supplementary Material, we follow the empirical approach used by Akey (Reference Akey2015) and examine the impact of shocks to political connections arising from close special elections on tax planning. Consistent with our results using regular elections, after connected politicians win special elections, financially constrained firms pursue less tax planning, while their unconstrained counterparts behave in the opposite way.
4. P-Hacking Test
A possible concern is whether our findings are restricted to a particular set of control variable combinations. To alleviate this concern, we conduct p-hacking tests to confirm that our model specification is robust to different combinations of control variables. Specifically, we follow Brodeur, Cook, and Heyes (Reference Brodeur, Cook and Heyes2020) and re-estimate our regressions in Table 3 Panel A (columns 1, 3, 5, 7) and Panel B (columns 1, 3, 5, 7) using 1,024 combinations of control variables. The results are presented in Figure OA1 in the Supplementary Material.
We find that all t-statistics on our test variables exceed the conventional significance level, confirming the statistical significance of associations in all cases. Taking the CASH_ETR of financially constrained firms as an example, the median absolute values of t-statistics are all above 2.4 when we use different combinations of control variables (Panel A of Figure OA1 in the Supplementary Material).
V. Conclusion
Using changes in political connections from close congressional elections, we examine how political connections help financially constrained firms access external financing, thereby reducing their incentives to use tax planning as internal financing. We find that after exogenous increases in political connections, financially unconstrained firms engage in more tax planning and have higher tax-related expenditures, while constrained firms pursue less tax planning and incur lower tax-related expenditures. We further show that financially constrained firms are also more likely to obtain new bank loans and issue new public bonds at significantly lower cost. Importantly, the decreases in tax planning are more pronounced for constrained firms that obtain new financing and when the connected politicians serve on banking-related committees. Taken together, these findings support the idea that political connections reduce the tax planning of constrained firms by alleviating their financial constraints.
Our article contributes to the understanding of the tax behaviors of politically connected firms by highlighting the role of firms’ financial constraints and the importance of the financing effects, which have been largely ignored in prior literature. Our work also adds to the literature on the value of political connections by showing that connected politicians help constrained firms obtain external financing and government contracts, which substitute for costly internal financing through tax strategies, and benefit unconstrained firms by lowering their taxes.
Appendix. Variable Definitions
Tax Planning Measures
- CASH_ETR:
-
Cash taxes paid (TXPD) divided by pretax income (PI). We multiply it by −1 so that it is increasing in tax planning. We omit firm-year observations if PI <0 and truncate CASH_ETR at 0 and 1. Source: Compustat.
- BTD:
-
Book–tax differences computed as $ \frac{P{I}_t-\frac{TXFE{D}_t+ TXF{O}_t}{ST{R}_t}}{A{T}_{t-1}} $
 , where PI refers to pretax income, TXFED refers to current federal tax expense, TXFO refers to current foreign tax expense, STR refers to the statutory tax rate, and AT refers to total assets at the beginning of the year. Source: Compustat.
- TXPD_AT:
-
Cash taxes paid (TXPD) divided by lagged total assets (AT). We multiply it by −1 so that it is increasing in tax planning. We truncate TXPD_AT at 0 and 1. Source: Compustat.

Political Connection Measures
- TotalP:
-
WinP – LoseP. Source: FEC, CLEA, OpenSecrets.
- WinP:
-
Number of winning candidates involved in a close election that a firm donated to prior to the election. This variable is divided by 100 to obtain a sizeable coefficient. Source: FEC, CLEA, OpenSecrets.
- LoseP:
-
Number of losing candidates involved in a close election that a firm donated to prior to the election. This variable is divided by 100 to obtain a sizeable coefficient. Source: FEC, CLEA, OpenSecrets.
- AmountTotalP:
-
AmountWinP – AmountLoseP. Source: FEC, CLEA, OpenSecrets.
- AmountWinP:
-
Number of winning candidates involved in a close election that a firm donated to prior to the election multiplied by the firm’s contribution to the candidate. This variable is divided by 100,000 to obtain a sizeable coefficient. Source: FEC, CLEA, OpenSecrets.
- AmountLoseP:
-
Number of losing candidates involved in a close election that a firm donated to prior to the election multiplied by the firm’s contribution to the candidate. This variable is divided by 100,000 to obtain a sizeable coefficient. Source: FEC, CLEA, OpenSecrets.
- Win:
-
An indicator variable equal to 1 if the firm-supporting candidate won a close special election and 0 otherwise. Source: FEC, CLEA, OpenSecrets.
Financial Constraint Measures
- HP Index:
-
Hadlock and Pierce (Reference Hadlock and Pierce2010) index, constructed as $ -0.737\times Size+0.043\times Size2-0.040\times Age $
$ Size $
, equals the natural logarithm of inflation-adjusted total assets (AT) in 2004 dollars, capped at the log of $4.5 billion.
$ Age $
is the number of years since the firm first appeared in Compustat with nonmissing stock price data, capped at 37 years. Source: Compustat. - HM Index:
-
Hoberg and Maksimovic (Reference Hoberg and Maksimovic2015) text-based financial constraints index, constructed from linguistic analysis of 10-K filings. Higher values correspond to more financially constrained firms. Source: Hoberg and Maksimovic (Reference Hoberg and Maksimovic2015).


Interaction Variables
- Banking_Committee:
-
An indicator variable equal to 1 if at least one of the candidates supported by the firm wins the election and joins either the Senate Committee on Banking, Housing, and Urban Affairs, or the House Committee on Financial Services, and 0 otherwise. Source: Charles Stewart’s Congressional Data.
- Tax_Committee:
-
An indicator variable equal to 1 if at least one of the candidates supported by the firm wins the election and joins either the Senate Finance Subcommittee on Taxation and IRS Oversight, or the House Committee on Ways and Means, and 0 otherwise. Source: Charles Stewart’s Congressional Data.
- Leadership:
-
An indicator variable equal to 1 if at least one of the candidates supported by the firm wins the election and has one of the following positions in the Congress: majority leader, the majority whip, speaker, minority leader or minority whip, and 0 otherwise. Source: Charles Stewart’s Congressional Data.
- Majority_Seats:
-
An indicator variable equal to 1 if at least one of the candidates supported by the firm wins the election and belongs to the Majority Party, and 0 otherwise. Source: Charles Stewart’s Congressional Data.
- Seniority:
-
An indicator variable equal to 1 if at least one of the candidates supported by the firm is a senior member (top 25%) of the Senate or House, and 0 otherwise. Senior members are the 25 longest-serving Senators or 109 longest-serving members of the House of Representatives. Source: Senate and House websites
- Top5_Donor:
-
An indicator variable equal to 1 if the firm is one of the top 5 donors by the amount for at least one of the winning candidates supported by the firm, and 0 otherwise. Source: FEC, CLEA, OpenSecrets.
- Donate10Pct:
-
An indicator variable equal to 1 if the firm’s donation to at least one of the winning candidates is over 10% of the total donations received by that candidate, and 0 otherwise. Source: FEC, CLEA, OpenSecrets.
- Crucial_Industry_Emp:
-
An indicator variable equal to 1 if the firm’s industry is one of the top 3 important industries in its headquarters state in terms of employment, and 0 otherwise. Source: Compustat.
- Obtain_Finance:
-
An indicator variable equal to 1 if firms obtain any new bank loan or issue any new bond in the next year after the federal election and 0 otherwise. Source: DealScan, Mergent FISD.
- TaxReformYear:
-
An indicator variable equal to 1 for congressional election years in which federal tax reforms were under consideration (1980, 1982, 1984, 1988, 1992, 1996, 2000, 2002) and 0 otherwise. Source: Romer and Romer (Reference Romer and Romer2010).
- CorporateTaxChange:
-
An indicator variable equal to 1 for congressional election years in which business-related tax reforms were under consideration (1980, 1982, 1984, 1986, 2002) and 0 otherwise. Source: Mertens and Ravn (Reference Mertens and Ravn2013).
Other Firm-Level Dependent Variables
- OBTAIN_LOAN:
-
An indicator variable equal to 1 if firms obtain any new loan in the next year after the federal election and 0 otherwise. Source: DealScan.
- AISD:
-
All in spread drawn, defined as the sum of the spread over LIBOR plus the facility fee, divided by 100, for the new loans obtained. Source: DealScan.
- ISSUE_BOND:
-
An indicator variable equal to 1 if firms issue any new bond in the next year after the federal election and 0 otherwise. Source: Mergent FISD.
- OFFERING_YIELD:
-
The bond’s percentage yield to maturity at issuance for the new bonds issued. Source: Mergent FISD.
- CONTRACT_VALUE:
-
The natural logarithm of 1 plus the dollar value of contracts awarded to the firm in a given year. Government contracts include bases and different options. A contract does not necessarily trigger all options. This variable records the value of the firms’ awarded contracts in the year, that is, when bases and the exercised options. Source: FPDS.
- POTEN_CONTRACT_VAL:
-
The natural logarithm of 1 plus all the maximum potential dollar value of contracts awarded to the firm in a given year. Government contracts include bases and different options. A contract does not necessarily trigger all options. This variable records the maximum possible value of the company’s all awarded contracts in the year, that is, when bases and all options are exercised. Source: FPDS.
- OBTAIN_CONTRACT:
-
An indicator variable equal to 1 if firms obtained any government contract in a given year and 0 otherwise. Source: FPDS.
- PRETAX_MARGIN:
-
Pre-tax margin, measured as pretax income (PI) divided by sales (SALE). Source: Compustat.
- CAPEX:
-
Capital expenditures (CAPX) scaled by lagged total assets (AT). Source: Compustat.
- RD_INTENSITY:
-
Research and development expenditures (XRD) scaled by sales (SALE). Source: Compustat.
- TAX_FEES:
-
The ratio of tax fees paid to the auditor divided by audit fees. Source: Audit Analytics.
- MA_DUMMY:
-
An indicator variable equal to 1 if the firm completed at least one merger or acquisition deal in the year, and 0 otherwise. Source: SDC Deals.
- MA_DEAL_VAL:
-
The natural logarithm of 1 plus the total value of merger and acquisition deals completed by the firm in a given year (in millions of U.S. dollars). Source: SDC Deals.
Firm-Level Controls
- SIZE:
-
The natural logarithm of total assets (AT) at the beginning of the year. Source: Compustat.
- ROA:
-
Return on assets, measured as operating income (PI – XI) scaled by lagged total assets. Source: Compustat.
- LEVERAGE:
-
Total debt (DLTT + DLC) scaled by lagged total assets. Source: Compustat.
- SGA:
-
Selling, general, and administrative expenses scaled by lagged total assets. Source: Compustat.
- R_D:
-
Research and development expenditures scaled by lagged total assets. Source: Compustat.
- NOLCF:
-
Net operating loss carryforward (TLCF) scaled by lagged total assets. NOLCF is set equal to 0 if TLCF is missing. Source: Compustat.
- CHG_NOLCF:
-
Change in net operating loss carryforward (TLCF) scaled by lagged total assets (AT). Source: Compustat.
- FOR_INCOME:
-
Foreign Income (PIFO) scaled by lagged total assets. Source: Compustat.
- LOSS:
-
An indicator variable equal to 1 if the firm reports a loss (IB < 0) in any of the last 3 years, and 0 otherwise. Source: Compustat.
- STR:
-
State statutory corporate income tax rate. Source: Serrato and Zidar (Reference Serrato and Zidar2018).
Loan-Level Control
- LOAN_MATURITY:
-
Loan maturity in years. Source: DealScan.
- LOAN_AMT:
-
Total dollar face value of the loan issue. Source: DealScan.
- PERFORMANCE_PRICE:
-
An indicator variable equal to 1 if the loan has a performance pricing provision and 0 otherwise. Source: DealScan.
- DEBT_REPAY:
-
An indicator variable equal to 1 if the loan is taken to repay existing debt and 0 otherwise. Investment. Source: DealScan.
- INVEST_PURPOSE:
-
An indicator variable equal to 1 if the loan is taken for corporate investment purposes and 0 otherwise. Namely the loans whose purpose is labeled “acquisition line,” “capital expenditures,” “corporate purposes,” or “takeover.” Source: DealScan.
- WC_PURPOSE:
-
An indicator variable equal to 1 if the loan is taken to finance working capital needs and 0 otherwise. Source: DealScan.
- FINA_COVENANT_NUM:
-
The number of financial covenants in the loan contract. Source: DealScan.
- GEN_COVENANT_NUM:
-
The number of general covenants in the loan contract. Source: DealScan.
- LENDER_NUM:
-
The number of individual banks that participate in the loan. Source: DealScan.
- REVOLVER:
-
An indicator variable equal to 1 if the loan is revolving and 0 otherwise. Source: DealScan.
- TERM_MIX:
-
The percentage of individual loans in the loan package with a specified repayment schedule and maturity. Source: DealScan.
- SENIOR:
-
An indicator variable equal to 1 if the loan is senior and 0 otherwise. Source: DealScan.
- SECURE:
-
An indicator variable equal to 1 if the loan is secured and 0 otherwise. Source: DealScan.
Bond-Level Controls
- RATING:
-
The numerical credit rating of the bond issue, where lower values mean higher credit quality. Source: Mergent FISD.
- BOND_MATURITY:
-
The bond’s maturity in years. Source: Mergent FISD.
- BOND_AMT:
-
The total dollar face value of the bond issue. Source: Mergent FISD.
- SUBORDINATED:
-
An indicator variable equal to 1 if the bond is subordinated to other debt securities and 0 otherwise. Source: Mergent FISD.
- CALLABLE:
-
An indicator variable equal to 1 if the bond is callable and 0 otherwise. Source: Mergent FISD.
- PUTABLE:
-
An indicator variable equal to 1 if the bond is putable and 0 otherwise. Source: Mergent FISD.
- SINKINGFUND:
-
An indicator variable equal to 1 if the bond has a sinking fund feature and 0 otherwise. Source: Mergent FISD.
Supplementary Material
To view supplementary material for this article, please visit http://doi.org/10.1017/S0022109026103202.
Funding Statement
K.N. thanks for the financial support from Cheung Kong Graduate School of Business. Z.W. thanks for the support of the Hong Kong General Research Fund (Grant No. 17503722), NSFC HY Working Fund (Grant No. 03070100001), Tsinghua SIGS Basic Support Fund (Grant No. 07010100003), and Tsinghua SIGS Research Support Fund (Grant No. 01030100049). Y.W. thanks for the National Natural Science Foundation of China (Grant No. 72302194) and the Fundamental Research Funds for the Central Universities (Grant No. 20720231027).