


Permineralised fossils of fungi associated with vascular plants from Europe and North America are primarily known from the late Paleozoic and Cenozoic (e.g., Cash & Hick Reference Cash and Hick1879; Williamson Reference Williamson1881; Kidston & Lang Reference Kidston and Lang1921; Stubblefield et al. Reference Stubblefield, Taylor, Miller and Cole1983; LePage et al. Reference LePage, Currah and Stockey1994; Kerp & Hass Reference Kerp and Hass2004; Phipps & Rember Reference Phipps and Rember2004; Krings et al. Reference Krings, Taylor and Dotzler2011; Taylor et al. Reference Taylor, Krings and Taylor2015), while reports on permineralised Mesozoic plant–fungus associations mostly come from South America and Antarctica (García Massini et al. Reference García Massini, Channing, Guido and Zamuner2012, Reference García Massini, Escapa, Guido and Channing2016; Harper et al. Reference Harper, Taylor, Krings and Taylor2016). Evidence of fungi associated with Mesozoic plants from Europe and North America typically occurs in the form of impression and compression fossils with peculiar dots or specks believed to represent fungal fruiting bodies (e.g., Taylor Reference Taylor and Hawksworth1994); and cuticle pieces containing fungal remains internally, attached to the surface or represented by imprints (e.g., Van der Ham et al. Reference Van der Ham, Van Konijnenburg-van Cittert, Dortangs, Herngreen and Van der Burgh2003; Olempska Reference Olempska2012). Other sources of information on Mesozoic fungal associations with land plants include specimens preserved in amber (Peñalver et al. Reference Peñalver, Delclòs and Soriano2007; Perrichot et al. Reference Perrichot, Néraudeau, Nel and de Ploëg2007) and rare finds of silicified polyporalean basidiocarps (Dierßen Reference Dierßen1972; Smith et al. Reference Smith, Currah and Stockey2004).
Virtually nothing is known about the spatial distribution of fungi within fossil plant hosts, primarily because of the inherent nature of the fossil record. Impression and compression fossils do not normally permit the analysis of internal features, including the distribution of fungi, and permineralisations are often too fragmented to allow a precise documentation of fungal distribution within a plant. Moreover, series of peels or thin sections of single, exquisitely preserved plant specimens are needed in order to accurately document fungal distribution, but these are rarely available, especially for larger axes or trunks. As a result, information on spatial arrangement of fungi that is provided in descriptions of fossil plant–fungus associations has been obtained usually from small areas of the host plant or from single sections (e.g., Krings et al. Reference Krings, Taylor, Hass, Kerp, Dotzler and Hermsen2007, Reference Krings, Dotzler, Taylor and Galtier2010). However, the spatial distribution of fungal remains within a plant represents a proxy indicator for fungal colonisation pathways and infection strategies, and thus may provide valuable insights into the nature of the relationship between a fossil fungus and its host plant.
In this study, we assess the technical feasibility of mapping the spatial arrangement and distribution of different types of fungal remains cell by cell in a small fossil stem. We discuss what conclusions can be drawn and hypotheses formulated based on the distribution and density of the fungi within the host. For this purpose, we used a portion of an exceptionally well-preserved, permineralised stem of an enigmatic fern from the Triassic of Germany that was available for destructive analysis. We used a combination of transmitted light microscopy and image-editing software to map out three different types of fungal remains within the stem based on transverse and longitudinal thin sections. Our results indicate that it is time-consuming but possible to map out precisely these microorganisms within a larger portion of a fossil plant if preservation quality is high enough, and that such distribution maps can provide valuable hints for colonisation pathways and plant tissue-specific fungal interactions. The study demonstrates a proof-of-concept and exemplifies how spatial distribution mapping can be conducted in future studies of fossil plant–fungus associations.
1. Geologic setting
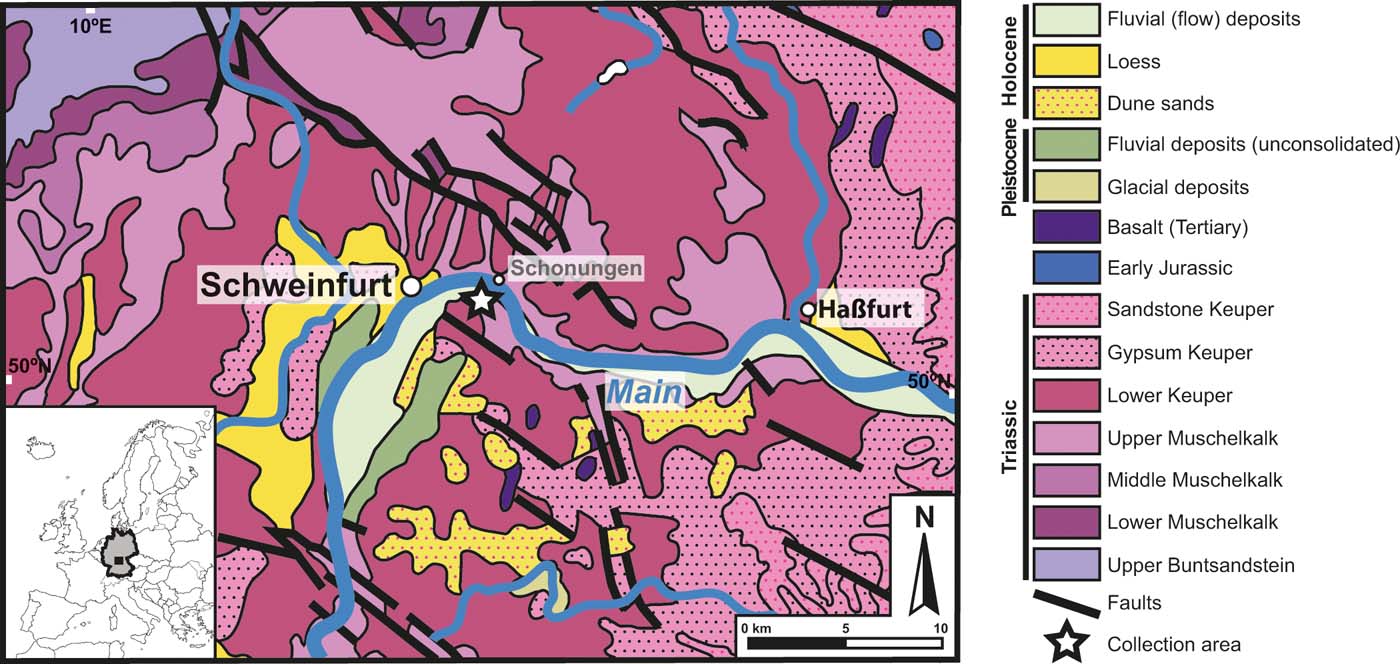
The fossil used in this study was discovered some 50 years ago, and, according to the label attached to it, was collected east of the city of Schweinfurt (Schonunger Bucht), north Bavaria, Germany, from sands deposited along the left bank of the river Main (Fig. 1). Unfortunately, more exact locality information is unavailable. The stratigraphic provenance and age of the fossil are therefore difficult to resolve. The Schonunger Bucht is a series of abandoned sand excavation sites along the River Main that are now filled with water, and the ‘sands' mentioned in the label might refer to these fluvial deposits that occur along the river (Ziegler Reference Ziegler1990; Bormann et al. Reference Bormann, Pinter and Elfert2011). Moreover, the original label indicates that the specimen is likely to be from the uppermost Muschelkalk or lowermost Keuper, and thus possibly Ladinian (242–237Ma) in age (Deutsche Stratigraphische Kommission 2016). We cannot rule out that the fossil was reworked, and hence might be older still.
Geologic map and stratigraphy of locality area near Schweinfurt, north Bavaria, Germany. Inset: Europe with Germany highlighted; boxed area in Germany represents map. Map of collection area: star indicates collection site; modified from Toloczyki et al. (Reference Toloczyki, Trurnit, Voges, Wittekindt and Zitzmann2006).
2. Material and methods
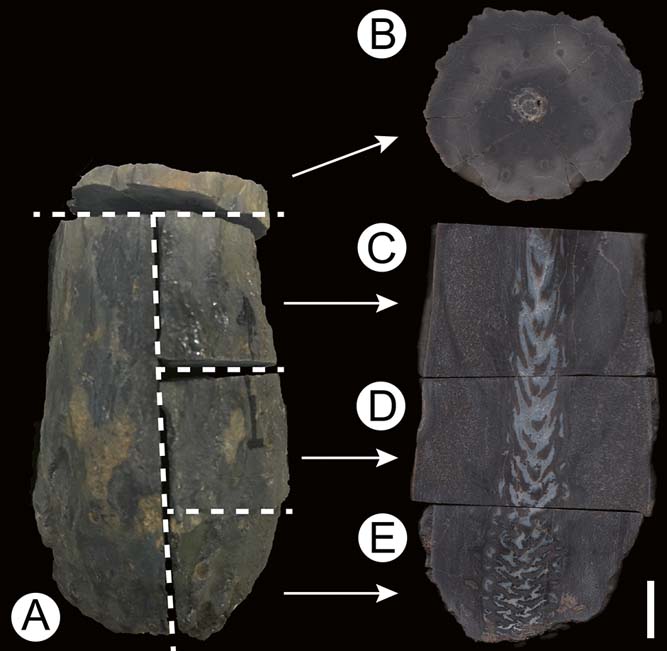
The study focuses on a single, permineralised stem portion with exquisite internal preservation. The specimen is likely to represent the basal portion of an upright stem. The fossil was first cut into five pieces (designated letters A through to E in Fig. 2); one slice (transverse section) was cut off the top of the specimen (Fig. 2b) and the remaining stem was then cut longitudinally, resulting in one half representing a median longitudinal section (Fig. 2a) and the other half that was further divided into three parts, i.e., top (Fig. 2c), middle (Fig. 2d) and basal (Fig. 2e) longitudinal sections. Thin sections were prepared by cementing thin slices (wafers) of the specimen to glass slides and then grinding with silicon carbide powder until the section was thin enough to transmit light. All specimen pieces and thin sections are deposited in the Bayerische Staatssammlung für Paläontologie und Geologie (SNSB-BSPG) in Munich, Germany, under acquisitions SNSB-BSPG 1968 I 97A–E (specimen pieces) and SNSB-BSPG 1968 I (ex 97) 269–273 (thin sections), specifically letter B in Figure 2 corresponds to slides SNSB-BSPG 1968 I (ex 97) 269 and 270; letter C corresponds to slide SNSB-BSPG 1968 I (ex 97) 271; letter D corresponds to slide SNSB-BSPG 1968 I (ex 97) 272; and letter E in Figure 2 corresponds to slide SNSB-BSPG 1968 I (ex 97) 273. Additional material not reproduced here, used for comparison of the morphology and anatomy of the host plant, is housed in the collections of the Museum für Naturkunde in Chemnitz, Germany, under acquisitions K4549C, K4549-DS1 and K4549-DS2, and in the private collection of Mr Raimund Rojko (Mönchengladbach, Germany).
Enigmatic Triassic fern stem from southern Germany (SNSB-BSPG 1968 I 97), showing sections made for this study: (A) complete specimen; (B) slides SNSB-BSPG 1968 I (ex 97) 269 and 270; (C) slide SNSB-BSPG 1968 I (ex 97) 271; (D) slide SNSB-BSPG 1968 I (ex 97) 272; (E) slide SNSB-BSPG 1968 I (ex 97) 273. For details, see Material and methods section. Scale bar=1cm.
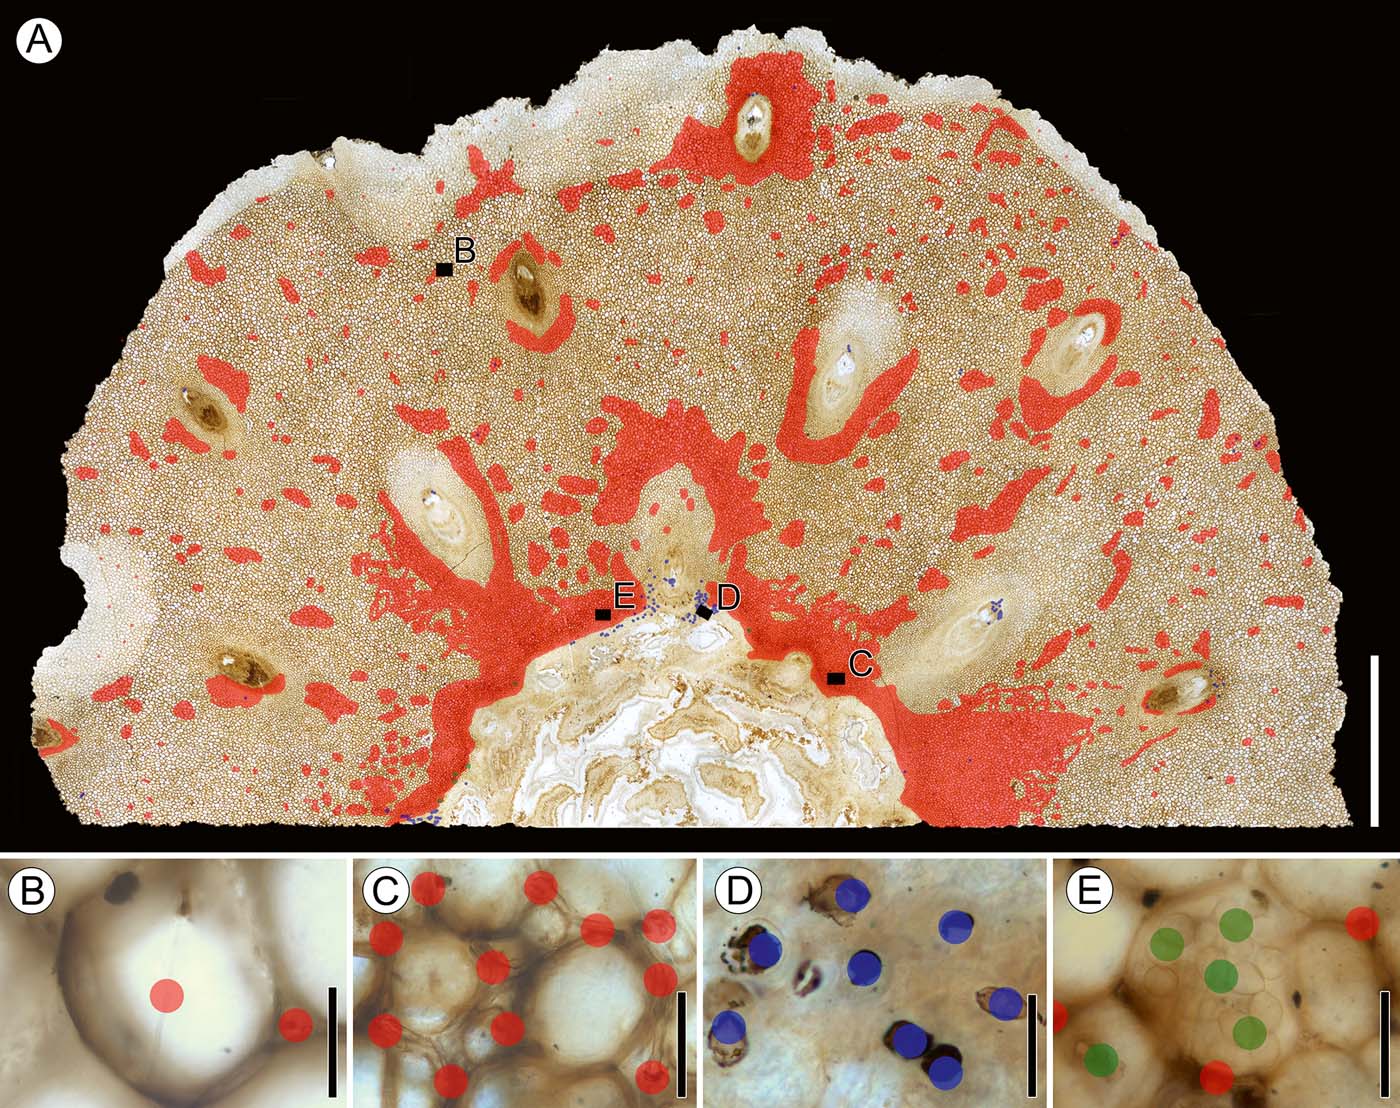
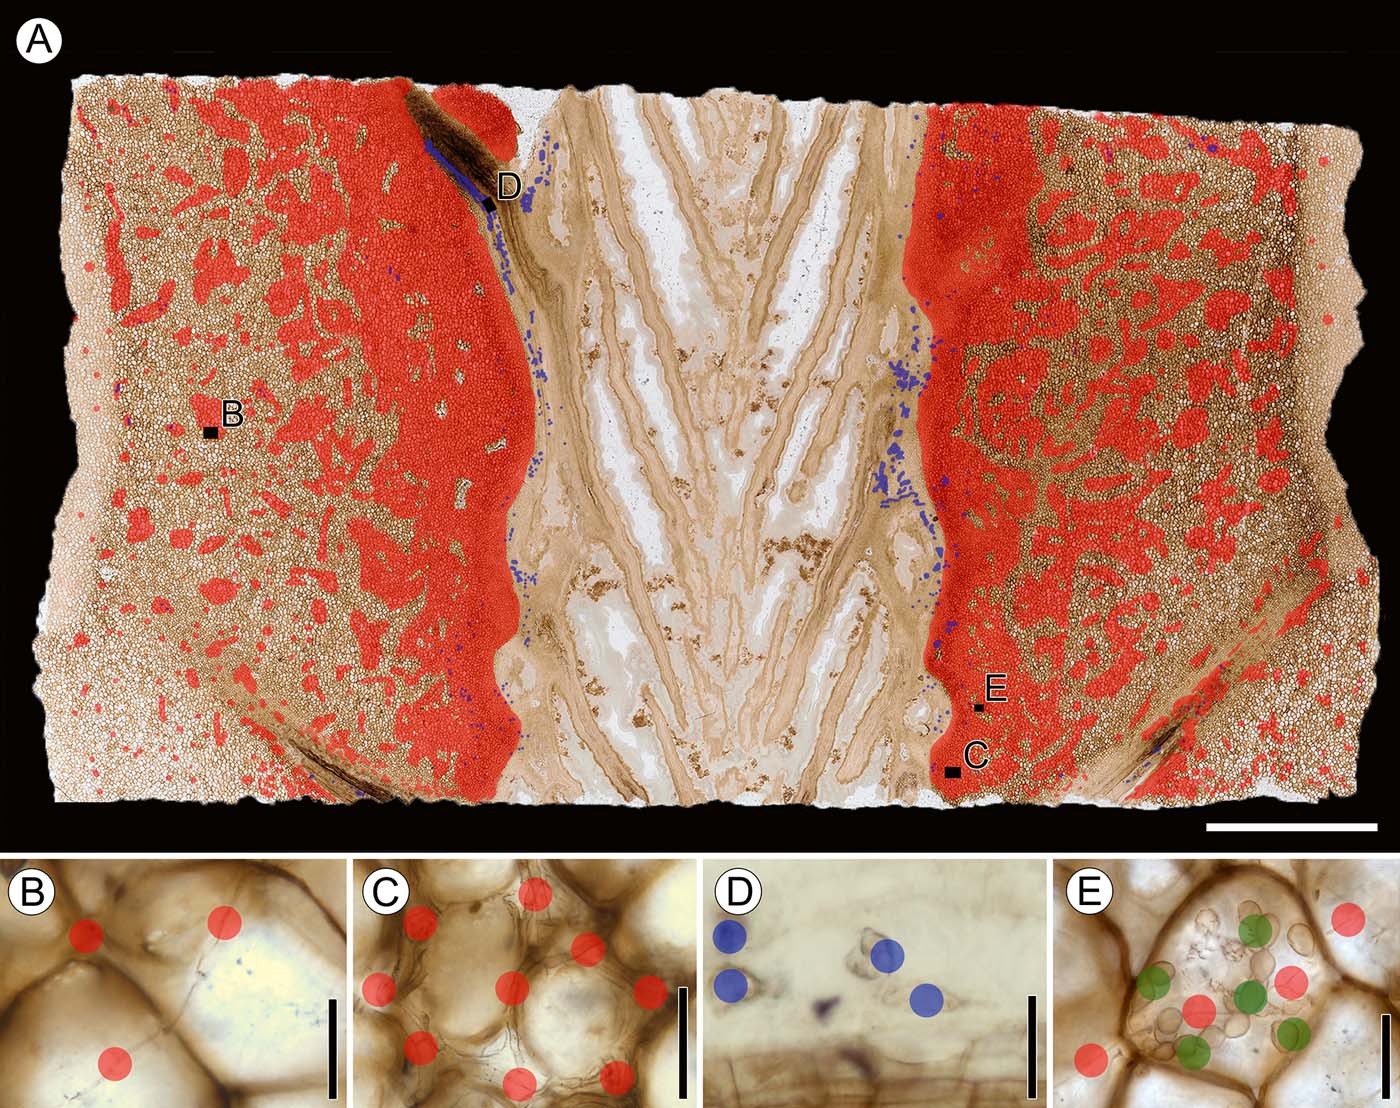
Thin sections were examined with a Leica DMLB2 transmitted light microscope and photographed using a Leica DFC480 digital camera; images were processed minimally (i.e., to adjust brightness and contrast) in Adobe Photoshop CS6. All thin sections obtained from the stem were first imaged at low magnification (Fig. 3). In addition, large mosaic composite images were produced in Adobe Photoshop CS6 (e.g., Figs 4a, 5a); free and open-source image editing software such as GNU Image Manipulation Program (GIMP) can also be used. The mosaic images represent composites of 150–170 images stitched together by slightly overlapping shared edges (Kerp & Bomfleur Reference Kerp and Bomfleur2011). With the help of these high-resolution images, we were able to ensure that fungal remains were mapped in the same focal planes throughout the thin section. Based on preliminary screening, we broadly categorised the fungal remains into (a) two variants of tubular hyphae, (b) hyphal swellings and (c) moniliform hyphae (see Description below). Each category was assigned a colour for plotting in Adobe Photoshop CS6, i.e., tubular hyphae=red (Figs 4b, c, 5b, c), swellings=blue (Figs 4d, 5d) and moniliform hyphae=green (Figs 4e, 5e). We then carefully examined the fern stem cell by cell at multiple planes in all thin sections with the corresponding high-resolution images on a separate computer screen, and marked the area on the image with a small coloured dot for the specific fungal type (Figs 4b–e, 5b–e). The dots were given reduced opacity (50 %) in order to overlap them and still see the fungus in the image. This was especially useful when two types of fungal remains co-occurred within a cell (Figs 4e, 5e). Colour designations were separated into individual layers in Adobe Photoshop for organisation and in order to hide/show certain fungal types to reveal patterns. In addition, we used the Notes feature in Adobe Photoshop to mark areas of interest so we would know precisely where specific images of fungi were taken within the thin section. The large, marked composite images revealed discrete patterns of the different categories of fungi based on colour mapping (Figs 4a, 5a; see Distribution in host sections below). To obtain detailed images of the individual fungal remains, images of the same specimen were recorded at multiple focal planes and stacked to produce composite images (Figs 4b–e, 5b–e, 6a–q, s–y, 7a–q); measurements were taken using Adobe Photoshop. Additional overview images not used for screening (e.g., Fig. 3a, c), were captured with a Keyence VHX-5000 digital microscope using two-dimensional panorama with 10× objective and processed in Adobe Photoshop CS6.
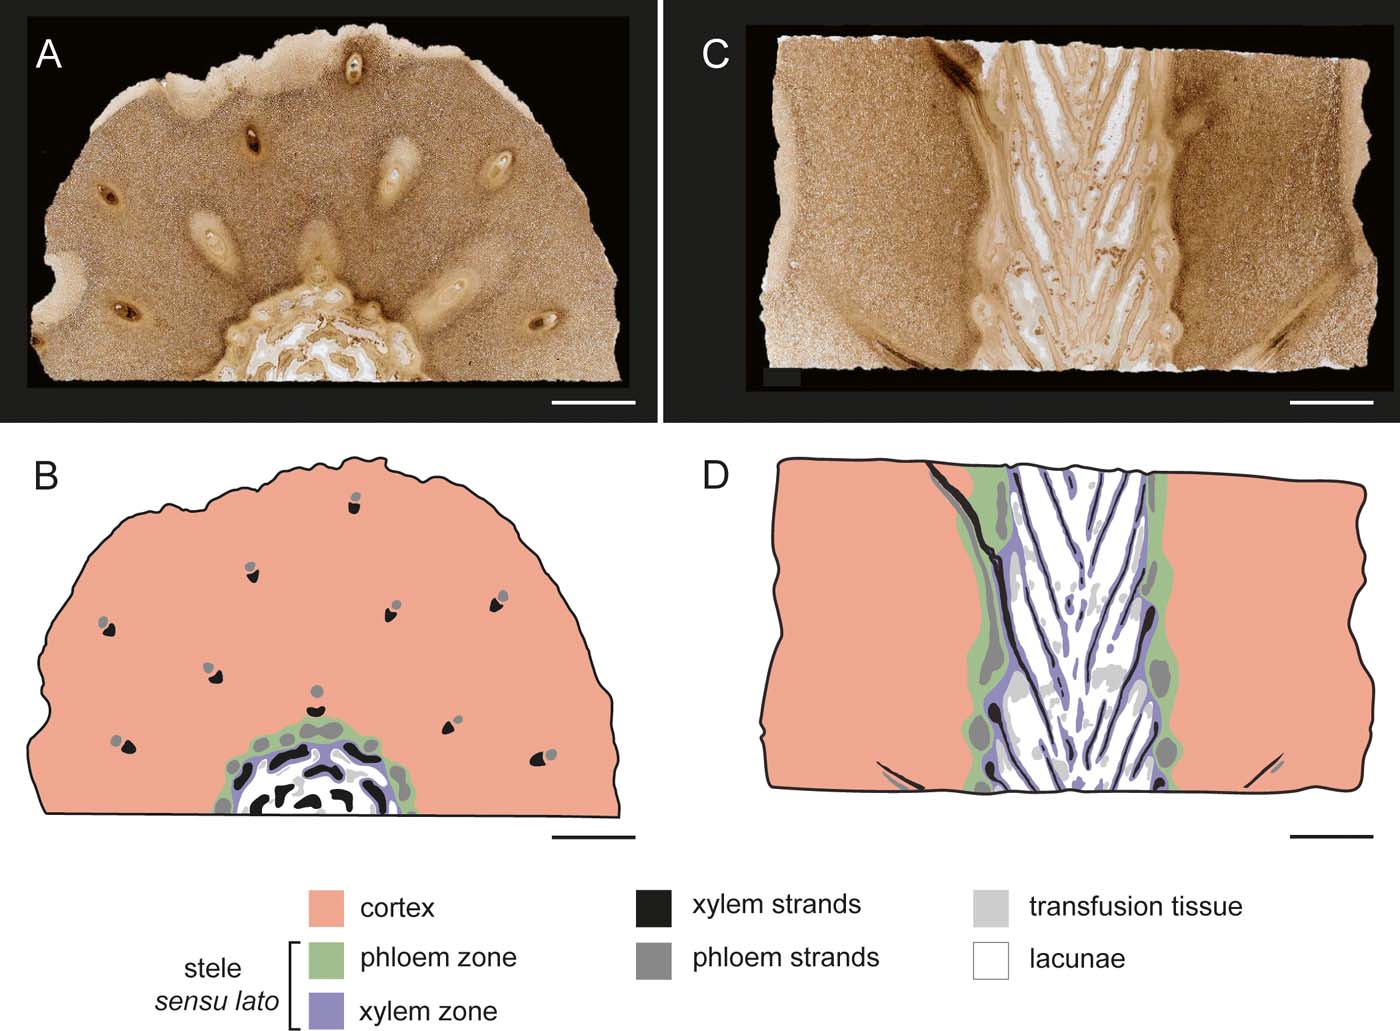
Internal organisation and tissue zone designation of fern stem. Legend in figure: (A) transverse section of distal portion of stem showing tissue types and arrangement, slide SNSB-BSPG 1968 I (ex 97) 270; (B) graphical representation of (A), indicating tissue zones, tissues and anatomical features; (C) median longitudinal section of stem, showing tissue types and arrangement, slide SNSB-BSPG 1968 I (ex 97) 272; (D) graphical representation of (C), indicating tissue zones, tissues and anatomical features. Scale bars=5mm.
3. Description
3.1. Host
The fern specimen is approximately 8.5cm long, 4–5cm wide proximally and is most likely to represent the basal portion of an upright stem; prominent leaf scars arranged in a dense spiral are visible on the stem surface. The stem is similar in gross morphology to several other Triassic permineralised fern stems that have been formally described as Knorria mariana Michael, Knorripteris mariana Potonié and Adelophyton jutieri Renault (Michael Reference Michael1895; Potonié Reference Potonié1897; Renault Reference Renault1900). The stem used in this study shows certain peculiarities with regard to internal organisation that currently preclude assignment to any of these taxa. For details on the anatomy of the host, please refer to Galtier et al. (Reference Galtier, Harper, Rößler, Kustatscher, Krings, Krings, Harper, Cúneo and Rothwell2018).
The rounded base of the stem is poorly preserved and we are unable to determine whether it was attached to a rhizome or if roots were produced from the basal region. The axis resembles a lycophyte with regard to gross morphology; however, the peculiar internal anatomy is indicative of affinities to the ferns (Fig. 3a, c). The peripheral tissues (epidermis and outermost cortical layers) are not preserved. The internal organisation of the stem is dominated by a massive, parenchymatous cortex that is up to 18mm wide (Fig. 3b, d). The cortex comprises relatively large, more or less isodiametric cells between 136.26 and 235.64μm in diameter that become gradually smaller towards the stele, and a system of large intercellular spaces up to 70μm wide. Primary pit fields in abutting cell walls are well recognisable (pf in Fig. 6f). The stele sensu lato is 14.45–15.02mm in diameter and subdivided into a prominent, heterogeneous, central xylem zone (12.09mm wide) (Fig. 3b, d) surrounded by a discontinuous phloem zone (Fig. 3b, d), which is 0.56–2.36mm wide. The xylem zone consists of (1) elongate tracheids forming xylem strands that are surrounded by a narrow envelope of (2) small parenchyma cells. The remaining volume of the xylem zone consists of (3) transfusion tissue (Fig. 3b, d) and large voids or air cavities, henceforth termed lacunae (Fig. 3b, d). Transverse sections of the xylem zone show circular to oblong lacunae and obliquely flattened xylem bundles in the periphery, while the centre contains large lacunae, crescent-shaped xylem bundles curved towards the centre and transfusion tissue in the lacunae. The lacunae probably represent a natural feature of the stem; small lacunae resulting from decay of xylem and phloem elements occur in the leaf traces extending through the cortex. Transfusion tissue is abundant throughout the stele, but has not been observed in any other region of the stem. The phloem zone is limited to the periphery of the stele and primarily composed of strands of thin-walled cells (rarely well preserved) surrounded by parenchyma, with only small intercellular spaces (up to 23μm wide). The phloem parenchyma gradually transition into the cortex. Phloem parenchyma cells are relatively small (89.25–136.15μm in diameter) and darker in colour (this is especially well visible in transverse section Figs 4c, 5c) than other cells of the cortex. Leaf arrangement can best be viewed in longitudinal sections (Figs 2c–e, 3c). Leaf traces emerging from the stele and extending through the cortex usually show well-preserved phloem and xylem (Fig. 3c).
Transverse section of distal portion of stem showing mapping of fungal remains and spatial distribution of fungi: (A) fungal remains plotted on transverse section of stem, slide SNSB-BSPG 1968 I (ex 97) 270, showing locations of insets (B–E); (B) Morphotype 1 (variant a), slide SNSB-BSPG 1968 I (ex 97) 270; (C) Morphotype 1 (variant b), slide SNSB-BSPG 1968 I (ex 97) 270; (D) Morphotype 2, slide SNSB-BSPG 1968 I (ex 97) 270; (E) Morphotypes 3 and morphotype 1, slide SNSB-BSPG 1968 I (ex 97) 270. Colour key: red dots=tubular hyphae (morphotype 1); blue dots=hyphal swellings (morphotype 2); green dots=moniliform hyphae (morphotype 3). Scale bars=5mm (A); 50μm (B–E).
Median longitudinal section of stem, showing mapping of fungal remains and spatial distribution of fungi: (A) spatial distribution of fungal remains plotted on median longitudinal section of stem, slide SNSB-BSPG 1968 I (ex 97) 272, showing locations of insets (B–E); (B) Morphotype 1 (variant a), slide SNSB-BSPG 1968 I (ex 97) 272; (C) Morphotype 1 (variant b), slide SNSB-BSPG 1968 I (ex 97) 272; (D) Morphotype 2, slide SNSB-BSPG 1968 I (ex 97) 27; (E) Morphotype 3 and morphotype, slide SNSB-BSPG 1968 I (ex 97) 272. Colour key: red dots=tubular hyphae (morphotype 1); blue dots=hyphal swellings (morphotype 2); green dots = moniliform hyphae (morphotype 3). Scale bars=5mm (A); 50μm (B–E).
3.2. Fungi
The stem contains three morphologically distinct types of fungal remains that are treated as morphotypes because we cannot determine whether they represent a single species of fungus or several biological entities. None of the remains possess diagnostic features of sufficient clarity to permit assignment to any taxon of extant fungi with confidence. For these reasons, we refrain from formally naming the individual types or placing them into a systematic context.
3.2.1. Morphotype 1: tubular hyphae
3.2.1.1. Variant a
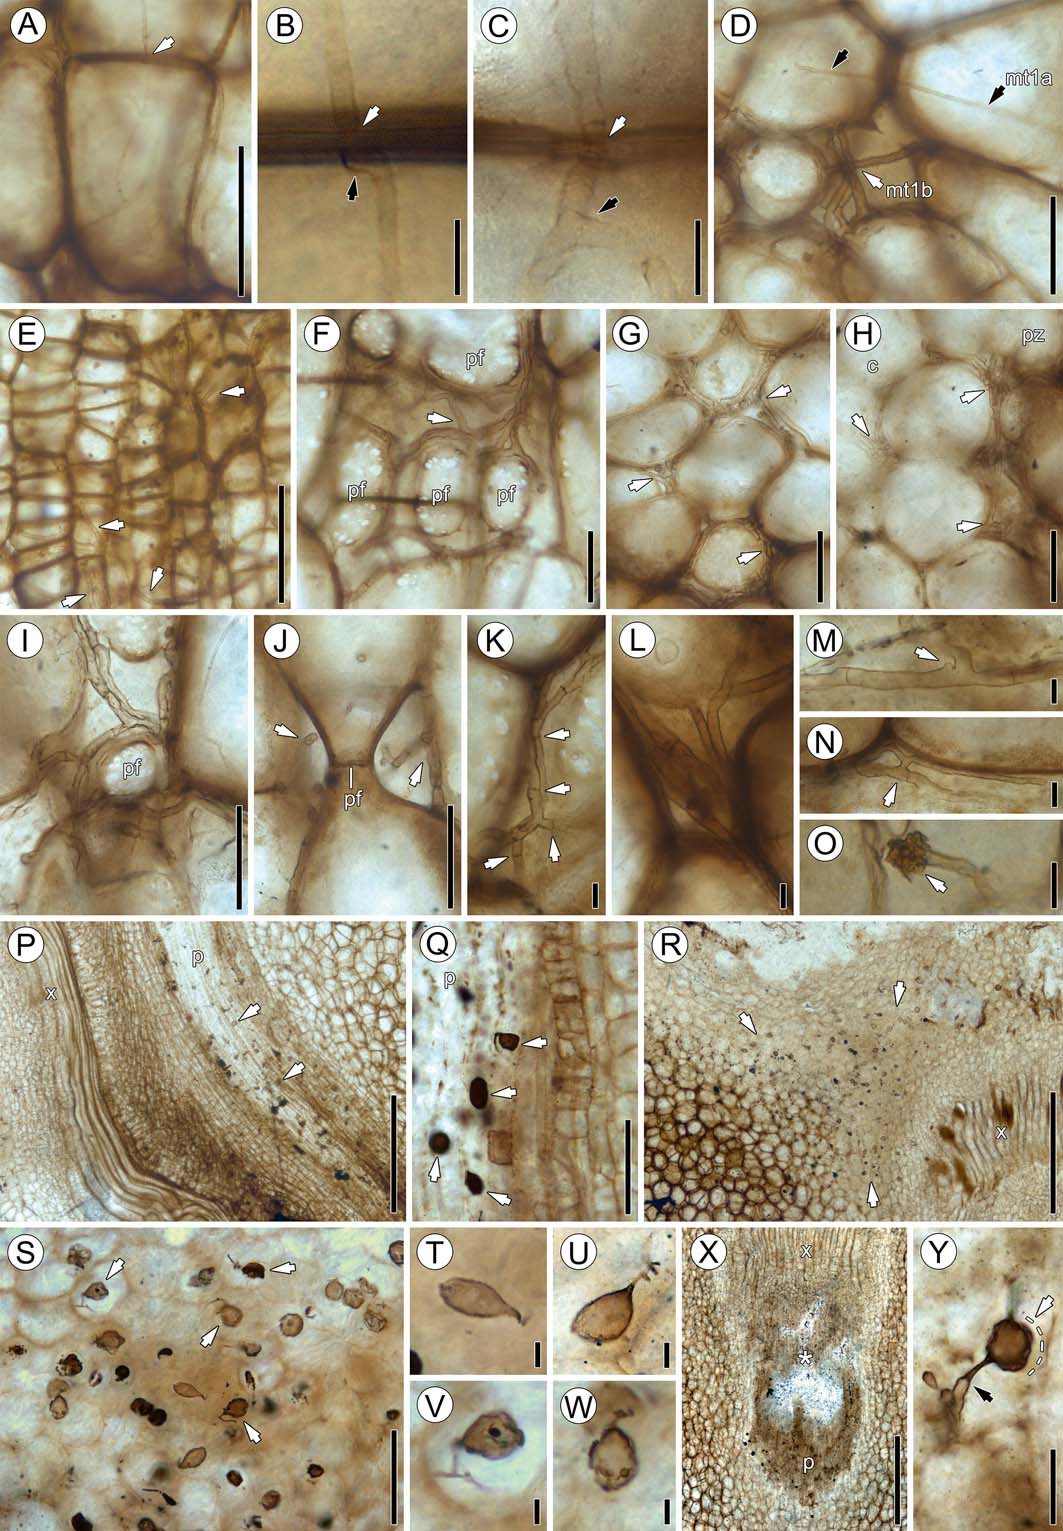
(Figs 4b, i, 6a–d) comprises tenuous, tubular, septate hyphae (1.26–4.16μm wide, with an average diameter of 2.73μm), with septa occurring at uneven intervals; the hyphae branch infrequently and at irregular angles (Fig. 6a). Hyphae travel intracellularly and traverse from one cell to another through the pits or directly through the cell wall (Fig. 6b, c). The hyphae are slightly narrower within the host cell wall and usually form a small curve to right angle bend along the opposite side of the wall immediately upon exit (Fig. 6b). Upon emergence from the cell wall, the hypha either branches immediately or it remains straight and unbranched (Fig. 6c). No recognisable host responses are present at sites where hyphae traverse cell walls. There is usually only one hypha entering the lumen of a host cell, but up to three hyphae entering the same cell have been observed.
Fungal morphotypes 1–3: (A) branched morphotype 1 hyphae (variant a) passing through host cell walls (arrow), slide SNSB-BSPG 1968 I (ex 97) 272; (B) variant a hypha passing through host cell wall (white arrow), slide SNSB-BSPG 1968 I (ex 97) 271. Note formation of right angle (black arrow) where hypha enters cell wall; (C) high magnification of variant a hypha traversing host cell walls and slightly constricted (white arrow), slide SNSB-BSPG 1968 I (ex 97) 270. Note branching of hypha (black arrow) after entering adjacent cell; (D) co-occurrence of variants a (mt1a; black arrows) and b (mt1b; white arrow), slide SNSB-BSPG 1968 I (ex 97) 272; (E) variant b hypha (arrows) in parenchyma cells of phloem zone, slide SNSB-BSPG 1968 I (ex 97) 272; (F) variant b (arrow) in intercellular system, slide SNSB-BSPG 1968 I (ex 97) 272. Note large pit fields (pf) of host cells; (G) accumulation of intercellular variant b hyphae (arrows), slide SNSB-BSPG 1968 I (ex 97) 269; (H) transition from cortex (c) to parenchyma of phloem zone (pz), slide SNSB-BSPG 1968 I (ex 97) 269. Note abundance of variant b hyphae (arrows); (I) numerous intercellular variant b hyphae encircling pit field (pf), transverse section, slide SNSB-BSPG 1968 I (ex 97) 272; (J) variant b hyphae (arrows) encircling pit field (pf), longitudinal section, slide SNSB-BSPG 1968 I (ex 97) 272; (K) variant b hypha showing numerous septa (arrows), slide SNSB-BSPG 1968 I (ex 97) 272; (L) high magnification of five variant b hyphae extending between cells, slide SNSB-BSPG 1968 I (ex 97) 272; (M) knob-like protrusion (arrow) of uncertain nature located close to branch given off by variant b hypha, slide SNSB-BSPG 1968 I (ex 97) 272; (N) h-branching (arrow), slide SNSB-BSPG 1968 I (ex 97) 272; (O) unknown spheroidal structure (arrow) located terminally on variant b hypha, slide SNSB-BSPG 1968 I (ex 97) 272; (P) longitudinal section of leaf trace vascular bundle showing phloem (p) and xylem (x), slide SNSB-BSPG 1968 I (ex 97) 272. Note ellipsoidal, pyriform and spindle-shaped morphotype 2 swellings in phloem (p); (Q) ellipsoidal, pyriform and spindle-shaped swellings (arrow) in phloem (p), slide SNSB-BSPG 1968 I (ex 97) 272; (R) transverse section of stem cortex near leaf trace vascular bundle showing xylem (x), slide SNSB-BSPG 1968 I (ex 97) 270. Note large accumulation of ellipsoidal, pyriform and spindle-shaped swellings (arrows); (S) ellipsoidal, pyriform and spindle-shaped swellings in cortex. Note several specimens with attached segments of parental hypha (arrows), slide SNSB-BSPG 1968 I (ex 97) 270; (T) ellipsoidal swelling, slide SNSB-BSPG 1968 I (ex 97) 270; (U) pyriform swelling with branched parental hypha, slide SNSB-BSPG 1968 I (ex 97) 270; (V) swelling with contents and branched parental hypha, slide SNSB-BSPG 1968 I (ex 97) 270; (W) pyriform swelling with contents, slide SNSB-BSPG 1968 I (ex 97) 270; (X) leaf trace vascular bundle showing xylem (x) and phloem (p) in oblique section, slide SNSB-BSPG 1968 I (ex 97) 270. * indicates area with abundant swellings; (Y) large swelling (detail of (X)), slide SNSB-BSPG 1968 I (ex 97) 270. Black arrow indicates constriction of parental hypha at attachment site; white arrow shows outline (dotted) of hyaline envelope. Scale bars=10μm (B, C, K–O, T–W); 50μm (D, F–J, Y); 100μm (A, Q, S); 250μm (E); 500μm (P, R, X).
Distribution in host. Variant a occurs throughout the cortex and, to a lesser extent, in the phloem zone of the stele, and appears to cluster in small aggregations in cells of the cortex and sometimes in cortical cells close to leaf traces. There is apparently no clear association of variant a with leaf traces because the hyphae are also scattered throughout the cortex. There is also no difference in the occurrence and abundance of variant a between the basal and top sections of the specimen. Variant a does not occur in the xylem zone of the stele or vascular tissues of the leaf traces.
3.2.1.2. Variant b
(Figs 4c, 5c, 6d–o) is the most prominent and common fungal remain in the stem. This variant is represented by wide, tubular hyphae (3.18–7.09μm in diameter, average 4.89μm) that occur exclusively in the intercellular system. Hyphae are septate, with a slight constriction at cross-wall formation, at evenly spaced intervals (Fig. 6k). Variant b hyphae branch frequently and exhibit a wide range of branching patterns, including branching at right and irregular angles (Fig. 6f), H-branching (Fig. 6n), several modes of curved branching, and complete and partial loop formation (Fig. 6m). There are rare examples of the formation of terminal structures composed of dense clusters of amorphous matter (Fig. 6o). No hyphal clamps have been observed. Variants a and b often co-occur in the same areas of the cortex, but are easily distinguishable (Fig. 6d) because variant a is narrower and consistently occurs intracellularly, while variant b is present exclusively in the intercellular system. Some host cortical cells are surrounded by a single hypha of variant b, whereas others are densely encased by up to seven hyphae (Fig. 6f–j). In rare instances, variant b seems to occur within individual host cells; however, this is an artefact caused by the two-dimensional nature of photographic images (Fig. 6e). Rather, variant b is often seen to extend directly around abutting cortical cells (Fig. 6i, j), which sometimes looks in photographic images as if they occur within the cells. There is no recognisable directional growth of variant b; rather, hyphae can be observed in transverse, longitudinal, and oblique angles within the same area (Fig. 6h).
Distribution in host. Variant b is present in the innermost cortex that interfingers with the parenchyma of the phloem zone of the stele, and in the cortical tissue surrounding the leaf trace vascular bundles. The distribution of this variant within the phloem zone can best be observed in longitudinal sections, while occurrences in the tissues surrounding the leaf traces is best seen in transverse sections. There appears to be a greater abundance of variant b in the basal portion of the stem. Like variant a, variant b hyphae do not occur in the xylem zone of the stele or vascular tissue of the leaf traces.
3.2.2. Morphotype 2: hyphal swellings
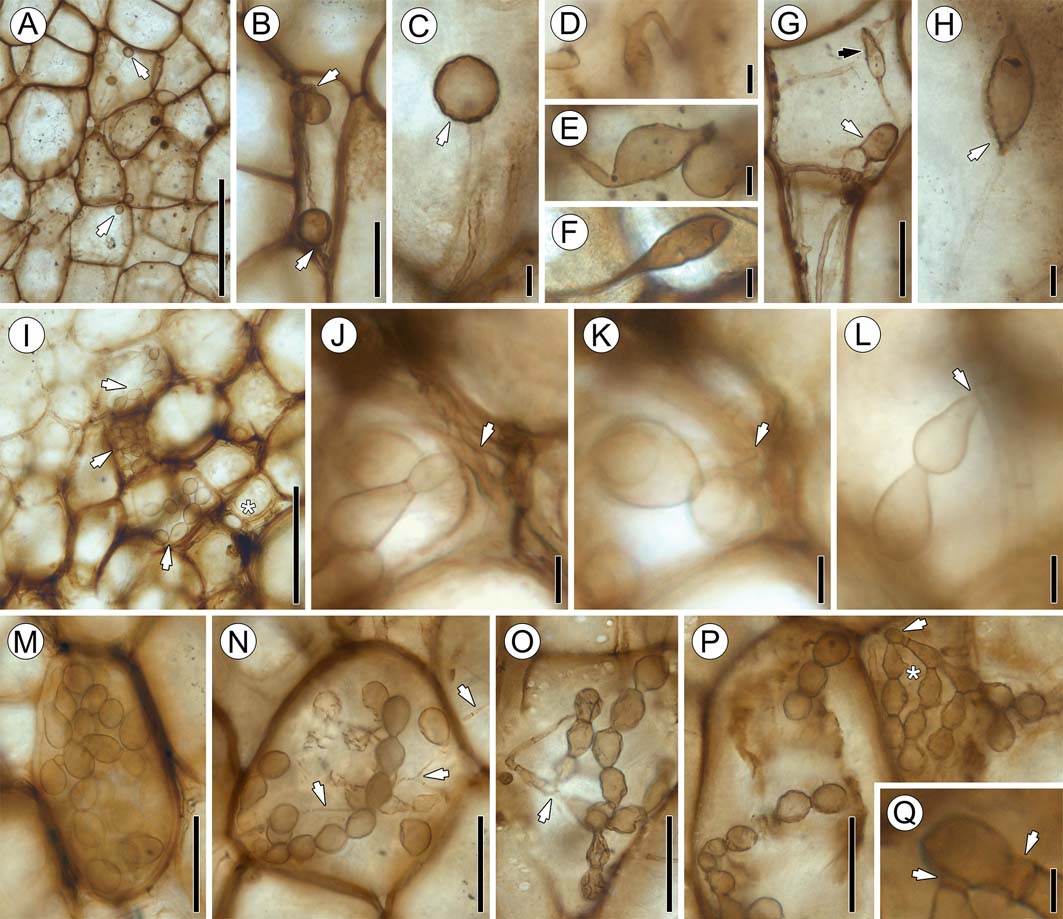
This morphotype (Figs 4d, 5d, 6p–y, 7a–h) comprises variously shaped, terminal and intercalary hyphal swellings that occur in host cells and in the intercellular system. Swellings are mostly ellipsoid, pyriform or ellipsoid with apiculate ends (spindle shaped), and 12.94–19.87μm in diameter, with an average of 17.4μm in diameter (Figs 6q, s–w, 7d–h); other swellings are prolate spheroid to globose and 8.67–28.47μm in diameter, with an average diameter of 17.5μm (Figs 6y, 7a–c). Swellings are consistently glabrous; the wall is up to 0.95μm in thick. Many specimens occur physically connected to a portion of the parental hypha; a septum (or septa in intercalary swellings) usually occurs between hypha and swelling (Figs 6t–w, 7h). Other swellings lack septa, but this is less common (Figs 7d–f). Ellipsoidal swellings are characterised by a distinct, conical neck region that has the same diameter as the parental hypha. The parental hypha may be straight or produce one (Fig. 6t) to several right-angled branches (Fig. 6v), some of which appear to be merely short protrusions (Fig. 6w). There is a single example of a parental hypha that is narrow at the point of attachment to the swelling, but then abruptly becomes wider distally (Fig. 6y). Conversely, globose swellings lack a neck, but a septum or clear distinction between swelling and subtending hypha may still be present (Fig. 7b, c). Moreover, globose swellings may be distinctly more opaque than ellipsoidal ones (Fig. 6s). The subtending hyphae of the globose swellings are similar in size and shape to variant b (see above), while the parental hyphae of ellipsoid to spindle-shaped swellings are more in the size range of the variant a hyphae. Some of the swellings are surrounded by a thin, hyaline envelope 1.4–2.35μm thick (Figs 6s, y, 7c, h). Another rare occurrence is small propagules (likely mycoparasites), up to 3.72μm in diameter and with small lateral branches, that occur inside the swellings (Figs 6v, w, 7h).
Fungal morphotypes 2 and 3: (A) portion of cortex containing globose swellings (arrows), slide SNSB-BSPG 1968 I (ex 97) 272; (B) globose swellings and parental hyphae (arrows), slide SNSB-BSPG 1968 I (ex 97) 272; (C) spherical swelling attached to hypha, slide SNSB-BSPG 1968 I (ex 97) 272. Note hyaline envelope (arrow) around swelling; (D) ellipsoidal swelling attached to bent hypha, slide SNSB-BSPG 1968 I (ex 97) 272; (E) intercalary swelling, slide SNSB-BSPG 1968 I (ex 97) 272; (F) terminal swelling, slide SNSB-BSPG 1968 I (ex 97) 272; (G) narrow ellipsoidal (black arrow) and spade-shaped (white arrow) swellings in cortical tissue, slide SNSB-BSPG 1968 I (ex 97) 272; (H) sharply attenuated, ellipsoidal swelling with contents and hyaline envelope (arrow), slide SNSB-BSPG 1968 I (ex 97) 273; (I) portion of phloem zone parenchyma with morphotype 3 moniliform hyphae (arrows), slide SNSB-BSPG 1968 I (ex 97) 270. The asterisk indicates co-occurring morphotype 1 hyphae; (J) co-occurrence of morphotypes 3 and 1, slide SNSB-BSPG 1968 I (ex 97) 270. Arrow indicates attachment of moniliform hyphae to tubular hypha; (K) different focal plane of (J), slide SNSB-BSPG 1968 I (ex 97) 270. Arrow in same position, focusing on attachment point; (L) moniliform hypha attached to tubular hypha (arrow), slide SNSB-BSPG 1968 I (ex 97) 273; (M) densely packed moniliform hyphae in cell lumen, slide SNSB-BSPG 1968 I (ex 97) 270; (N) moniliform hyphae co-occurring with morphotype 1 tubular hyphae (arrows), slide SNSB-BSPG 1968 I (ex 97) 272; (O) possible connection (arrow) between tubular and moniliform hyphae, slide SNSB-BSPG 1968 I (ex 97) 272; (P) two adjacent cells containing branched moniliform hyphae, slide SNSB-BSPG 1968 I (ex 97) 272. Arrow indicates attachment point. * indicates small, knob-like protrusion on hyphal segment; (Q) higher magnification of arrow area in (P), slide SNSB-BSPG 1968 I (ex 97) 272. Arrows indicate short, tubular segments at base of moniliform hyphae. Scale bars=5μm (Q); 10μm (C–E, I–K); 50μm (B, F, G, L–P); 100μm (H); 250μm (A).
Distribution in host. Ellipsoidal to spindle-shaped swellings are found primarily within the phloem and parenchyma cells in the phloem zone of the stele, where they usually occur in large, loose clusters, rarely singly. Longitudinal sections show that the swellings are present throughout the entire length of the phloem of some of the leaf traces. In transverse sections, ellipsoidal to spindle-shaped swellings are visible in the majority of phloem cells in leaf traces, but are most abundant in traces close to the stele. Globose swellings and ellipsoidal swellings lacking basal septa are generally less common. Globose swellings are found in isolated areas of the phloem zone and outermost cortex, and usually occur in close proximity to variant b hyphae. It is interesting to note that, although variant b is exclusively intercellular, globose swellings may also occur within host cells. Ellipsoidal to spindle-shaped swellings also occur both within host cells and in the intercellular system, but do not always co-occur with variant a hyphae. There is also no difference in the abundance of swellings in the cortex in basal or top sections of the specimen.
3.2.3. Morphotype 3: moniliform hyphae
Branched chains of moniliform hyphae (Figs 4e, 5e, 7i–q) in host cells represent the least common type of fungal remains in the stem. Individual hyphal segments are pyriform to club- or racquet shaped, 13.45–24.63μm long and 10.9–17.7μm at the widest point (Fig. 7l). The narrow portion of the segment is separated from the adjacent segment by a septum (Fig. 7n). Chains may occur singly or they produce secondary chains or branch profusely (Fig. 7o, p). It is difficult to ascertain precisely how the moniliform hyphae are produced. Some of the chains appear to originate laterally from tubular hyphae, with a septum at the base of the first segment (Fig. 7j–l). Based on this we can determine that the narrow portion of the segments is proximal, while the wide portion is the distal end. In one instance two chains are given off from a slightly inflated (distal?) segment of a tubular hypha (Fig. 7p); the chain-producing segment appears to first produce a short tubular or somewhat bulbous segment on which the first pyriform or racquet-shaped segments then form (Fig. 7q), which then forms the second and so on. Some of the segments possess a single, small lateral, rounded protrusion that does not have a septum at its base (Fig. 7p indicated by an asterisk). Morphotype 3 occurs in the lumen of cortical cells (Reference Cash and HickFig. 7i, m, n, p). The hyphae occur as single, unbranched or branched chains (Fig. 7n, p), or they fully occlude the host cell lumen with individual chains no longer traceable (Fig. 7i, m).
Morphotype 3 co-occurs with both variants of morphotype 1 (Fig. 7i, n). The majority of morphotype 3 hyphae are well preserved and there are only two examples of poorly preserved moniliform hyphae with collapsed and wrinkled segments (Fig. 7o). Morphotype 3 is typically found within the lumen of single cells, but clusters of three or four adjacent cells that contain morphotype 3 hyphae have also been observed (Fig. 7p). No moniliform hyphae passing from one host cell to another have been observed.
Distribution in host. This morphotype is the rarest and has a unique spatial distribution pattern within the stem. Moniliform hyphae are found exclusively in the phloem zone of the stele, within approximately the first two or three cell layers from the periphery of the central xylem zone. There are a higher number of morphotype 3 hyphae in the proximal portion of the stem than in the more distal portions.
4. Discussion
Information on the spatial distribution of fungi in plants from the geologic past is exceedingly limited for several reasons, and thus our understanding of the evolutionary history of fossil fungal infection pathways and colonisation patterns remains largely unknown. This study represents the first attempt to produce a detailed map of the distribution of fungal remains in a portion of a fossil stem. The data obtained on the extensive and in part selective colonisation of the different host tissues by fungi provides an opportunity to assess the value of spatial distribution information in reconstructing fungal colonisation patterns in fossil plants.
4.1. Affinities of the fungal remains
Three different types (morphotypes) of fungal remains occur in the fern stem that can be distinguished based on morphology and spatial distribution. We are unable presently to determine whether each of these types represents a different fungus or if they were parts of the same organism, because of the lack of definitive characters needed to determine the precise systematic affinities of the remains or distinguish between individual species.
While fungal morphotypes 1 and 2 comprise vegetative remains (i.e., tubular hyphae and hyphal swellings) that are impossible to attribute systematically, we can offer some hypotheses on the nature of morphotype 3, which represents the most distinctive fungal remain in the stem. With a few exceptions, fungal endophytes in vascular plants today belong to the phylum Ascomycota; within this phylum they are highly diverse, such as members of the Pezizomycetes (e.g., Chaetothyriomycetidae or Dothideomycetes; see Petrini Reference Petrini, Fokkema and Van den Heuvel1986; Carroll Reference Carroll1988; Hansen & Pfister Reference Hansen and Pfister2006; Lumbsch & Huhndorf Reference Lumbsch and Huhndorf2007). Morphotype 3 in the Triassic fern stem may represent vegetative, moniliform hyphae constructed of ampulliform or racquet-shaped hyphal segments, or conidia of an ascomycetous fungus. Conidia are asexual reproductive structures that can form through several different modes (Hennebert & Sutton Reference Hennebert, Sutton and Hawksworth1994); conidial development may even vary within one species of fungus based on environmental conditions (Cole Reference Cole1986). Conidia arise from conidiogenous hyphae (Ulloa & Hanlin Reference Ulloa and Hanlin2012), and we have detected one example of tubular hyphae in the fossil stem that gives rise to short, stout hyphal segments on which, in turn, moniliform hyphae are produced (Fig. 7p, q). If the interpretation of the moniliform hyphae as conidia is correct, then these short, tubular hyphal segments would accordingly represent the conidiogenous hyphae. There are also examples of tubular hyphae to which are directly attached moniliform hyphae (Fig. 7j–l). The conidia of certain present-day monilaceous fungi (e.g., Aspergillus, Paecilomyces, Penicillium and Scopulariopsis) are known to occur in the form of branched, catenulate chains (Ulloa & Hanlin Reference Ulloa and Hanlin2012), some of which are very similar to the morphotype 3 fossils.
Dark septate endophytes (DSE) are a polyphyletic group of root endophytic fungi, likely to be conidial ascomycetes, which are characterised by the formation of melanised septate hyphae and microsclerotia within their hosts (Currah et al. Reference Currah, Tsuneda and Murakami1993; Jumpponen & Trappe Reference Jumpponen and Trappe1998; Jumpponen Reference Jumpponen2001; Mandyam & Jumpponen Reference Mandyam and Jumpponen2005). The conidial anamorphs of some DSE produce branched moniliform hyphae composed of racquet-shaped elements (Hashiba & Narisawa Reference Hashiba and Narisawa2005, fig. 2; Grünig et al. Reference Grünig, Queloz, Duò and Sieber2008, fig. 5e). Moreover, dense clusters of moniliform hyphae of DSE in host cells are sometimes referred to as microsclerotia, especially if they have thick walls (e.g., Uma et al. Reference Uma, Muthukumar, Sathiyadash and Muniappan2010, fig. 2; Zhang et al. Reference Zhang, Li, Li and Zhao2011b, fig. 1a; Ban et al. Reference Ban, Tang, Chen, Xu, Zhang and Yang2012, fig. 3a; Fernández et al. Reference Fernández, Messuti and Fontenla2012, fig. 4f; Knapp et al. Reference Knapp, Pintye and Kovács2012, fig. 1; Zubek et al. Reference Zubek, Błaszkowski and Buchwald2012, fig. 1h), and are believed to function as dispersal or storage units (Currah et al. Reference Currah, Tsuneda and Murakami1993; Yu et al. Reference Yu, Nassuth and Peterson2001; Grünig & McDonald Reference Grünig and McDonald2004). Perhaps the fossil morphotype 3 functioned in a similar manner as microsclerotia. The microsclerotia of present-day DSE are polymorphic, even within the same plant (Barrow Reference Barrow2003), and if the fossil moniliform hyphae in fact functioned as microsclerotia, then the polymorphic nature of these structures in modern DSE could be used to explain the variability of morphotype 3.
4.2. Distribution of fungal remains
Several distribution patterns have been depicted through detailed mapping of the different types of fungal remains throughout the fern stem portion (Figs 4, 5): (1) Extensive colonisation by fungal morphotype 1 variant b, and to a lesser extent variant a, occurs in the phloem zone of the stele, and in the cortical tissues surrounding the leaf traces; (2) Morphotype 2 occurs in leaf trace phloem and parenchyma directly surrounding the leaf traces, but is especially abundant in the phloem zone of the stele; (3) Morphotype 3 occurs exclusively in the phloem zone of the stele and is most abundant in the proximal portion of the stem; and (4) Virtually no fungal remains are present in the central xylem zone of the stele. Taken together these distribution patterns suggest that some form of relationship existed between the fungi (or fungus) inhabiting the fern and the vascular system of the plant. It is impossible to determine whether this relationship was nutritional or distributional, or both. We can rule out the possibility that the distribution of the fungi is a function of intercellular system size because the largest intercellular spaces occur in the periphery of the stem where fungal remains are generally sparse. One of the mechanisms underlying the pattern observed may be a form of nutrient gradient within the host cortex, with the highest concentration of nutrients close to the vascular tissues (Taylor et al. Reference Taylor, Krings, Galtier and Dotzler2012). Especially interesting in this context is the local concentration of hyphal swellings (morphotype 2) in and closely associated with the phloem. Perhaps these swellings served as initial storage units for nutrients extracted from the phloem. It is also worth noting that there is no phloem in the central portions of the stele (i.e., the xylem zone) and there are also no fungi in this region in any of the thin sections. An alternative hypothesis views the elongate cells comprising the vascular tissue as a gateway for the fungi (or fungus) to spread out within the stem. Arguing against this hypothesis is perhaps the fact that the xylem zone of the stele is virtually free of fungal remains. Conversely, perhaps the fungi (or fungus) entered the stem from the outside (perhaps through stomata or small surface injuries) and subsequently extended towards the vascular tissues, either symplastically (morphotype 1 variant a) or through the cortical intercellular system (morphotype 1 variant b). Once close to vascular tissue, the fungus (or fungi) spread out into neighbouring areas of the host and proliferated. Unfortunately, epidermis and subepidermal tissues are not preserved, and we therefore have no direct insight into the distribution of fungal remains on the surface and in the periphery of the fern.
In modern ecosystems, fungal endophytes usually enter their host plants via stomata, surface injuries, disturbed cells at lateral root junctions or through the root cap without triggering a host response (Rodriguez et al. Reference Rodriguez, White, Arnold and Redman2009; Doty Reference Doty and Maheshwari2011; Maheshwari Reference Maheshwari2011). Specific fungal pathogens target the vascular system, but paradoxically, most vascular pathogens colonise the nutrient-poor xylem vessels, although the phloem is rich in sugars (Yadeta & Thomma Reference Yadeta and Thomma2013). This may be explained by differences in the accessibility between the xylem and the phloem when the host is alive. The phloem consists of living cells with a high osmotic pressure that makes penetration difficult, while the xylem is composed of dead tracheids and/or vessels with relatively low pressure, and there are no cell walls or plasma membranes to traverse to move throughout the vessels and once inside a vessel element (Ye Reference Ye2002; Nieminen et al. Reference Nieminen, Kauppinen and Helariutta2004; Choat & Pittermann Reference Choat and Pittermann2009; Zhang et al. Reference Zhang, Elo and Helariutta2011a).
The only way to distinguish fungal endophytes from parasites and pathogens in fossils is through the detection of specific host responses, i.e., structural alterations of host cells or tissue in reaction to fungal invasion (Krings et al. Reference Krings, Taylor, Hass, Kerp, Dotzler and Hermsen2007; Taylor et al. Reference Taylor, Krings and Taylor2015). In the absence of recognisable host responses, identification of fungal endophytes in fossil material is generally hampered by the inherent difficulties in determining the condition of the host at the time of colonisation by the fungus, i.e., alive and fully functional or in the process of senescence or decay (Krings et al. Reference Krings, Dotzler, Taylor and Galtier2009). The Triassic fern stem shows abundant hyphal swellings locally in certain areas of the phloem, but no fungal remains have been detected in the xylem. Certain extant fungi and fungus-like organisms specifically target phloem. For example, Botryosphaeria ribis and Phytophthora cinnamomi colonise the phloem of Eucalyptus spp., whereas Ceratocystis polonica infests Picea abies (Tippett et al. Reference Tippett, Shea, Hill and Shearer1983; Shearer et al. Reference Shearer, Tippett and Bartle1987; Franceschi et al. Reference Franceschi, Krokene, Krekling and Christiansen1999). These pathogens are associated with characteristic host responses or disease symptoms, none of which has been found associated with the fossil. Another interesting aspect of fungal distribution in the fossil stem concerns the general abundance of morphotype 1 variant b in the cortical intercellular system and in the phloem zone of the stele (Figs 4a, 5a). It is possible that the intercellular system and apoplast in this fossil fern employed fewer defence mechanisms (Lamb et al. Reference Lamb, Lawton, Dron and Dixon1989; Perotto et al. Reference Perotto, Brewin and Kannenberg1993; Hauck et al. Reference Hauck, Thilmony and He2003) than the symplast (e.g., Dangl & Jones Reference Dangl and Jones2001; Mithöfer & Boland Reference Mithöfer and Boland2012), and thus made the intercellular system a more hospitable environment for fungi.
4.3. Nature of the relationship(s)
Since nothing is known about the biology of the host plant, we can only speculate as to whether the fungi were biotrophs (asymptomatic endophytes, parasites, mutualists) or saprotrophs, or perhaps both (see Osono Reference Osono2006; Promputtha et al. Reference Promputtha, Lumyong, Dhanasekaran, McKenzie, Hyde and Jeewon2007; Yi & Valent Reference Yi and Valent2013; Kuo et al. Reference Kuo, Hui, Choi, Asiegbu, Valkonen and Lee2014), and what impact they might have had on the physiology of the fern. It is possible that the fungi were saprotrophs that invaded the stem post-mortem. Arguing against this hypothesis is the exquisite preservation of all tissue systems, with few signs of decay present, suggesting that the stem was intact, and thus probably alive at the time of fossilisation (silicification). If this is accurate, then the fungi would represent biotrophs. No host response has been detected in any of the tissues colonised by fungi. This suggests that the fungi, if biotrophs, were endophytes or mild parasites, which extracted some nutrients from the host but not enough to cause serious damage. On the other hand, the parenchyma that accompanies the stelar phloem is densely colonised by morphotype 1 variant b. It is interesting to note that this tissue is distinctly darker in colour than the surrounding cortex (Fig. 3a, c). This difference in coloration might result from a chemical host response (e.g., Bennett & Wallsgrove Reference Bennett and Wallsgrove1994). Other specimens of the same fern that have been obtained for comparison are not colonised by fungi, but still display the same difference in coloration between the parenchyma accompanying the stelar phloem and the cortex.
Many ferns today enter into some form of symbiotic relationship with fungi, such as mycorrhizal associations, DSE, or a combination of both (Cooper Reference Cooper1976; Berch & Kendrick Reference Berch and Kendrick1982; Zhi-Wei Reference Zhi-Wei2000; Muthukumar & Prabha Reference Muthukumar and Prabha2013; Muthuraja et al. Reference Muthuraja, Muthukumar, Sathiyadash, Uma and Priyadharsini2014; Lara-Pérez et al. Reference Lara-Pérez, Valdéz-Baizabal, Noa-Carrazana, Zulueta-Rodríguez, Lara-Capistrán and Andrade-Torres2015; Lehnert et al. Reference Lehnert, Krug and Kessler2017). No evidence of a mutualistic relationship (e.g., in the form of arbuscules or haustoria) has been observed in the fossil stem. On the other hand, superficial structural similarities exist between some of the fossil fungal remains and certain structures seen in present-day DSE, including the regularly septate hyphae (morphotype 1, variants a and b) and moniliform hyphae (morphotype 3). The fossil fungi were not likely to be DSE sensu stricto, but may have functioned similarly. Modern DSE are not normally pathogenic, but rather occur in healthy roots. However, they can become mildly mutualistic or weakly pathogenic under extreme circumstances (Jumpponen & Trappe Reference Jumpponen and Trappe1998; Reference JumpponenJumpponen 2001; Rodriguez et al. Reference Rodriguez, White, Arnold and Redman2009; Wang et al. Reference Wang, Li, Liu, Smith and Zhao2016). It is therefore possible to speculate that the fungi in the Triassic fern stem represent latent endophytes, which might, at some point, have shifted to some form of parasitism or pathogenicity.
5. Conclusions
There is ample evidence to demonstrate that well-preserved fungi can be found in permineralised plant remains in the fossil record (Taylor et al. Reference Taylor, Krings and Taylor2015). Investigators mostly find dispersed, fragmentary remains that do not provide more information than that some form of plant–fungus association was present. Specimens providing deeper insights into fungal structure and biology, as well as information on the configuration and nature of the plant–fungus association, are rare. The fossil detailed this study contains several morphologically different types of fungal remains. Each of these possesses a characteristic distribution pattern that was depicted through the thorough mapping of all fungal remains within the stem. Elucidation of these patterns allows the formulation of several hypotheses with regard to fungal infection pathways, colonisation strategies and nutrition that would not have been uncovered based on more limited data on fungal distribution in the stem. Although we therefore have a generally positive perspective for the application of this methodology in the analysis of fossil plant–fungus associations, we acknowledge its limitations. The approach is meaningless with small, fragmentary plant remains or single thin sections. Rather, specimens need to be complete enough to document distribution patterns from the periphery to the centre, have exceptional tissue preservation and be available for destructive analysis so that series of thin sections can be obtained. On the other hand, it would also be difficult and extremely arduous to perform this kind of mapping on larger and more complex plant parts such as a Psaronius stem enveloped in a massive root mantle. Nevertheless, we hold the opinion that the study presented here represents a necessary initial step to expand our inventory of methodologies to be used in the analysis of fossil plant–fungus relationships, and we hope that our study will inspire other investigators to consider documenting the spatial arrangement of fungi within fossil plants. As technology advances, perhaps other non-destructive screening techniques such as microtomography (e.g., phase-contrast X-ray synchrotron microtomography, X-ray microtomography, (micro-)computed tomography scan) complimented with reconstruction software packages such as AVIZO, MIMICS, SPIERS or Amira, can be used to produce accurate three-dimensional models that even document fine details of the distribution of fossil microorganisms within plants (see Lautenschlager Reference Lautenschlager2016).
6. Acknowledgements
We acknowledge the hospitality and help of Anne-Laure Decombeix and Brigitte Meyer-Berthaud (Montpellier, France) during CJH's visit to the paleobotanical collections at the Université de Montpellier, France. We thank Stefan Sónyi (Munich, Germany) for technical assistance, Bork Ilsemann and Mike Reich (both Munich, Germany) for assistance with the Keyence microscope, Raimund Rojko (Mönchengladbach, Germany) for making additional specimens available for study, and Anna Setlik at the Muzeum Geologiczne ‘Henryk Teisseyre' (Wrocław, Poland) for specimen information. Financial support was provided by the Alexander von Humboldt-Foundation (3.1-USA/1160852 STP) and the National Science Foundation (EAR-0949947; DEB-1441604 subcontract S1696A-A). The paper benefitted from the constructive comments and suggestions of Hans Kerp (Münster, Germany) and an anonymous referee.



