Introduction
The main aim of the International Transantarctic Scientific Expedition (ITASE), founded in 1990 with participation by 21 countries, was to establish the spatial variations of parameters related to the atmospheric system over the last 200 years and how they were represented in the upper layers of the Antarctic ice sheet (Mayewski et al. Reference Mayewski, Frezzotti and Bertler2005). As part of the ITASE project, a traverse from the coastal Zhongshan Station to interior Dome A was carried out from November 2001–January 2002 by the 18th Chinese National Antarctic Research Expedition (CHINARE-18). In January 2002, an ice core 102.18 m long was extracted at LGB69.
The dating of ice cores is the first necessary step of ice core study. There are several methods to date ice cores, depending on the required accuracy and the annual accumulation rate for the given periods. Seasonal variations of chemical concentrations associated with 18O and gross β-activity analyses in ice cores can be used for dating (Dansgaard Reference Dansgaard1954, Herron Reference Herron1982). Radioactive and volcanic records preserved in ice cores are used as reference layers in ice-core dating.
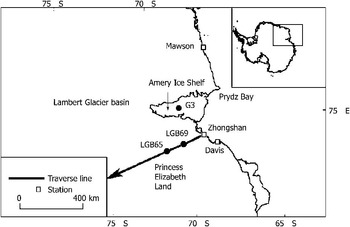
Explosive volcanic eruptions introduce large amounts of dust and gaseous materials into the atmosphere and often directly into the stratosphere, where they are transported on a regional to global scale. The dominant component of acidic volcanic gases is sulphur dioxide (SO2), which is oxidized in the atmosphere to form sulphuric acid. Aerosol microdroplets of sulphuric acid can stay in the stratosphere for months to a few years, affecting global radiative balance and climate and perturbing the chemistry of the stratosphere, and can be distributed around the world, including the Polar Regions (Delmas et al. Reference Delmas, Legrand, Aristarain and Zanolini1985, Cole-Dai et al. Reference Cole-Dai, Mosley-Thompson, Wight and Thompson1997). Volcanic sulphate aerosols and ash are deposited on polar ice sheets (Zielinski et al. Reference Zielinski, Mayewski, Meeker, Whitlow, Twickler, Morrison, Meese, Gow and Alley1994, Clausen et al. Reference Clausen, Hammer, Hvidberg, Dahl-Jensen, Steffensen, Kipfstuhl and Legrand1997, Hammer et al. Reference Hammer, Clausen and Langway1997), so volcanic spikes are therefore more easily distinguished from background values (Udisti et al. Reference Udisti, Becagli, Castellano, Mulvaney, Schwander, Torcini and Wolff2000). Major volcanic eruptions such as the Laki (64°N) eruption in 1783 and the Tambora (8°S) eruption in 1815 have deposited large amounts of strong acids in the polar ice sheets (Clausen & Hammer Reference Clausen and Hammer1988). Recently, great progress has been made in establishing time series of volcanic eruption preserved in ice cores. Hammer et al. (Reference Hammer, Clausen and Langway1997) constructed a 50 000+ year volcanic record based on electrical conductivity method (ECM), which infers the acidity of seasonal ice layers and major peaks. Cole-Dai et al. (Reference Cole-Dai, Mosley-Thompson, Wight and Thompson2000) obtained a record of Southern Hemisphere volcanism over the last 4100 years, using the continuous, detailed sulphate measurements of a 200 m ice core from a remote East Antarctica site (‘Plateau Remote’). Here we present the SO42- record of the ice core from east of Lambert Glacier basin, East Antarctica, and try to identify the volcanic eruptions preserved within the ice. The advantage of our work is as follows: 1) the ice-core drilling site is located within a high accumulation region, and the ice core was dated based on the well-preserved seasonal cycles of Na+, Mg2+ and Cl-, and 2) data from LGB65 ice core (Zhang et al. Reference Zhang, Li, Xiao, Qin, Yang, Kang and Li2002), which is adjacent to LGB69, is available for comparison (Fig. 1).
Map of CHINARE over-snow traverse route in Princess Elizabeth Land, and the locations of LGB69 and LGB65 ice cores.

Sampling and lab analysis
In January 2002, during the CHINARE-18, a 102.18 m ice core was drilled at site LGB69 (70°50′06.6′′S, 77°04′28.9′′E, 1850 m a.s.l.), east of Lambert Glacier basin. This site is 160 km inland from the coast and is located in a region with a relatively high accumulation rate (c. 70 cm yr-1, Xiao et al. Reference Xiao, Qin, Bian, Zhou, Allison and Yan2005). The surface microrelief consists of sastrugi, which are c. 0.2 m high, oriented with their longitudinal axis at c. 60°T (true north), which is perpendicular to the contour line.
The ice core was transported to the University of Maine, USA in 2002. During sample preparation, the external 0.5–1 cm of the core was removed using a pre-cleaned band-saw, and then the inner part was cut at 3 cm intervals. Sample vials for ion chromatography (IC) analysis were rigorously cleaned to prevent chemical contamination. The polypropylene vials were triple-rinsed with ultra-pure water (> 18.2 MΩ), soaked overnight, and triple-rinsed again. Ion chromatography analysis for major ions (Na+, K+, Mg2+, Ca2+, Cl-, NO3-, SO42-) and methylsulphonate (MS+) was conducted at the Climate Change Institute, University of Maine using Dionex IC with chemical suppression and conductivity detectors paired to a Gilson 215 Liquid Handler autosampler. Anions were measured using an AS-11 column, 400 μl sample loop, and a Dionex Reagent-Free Controller producing a KOH eluent concentration of 1–7 mM. Cations were measured using a CS-12A column and a 500 μl loop with 25 mM methanesulphonic acid eluent. Calibration using five calibration standards bracketing the anticipated concentration range routinely achieved correlation coefficients of r 2 > 0.99 for all major ions. The external reference material ION-92 (Environment Canada), diluted from mg l-1 concentrations to μg l-1, was analysed to verify the calibration.
The accuracy and the applied methods depend largely on the accumulation at the site. Legrand & Mayewski (Reference Legrand and Mayewski1997) emphasized the seasonal variations of several chemical species (Ca2+, Na+, NH4+, etc.), especially Na+, for which no smoothing of seasonal variations occurs with depth and which exhibits well-marked winter maxima in both Greenland and Antarctic snow. As long as the annual accumulation rate is higher than 100 kg m-2 yr-1, it is possible to count years by checking the seasonal variations. It can be noted that major sea salt ions (Na+, Mg2+, Cl-) preserved in the LGB69 ice core exhibit distinct seasonal variations. Therefore, the ice core was dated based on the well-preserved seasonal cycles of Na+, Mg2+ and Cl-, which were counted to establish the depth-age relationship with high accuracy. The accumulated errors, attributable to a few ambiguous seasonal cycles, are estimated to be only ± 2 years at the end of the record. The 102.18 m ice core record extends for 293 years (ad 1708–2001). The accuracy of our dating can be confirmed by the following: 1) the major volcanic eruptions such as Tambora (ad 1815), Krakatoa (ad 1883) and Tarawera (ad 1886) were dated in the ice core at 1816, 1884 and 1887, respectively, as expected, and 2) a nearby ice core 51.85 m long drilled at the LGB65, where the accumulation is nearly half that of LGB69, covers 251 years (Zhang et al. Reference Zhang, Li, Xiao, Qin, Yang, Kang and Li2002).
Results and discussion
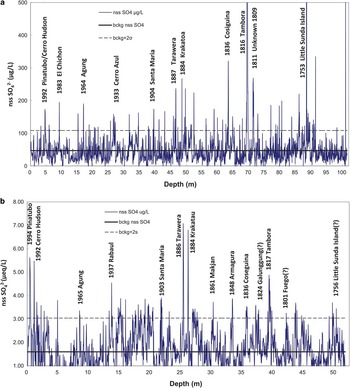
There are large amounts of SO42- in sea salt aerosols (MgSO4, Na2SO4), that are transported by atmospheric circulations and deposited on polar ice sheets, forming the background SO42- in Antarctic snowfall. After explosive volcanic eruptions, volcanic sulphate aerosols and ash are deposited on polar sheets and may result in a peak of SO42- concentration in the ice core, which is the so-called non-sea salt (nss) SO42-. Therefore nss SO42- concentrations are calculated using the SO42-/Na+ concentration ratio in bulk seawater. The time series of nss SO42- concentrations is presented in Fig. 2 to identify the signals of volcanic eruptions.
The figure shows the volcanic eruptions in the past 293 (251) years recorded by non-sea salt SO42- concentrations in the a. LGB69, and b. LGB65 ice cores. The thick black line represents background concentration and the dotted line represents the average background concentration plus two standard deviations, respectively.

The detection of volcanic signals in ice cores, especially those corresponding to the small and moderate events, depends on how the non-volcanic background is estimated. First, we remove the samples around the time of the explosive volcanic eruptions from the nss SO42- concentration series, while identification of these volcanic events relies on the accurate dating of the ice core and was made with reference to results from previous Antarctic ice cores (Legrand & Delmas Reference Legrand and Delmas1987, Moore et al. Reference Moore, Narita and Maeno1991, Delmas et al. Reference Delmas, Kirchner, Palais and Petit1992, Cole-Dai et al. Reference Cole-Dai, Mosley-Thompson, Wight and Thompson1997). Finally, the average and standard deviation (σ) of the remaining dataset are computed to represent the background and its variability, respectively. Subsequently, volcanic years are identified as those with SO42- concentrations exceeding the background average by 2σ, an approach similar to that used by Cole-Dai et al. (Reference Cole-Dai, Mosley-Thompson, Wight and Thompson1997).
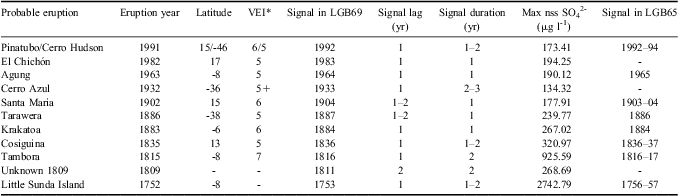
Volcanic eruptions over the past 293 years identified from nss SO42- in the LGB69 ice core are labelled in Fig. 2. The years in which the peaks of nss SO42- were identified in the ice core are marked on the figure. The inferred eruption years and locations are listed in Table I.
Volcanic events identified in the LGB69 and the LGB65 ice cores.
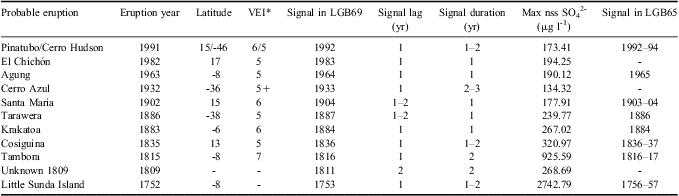
*VEI = Volcanic Explosivity Index, a general indicator of the explosive character of an eruption, which is a composite estimate of Walker's magnitude and/or intensity and/or destructiveness and/or (less frequently) dispersive power, violence, and energy release rate, depending on which data were available Newhall & Self (Reference Newhall and Self1982). Volcanic Explosivity Index data is available on Global Volcanism Program: http://www.volcano.si.edu/world/largeeruptions.cfm.
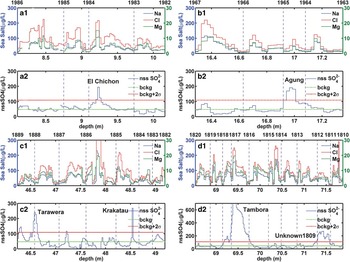
The details of the volcanic eruptions listed in Table I can be found in the literature (Legrand & Delmas Reference Legrand and Delmas1987, Moore et al. Reference Moore, Narita and Maeno1991, Delmas et al. Reference Delmas, Kirchner, Palais and Petit1992, Cole-Dai et al. Reference Cole-Dai, Mosley-Thompson, Wight and Thompson1997). Four periods containing individual volcanic eruption events found in LGB69 ice core are shown in Fig. 3. When compared with the LGB65 ice core dating (a 51.85 m ice core, covering 251 years), we can find the LGB69 dating is more accurate, mainly because of the high annual accumulate rate. Nine explosive volcanic eruptions identified in LGB69 are also shown in LGB65, such as Pinatubo/Cerro (1991), Agung (1963), Santa Maria (1902), Tarawera (1886), Krakatoa (1883), Cosiguina (1836), Tambora (1815), Little Sunda Island (1752), and all the explosive volcanic eruptions recorded (except the Little Sunda Island, 1752) in LGB69 match well with the Global Volcanism Program. However, in LGB65, the volcanic eruptions El Chichón (1982) and Unknown 1809 cannot be identified and the signal lags in LGB69 are usually smaller than that of LGB65, mainly due to the different accumulation rates (twice on LGB69 as on LGB65). Compared to LGB65, dating in LGB69 ice-core is more precise (with more reasonable lag period), and the chemical compositions are well preserved in it.
Na+, Mg2+, Cl- and nss SO42- profiles from the ice core sampled at the LGB69 site covering the years a. 1982–86 ad, b. 1963–67 ad, c. 1882–89 ad, and d. 1810–20 ad. Explosive volcanic eruptions were identified during each period in the LGB69 ice core.

The decade of the 1990s was characterized by the occurrence of the most important explosive eruption since that of Mount Agung in 1963: the Pinatubo eruption (15°N), which injected 12–20 Mt (million metric tons, or 1012 g) of SO2 into the atmosphere (Bluth et al. Reference Bluth, Doiran, Schnetzler, Krueger and Walter1992, McPeters Reference McPeters1993). Also the high southern latitude regions experienced the eruption of Cerro Hudson in August 1991, which injected 2 Mt of SO2 into the atmosphere at 45°S, primarily below 14 km (Doiran et al. Reference Doiran, Bluth, Schnetzler, Krueger and Walter1991). Although the eruption quantity of Cerro Hudson was much less than that of Pinatubo, it was also preserved in the Antarctic snow due to the southern latitude of the volcano location.
The 1982 eruption of El Chichón volcano ejected > 20 kg s-1 of Cl-rich (> 15 000 mg kg-1) and sulphur-poor (> 200 mg kg-1 of SO4), almost neutral (pH up to 6.7) water into the atmosphere (Taran et al. Reference Taran, Fischer, Pokrovsky, Sano, Aurora Armienta and Macias1998). This eruption is dated at the year 1983 in the LGB69 ice core (Fig. 3a), but has not been identified in some of the other ice cores. Due to the special wind distribution patterns at the time of the eruption, the signal was kept as a weaker one in the Antarctic ice sheets, which has only been identified in this study and the Law Dome ice core (Palmer et al. Reference Palmer, van Ommen, Curran, Morgan, Souney and Mayewski2001), both of which are coastal ice cores in East Antarctica.
The 1963 eruption of Agung volcano (8°S) injected sufficient SO2 gas into the stratosphere to form 11–12 Mt of H2SO4 aerosols in the air (Self & King Reference Self and King1996). Despite the fact that Agung is located in the tropics and its SO42- aerosols were expected to spread to both hemispheres, this eruption could not be unambiguously identified in Greenland snow (Mosley-Thompson et al. Reference Mosley-Thompson, Thompson, Dai, Davis and Lin1993, Zielinski et al. Reference Zielinski, Mayewski, Meeker, Whitlow, Twickler, Morrison, Meese, Gow and Alley1994). However, it has been identified in many previous Antarctic ice cores (Delmas et al. Reference Delmas, Legrand, Aristarain and Zanolini1985, Legrand & Delmas Reference Legrand and Delmas1987, Moore et al. Reference Moore, Narita and Maeno1991, Langway et al. Reference Langway, Osada, Clausen, Hammer and Shoji1995), and its signal may serve as a time-stratigraphic marker for future cores. In the LGB69 ice core, this eruption is identified at the year 1964 (Fig. 3b).
Small and continuous signals could be detected during 1933–35. We mark the beginning of the signal as Cerro Azul (1932). Other volcanic eruptions might be contained in this period as well.
Krakatoa (6°S) erupted in August 1883 and it is dated at 1884 in this study (Fig. 3c). The obvious signal of Tarawera (erupted in 1886 in New Zealand, 38°S) could be found at 1887, as mentioned in previous studies (Moore et al. Reference Moore, Narita and Maeno1991, Delmas et al. Reference Delmas, Kirchner, Palais and Petit1992). The signals in 1836 with small magnitudes are consistent with the January 1835 eruption of Cosiguina in Nicaragua (13°N), which might not have been a sulphur-rich eruption (Self et al. Reference Self, Rampino and Carr1989).
In Fig. 3d, the signal peaks in late 1816, reflecting the well-known 1815 Tambora eruption. The one to two year lag between the eruption and the initial SO42- deposition is consistent with the transport time of volcanic aerosols from the tropics. As for the signal immediately prior to Tambora, no significant eruptions are found in the Volcanic Explosivity Index (VEI) records. But it has been found and identified as an unknown 1809 eruption in previous studies (Dai et al. Reference Dai, Mosley-Thompson and Thompson1991, Moore et al. Reference Moore, Narita and Maeno1991). The unknown 1809 eruption is dated at 1811 in LGB69 ice core, meaning that there is a two year lag between the eruption and the initial SO42- deposition.
In addition, we have found a distinct signal in the year of 1753 in the nss SO42- time series, which could not be found in the VEI records. We consider it as the Little Sunda Island eruption in 1752, with one year lag between the eruption and the initial SO42- deposition, as shown in Moore et al. (Reference Moore, Narita and Maeno1991) also.
Summary and conclusion
Based on the remarkable seasonal variations of sea salt ions in LGB69 ice core, the annual layers can be counted. Our dating results provide a good match with volcanic records used as reference layers. All those above have testified the accuracy of our dating work for the LGB69 ice core. In comparison to the Global Volcanism Program, all explosive volcanic eruptions (VEI ≥ 5) that might have deposited large amounts of strong acids in Antarctic sheets (eruptions located in the tropics or southern hemisphere) have been identified in the LGB69 ice core, which proves that our work is of high accuracy. This lays a solid foundation for our further investigations at this site on historical changes of temperature (δ values), snow accumulation, sea ice extent (methanesulphonic acid values) and others.
Acknowledgements
This study was funded by the National Natural Science Foundation of China (500222103002, 40825017), the Hundred Talent Project of the Chinese Academy of Sciences, the project by Chinese Arctic and Antarctica Administration (CHINARE2012-02-02). The constructive comments of the reviewers are gratefully acknowledged.