1 Introduction
Jet in a crossflow (JICF) refers to the semi-bounded flow in which a flux of fluid from an orifice in a lower bounding wall interacts with the main flow above. Here we consider the canonical configuration of a round jet orifice oriented perpendicularly to the crossflow and flush with the lower bounding wall. This is commonly encountered in both natural and engineering systems, such as combustion chambers, chemical mixing, volcanic eruptions, pollutant discharges or film cooling. The dynamics of the JICF is primarily dictated by the velocity ratio between the jet and free stream. The velocity ratio can be defined with either bulk or centreline speed of the jet, which we will refer to as
 $R$
and
 $R^{\ast }$
, respectively.
A JICF can be categorized in two big categories depending on the velocity ratio. The first category contains jets with a high velocity ratio, which have been extensively investigated over several decades (see reviews of Margason Reference Margason1993; Karagozian Reference Karagozian2010; Mahesh Reference Mahesh2013; Karagozian Reference Karagozian2014). Their topology consists of shear-layer vortices, counter-rotating vortex pairs, upright wake vortices and horseshoe vortices. Megerian et al. (Reference Megerian, Davitian, Alves and Karagozian2007) investigated flush and elevated jet nozzles and reported that, for low enough velocity ratios (
 $R\lesssim 3.5$
for flush and
 $R\lesssim 1.35$
for elevated nozzle), self-sustained strong pure-tone oscillations are generated by rolling-up of the upper jet shear layer very close to the leading edge of the jet orifice. These observations were later confirmed by other experiments (Davitian et al.
Reference Davitian, Getsinger, Hendrickson and Karagozian2010; Getsinger et al.
Reference Getsinger, Gevorkyan, Smith and Karagozian2014; Gevorkyan et al.
Reference Gevorkyan, Shoji, Peng and Karagozian2018), as well as numerically (Iyer & Mahesh Reference Iyer and Mahesh2016) and theoretically (Regan & Mahesh Reference Regan and Mahesh2017).
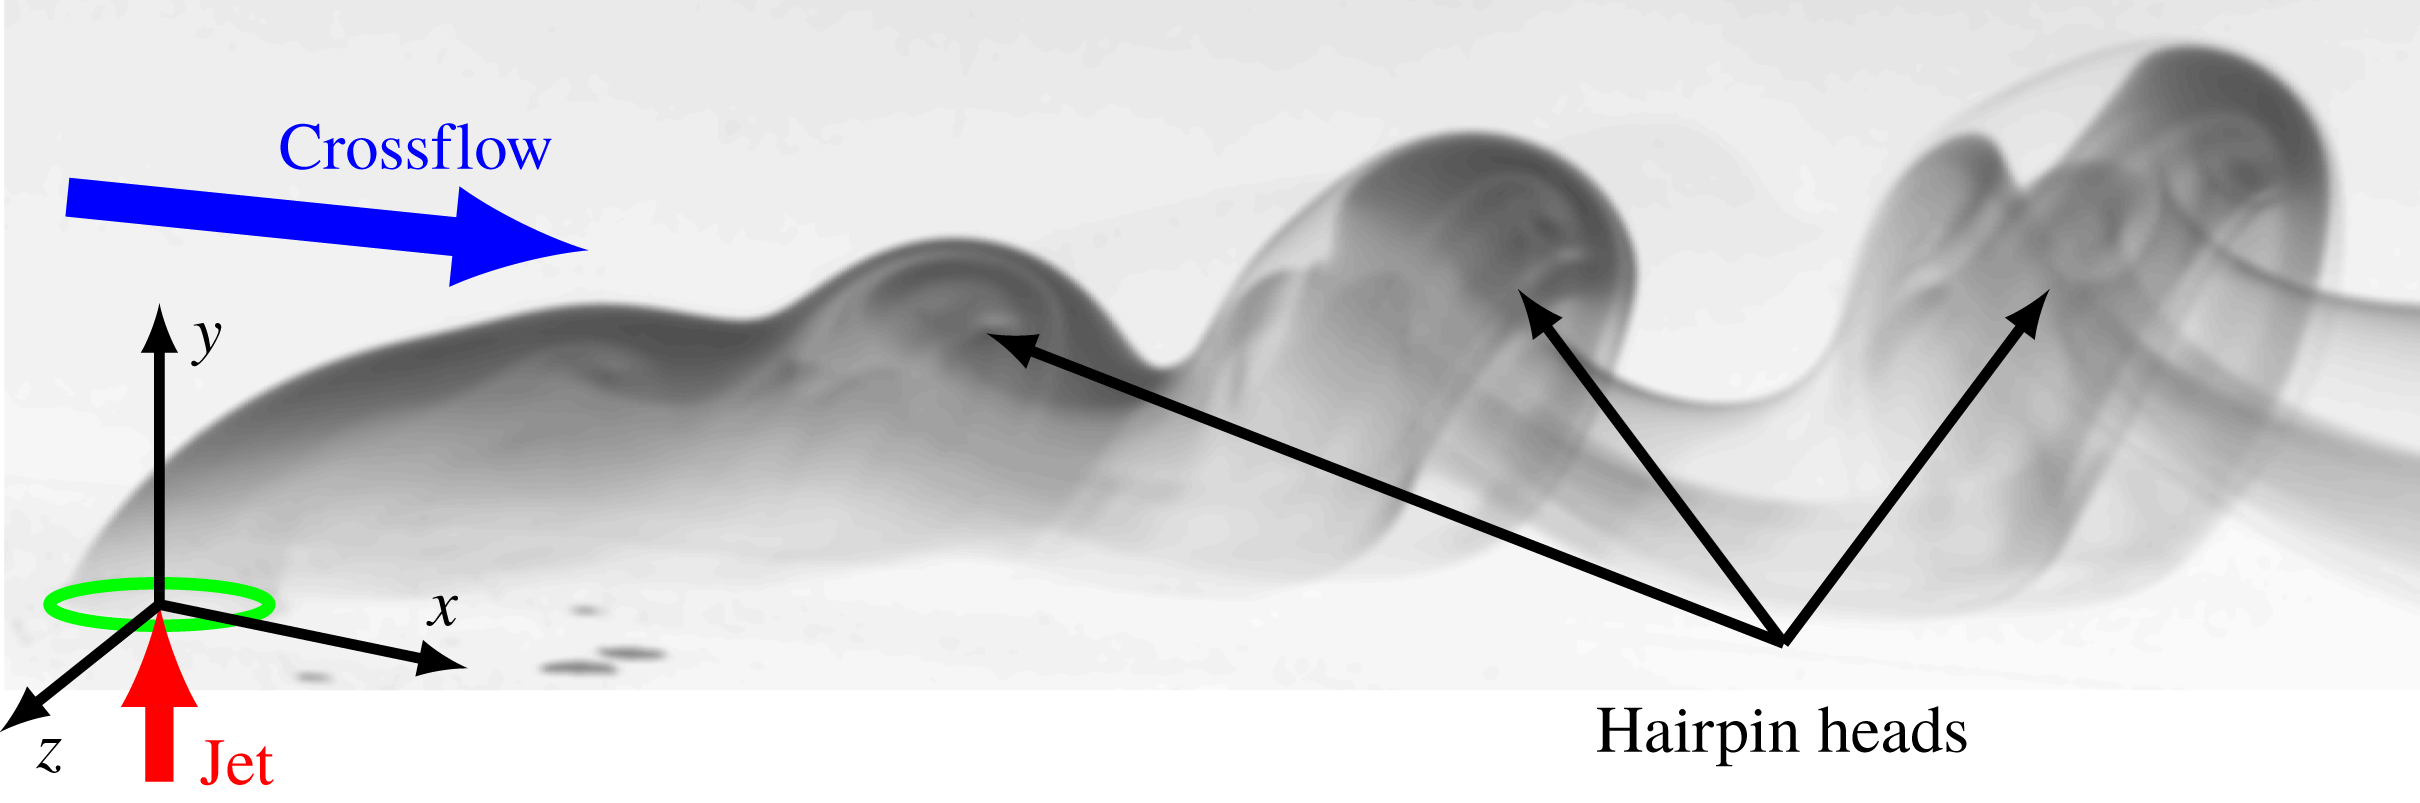
Flow visualisation (streaklines) to schematically show the flow structure of hairpin vortices in a JICF for the low-velocity-ratio regime. The jet orifice, crossflow and jet flux are marked by a green ellipse, blue arrow and red arrow, respectively. Additionally, hairpin vortices are indicated by black arrows.

On the other hand, the JICF in the low-velocity-ratio regime is less well described. Camussi, Guj & Stella (Reference Camussi, Guj and Stella2002) observed that, for a single crossflow Reynolds number (
 $Re_{D}=100$
, defined with free-stream velocity, jet diameter and kinematic viscosity of the fluid) with increasing
 $R$
, the amplitude of the vorticity emanating from the upstream jet shear layer increases and becomes dynamically dominant for
 $R\gtrsim 3$
in the flush nozzle configuration. This value can be considered as the upper-bound estimate of
 $R$
to differentiate between the low- and high-velocity ratio regimes for
 $Re_{D}=100$
. Experiments carried out for
 $R\in (0.5,2.5)$
,
 $Re_{D}=1.9\times 10^{4}$
(Gopalan, Abraham & Katz Reference Gopalan, Abraham and Katz2004) and numerical simulations performed for
 $R\in (1,2)$
,
 $Re_{D}=600$
(Sau & Mahesh Reference Sau and Mahesh2008) indicate that in the low-velocity-ratio regime the intensity of the upstream jet shear layer is significantly decreased due to the interaction with the incoming crossflow. Furthermore, numerous experiments (Acarlar & Smith Reference Acarlar and Smith1987b
; Lim, New & Luo Reference Lim, New and Luo2001; Camussi et al.
Reference Camussi, Guj and Stella2002; Bidan & Nikitopoulos Reference Bidan and Nikitopoulos2013; Cambonie & Aider Reference Cambonie and Aider2014) reported on the periodic hairpin shedding (figure 1), the heads of which consist of the spanwise vorticity (measured in the symmetry plane of the JICF) of the same/opposite sign when compared to the downstream/upstream jet shear layer.
In addition, Bucci et al. (Reference Bucci, Puckert, Andriano, Loiseau, Cherubini, Robinet and Rist2018) investigated a flow behind a single cylinder in a boundary layer, which represents the JICF with the elevated jet nozzle in the limit of no jet flux (
 $R=0$
). They observed shedding of vortical structures behind the obstacle, which indicated that the elevated jet pipe has potential to generate self-sustained shedding of hairpin vortices. Acarlar & Smith (Reference Acarlar and Smith1987a
) reported similar results in the wake of a single hemisphere.
Low-ratio jets with a velocity ratio
 $R$
typically lower than 1 can be used for film cooling, a process in which a small flux of cold fluid from the orifice creates a thin layer over the surface, protecting it from the hot fluid in the free stream (Jovanović, de Lange & van Steenhoven Reference Jovanović, de Lange and van Steenhoven2008). In this context hairpin vortices should be avoided, since their generation increases the mixing rate. A first step to understand and control the hairpin generation is to determine the hairpin instability threshold and the location at which these structures are formed. The bifurcation that leads to periodic hairpin shedding in low
 $R$
regime has been numerically investigated by Ilak et al. (Reference Ilak, Schlatter, Bagheri and Henningson2012) for
 $R\lesssim 1$
(equivalently
 $R_{\ast }\lesssim 3$
) and for a single crossflow Reynolds number
 $Re_{D}=495$
. Based on the observation of self-sustained oscillations, the authors postulated that the hairpin shedding occurred through Hopf bifurcation. However, certain aspects of the dynamics were not properly addressed owing to a large computational cost, i.e. they imposed the exit velocity profile at the jet orifice as a boundary condition instead of including the jet pipe inlet in the computational domain. Peplinski, Schlatter & Henningson (Reference Peplinski, Schlatter and Henningson2015a
,Reference Peplinski, Schlatter and Henningson
b
) compared the results obtained with two different computational grids (the first with an idealized jet as in Ilak et al. (Reference Ilak, Schlatter, Bagheri and Henningson2012) and the second with the inlet jet pipe directly included in the mesh) for
 $R=0.47$
(equivalently,
 $R^{\ast }=1.5$
) and
 $Re_{D}=495$
, and observed that
 $R_{cr}$
could be significantly reduced when the pipe inlet was included. They also pointed out that numerical determination of the critical velocity ratio
 $R_{cr}$
for hairpin shedding instability was difficult owing to the sensitivity of simulations on the numerical method, grid size and resolution. The influence of the jet inlet pipe on the numerical simulations and the dependence of the hairpin dynamics on crossflow Reynolds numbers is the subject of ongoing work in the KTH group (Chauvat et al.
Reference Chauvat, Peplinski, Hanifi and Henningson2017).
Motivated by difficulties related to the numerical determination of the critical velocity ratio and a possible influence of the jet inlet pipe (Ilak et al. Reference Ilak, Schlatter, Bagheri and Henningson2012; Peplinski et al. Reference Peplinski, Schlatter and Henningson2015b ), the main aim of this work is to quantitatively study the instability that gives rise to the self-sustained hairpin shedding. We investigate experimentally the JICF, varying both the jet and free-stream speeds and using spectral analysis to characterize the hairpin shedding (i.e. the study of the characteristic Strouhal number, global mode of hairpin vortices and bifurcation diagrams of the hairpin instability). We show that the hairpin amplitude can be described by the Landau model, similar to other hydrodynamical oscillators such as wake behind bluff bodies (Mathis, Provansal & Boyer Reference Mathis, Provansal and Boyer1984; Goujon-Durand, Jenffer & Wesfreid Reference Goujon-Durand, Jenffer and Wesfreid1994; Wesfreid, Goujon-Durand & Zielinska Reference Wesfreid, Goujon-Durand and Zielinska1996). Using this model, we determine the onset of the hairpin shedding instability for a specific parameter range. This is the first time such a dynamical model has been used to describe the hairpin shedding of the JICF.
2 Experimental set-up
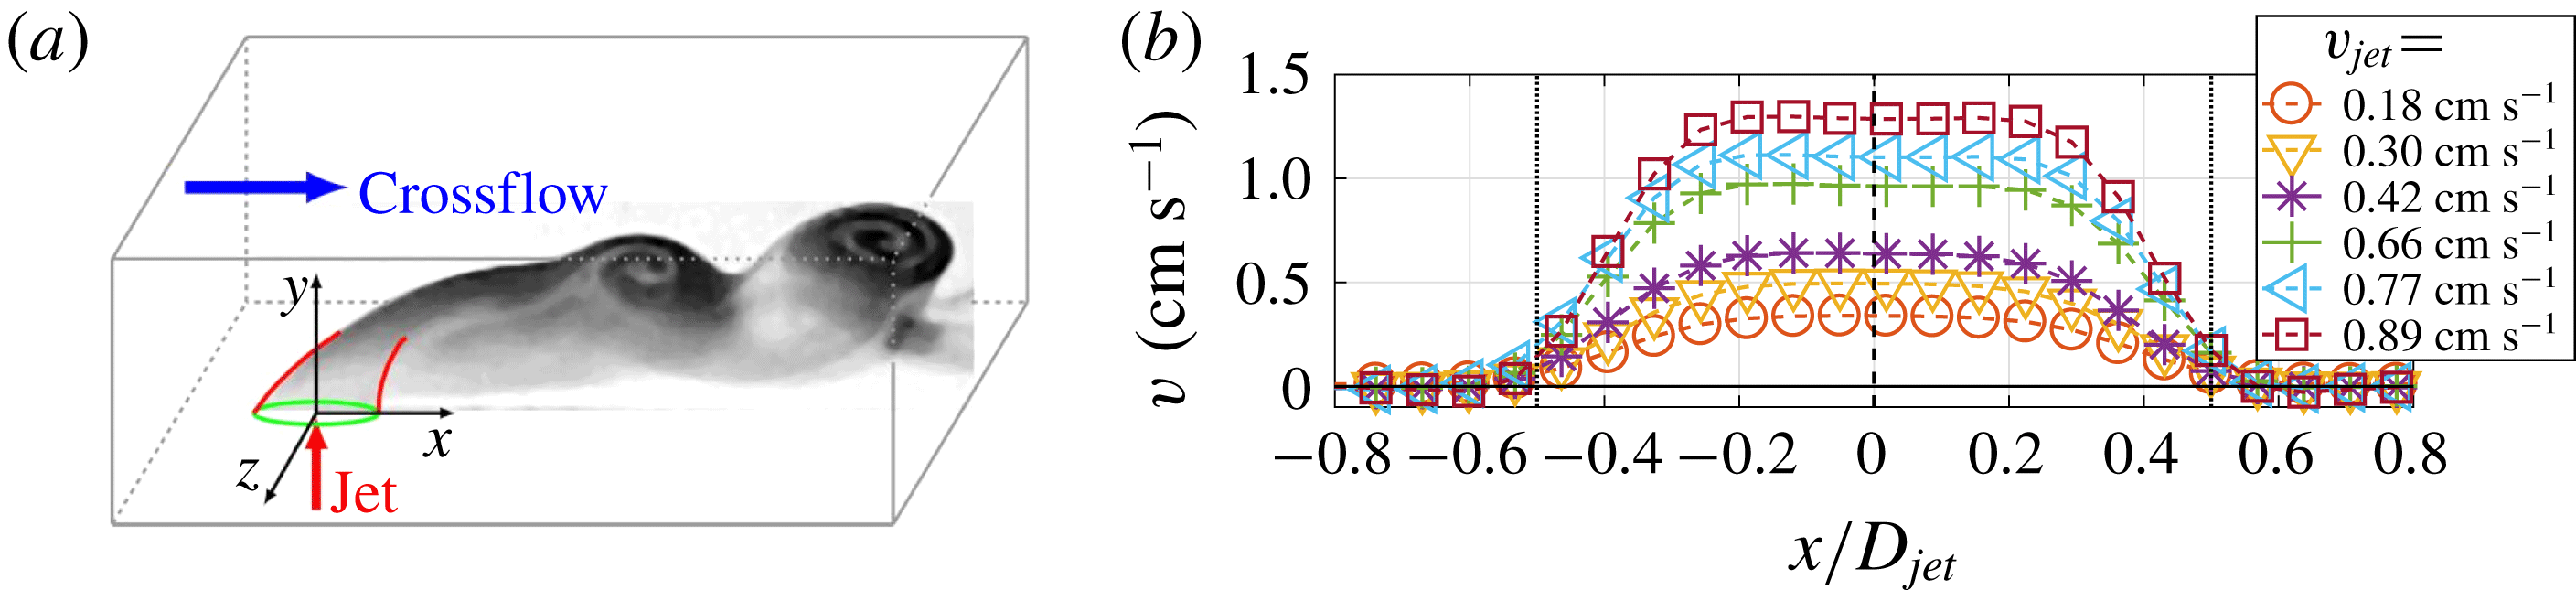
(a) Schematic representation of the experimental configuration indicating the streamwise (
 $x$
), wall-normal (
 $y$
) and spanwise (
 $z$
) directions. The green ellipse represents the jet orifice. The scheme is supplemented with the picture of flow visualisation (streaklines) of the downstream near-field of the JICF to illustrate the structure of hairpin vortices for
 $R=0.68$
and
 $Re_{D}=310$
. (b) Time-averaged wall-normal velocity profiles measured above the jet orifice (
 $y/D_{jet}=0.07$
) in the
 $z=0$
plane for different jet fluxes and in the absence of crossflow (
 $U_{0}=0$
). The vertical black dashed line indicates the centre of the jet, whereas vertical black dotted lines mark the upstream and downstream edges of the jet orifice.

We use three non-dimensional parameters to characterise the JICF configuration: velocity ratio
 $R=V_{jet}/U_{0}$
, crossflow Reynolds number
 $Re_{D}=U_{0}D_{jet}/\unicode[STIX]{x1D708}$
and jet Reynolds number
 $Re_{jet}=V_{jet}D_{jet}/\unicode[STIX]{x1D708}=R\cdot Re_{D}$
, where
 $U_{0}$
,
 $V_{jet}$
,
 $D_{jet}$
and
 $\unicode[STIX]{x1D708}$
are free-stream and jet bulk velocities, jet diameter and kinematic viscosity of the fluid, respectively. All quantities are normalized with the appropriate combination of
 $D_{jet}$
and
 $U_{0}$
. The experimental configuration along with the typical vortical structures in the flow are shown in figure 2(a). We place the origin of the coordinate system
 $(0,0,0)$
at the centre of the jet orifice and denote the streamwise (direction of the free-stream), wall-normal (vertical, direction of the jet) and spanwise directions by
 $x,y,z$
, respectively. Experiments were carried out in a closed-loop channel at Warsaw University of Technology, with water at room temperature as the working fluid for both the jet and crossflow. The experimental set-up has a horizontal test section made of plexiglass to provide optical access. The test section has a rectangular cross-section of
 $15.0$
cm wide and
 $10.0$
cm high, and the length of the channel is
 $150.0$
cm. The crossflow is induced by gravity, using a constant-level tank located above the test section to provide a constant pressure gradient (see also figure 1 in Klotz et al. (Reference Klotz, Goujon-Durand, Rokicki and Wesfreid2014)). Before entering the test section, the crossflow is conditioned by two honeycomb screens and a 4:1 contraction nozzle. The bulk crossflow velocity is controlled by a valve and measured with tensometric weight with
 $\pm 0.5\,\%$
accuracy.
The jet is injected normal to the wall into the crossflow through a circular exhaust with an internal diameter
 $D_{jet}=2.17$
cm, mounted flush with the test section floor. The jet plenum chamber is supplied with the fluid by an additional pump through a spiral tube with several holes drilled along its length. The jet flow is then conditioned by a porous material and a 16:1 contraction nozzle, and is controlled by a precise needle valve. The bulk velocity of the jet is measured by a calibrated Kobold rotameter with
 $\pm 1.2\,\%$
accuracy.
We measure velocity fields with a two-dimensional particle image velocimetry (PIV) set-up that consists of a Litron Nano L200-15 laser (double-headed, 532 nm light, 1200 mJ energy per pulse) and Imager sCMOS camera (16-bit,
 $2560\times 2160$
pix). We acquire single-frame image sequences and cross-correlate two consecutive images using Davis 8.1 Lavision software using
 $32\times 32$
pixel interrogation windows with 50 % overlap. To retain the time correlation between two snapshots, for each measurement, we use a frequency from 7 Hz to 30 Hz (depending on
 $U_{0}$
) that corresponds to about
 $0.06$
advective time units (
 $t_{adv}=D_{jet}/U_{0}$
), unless otherwise stated. For all PIV measurements presented in this paper, the laser sheet, of about
 $1.5$
mm thickness, is aligned with the
 $z=0$
plane.
First, we measure the wall-normal velocity component of the jet in the absence of the crossflow (
 $U_{0}=0$
). For this, we acquire 100 images for each jet flux, adjusting the acquisition frequency such that the time between two consecutive frames is about
 $0.03$
advective time units (in this case defined as
 $t_{adv}=D_{jet}/V_{jet}$
). In figure 2(b) we present a time-averaged wall-normal velocity component measured at
 $y/D_{jet}=0.07$
for different jet fluxes. The black vertical dashed and dotted lines mark the jet centre and edges of the jet orifice, respectively. Temporal fluctuations of
 $V_{jet}$
are lower than 0.8 %.
Next, we use PIV to measure the streamwise velocity component of the crossflow at
 $x/D_{jet}=-2.6$
and as a function of the wall-normal coordinate. For each crossflow speed, we measured 10 sets of data, each containing 660 images. The mean velocity profiles in figure 3(a) are averaged over time and over all sets. Then we calibrate the bulk crossflow speed into the free-stream velocity
 $U_{0}$
. We also estimate the turbulence intensity level by calculating the standard deviation (STD) of the streamwise velocity component; spatial/temporal fluctuations of the free-stream velocity (in the central part of the test section) are lower than 2.3 %/1.8 %, respectively, and temporal velocity fluctuations of the lower boundary layer are lower than 3.9 %. The wall-normal velocity fluctuations of the cross-flow are
 $\simeq 0.8\,\%$
of
 $U_{0}$
for
 $U_{0}$
lower than
 $2.11~\text{cm}~\text{s}^{-1}$
(
 $Re_{D}=510$
) and start to increase up to
 $\simeq 3.1\,\%$
of
 $U_{0}$
for
 $U_{0}=2.67~\text{cm}~\text{s}^{-1}$
(
 $Re_{D}=640$
). The position of the lower bounding wall and the distance to the first
 $y$
-position was deduced from the raw images. Displacement thickness
 $\unicode[STIX]{x1D6FF}_{\ast }$
and momentum loss thickness
 $\unicode[STIX]{x1D6FF}_{\ast \ast }$
of the lower boundary layer are calculated at
 $x/D_{jet}=-2.6$
by trapezoidal integration and are shown in table 1. The resulting shape factor
 $H=\unicode[STIX]{x1D6FF}_{\ast }/\unicode[STIX]{x1D6FF}_{\ast \ast }$
is equal to
 $2.6\pm 0.2$
, close to the value of the laminar Blassius boundary layer. In figure 3(b) we plot the time-averaged streamwise velocity profiles of the crossflow at
 $x/D_{jet}=-2.6$
using the free-stream speed
 $U_{0}$
to normalize the streamwise velocity component and boundary layer displacement thickness
 $\unicode[STIX]{x1D6FF}_{\ast }$
to normalize the wall-normal coordinate. For all considered crossflow velocities, our measurements compare well with the streamwise velocity profile of the laminar Blassius boundary layer, shown as a thick black curve in figure 3(b).
(a) Time-averaged streamwise velocity profiles
 $u(y)$
of the crossflow measured at
 $x/D_{jet}=-2.6$
in the symmetry plane (
 $z=0$
) for different values of free-stream speeds
 $U_{0}$
. (b) The same data as in (a) but with the wall-normal coordinate normalized with a boundary layer displacement thickness
 $\unicode[STIX]{x1D6FF}_{\ast }$
(see table 1). The thick solid black curve represents the theoretical solution for the laminar Blassius boundary layer.

The first and second rows indicate all investigated crossflow speeds
 $U_{0}$
and corresponding crossflow Reynolds numbers
 $Re_{D}$
, respectively. The third and fourth rows show displacement thickness
 $\unicode[STIX]{x1D6FF}_{\ast }$
and momentum loss thickness
 $\unicode[STIX]{x1D6FF}_{\ast \ast }$
of the lower boundary layer formed above the floor of the test section at
 $x/D_{jet}=-2.6$
location. These characteristic quantities are calculated by trapezoidal integration from the mean streamwise velocity profiles shown in figure 3.

3 Experimental results
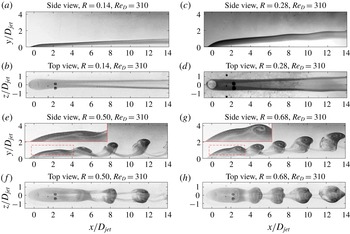
Side (a,c,e,g) and top (b,d,f,h) view of flow visualisations (streaklines) for
 $Re_{D}=310$
to illustrate how the flow structure changes when the velocity ratio
 $R$
is increased from
 $R=0.14$
to
 $R=0.68$
. Insets in the top-left corner of (e) and (g) present, at double magnification, the region marked by the dashed red rectangles in the corresponding subplots.

To illustrate qualitatively the flow dynamics of the JICF in the low-velocity-ratio regime, we first present flow visualisations (streaklines) using fluorescein dye excited by a point source of visible light. The concentrated fluorescent colourant was injected from a pressurized container into the jet bulk flow before the jet plenum chamber. This results in a uniform fluoresceine concentration across the entire jet cross-section at
 $y=0$
. Figure 4 illustrates, for
 $Re_{D}=310,$
how the flow structure changes when
 $R$
is increased from
 $R=0.14$
to
 $R=0.68$
. The top and bottom rows correspond to the side and top views, respectively. Both views are captured instantaneously with a single Nikon D610 camera (with 6016 x 4016 pix matrix) and a mirror inclined at 45 degrees with respect to the horizontal plane. For high enough
 $R,$
the downstream near-field of the JICF is dominated by a distinct periodic shedding of hairpin vortices (figure 4
e–h). Insets in the top-left corner of subplots (e) and (g) of figure 4 present, at double magnification, the region marked by the dashed red rectangle in the corresponding subplots. The spirals formed within the hairpin heads in figure 4(g) rotate clockwise, which corresponds to negative spanwise vorticity. Similar hairpin vortices were also reported by Lim et al. (Reference Lim, New and Luo2001), Camussi et al. (Reference Camussi, Guj and Stella2002) and Ilak et al. (Reference Ilak, Schlatter, Bagheri and Henningson2012). In contrast, for low
 $R,$
no distinct self-sustained hairpin shedding can be observed in the downstream near-field (figure 4
a–d). We note that the transition to hairpin shedding in the JICF in the low-velocity-ratio regime is analogous to the transition reported for the wake behind three-dimensional bluff bodies, such as a sphere (Johnson & Patel Reference Johnson and Patel1999; Gumowski et al.
Reference Gumowski, Miedzik, Goujon-Durand, Jenffer and Wesfreid2008), a disk (Bobinski, Goujon-Durand & Wesfreid Reference Bobinski, Goujon-Durand and Wesfreid2014) and a cube (Klotz et al.
Reference Klotz, Goujon-Durand, Rokicki and Wesfreid2014), with a similar structure to shed hairpins and with a gentle kinking of two trails of counter-rotating vortices prior to self-sustained shedding of hairpins (see at
 $x/D_{jet}>8$
in figure 4
c,d). In addition, Peplinski et al. (Reference Peplinski, Schlatter and Henningson2015a
) studied numerically the JICF for
 $R\in (0.31,0.50)$
and
 $Re_{D}=495$
, and observed similar kinking of two-counter rotating vortices for
 $R$
below the threshold of hairpin shedding. They proposed non-modal transient growth of the perturbation (see Schmid & Henningson (Reference Schmid and Henningson2001) for a theoretical description and Klotz & Wesfreid (Reference Klotz and Wesfreid2017) for experimental verification) as a mechanism leading to these oscillations.
To evaluate quantitatively the JICF behaviour, we acquire 3 sequences of 660 images for each
 $U_{0}$
(see table 1) and
 $V_{jet}<1~\text{cm}~\text{s}^{-1}$
, which corresponds to
 $Re_{D}=U_{0}\,D_{jet}/\unicode[STIX]{x1D708}\in (260,640)$
and
 $R=V_{jet}/U_{0}\in (0.14,0.75)$
. The precise range of
 $R$
is different for each
 $U_{0}$
. Flow visualisations (figure 4) and PIV measurements presented below were carried out in different runs. The measurement region covers
 $x/D_{jet}\in (-3.95,18.33)$
and
 $y/D_{jet}\in (0.14,4.12)$
, with a spatial resolution of
 $0.13D_{jet}$
. First, we evaluate a modification of the jet velocity profile when
 $U_{0}\neq 0$
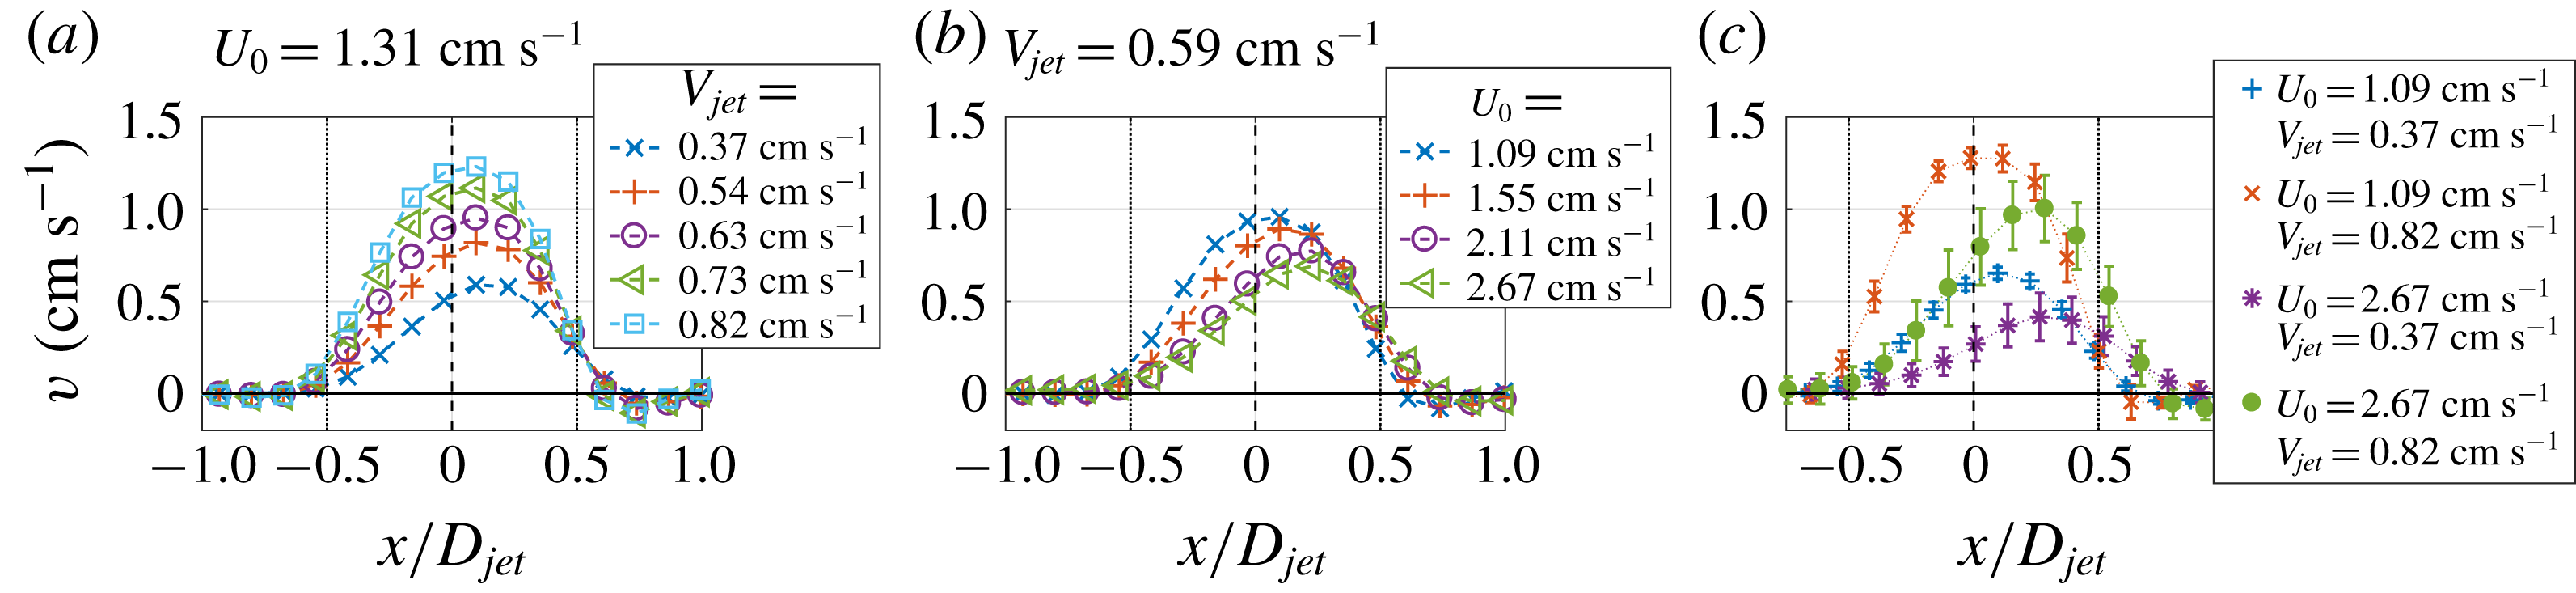
. In figure 5 we present a time-averaged wall-normal jet velocity component as a function of
 $x$
, measured at
 $y/D_{jet}=0.26$
. For fixed
 $U_{0}=1.31~\text{cm}~\text{s}^{-1}$
(figure 5
a), the shape of the jet profile remains relatively unchanged and the maximal jet velocity increases proportionally with
 $V_{jet}$
. In contrast, for fixed
 $V_{jet}=0.59~\text{cm}~\text{s}^{-1}$
(figure 5
b), the maximal vertical jet velocity decreases and shifts toward the trailing edge of the jet when
 $U_{0}$
is increased. In figure 5(c) we show the time-averaged jet profiles for all possible combinations of the lowest/highest values of the jet (
 $V_{jet}=0.37$
and
 $0.82~\text{cm}~\text{s}^{-1}$
) and crossflow (
 $U_{0}=1.09$
and
 $2.67~\text{cm}~\text{s}^{-1}$
) speeds. These four cases span the entire parameter space investigated in this paper. To estimate temporal fluctuations of the jet profile when
 $U_{0}\neq 0$
, we calculate the standard deviation of
 $V_{jet}(t)$
for each
 $x$
location. The resulting values, premultiplied by a factor of two, are plotted as error bars in figure 5(c). For low
 $V_{jet}$
and
 $U_{0}$
, the jet profile is almost completely stationary and when either
 $V_{jet}$
or
 $U_{0}$
are increased, temporal fluctuations of the jet profile also increase. Even for the lowest
 $V_{jet}$
and the highest
 $U_{0}$
we do not observe any significant flow from the crossflow into the jet orifice near the leading edge.
Illustration of the modification of the wall-normal jet velocity profile
 $v(x)$
due to interaction with
 $U_{0}$
: (a)
 $v(x)$
for different bulk jet speeds and for fixed
 $U_{0}=1.31~\text{cm}~\text{s}^{-1}$
; (b)
 $v(x)$
for different
 $U_{0}$
and for fixed
 $V_{jet}=0.59~\text{cm}~\text{s}^{-1}$
; (c)
 $v(x)$
for the minimal (
 $V_{jet}=0.37~\text{cm}~\text{s}^{-1}$
) and maximal (
 $V_{jet}=0.82~\text{cm}~\text{s}^{-1}$
) jet bulk speeds and for the minimal (
 $U_{0}=1.09~\text{cm}~\text{s}^{-1}$
) and maximal (
 $U_{0}=2.67~\text{cm}~\text{s}^{-1}$
) crossflow speeds. Error bars at each
 $x$
and each combination of
 $V_{jet}$
and
 $U_{0}$
indicate temporal fluctuations of
 $V_{jet(t)}$
, calculated as a standard deviation of the instantaneous wall-normal jet velocity
 $V_{jet}(t)$
. In order to increase readability, the values of the STDs are premultiplied by a factor of two.

Results from two-dimensional PIV measurements at
 $z=0$
and
 $Re_{D}=310$
showing the streamwise
 $u$
(a–c) and wall-normal
 $v$
(d–f) velocity components and the spanwise vorticity
 $\unicode[STIX]{x1D714}_{z}$
(g–i). The first (a,d,g), second (b,e,h) and third (c,f,i) columns correspond to
 $R=0.29$
,
 $R=0.52$
and
 $R=0.63$
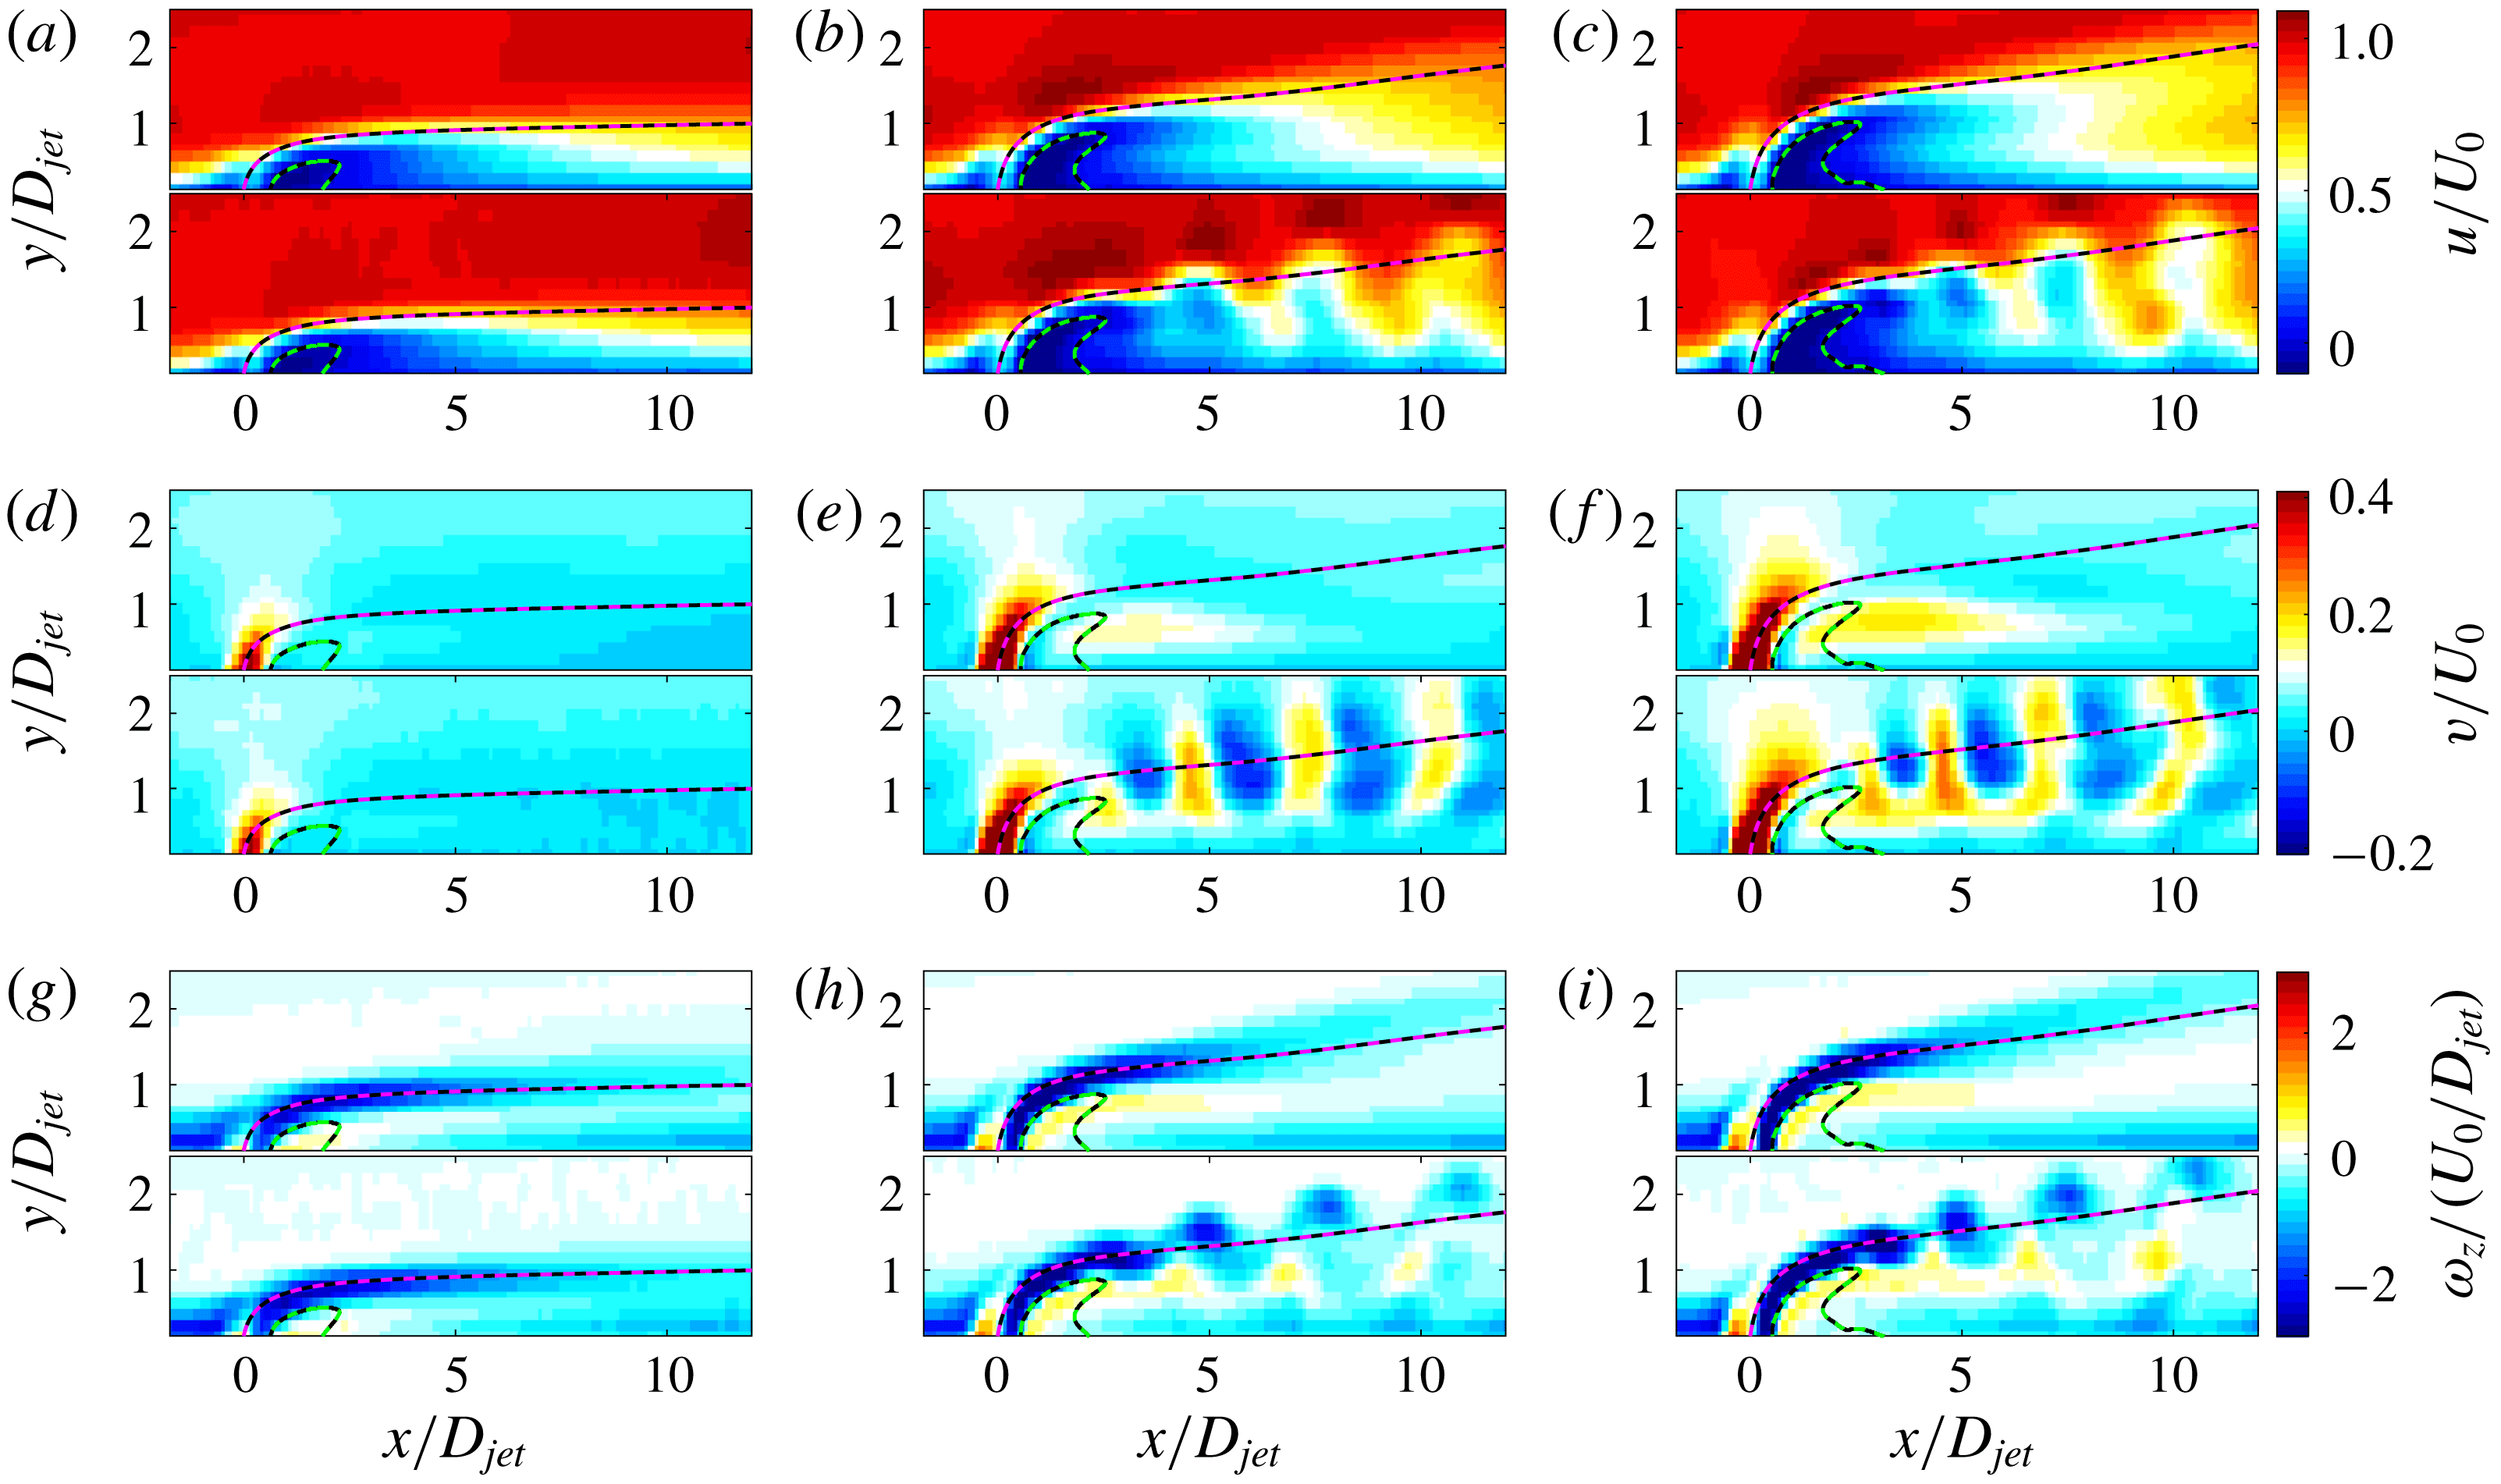
, respectively. Each subplot is composed of the time-averaged (top) and instantaneous (bottom) fields. On each field, the time-averaged centreline trajectory (magenta-black dashed line) and downstream recirculation zone (green-black dashed line) are superimposed.

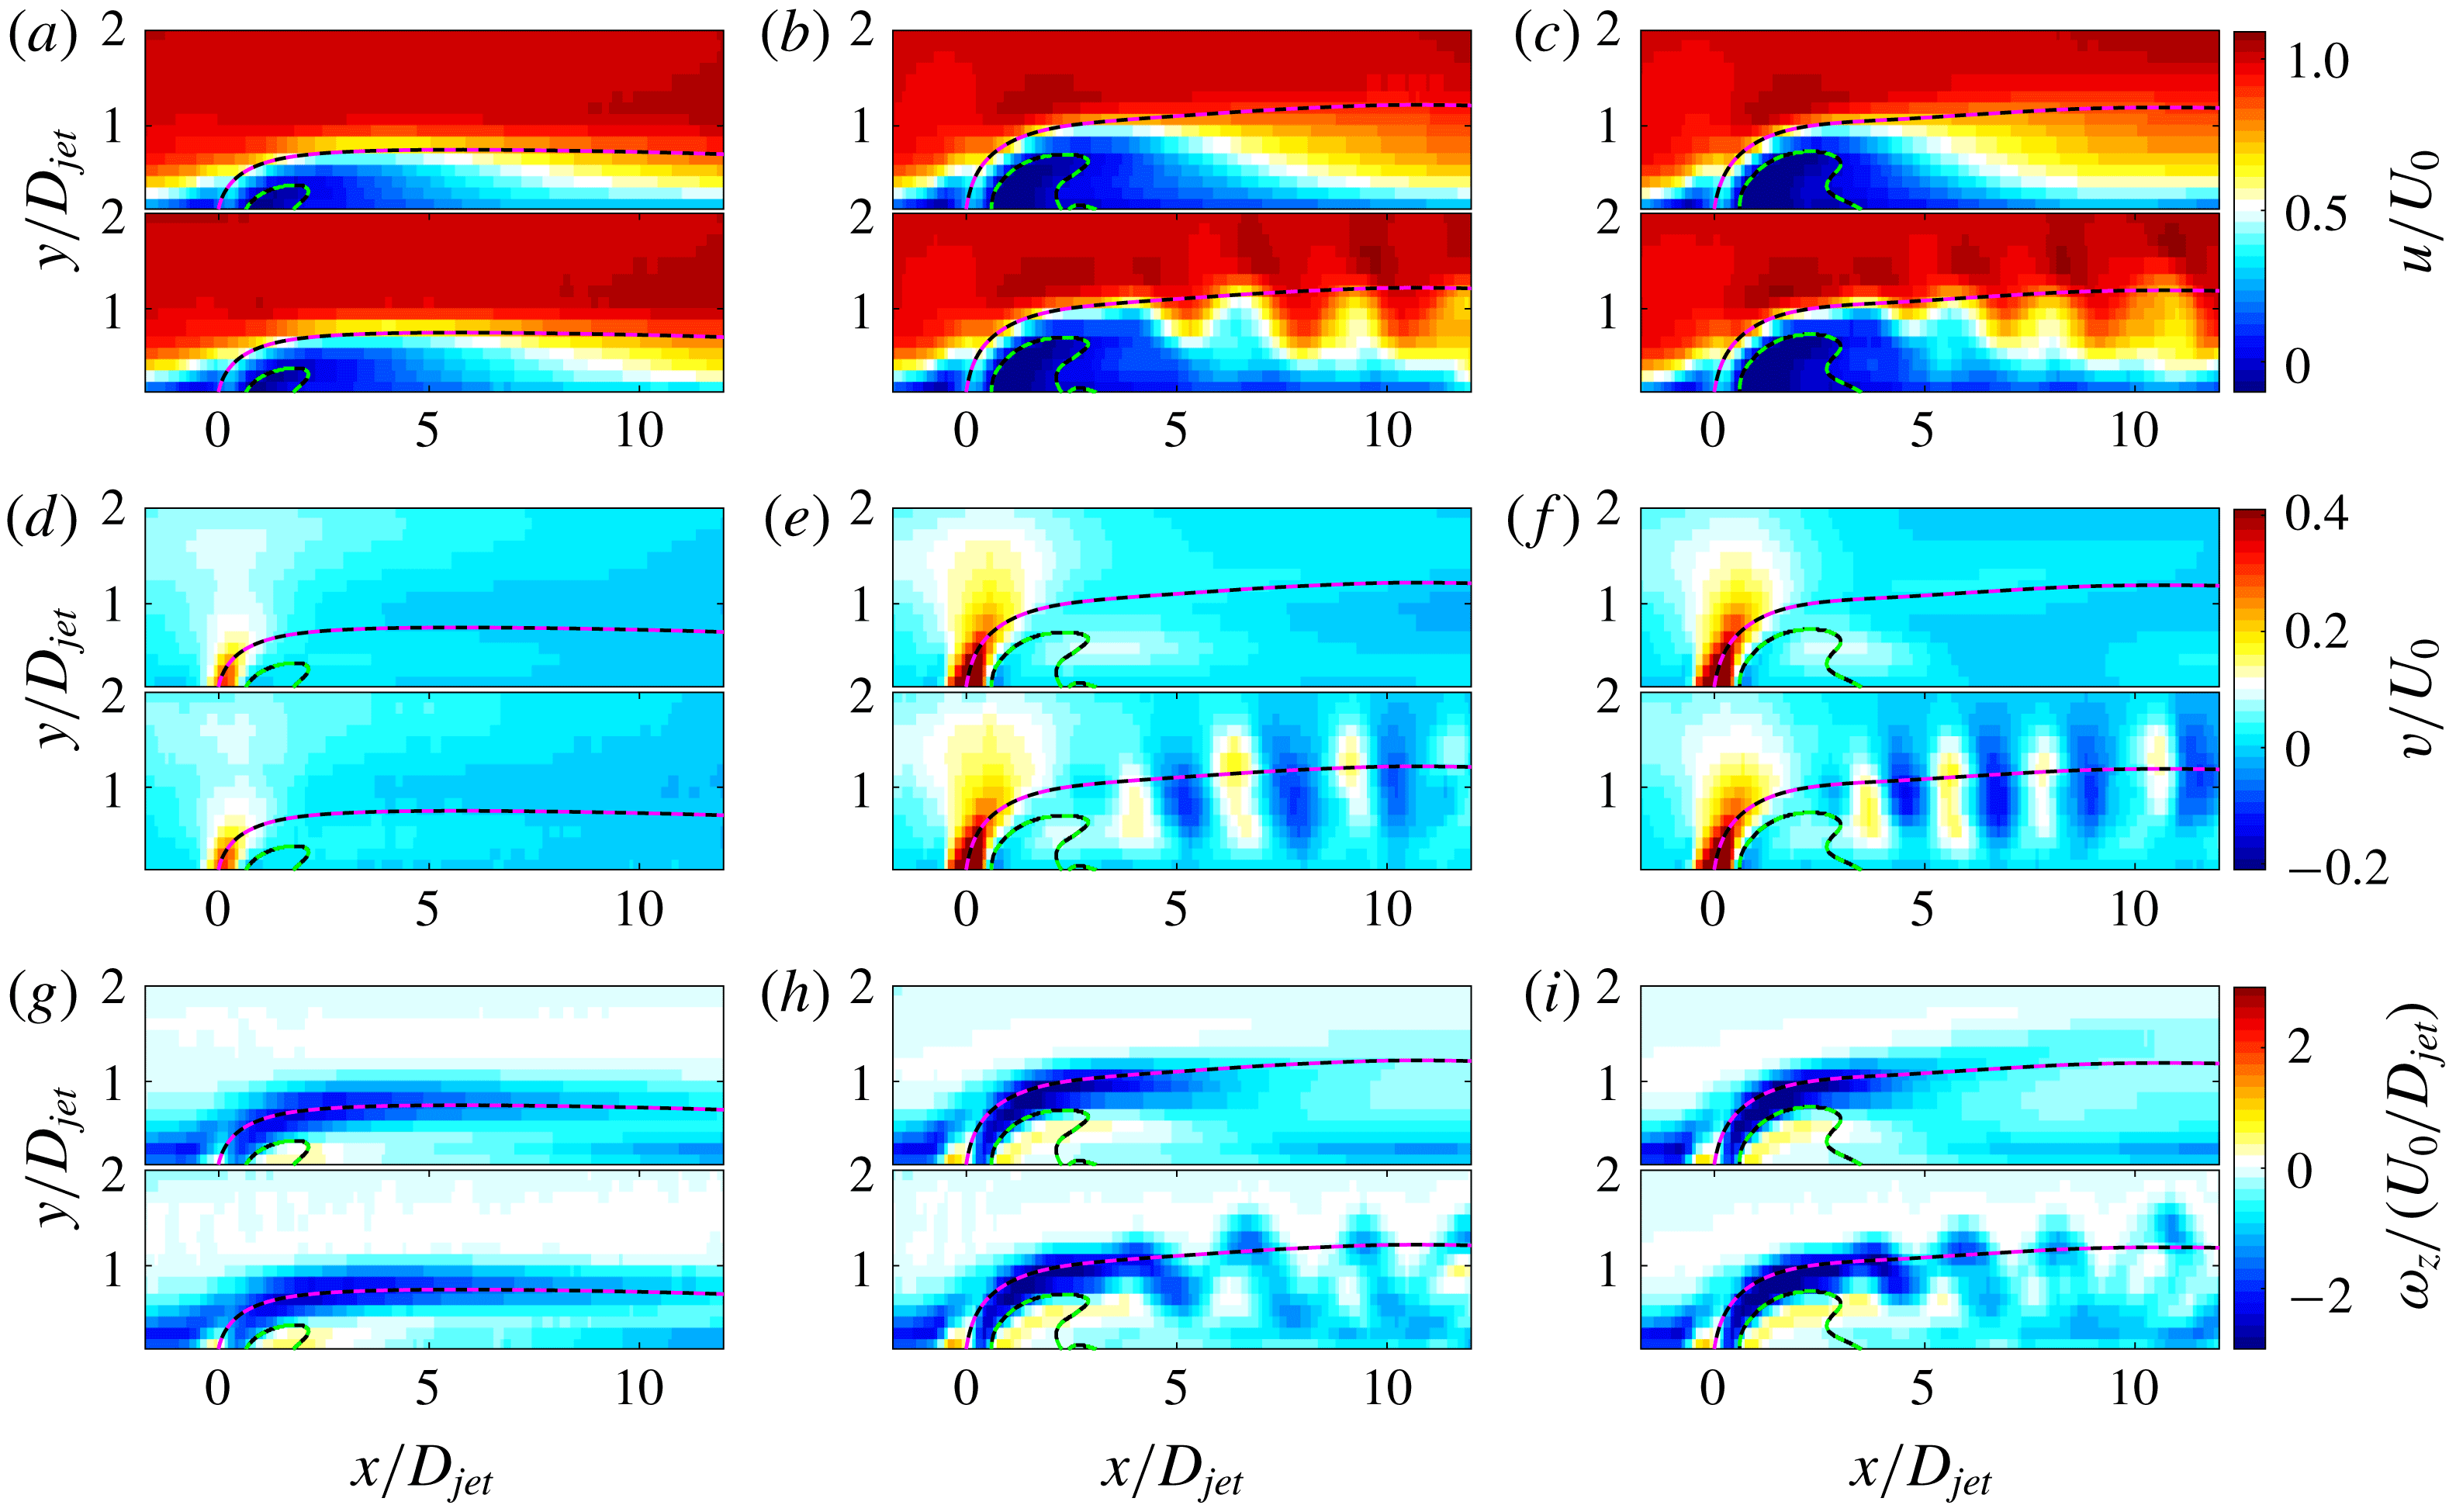
The same as for figure 6 but for
 $Re_{D}=450$
. The first (a,d,g), second (b,e,h) and third (c,f,i) columns correspond to
 $R=0.20$
,
 $R=0.39$
and
 $R=0.44$
, respectively.

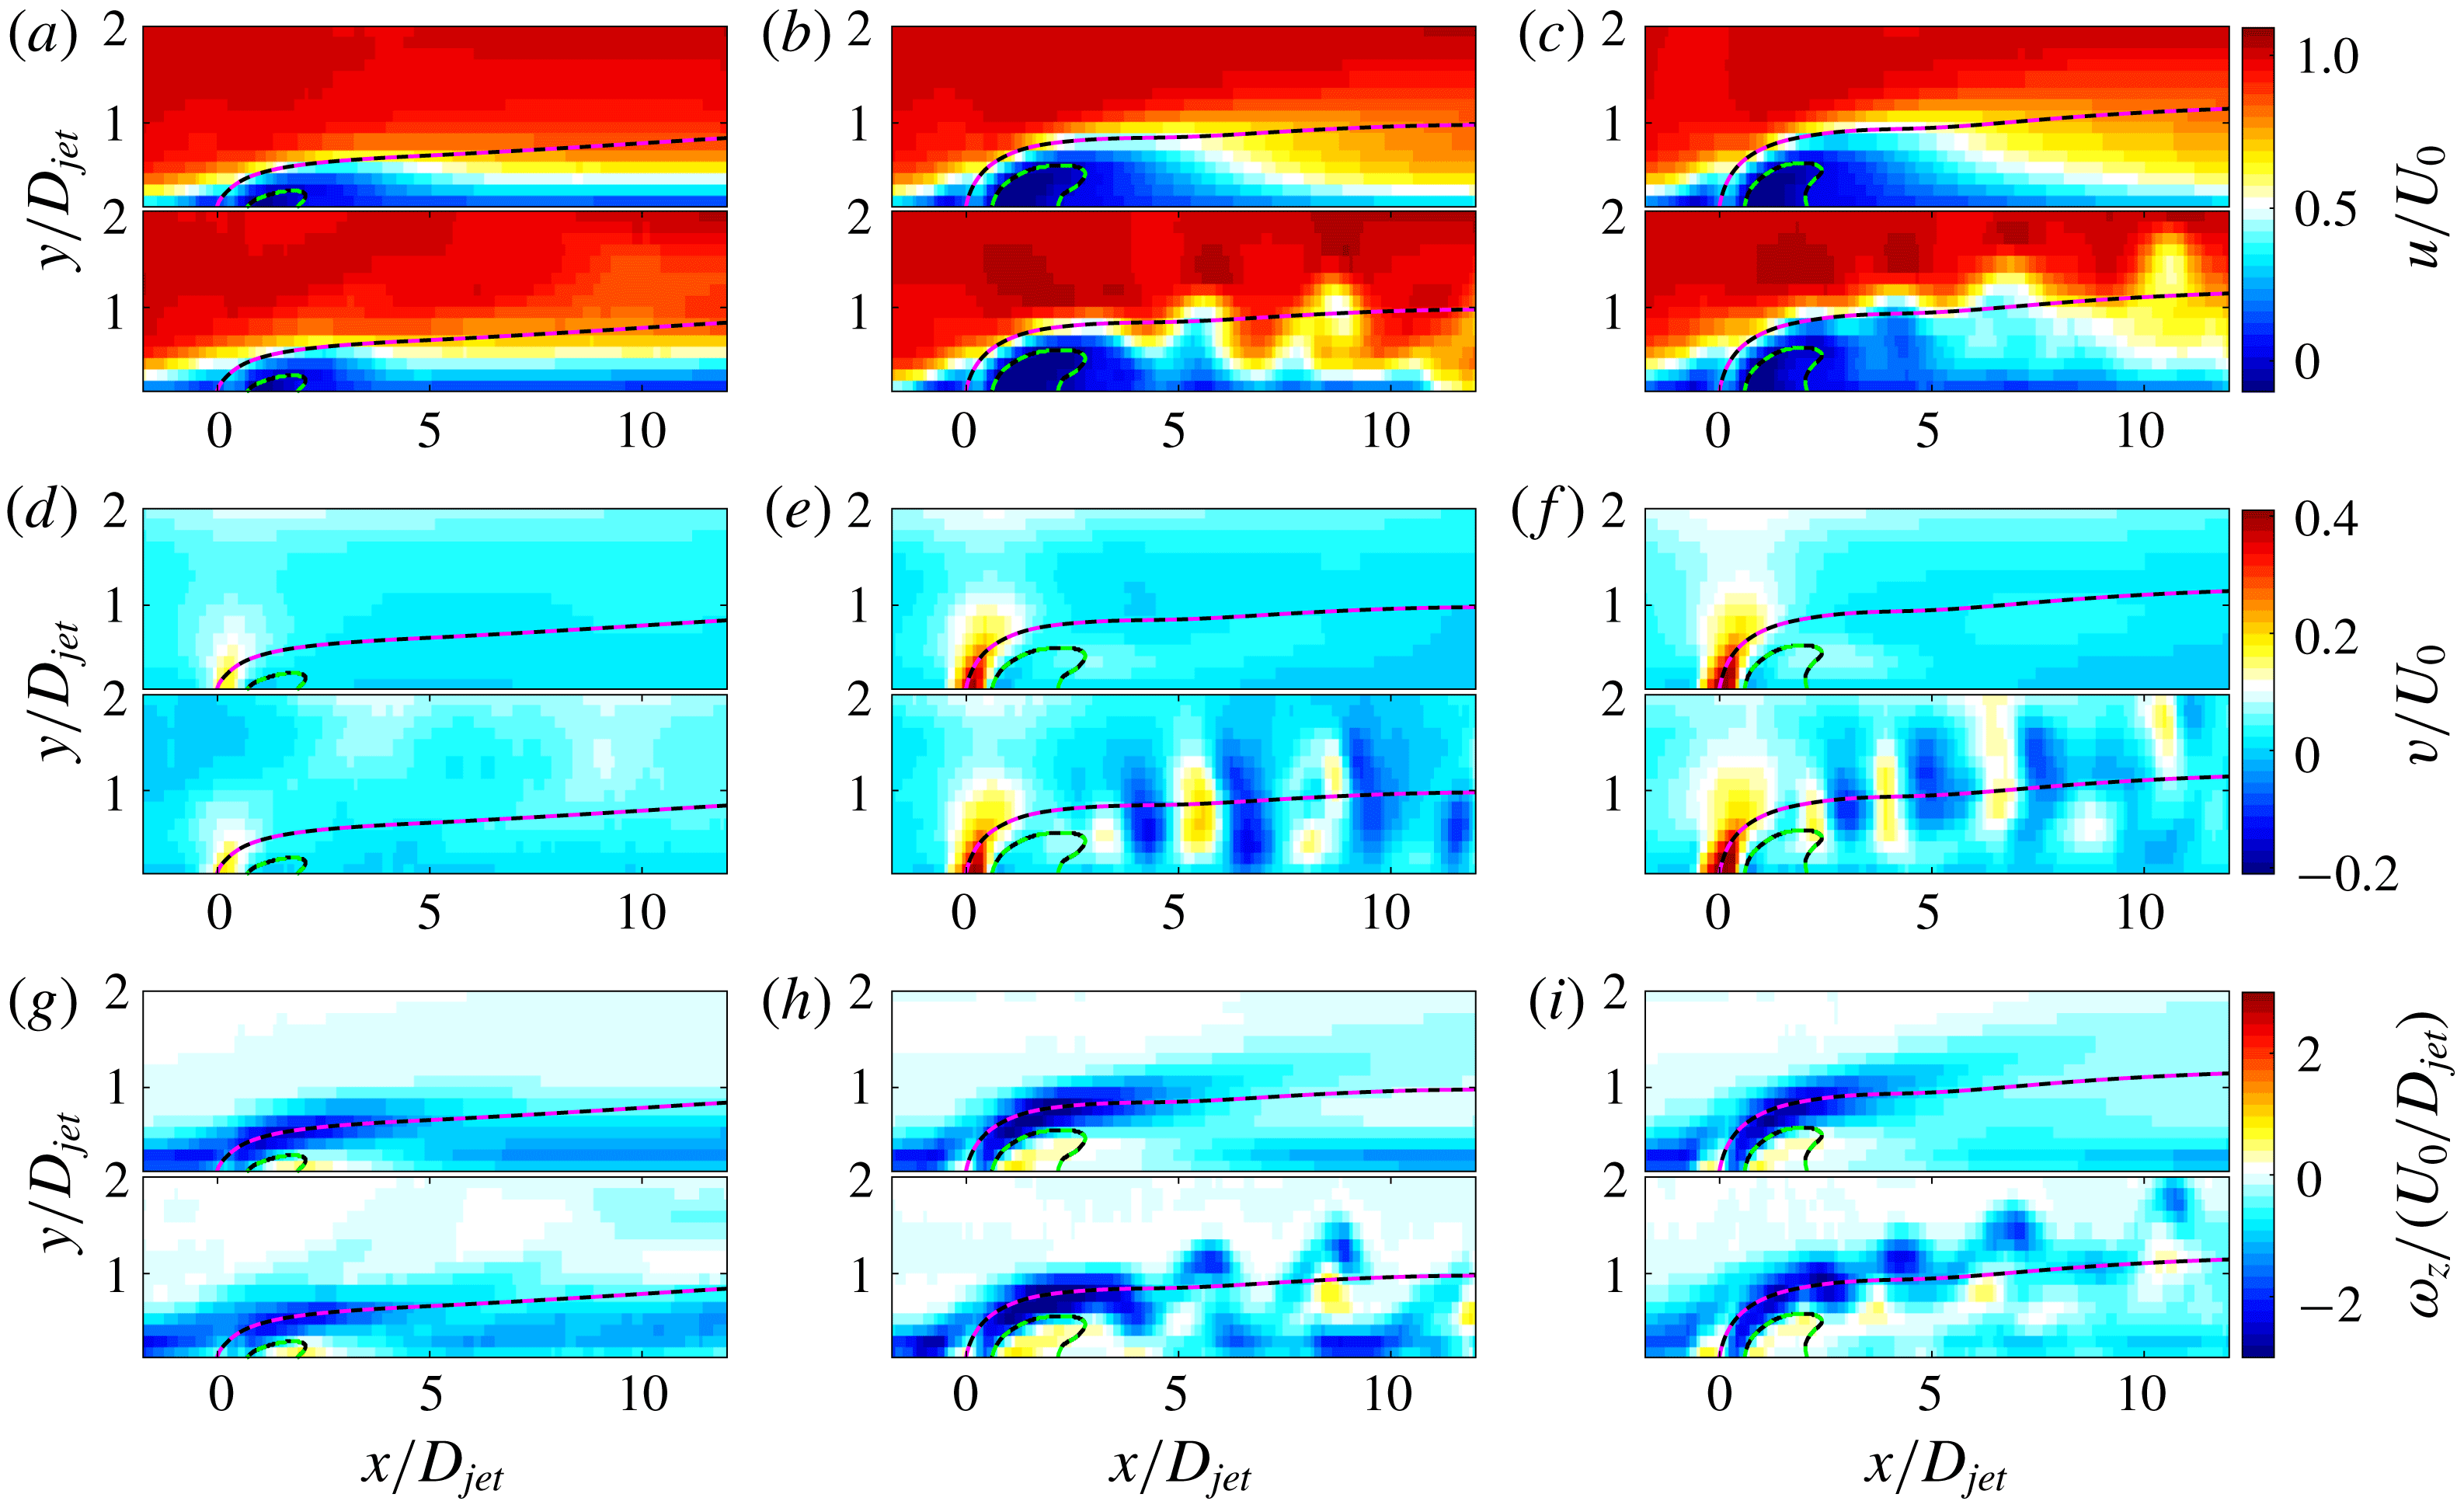
The same as for figure 6 but for
 $Re_{D}=590$
. The first (a,d,g), second (b,e,h) and third (c,f,i) columns correspond to
 $R=0.15$
,
 $R=0.30$
and
 $R=0.34$
, respectively.

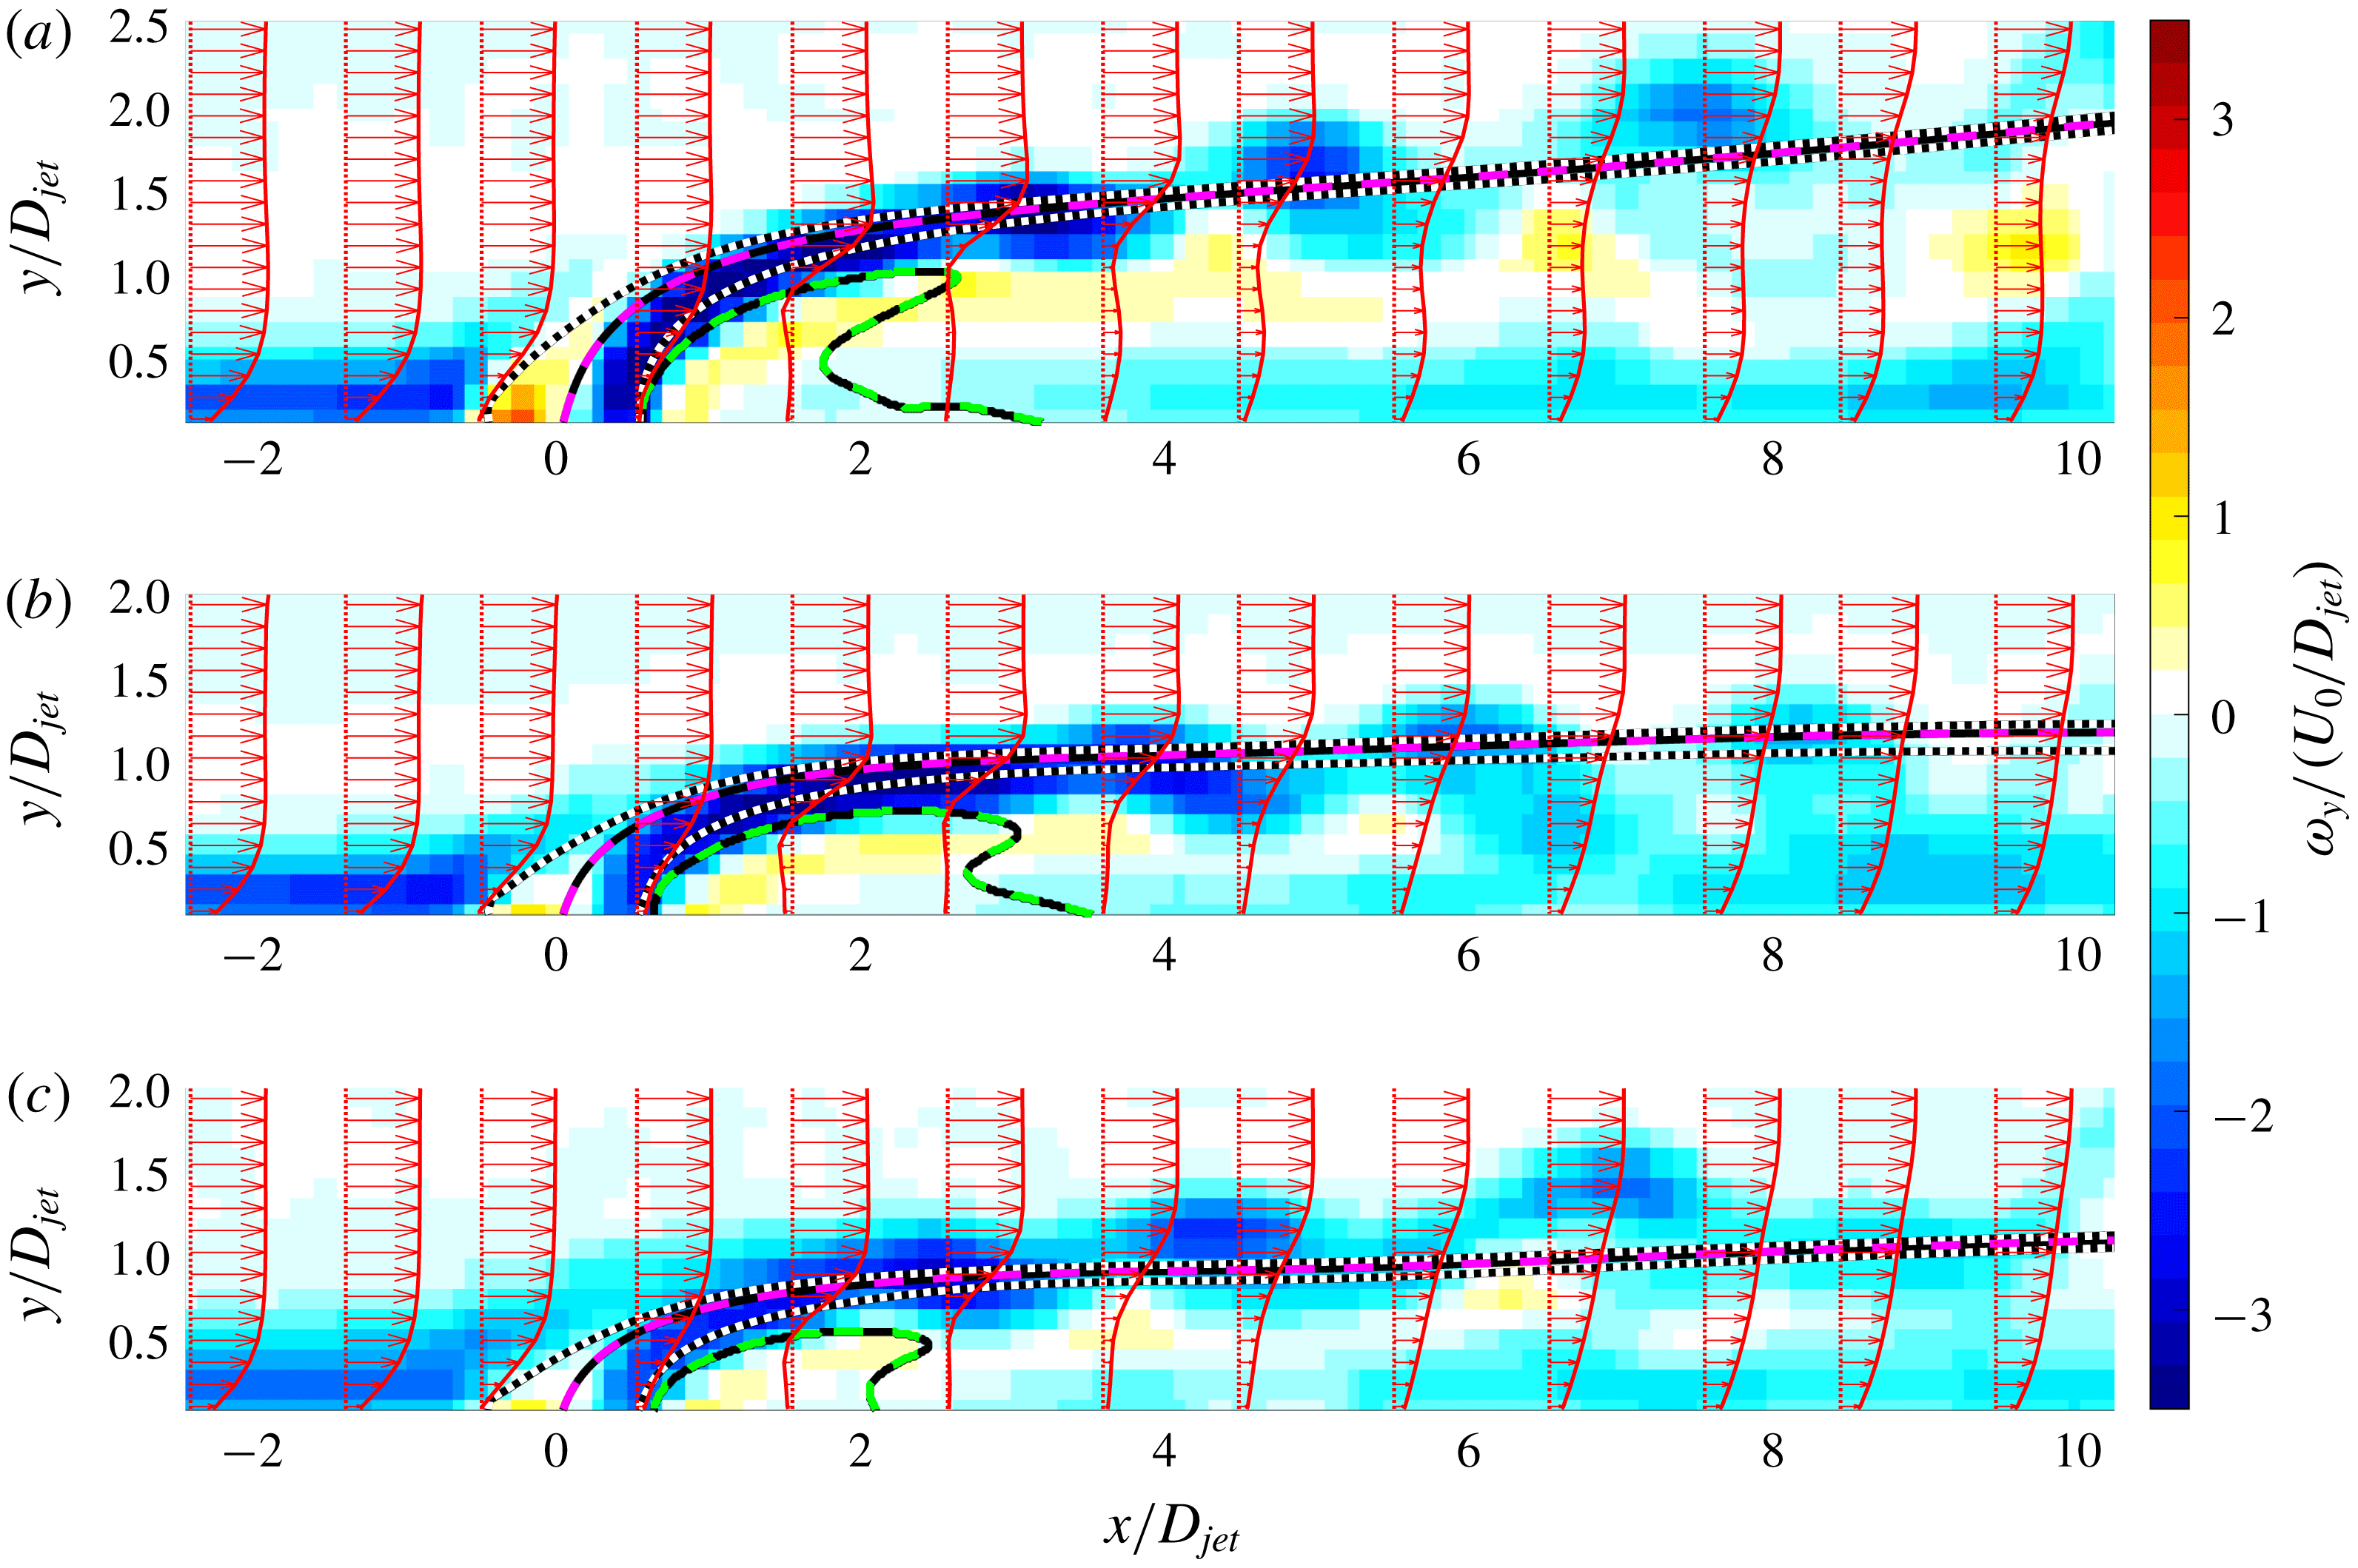
Instantaneous spanwise vorticity fields illustrating hairpin vortices for: (a)
 $R=0.63$
and
 $Re_{D}=310$
; (b)
 $R=0.44$
and
 $Re_{D}=450$
; (c)
 $R=0.34$
and
 $Re_{D}=590$
. Time-averaged streamwise velocity profiles for different streamwise locations are also plotted (red vectors) to illustrate the spatial evolution of the boundary layer and its modification due to the operating jet. The magenta-black dashed curve and the green-black dashed curve represent the time-averaged centreline trajectory and the downstream recirculation zone, respectively. In addition, the trajectories emanating from the upstream (
 $x/D_{jet}=-0.5$
) and downstream jet shear layers (
 $x/D_{jet}=0.5$
) are plotted as the black-white dotted curves.

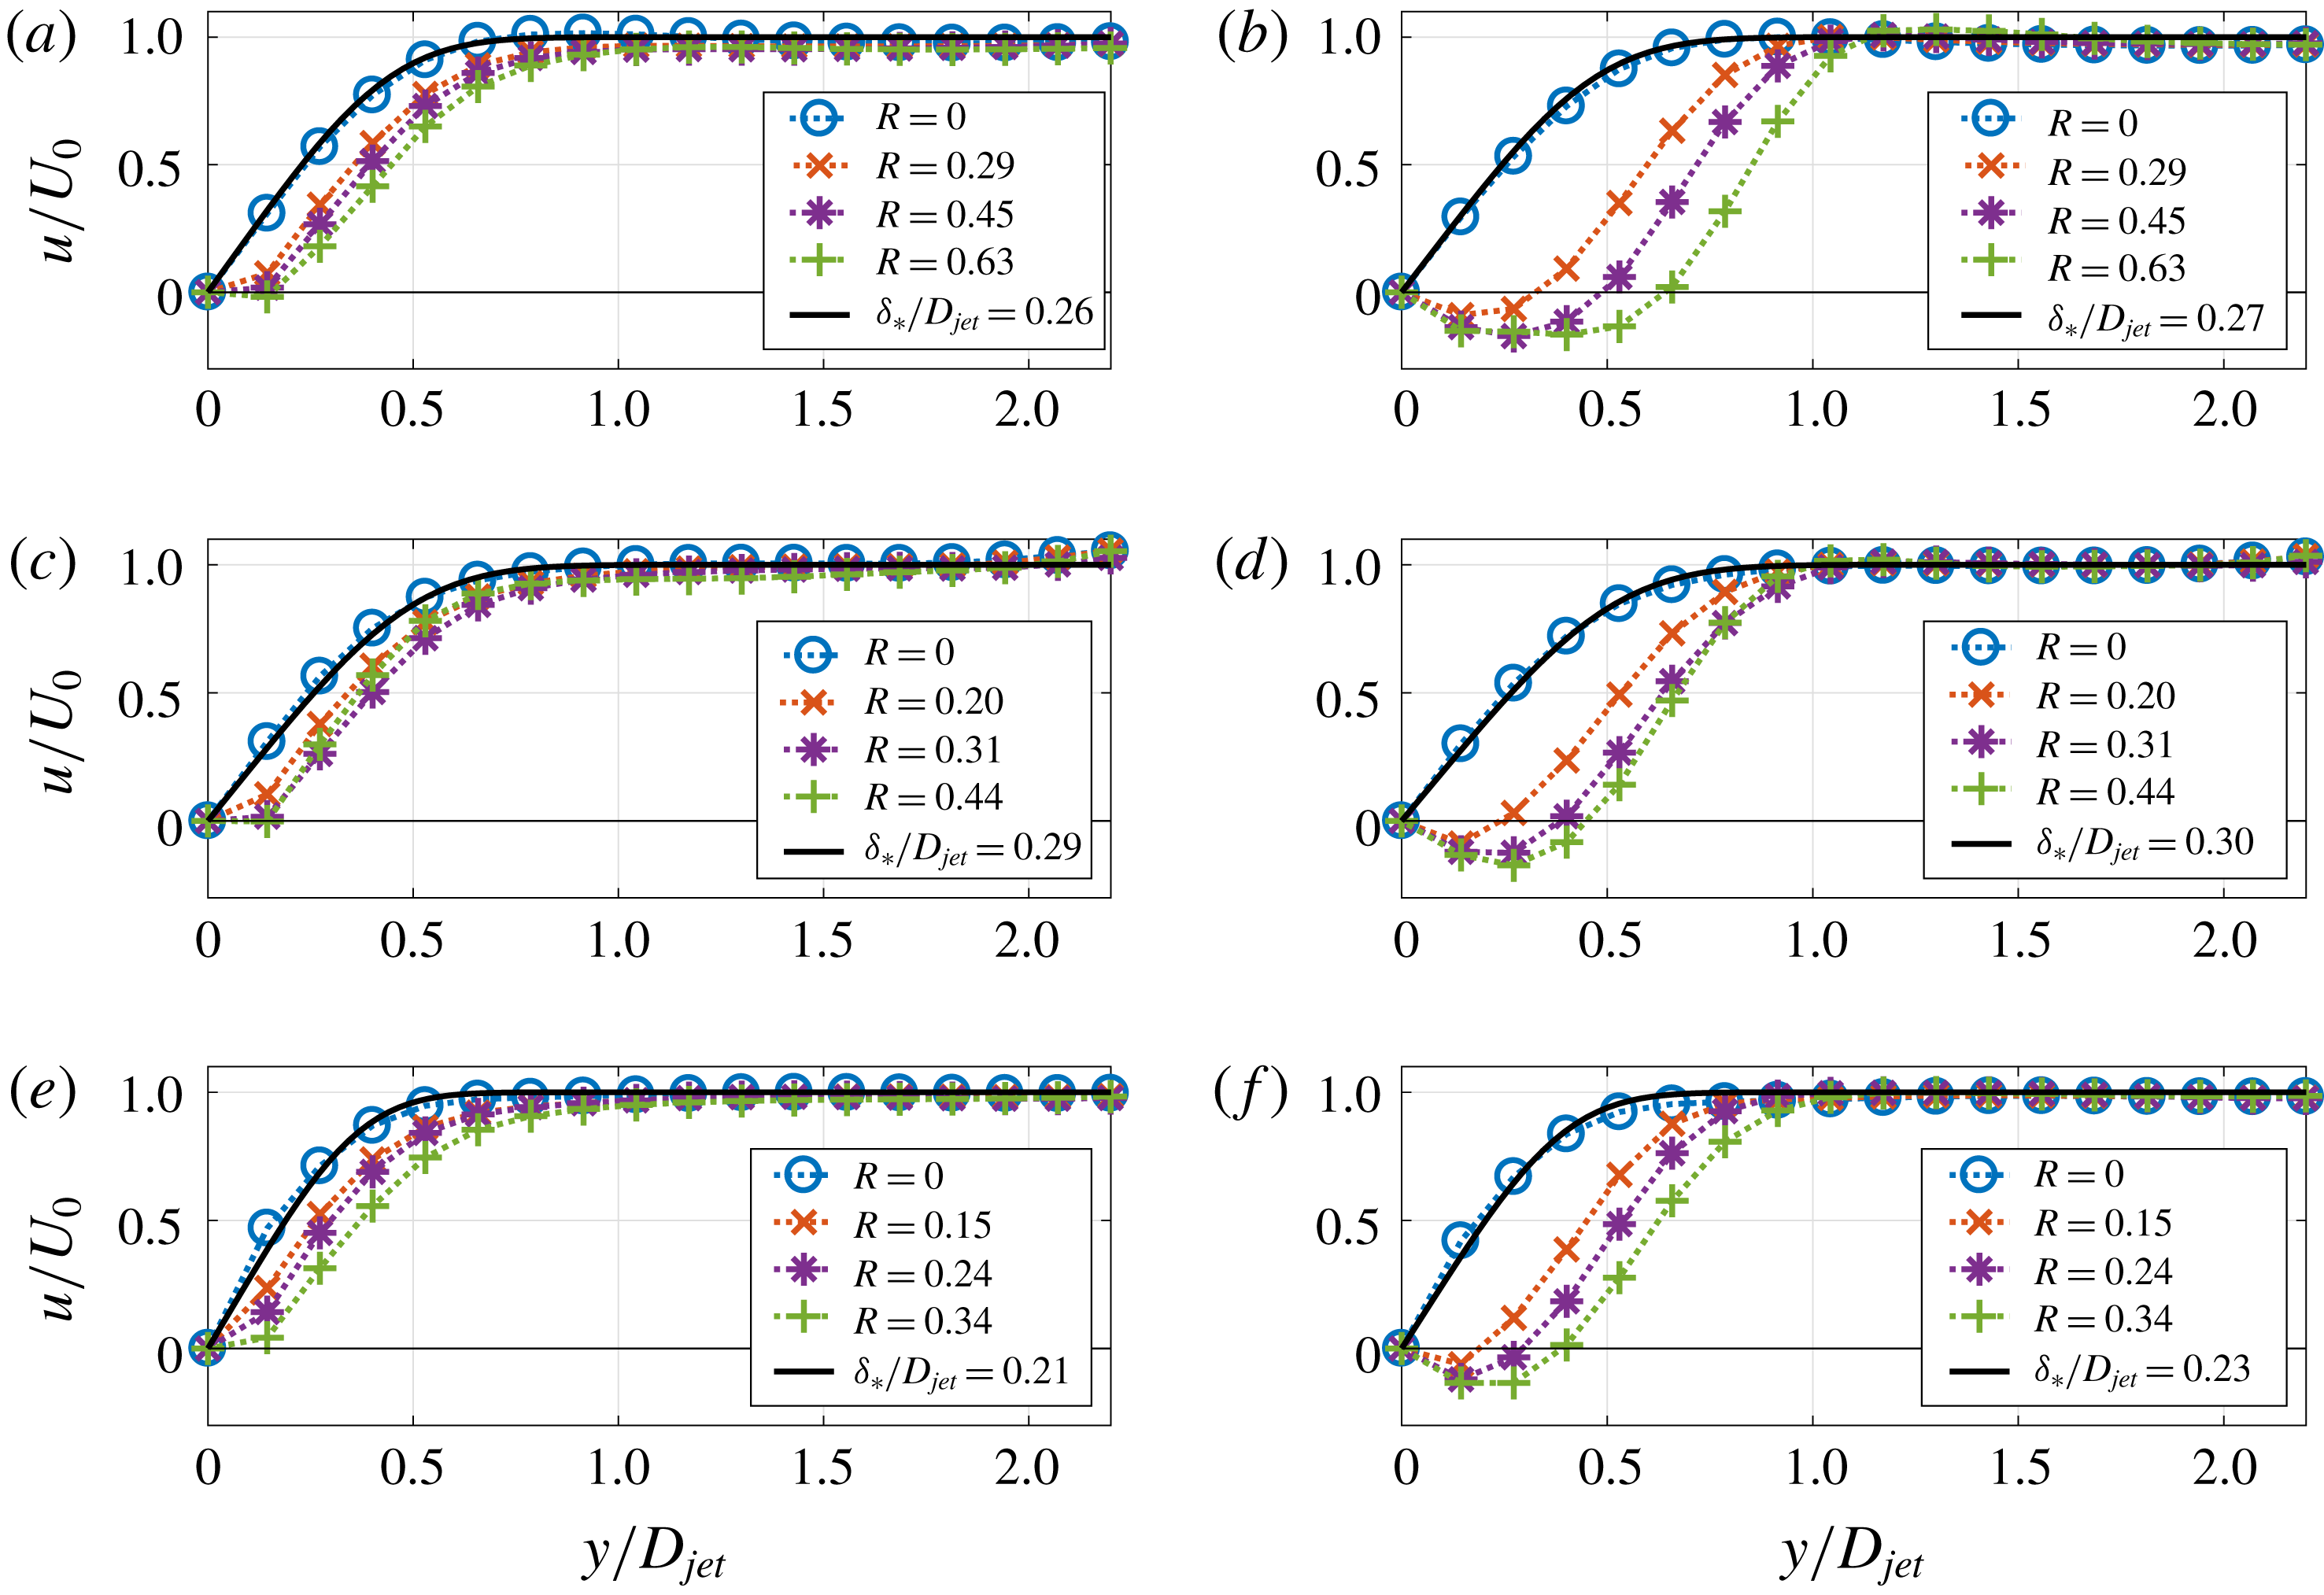
Time-averaged streamwise velocity profiles
 $u(y)$
along the wall-normal direction measured at
 $x/D_{jet}=-0.7$
(a,c,e) and
 $x/D_{jet}=0.9$
(b,d,f). The first, second and third rows correspond to
 $Re_{D}=310$
,
 $Re_{D}=450$
and
 $Re_{D}=590$
, respectively. For each velocity profile, the corresponding value of velocity ratio
 $R$
is indicated in the legend. The streamwise velocity profile
 $U(y)$
of the base flow without jet perturbation (
 $R=0$
, blue circles) is also compared with the theoretical solution of the laminar Blassius boundary layer (thick black curve). The displacement thickness of the boundary layer (
 $\unicode[STIX]{x1D6FF}_{\ast }/D_{jet}$
) for each case is indicated in the legend.

The first (a–c), second (d–f) and third (g–i) rows in figure 6 represent the streamwise (
 $u$
) and wall-normal (
 $v$
) velocity components and spanwise vorticity (
 $\unicode[STIX]{x1D714}_{z}$
), left to right. The measurements were carried out for
 $Re_{D}=310$
and for
 $R=0.29,0.52,0.63$
. Each subplot is composed of the time-averaged (top) and instantaneous (bottom) flow fields. The spatial evolutions of
 $u$
,
 $v$
and
 $\unicode[STIX]{x1D714}_{z}$
of the flow field in the first column (
 $R=0.29$
, figure 6
a,d,g) is characterized by slow variation along the streamwise direction and no self-sustained oscillations can be observed. In contrast, for
 $R=0.52$
(figure 6
b,e,h) and
 $R=0.63$
(figure 6
c,f,i), distinct periodic fluctuations of
 $u$
,
 $v$
and
 $\unicode[STIX]{x1D714}_{z}$
can be observed in the downstream near field of the JICF (
 $0<x/D_{jet}<10$
), which is a signature of shedding of the hairpin vortices. In figures 7 and 8 a similar transition is presented for
 $Re_{D}=450$
and
 $Re_{D}=590$
. However, when the crossflow Reynolds number is increased to
 $Re_{D}=590$
, the coherence of the hairpin structure slightly decreases due to the increase of base flow fluctuations. In figures 6–8 we superimpose the centreline trajectory (the streamline starting at
 $x=0,y=0$
represented by a magenta-black dashed curve) derived from time-averaged velocity fields and the downstream recirculation zone (represented by a green-black dashed curve at which
 $\langle u\rangle _{t}=0$
). This recirculation zone is also present as an instantaneous flow feature, in agreement with the numerical simulations of Schlatter, Bagheri & Henningson (Reference Schlatter, Bagheri and Henningson2011). The downstream near-field (
 $0<x/D_{jet}<10$
) of the JICF is dominated by negative spanwise vorticity
 $\unicode[STIX]{x1D714}_{z}<0$
, which is of the same sign as the vorticity emanating from the downstream jet shear layer. This observation holds for the entire parameter space range considered here and is consistent with the numerical results of Sau & Mahesh (Reference Sau and Mahesh2008) and Ilak et al. (Reference Ilak, Schlatter, Bagheri and Henningson2012).
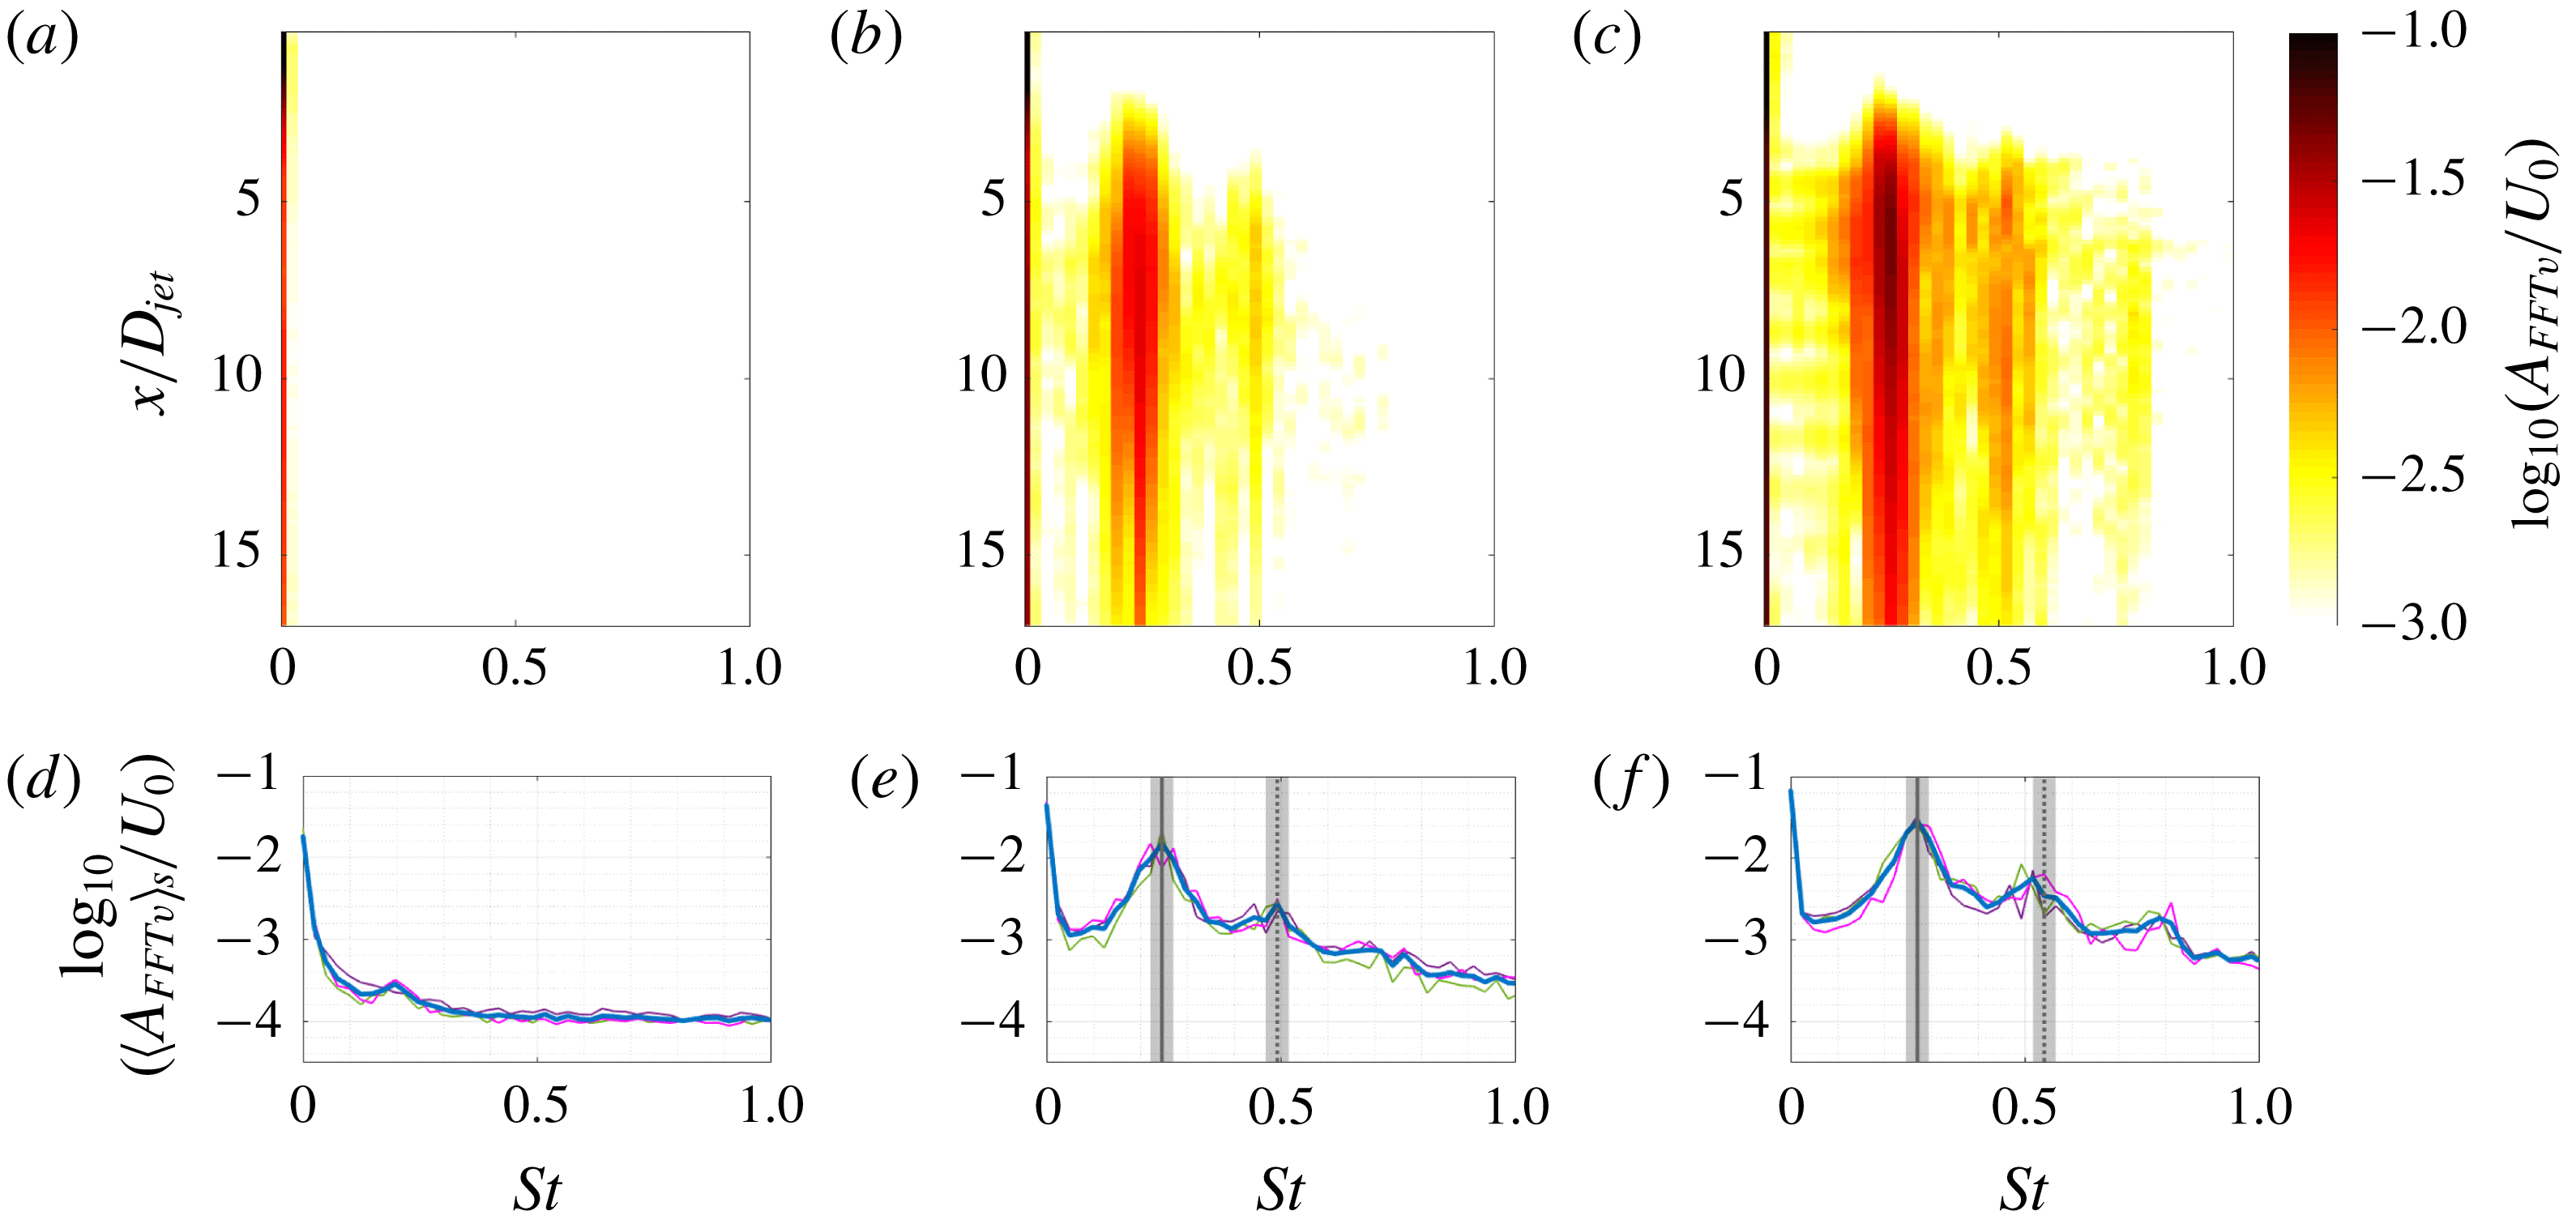
Ensemble-averaged FFT spectra of wall-normal velocity
 $v/U_{0}$
along the centreline trajectory for
 $Re_{D}=310$
and (a)
 $R=0.29$
, (b)
 $R=0.48$
, and (c)
 $R=0.63$
; the same FFT spectra averaged along
 $s$
(thick blue line in d–f) supplemented with similar spectra computed for three different realizations separately (thin dashed-dotted magenta, green and violet lines). All plots are in semi-logarithmic scale and each column corresponds to the same
 $R$
; the fundamental frequency of hairpin shedding (
 $f_{HS}$
) and its first harmonic (
 $2f_{HS}$
) are indicated by solid and dashed vertical grey lines, respectively. Shaded regions indicate the interval that corresponds to the double of the spectral resolution of the FFT transform.

Both time-averaged (top) and instantaneous (bottom) fields shown in figures 6–8 are similar in the vicinity of the jet orifice. We did not observe any specific dynamics of the separated flow in the jet pipe, as reported by Kelso & Smits (Reference Kelso and Smits1995), Bidan & Nikitopoulos (Reference Bidan and Nikitopoulos2013), which may be due to the fact that our value of crossflow Reynolds number is lower when compared to Kelso & Smits (Reference Kelso and Smits1995) (
 $Re_{D}>1200$
) and Bidan & Nikitopoulos (Reference Bidan and Nikitopoulos2013) (
 $Re_{D}\simeq 2700$
). The only observed influence of the crossflow on the jet close to the jet orifice in our study is the deflection of the jet profile such that the maximal wall-normal velocity component of the jet is reached slightly downstream with respect to the jet centre, as shown in figure 5. Moreover, we did not measure any roll-up of the upstream jet shear layer as reported by Getsinger et al. (Reference Getsinger, Gevorkyan, Smith and Karagozian2014) and Gevorkyan et al. (Reference Gevorkyan, Shoji, Peng and Karagozian2018), who considered a much higher jet Reynolds number (
 $Re_{jet}=1900$
).
In order to better understand the structure of hairpin vortices we plot the spatial evolution of the time-averaged streamwise velocity profiles superimposed on the instantaneous spanwise vorticity field for
 $R\neq 0$
and
 $Re_{D}=310,450,590$
(figure 9). We also superimpose a time-averaged recirculation zone (green-black dashed curve) and three different trajectories starting at
 $x/D_{jet}=0$
(magenta-black dashed curve) and at
 $x/D_{jet}=-0.5,0.5$
(black-white dotted curves). The boundary layer separates downstream from the issuing jet and forms a distinct recirculation zone. Further downstream, the recirculation zone hairpin vortices are formed. These vortical structures are composed mainly of the negative spanwise vorticity (
 $\unicode[STIX]{x1D714}_{z}<0$
) located close to the centreline trajectory. However, the signature of hairpin vortices also composes of some weaker patches of positive spanwise vorticity (
 $\unicode[STIX]{x1D714}_{z}>0$
) located below the centreline trajectory, which originates from the downstream wake formed by the issuing jet. To evaluate the influence of the jet perturbation on the boundary layer, we plot the time-averaged streamwise velocity profiles along the wall-normal direction and in the vicinity of the upstream (
 $x/D_{jet}=-0.6$
, first column in figure 10) and the downstream (
 $x/D_{jet}=0.9$
, second column in figure 10) edges of the jet orifice for three different crossflow Reynolds numbers (
 $Re_{D}=310,$
first row;
 $Re_{D}=450$
, second row; and
 $Re_{D}=590,$
third row) in figure 10. On each subplot of figure 10 the undisturbed laminar boundary layer, without jet perturbation (
 $R=0$
), is represented by blue circles. These undisturbed velocity profiles are also compared with the theoretical solution of the laminar Blassius boundary layer (thick black curves). The wall-normal coordinate of the theoretical profiles is re-scaled with
 $\unicode[STIX]{x1D6FF}_{\ast }/D_{jet}$
, where
 $\unicode[STIX]{x1D6FF}_{\ast }$
is the displacement thickness calculated for undisturbed streamwise velocity profiles measured experimentally. In addition, for each combination of spatial location and crossflow Reynolds number, we plot the streamwise velocity profile for three different velocity ratios, the specific values of which can be found in the legend of figure 10. In all cases the boundary layer thickness, as well as the size of the downstream recirculation zone in the wall-normal direction, increase monotonically with
 $R$
.
4 Spectral analysis
To characterise hairpin shedding instability, we calculate the one-dimensional FFT of the time evolution of the wall-normal velocity component
 $v/U_{0}$
. We separately analyze each spatial location within our measurement region and each set of measurements. Then, for each combination of
 $R$
and
 $Re_{D},$
we ensemble-average the spectra over three realizations. In figures 11–13 we present the results for
 $Re_{D}=310,450,590$
. The ordinate corresponds to the streamwise coordinate of the jet centreline trajectory and the abscissa represents the Strouhal number
 $St=fD_{jet}/U_{0}$
. When
 $R$
is sufficiently large, distinct single-tone oscillations with fundamental frequency and higher harmonics can be clearly distinguished (figures 11
b,c–13
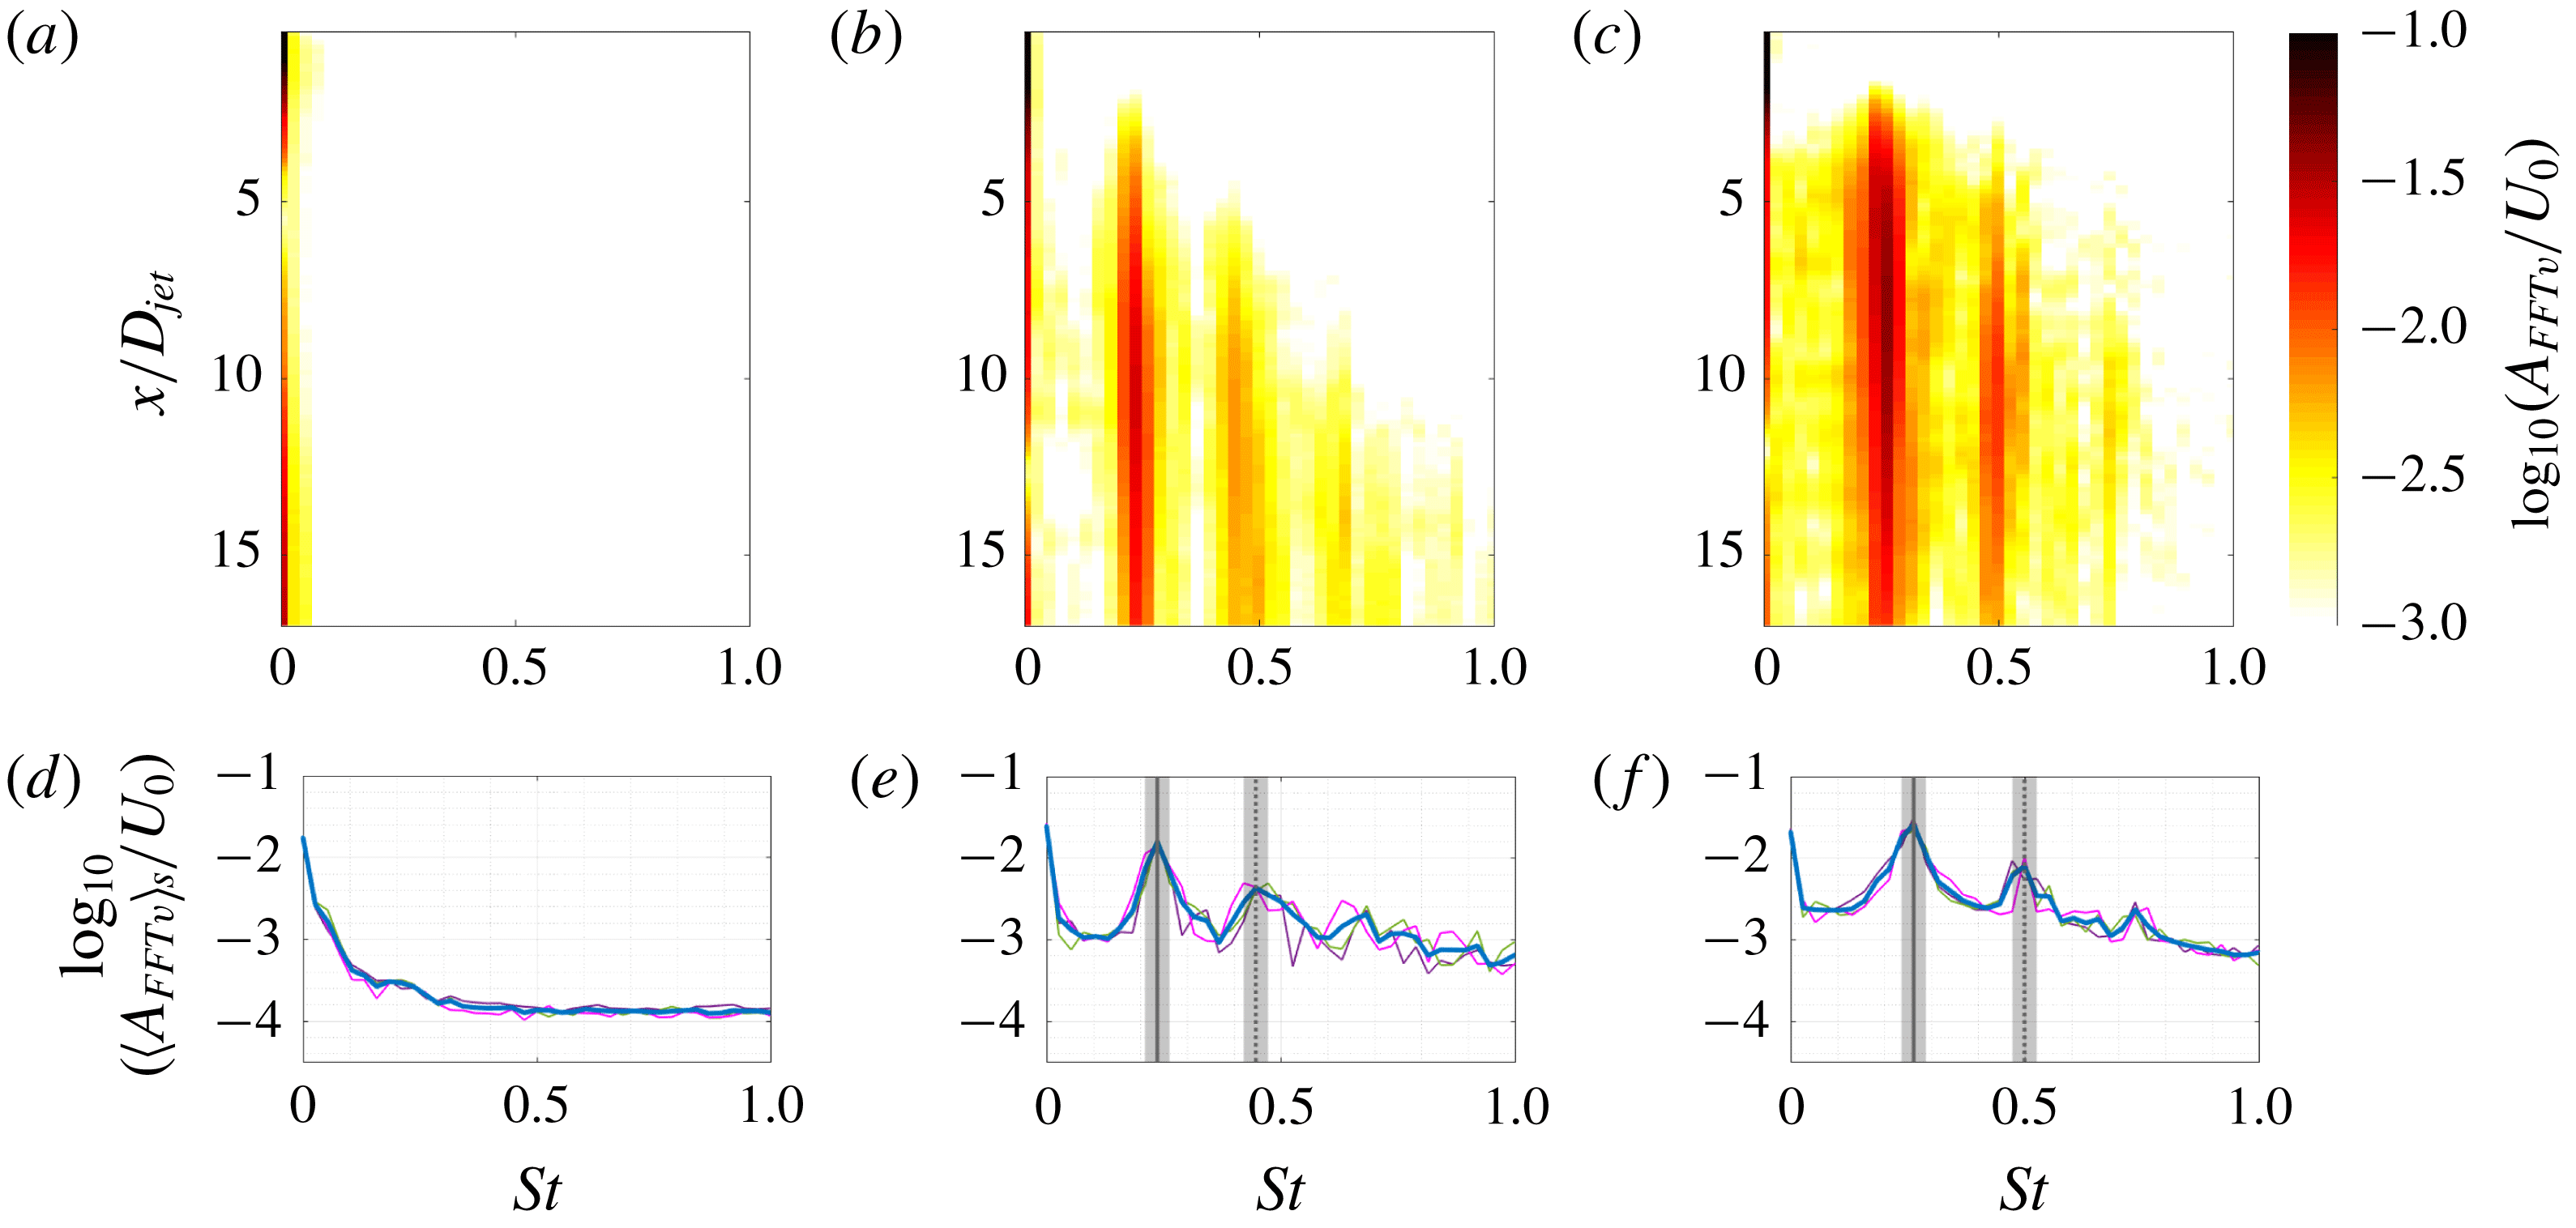
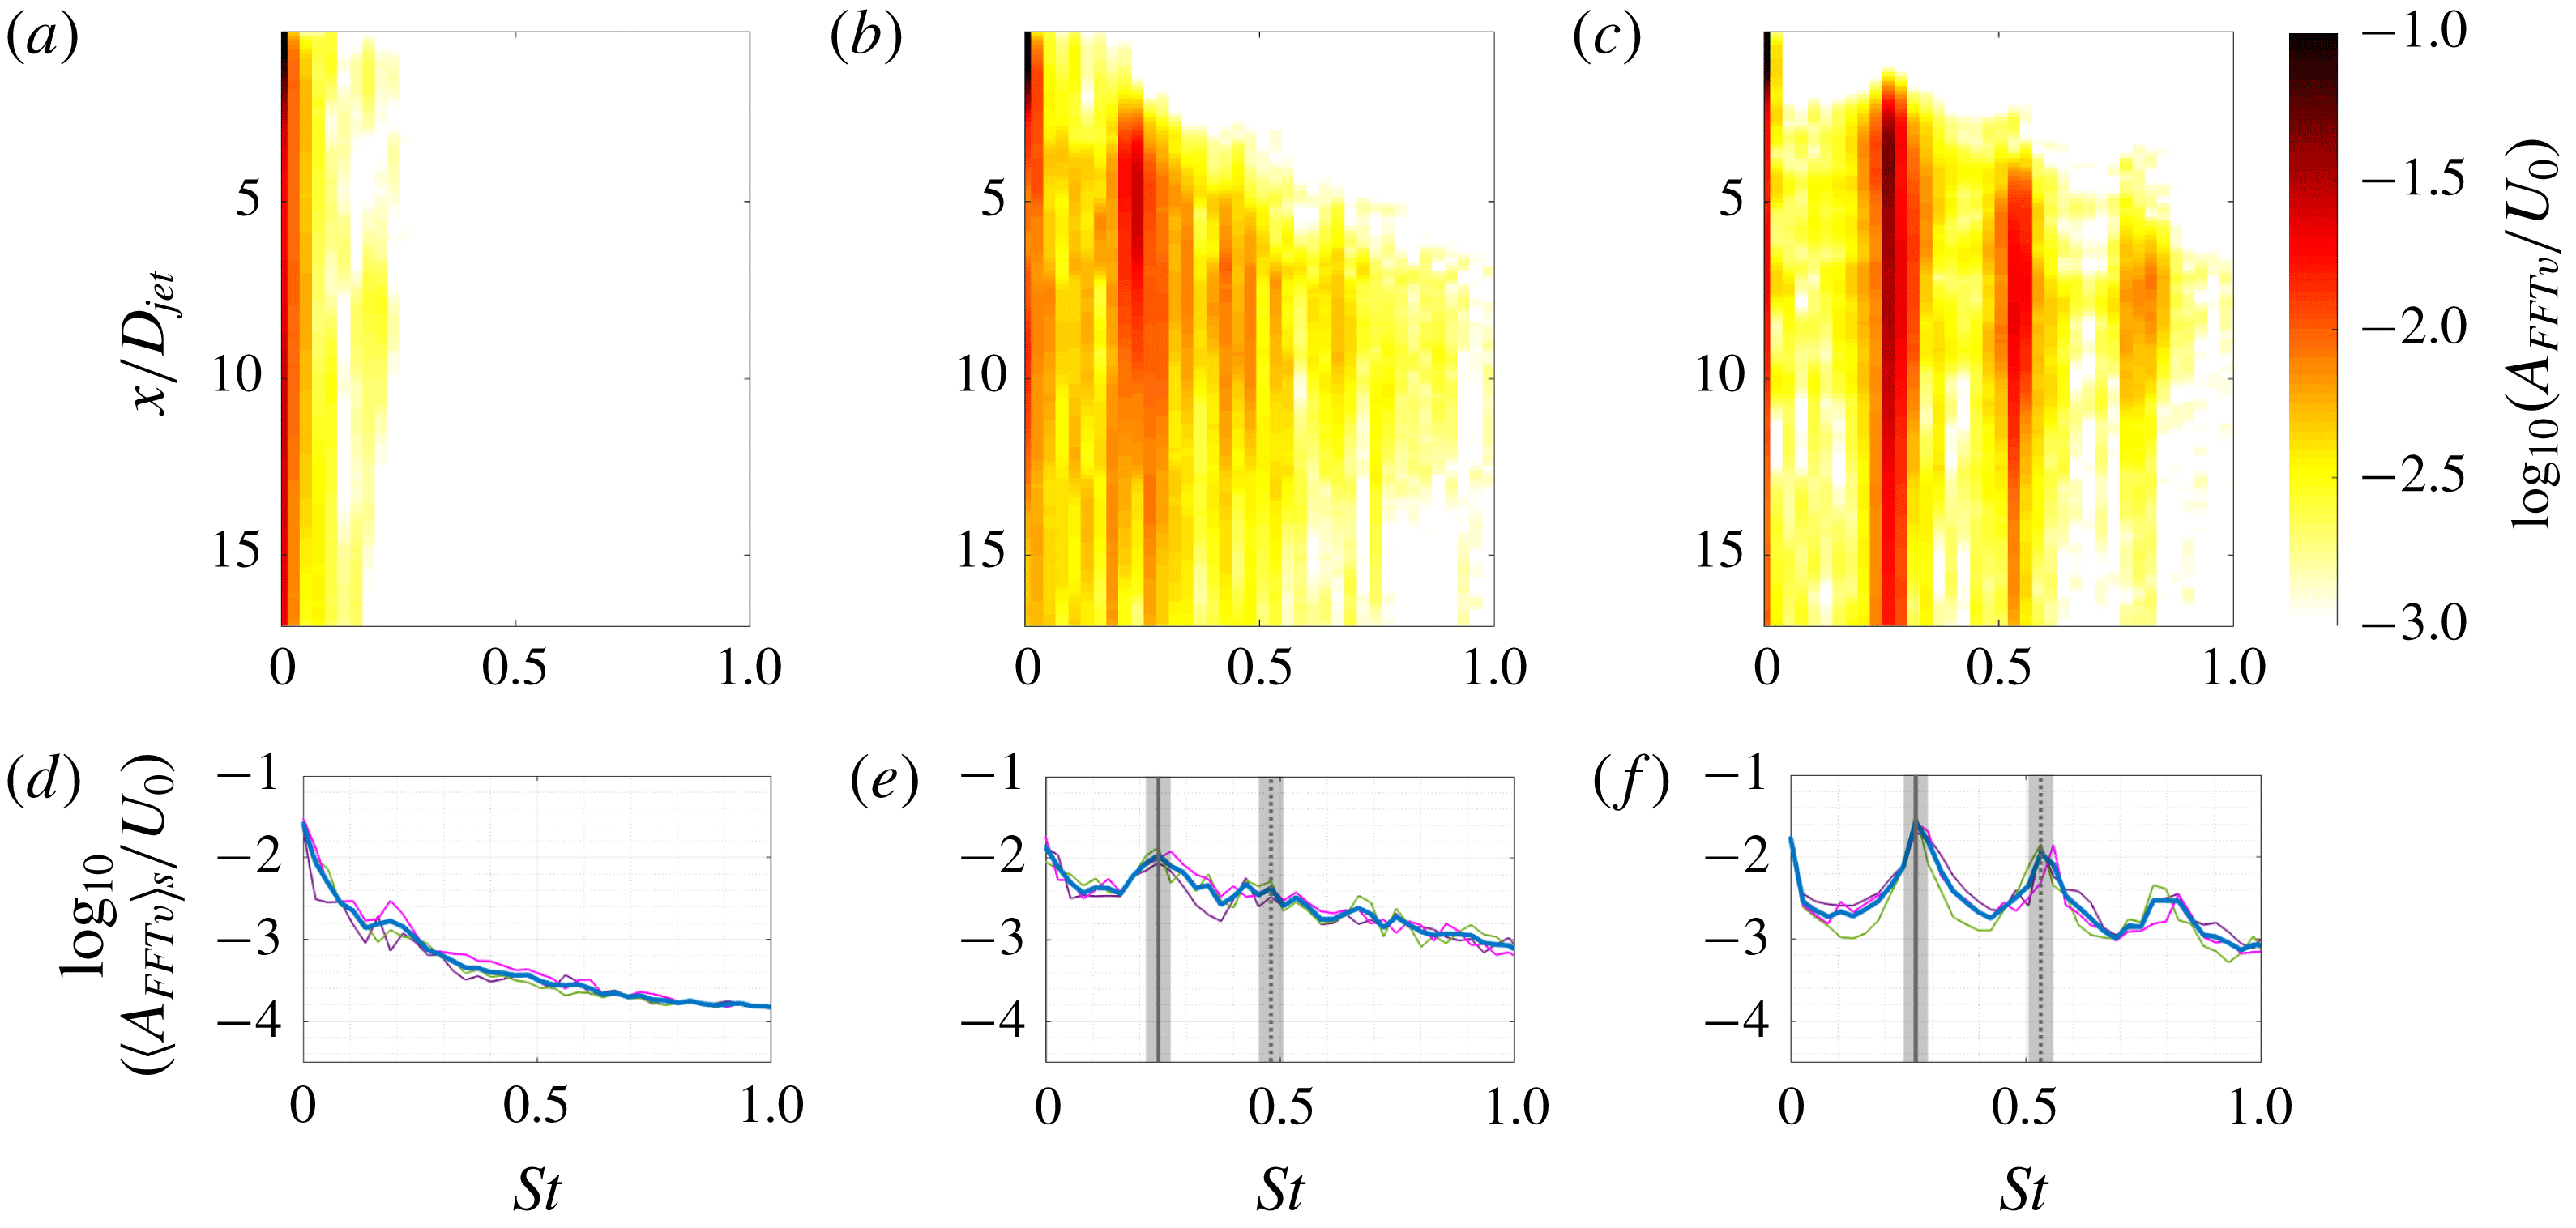
b,c), which is a signature of self-sustained oscillations of hairpin shedding vortices. Hairpins are generated at some distance from the jet orifice, and once formed, the spectral behaviour does not change along centreline trajectory, showing a global mode structure. For comparison, in figures 11(a)–13(a) we show the spectra for the flow condition at which the distinct, self-sustained hairpin shedding was not observed.
To complete our analysis, we averaged each spectrum (shown in the top rows of figures 11–13) over the centreline trajectory, plotting the results as a thick blue curve in the bottom rows. Individual realizations (shown as thin dashed–dotted magenta, green and violet lines in the bottom rows of figures 11–13) and ensemble-averaged spectra overlap, as expected. We indicate the spectral peaks that correspond to the hairpin shedding frequency
 $St_{HS}=f_{HS}D_{jet}/U_{0}$
and its first harmonic
 $2St_{HS}$
with vertical lines in the bottom rows of figures 11–13. Shaded regions correspond to the double of the resolution of the FFT transform, which is about
 $0.027$
.
With the procedure shown in figures 11–13 we determine the dependence of
 $St_{HS}$
on
 $R$
and
 $Re_{D}$
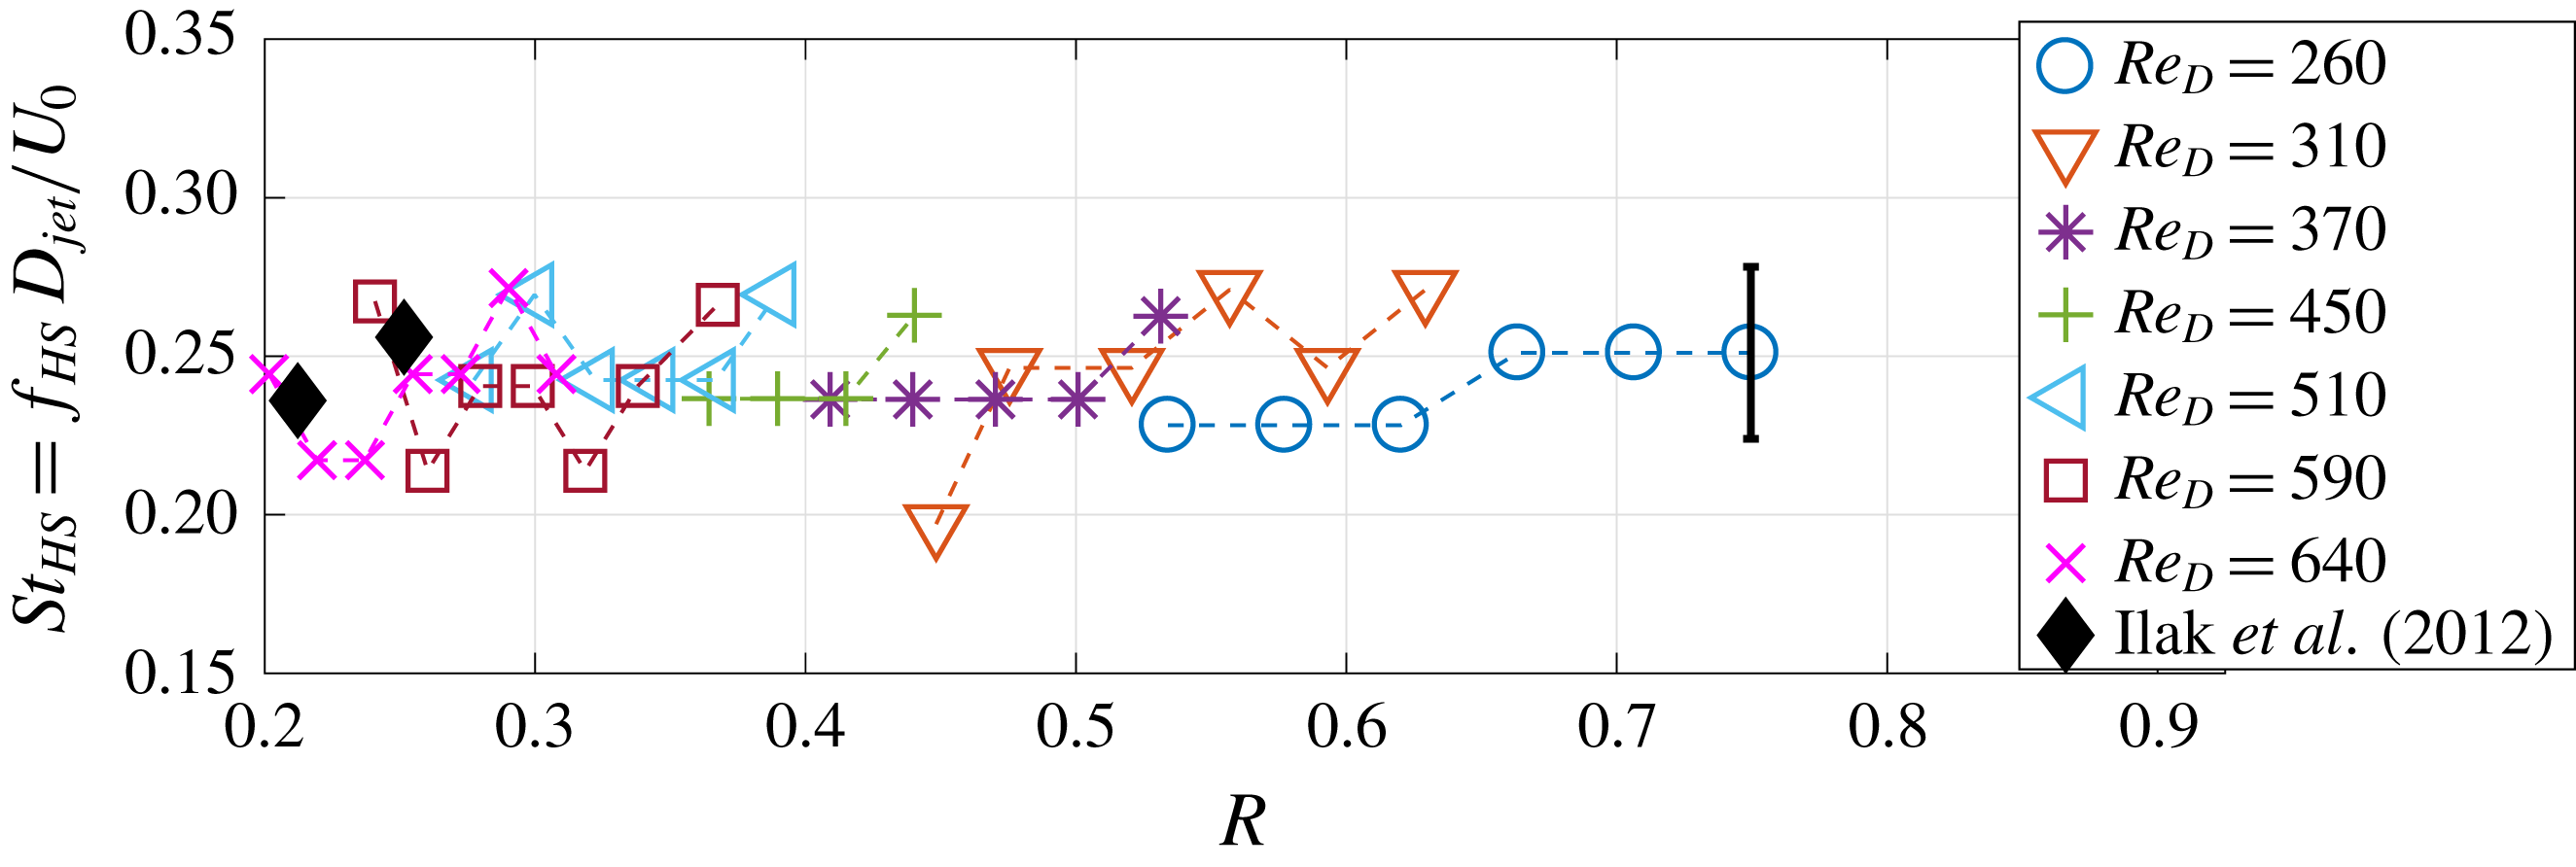
. Figure 14 highlights that the Strouhal number is nearly constant (
 $St_{HS}=0.24\pm 0.02$
, with the error based on the standard deviation) for the investigated range of parameter space. This implies that the frequency of hairpin shedding
 $f_{HS}$
grows linearly with
 $Re_{D}$
. Each colour in figure 14 corresponds to a different value of
 $Re_{D}$
and the length of the error bar represents the double of the spectral resolution of the FFT transform. Ilak et al. (Reference Ilak, Schlatter, Bagheri and Henningson2012) reported the Strouhal number for
 $Re_{D}=495$
and two different velocity ratios,
 $R^{\ast }=0.675$
and
 $R^{\ast }=0.8$
. However, since their definition was based on the jet velocity, we need to multiply their reported values by
 $R^{\ast }$
to compare with our data. This results in
 $St_{HS}=0.236$
for
 $R^{\ast }=0.675$
and
 $St_{HS}=0.256$
for
 $R^{\ast }=0.8$
, which is in close agreement with our value (see the filled diamonds in figure 14). Note that in this figure we also transform their velocity ratio
 $R^{\ast }$
based on the jet centreline velocity to
 $R$
(
 $R=0.314R_{\ast }$
for their jet velocity profile).
The same as figure 11 but for
 $Re_{D}=450$
and (a)
 $R=0.20$
, (b)
 $R=0.36$
, and (c)
 $R=0.44$
.

The same as figure 11 but for
 $Re_{D}=590$
and (a)
 $R=0.15$
, (b)
 $R=0.30$
, and (c)
 $R=0.37$
.

Dependence of
 $St_{HS}$
on
 $R$
. Values of
 $Re_{D}$
are indicated in the legend.

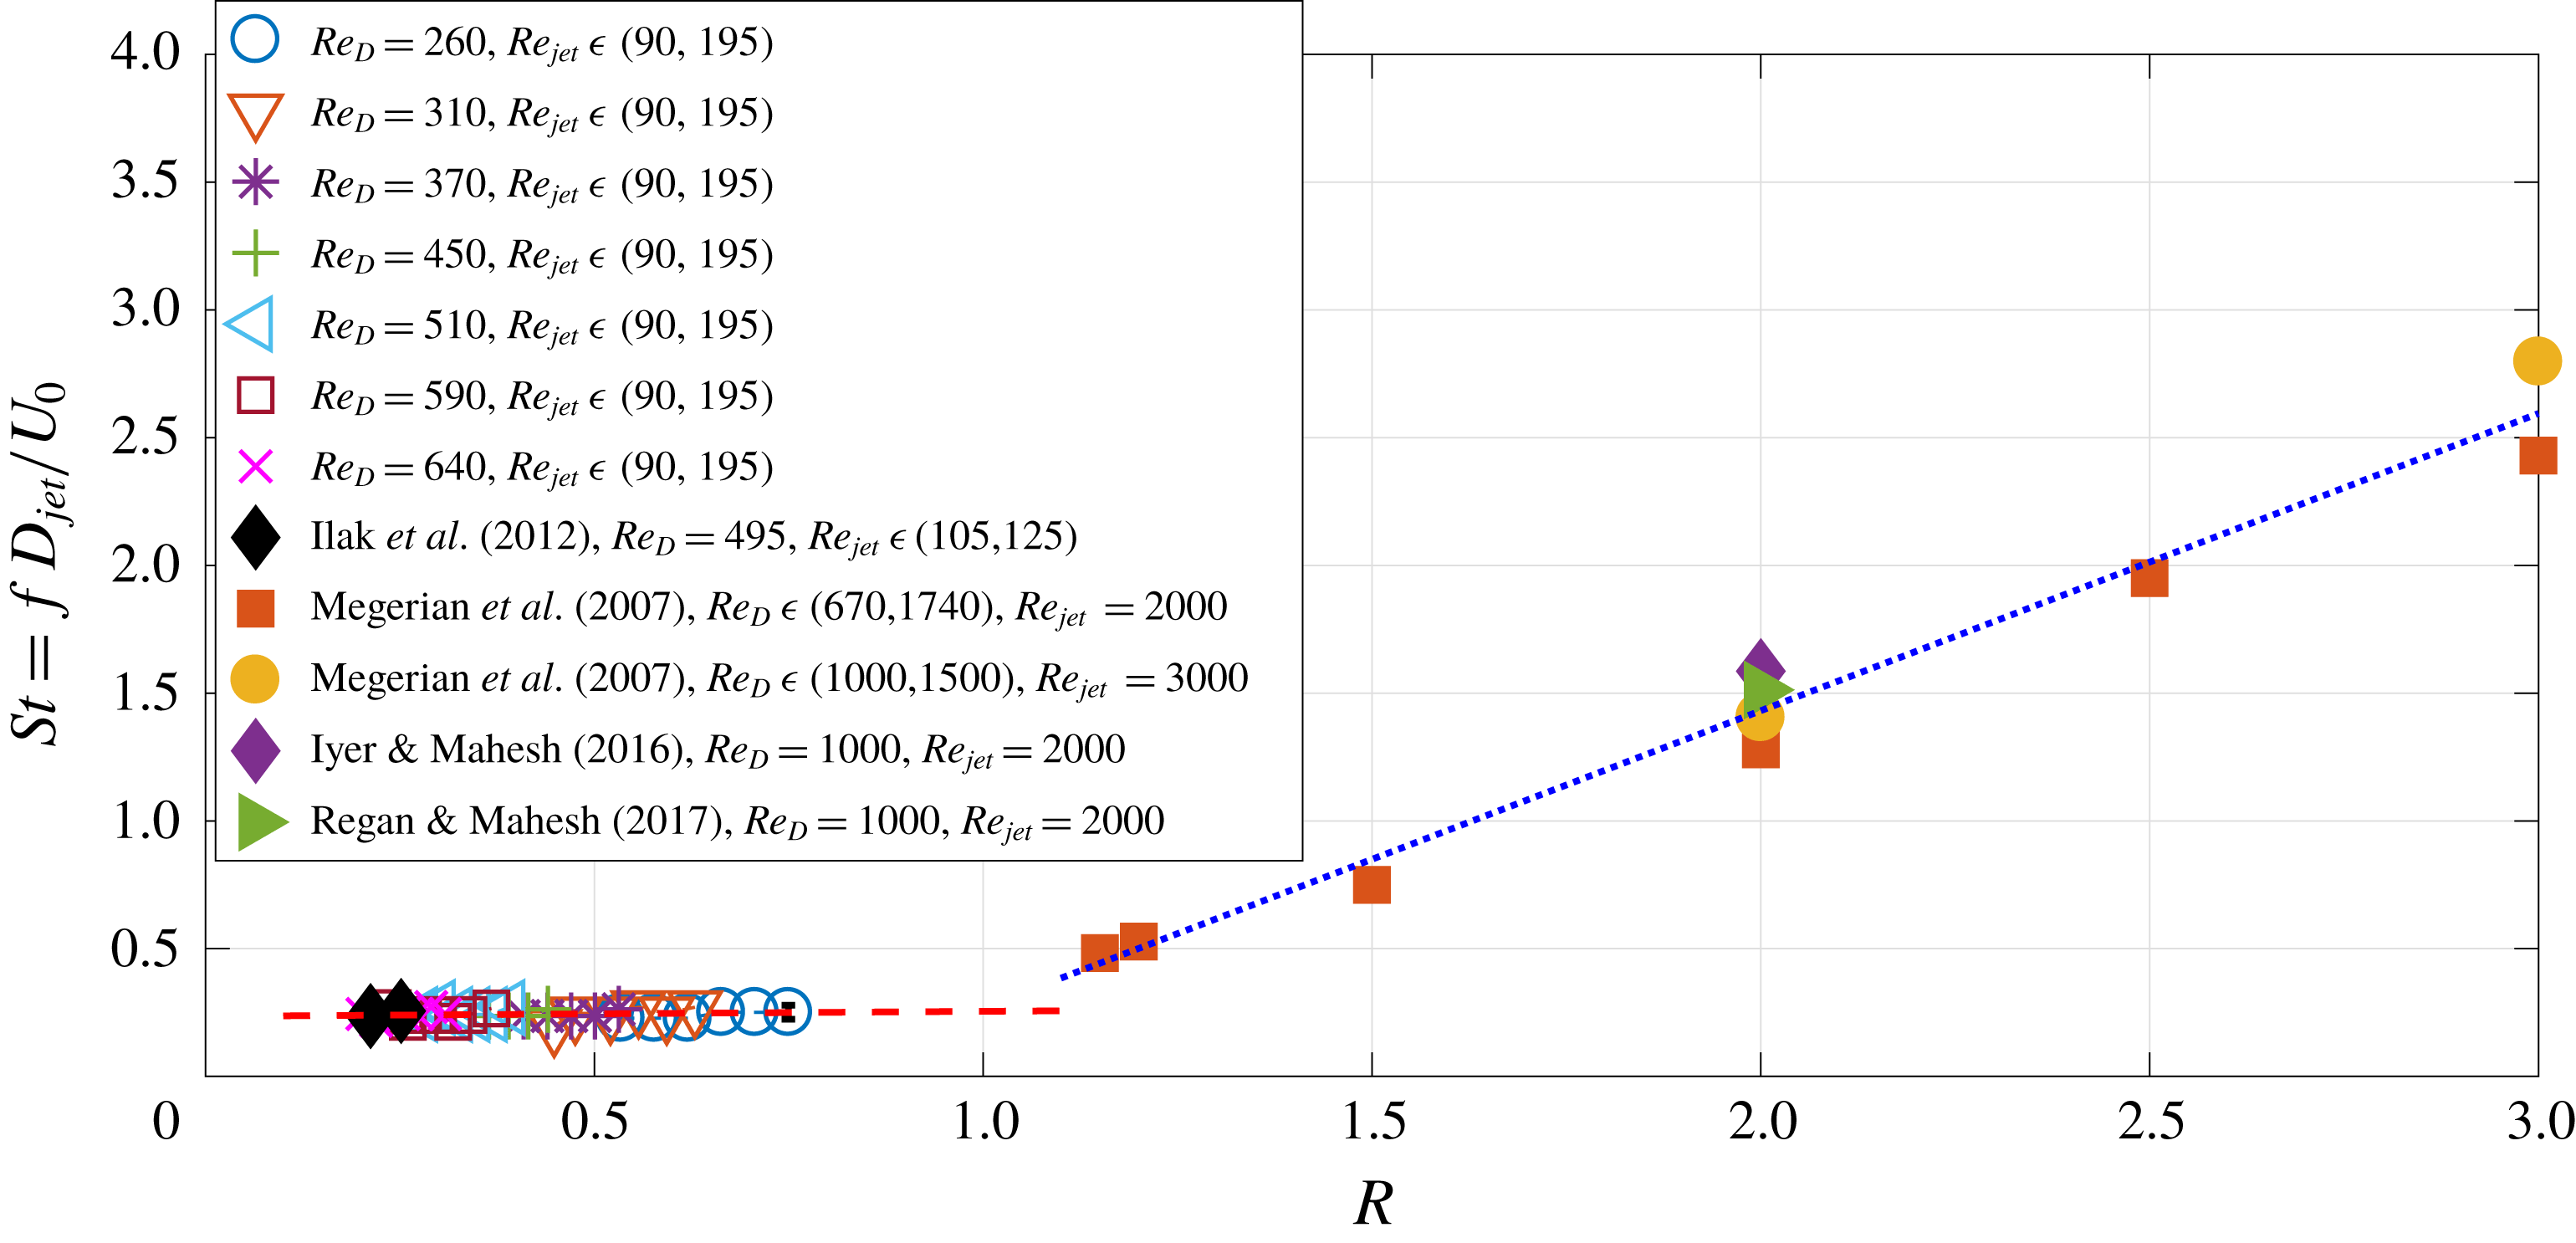
Comparison of the data from figure 14 with the results in the high-velocity-ratio regime reported by Megerian et al. (Reference Megerian, Davitian, Alves and Karagozian2007), Iyer & Mahesh (Reference Iyer and Mahesh2016) and Regan & Mahesh (Reference Regan and Mahesh2017). The ranges of
 $Re_{D}$
and
 $Re_{jet}$
for each study are indicated in the legend.

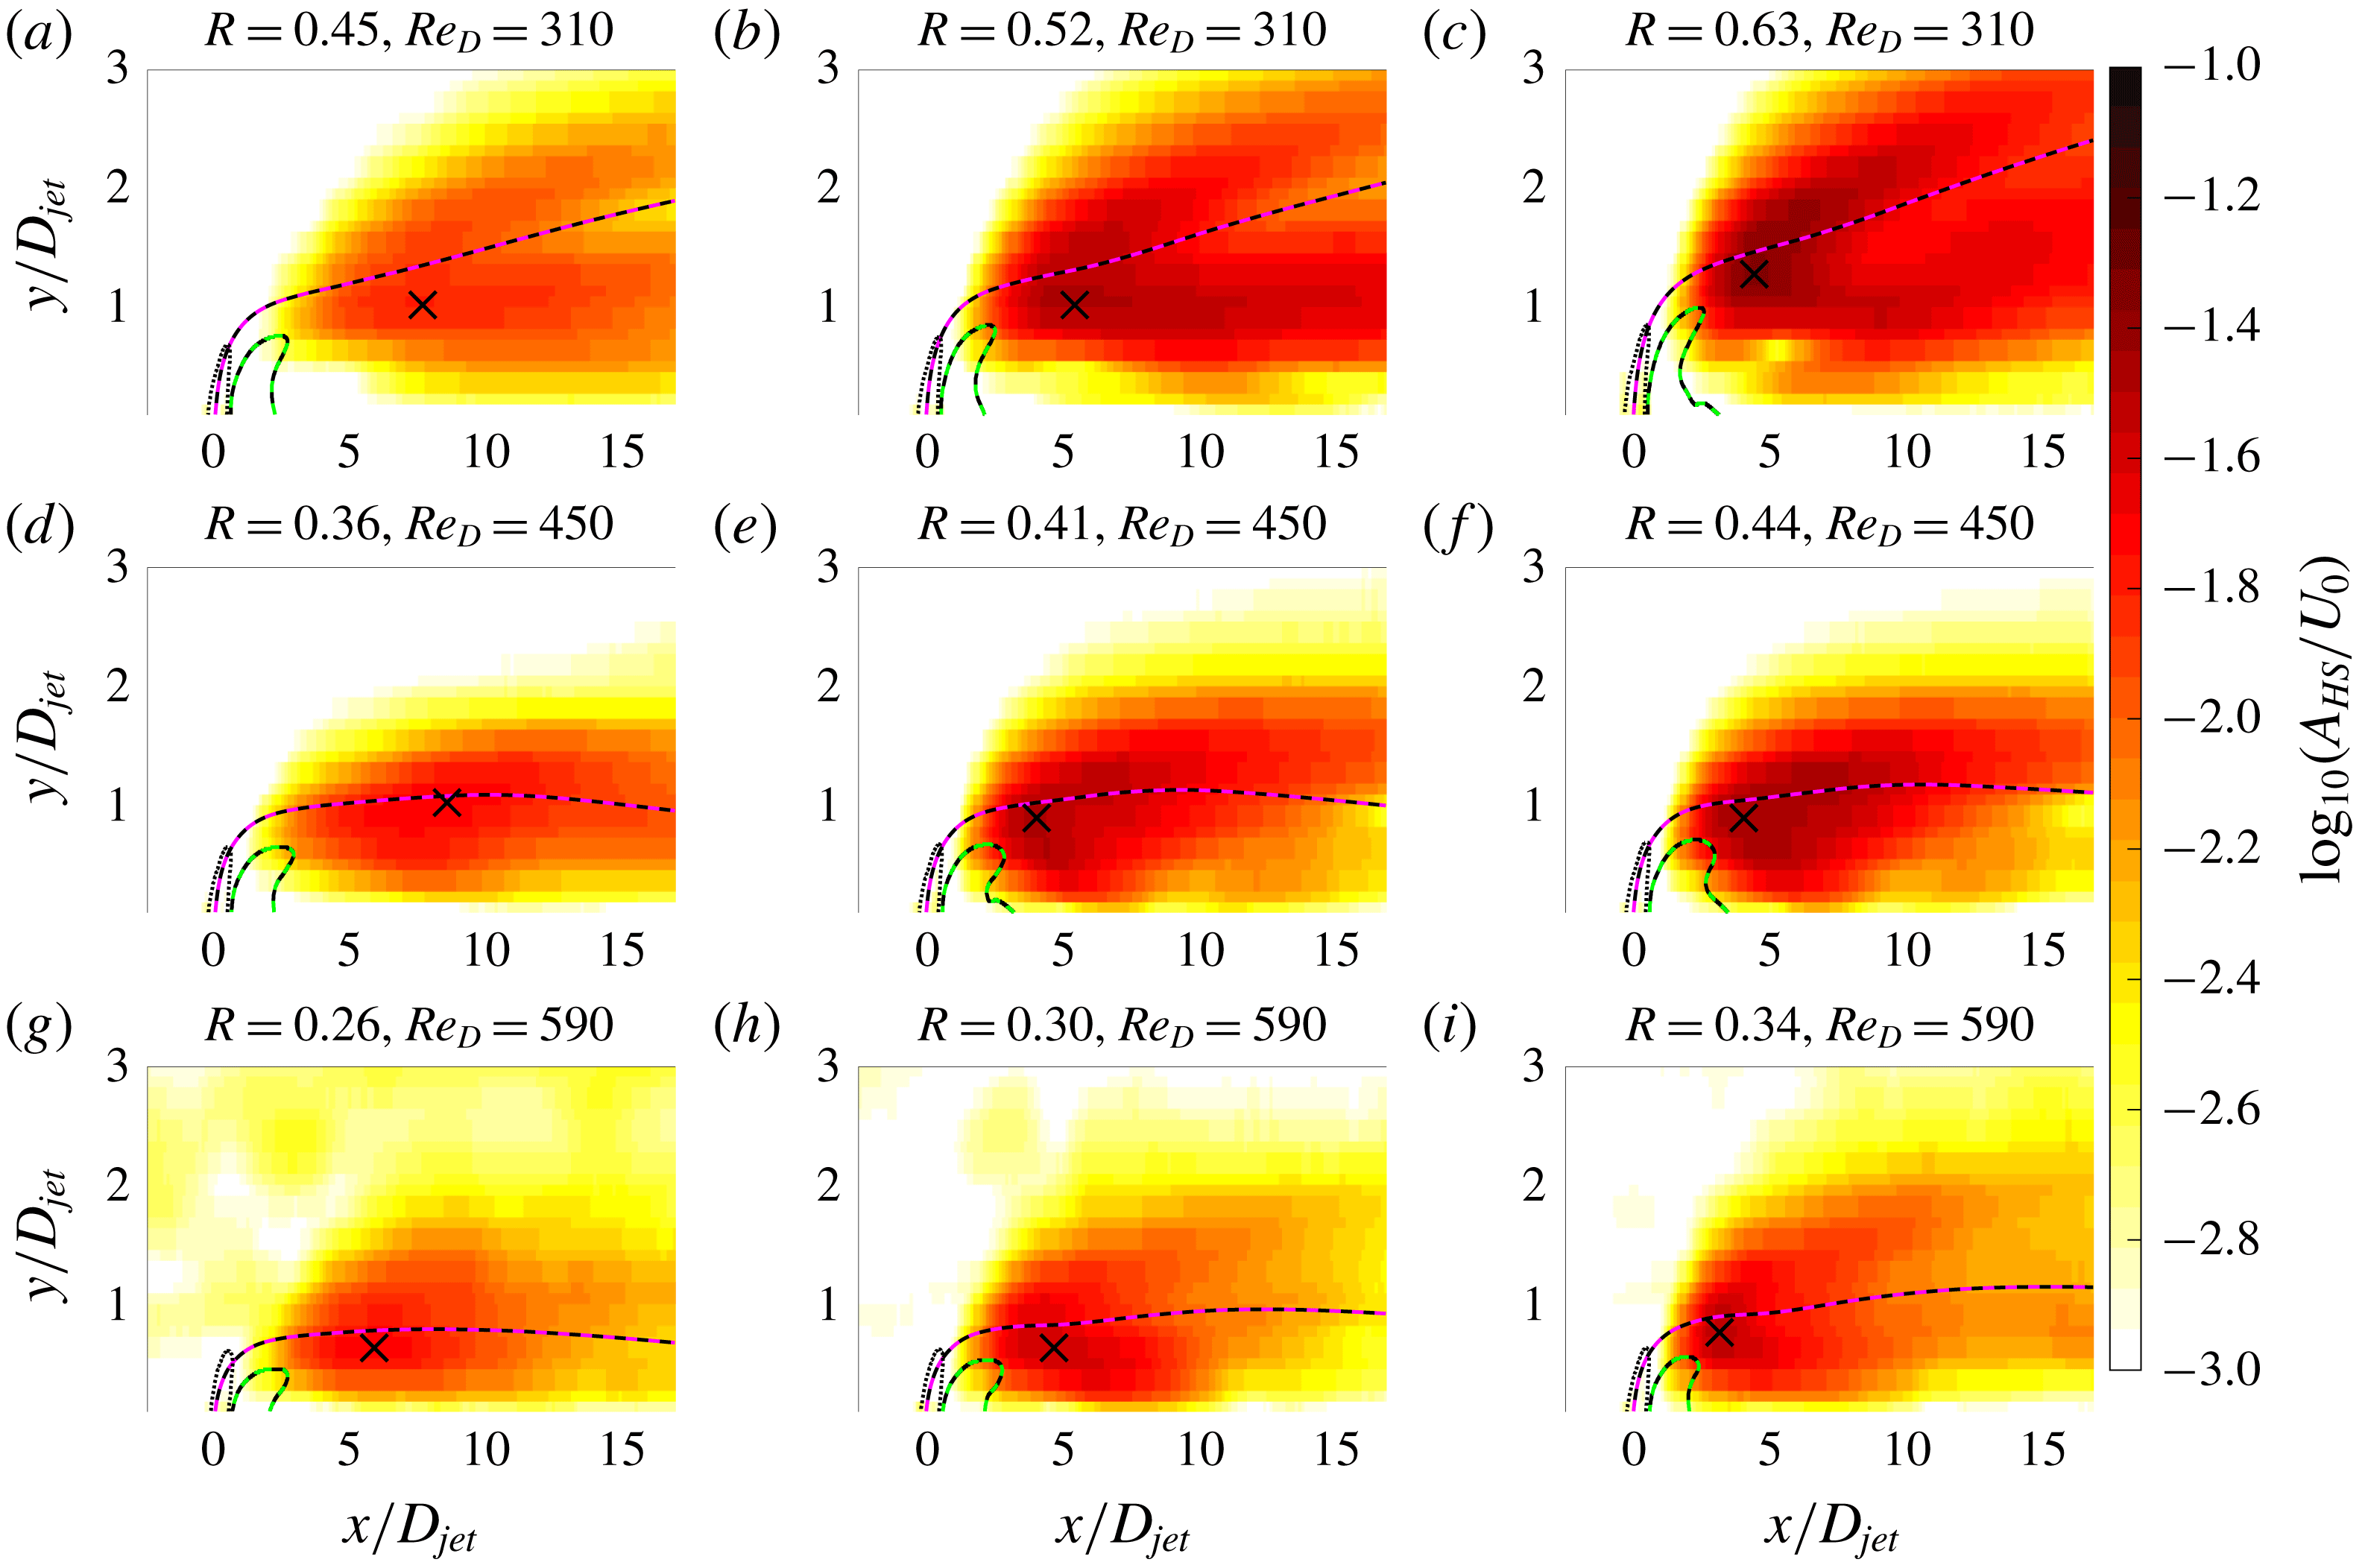
Spatial distribution of the hairpin amplitude (global mode) corresponding to the hairpin shedding frequency (
 $St_{HS}$
), calculated from the normalized ensemble-averaged FFT spectrum for
 $Re_{D}=310$
(a–c),
 $Re_{D}=450$
(d–f) and
 $Re_{D}=590$
(g–i). Jet centrelines (magenta-black dashed curves), downstream recirculation zones (green-black dashed curves) and jet contours that correspond to half the maximal measured jet vertical velocities (black dashed curves) are also shown. The crosses denote the position of the global spatial maximum of the global mode.

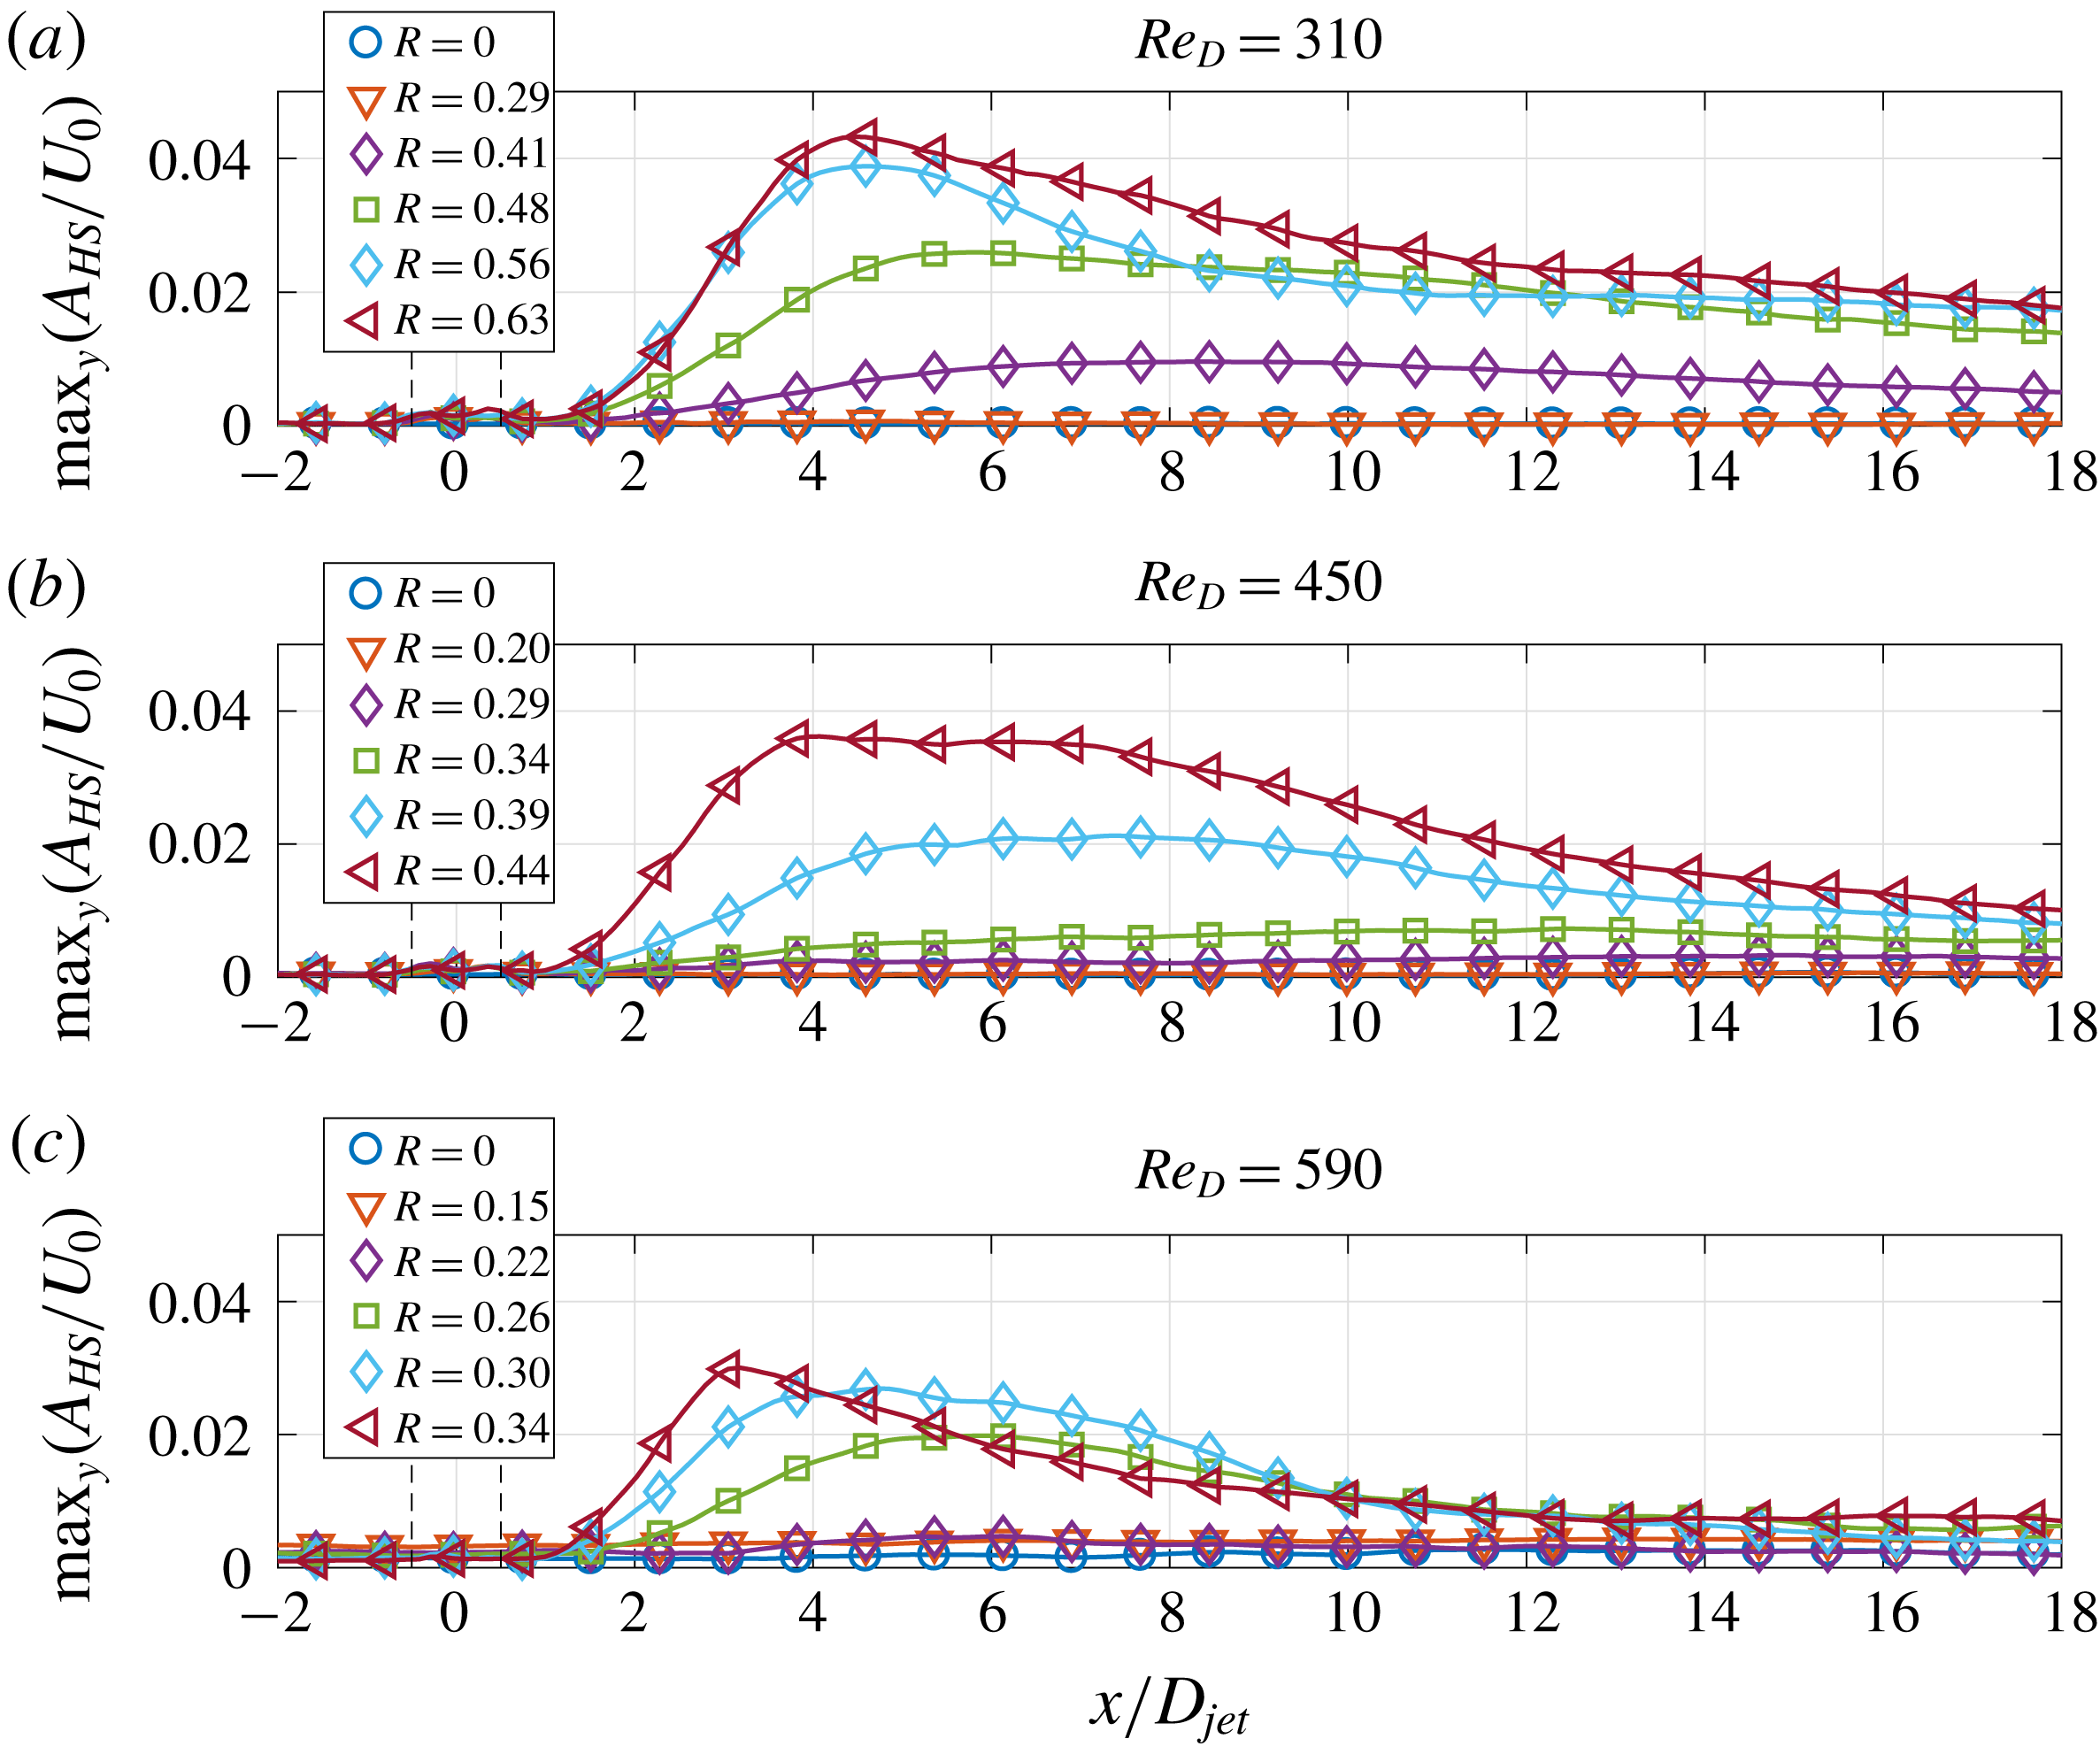
Streamwise evolution of the hairpin global mode for (a)
 $Re=310$
, (b)
 $Re=450$
, and (c)
 $Re=590$
. Each point at a given
 $x/D_{jet}$
is obtained as the maximal value of the global mode of hairpin instability (figure 16) along the wall-normal direction. The black vertical dashed lines indicate the upstream and downstream edges of the jet orifice (
 $x/D_{jet}=-0.5$
and
 $x/D_{jet}=0.5$
). Actual spatial resolution is six times larger than the spacing of the markers on each curve.

Megerian et al. (Reference Megerian, Davitian, Alves and Karagozian2007) reported similar single pure-tone oscillations in the high-velocity-ratio regime. We inferred the Strouhal numbers reported for strong single-tone oscillations for the flush nozzle from their figure 12 (open symbols) to compare with our data. We also included in the comparison the values reported by Iyer & Mahesh (Reference Iyer and Mahesh2016) and Regan & Mahesh (Reference Regan and Mahesh2017). Since the authors used the Strouhal number
 $St$
based on jet velocity, we multiply inferred values of
 $St$
by the corresponding velocity ratio
 $R$
. The resulting values are plotted in figure 15 together with the data presented in figure 14. The Strouhal number that characterizes the roll-up of the upper jet shear layer seems to follow a distinct linear trend when normalized with
 $U_{0}$
. However, the increase with
 $R$
of the characteristic Strouhal number of the upper jet shear layer vortices is substantially larger (blue dotted line) when compared to the trend predicted from our data (red dashed line,
 $\text{d}St_{HS}/\text{d}R\simeq 0.02$
). Moreover, the authors studied the periodic shedding of vortices of positive spanwise vorticity in the upstream jet shear layer, which is absent in our case (see figure 9). Finally, Megerian et al. (Reference Megerian, Davitian, Alves and Karagozian2007) reported a transition scenario from absolutely unstable global self-sustained oscillations in the JICF (for control parameter
 $R<3.1$
) to a convectively unstable free-jet flow (
 $R\rightarrow \infty$
), whereas we report the transition from the flow without self-sustained hairpin shedding (
 $0<R<R_{cr}$
, where
 $R_{cr}$
is the onset of hairpin instability) to the flow with the dynamics dominated by the hairpins in the downstream near field of the JICF (for
 $R>R_{cr}$
).
We also study the global mode describing the dynamics of the hairpin vortices. For each spatial location
 $(x,y),$
we select from one-dimensional FFT ensemble-averaged spectrum the spectral mode
 $A_{FFT\,v}/U_{0}$
that corresponds to the characteristic Strouhal number of hairpin shedding (
 $St_{HS}$
, indicated by the shaded region in figures 11–13). As a result, we obtain the spatial distribution of the intensity of hairpin shedding instability
 $A_{HS}(x,y)/U_{0}$
. Its dependence on the control parameter
 $R$
is shown in logarithmic scale for
 $Re_{D}=310$
(figure 16
a–c),
 $Re_{D}=450$
(figure 16
d–f), and
 $Re_{D}=590$
(figure 16
g–i). For higher
 $Re_{D},$
hairpin shedding occurs at lower
 $R$
. On each subplot we superimpose the centreline trajectory (magenta-black dashed line), downstream recirculation zone (green-black dashed line) and the jet contour that corresponds to half the maximal measured vertical velocity of the jet (black dashed curves). The maximal amplitude of hairpins (denoted by crosses) is located in the region bounded from the top by the centreline trajectory and from the bottom/left by the downstream recirculation zone. To better illustrate the spatial evolution of
 $A_{HS}(x,y)/U_{0}$
in the streamwise direction as a function of
 $R$
and
 $Re_{D}$
, we calculate the maximal value of the global mode
 $A_{HS}(x,y)/U_{0}$
along the wall-normal direction (max
 $_{y}$
(
 $A_{HS}(x,y)/U_{0}$
)) for each
 $x$
location. The resulting curves are shown in linear scale in figure 17 for (a)
 $Re_{D}=310$
, (b)
 $Re_{D}=450$
and (c)
 $Re_{D}=590$
. For a given
 $Re_{D}$
, the global spatial maximum of the hairpin amplitude increases with
 $R$
and its location shifts closer to the jet orifice. Additionally, the spatial growth of the global mode is followed by eventual decay, similar to the global mode evolution observed in the wake behind a cylinder (Goujon-Durand et al.
Reference Goujon-Durand, Jenffer and Wesfreid1994; Zielinska & Wesfreid Reference Zielinska and Wesfreid1995; Wesfreid et al.
Reference Wesfreid, Goujon-Durand and Zielinska1996) or three-dimensional bluff bodies (Ormires & Provansal Reference Ormires and Provansal1999; Klotz et al.
Reference Klotz, Goujon-Durand, Rokicki and Wesfreid2014, and references therein).
Bifurcation diagram of the normalized FFT amplitude of hairpin shedding
 $G_{HS}$
as a function of
 $R$
and for different
 $Re_{D}$
. The squared amplitude is linearly dependent on the control parameter
 $R$
, as predicted by the Landau equation. Each following
 $Re_{D}$
is shifted by
 $2.5\times 10^{-4}$
upward to increase readability.

Dependence of the critical threshold
 $R_{cr}$
of the hairpin shedding instability as a function of
 $Re_{D}$
(blue circles) and measurement points (small black dots). For comparison, we also present the DNS results of the KTH group: Peplinski et al. (Reference Peplinski, Schlatter and Henningson2015b
, purple star) and Ilak et al. (Reference Ilak, Schlatter, Bagheri and Henningson2012, green cross).

Similar quantity as in figure 16 but focused on the region close to the jet orifice:
 $x/D_{jet}\in (-1,3)$
and
 $y/D_{jet}\in (0,1.1)$
.

Similar quantity as in figure 17 but focused on the region close to the jet orifice. Two weak local peaks close to
 $x/D_{jet}=-0.5$
and
 $x/D_{jet}=0.5$
correspond to the upstream and downstream jet shear layers. The black vertical dashed lines indicate the upstream and downstream edges of the jet orifice (
 $x/D_{jet}=-0.5$
and
 $x/D_{jet}=0.5$
). The black thick dotted line indicates the local minimum in streamwise direction of the global mode of hairpin instability.

In order to determine the critical values
 $R=R_{cr}$
, at which the transition to hairpin shedding occurs, we apply the method described by Goujon-Durand et al. (Reference Goujon-Durand, Jenffer and Wesfreid1994), Zielinska & Wesfreid (Reference Zielinska and Wesfreid1995) in the context of the Bénard–von Kármán street. Specifically, for each realization of combinations of (
 $R,Re_{D}$
), we determine the global spatial maximum of the global mode of hairpin shedding instability. Then, for each (
 $R,Re_{D}$
) pair, we calculate the mean over all realizations, which we will refer to as
 $G_{HS}$
. We choose
 $R$
as the control parameter and
 $G_{HS}/U_{0}$
as an order parameter. We consider the evolution of the square of the order parameter for a fixed
 $Re_{D}$
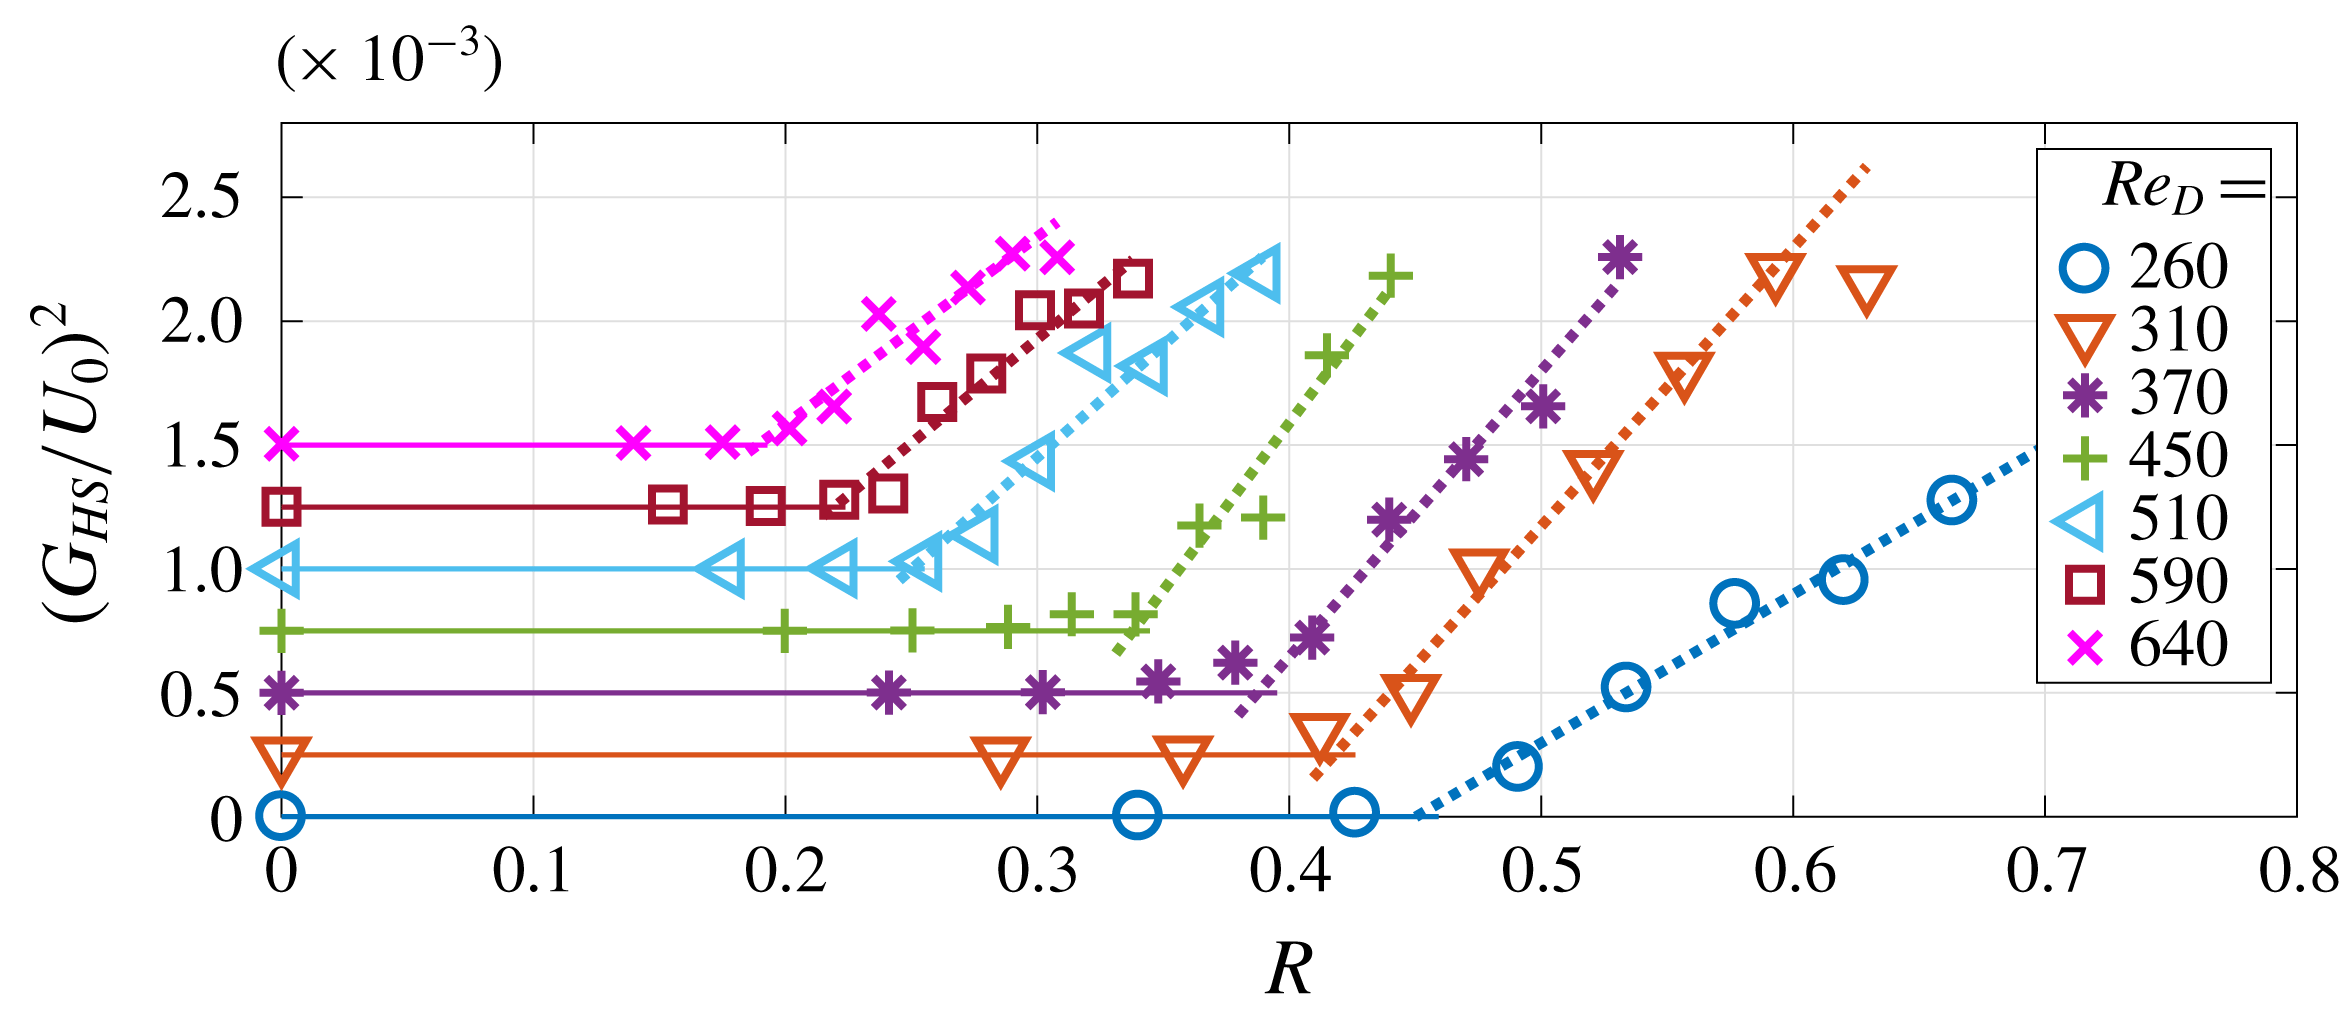
, which results in 7 different bifurcation diagrams (see figure 18). Each colour corresponds to a different
 $Re_{D}$
and their specific values are given in the legend. Each subsequent bifurcation diagram is shifted upwards by
 $2.5\times 10^{-4}$
to increase readability. When
 $R<R_{cr}$
, the square of the order parameter is approximately zero, and, for
 $R>R_{cr}$
, it grows linearly with the distance from the threshold,
 ${\sim}(R-R_{cr})$
. This behaviour is typical for a supercritical Hopf bifurcation and is similar for all investigated
 $Re_{D}$
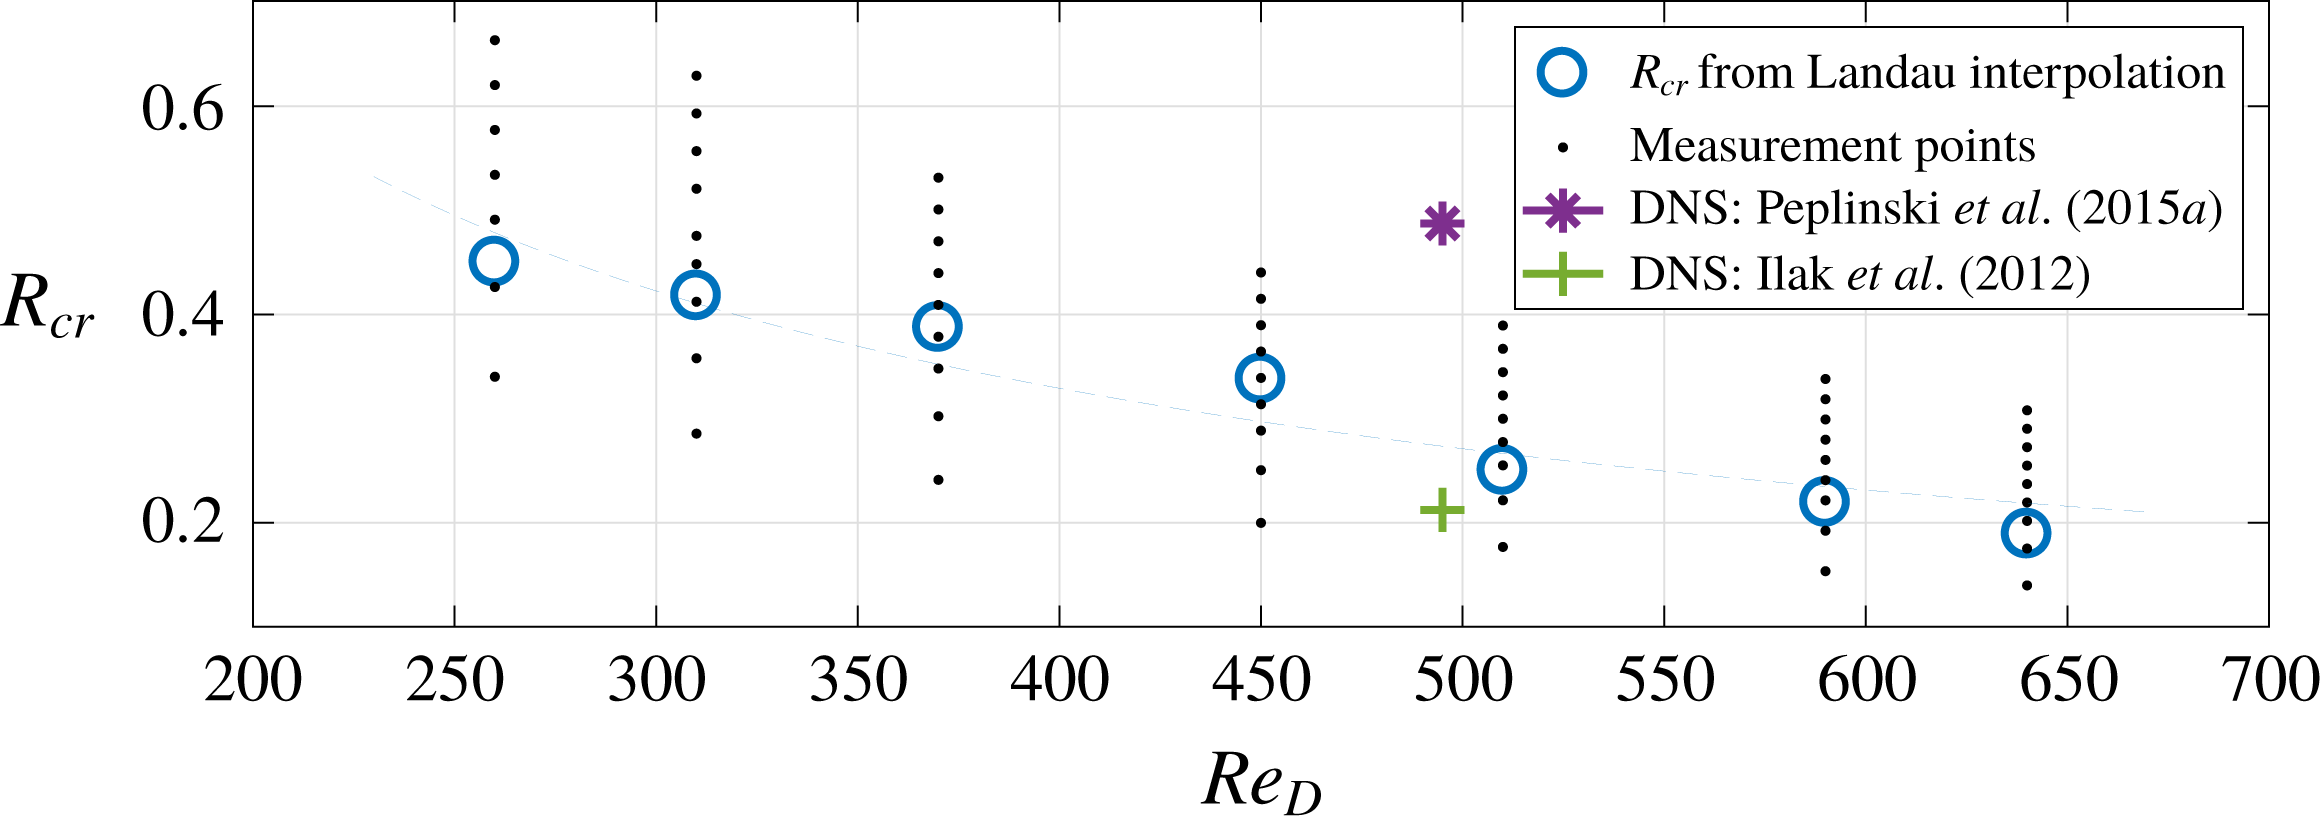
. For each
 $Re_{D}$
, we interpolate this linear trend to zero and determine the precise value of the threshold
 $R_{cr}$
(see figure 19).
 $R_{cr}$
monotonically decreases with
 $Re_{D}$
and can be approximated by the power law
 $R_{cr}\sim Re_{D}^{-0.9}$
. A similar trend was observed by the KTH group (Chauvat et al.
Reference Chauvat, Peplinski, Hanifi and Henningson2017). For comparison, we also plot on figure 19 other DNS results of the KTH group: Peplinski et al. (Reference Peplinski, Schlatter and Henningson2015b
, purple star) and Ilak et al. (Reference Ilak, Schlatter, Bagheri and Henningson2012, green cross).
We also note that a similar linear increase of the squared amplitude of the upstream jet shear layer roll-up with the distance from the instability threshold was already observed by Davitian et al. (Reference Davitian, Getsinger, Hendrickson and Karagozian2010) in the high-jet-velocity regime. The authors considered the same control parameter as in our case (jet velocity ratio
 $R$
) and a different order parameter (r.m.s. of wall-normal velocity fluctuations normalized with the jet velocity
 $V_{jet}$
). However, they studied the evolution of the amplitude perturbations for a fixed distance from the jet orifice along the upstream jet shear layer (equivalent to the method used by Mathis et al. (Reference Mathis, Provansal and Boyer1984) for the wake behind a cylinder) and obtained different values for the critical parameter depending on the spatial location. In contrast, we consider the global spatial maximum of the global mode of the hairpin instability as an order parameter, similar to Goujon-Durand et al. (Reference Goujon-Durand, Jenffer and Wesfreid1994), Wesfreid et al. (Reference Wesfreid, Goujon-Durand and Zielinska1996) and Klotz et al. (Reference Klotz, Goujon-Durand, Rokicki and Wesfreid2014).
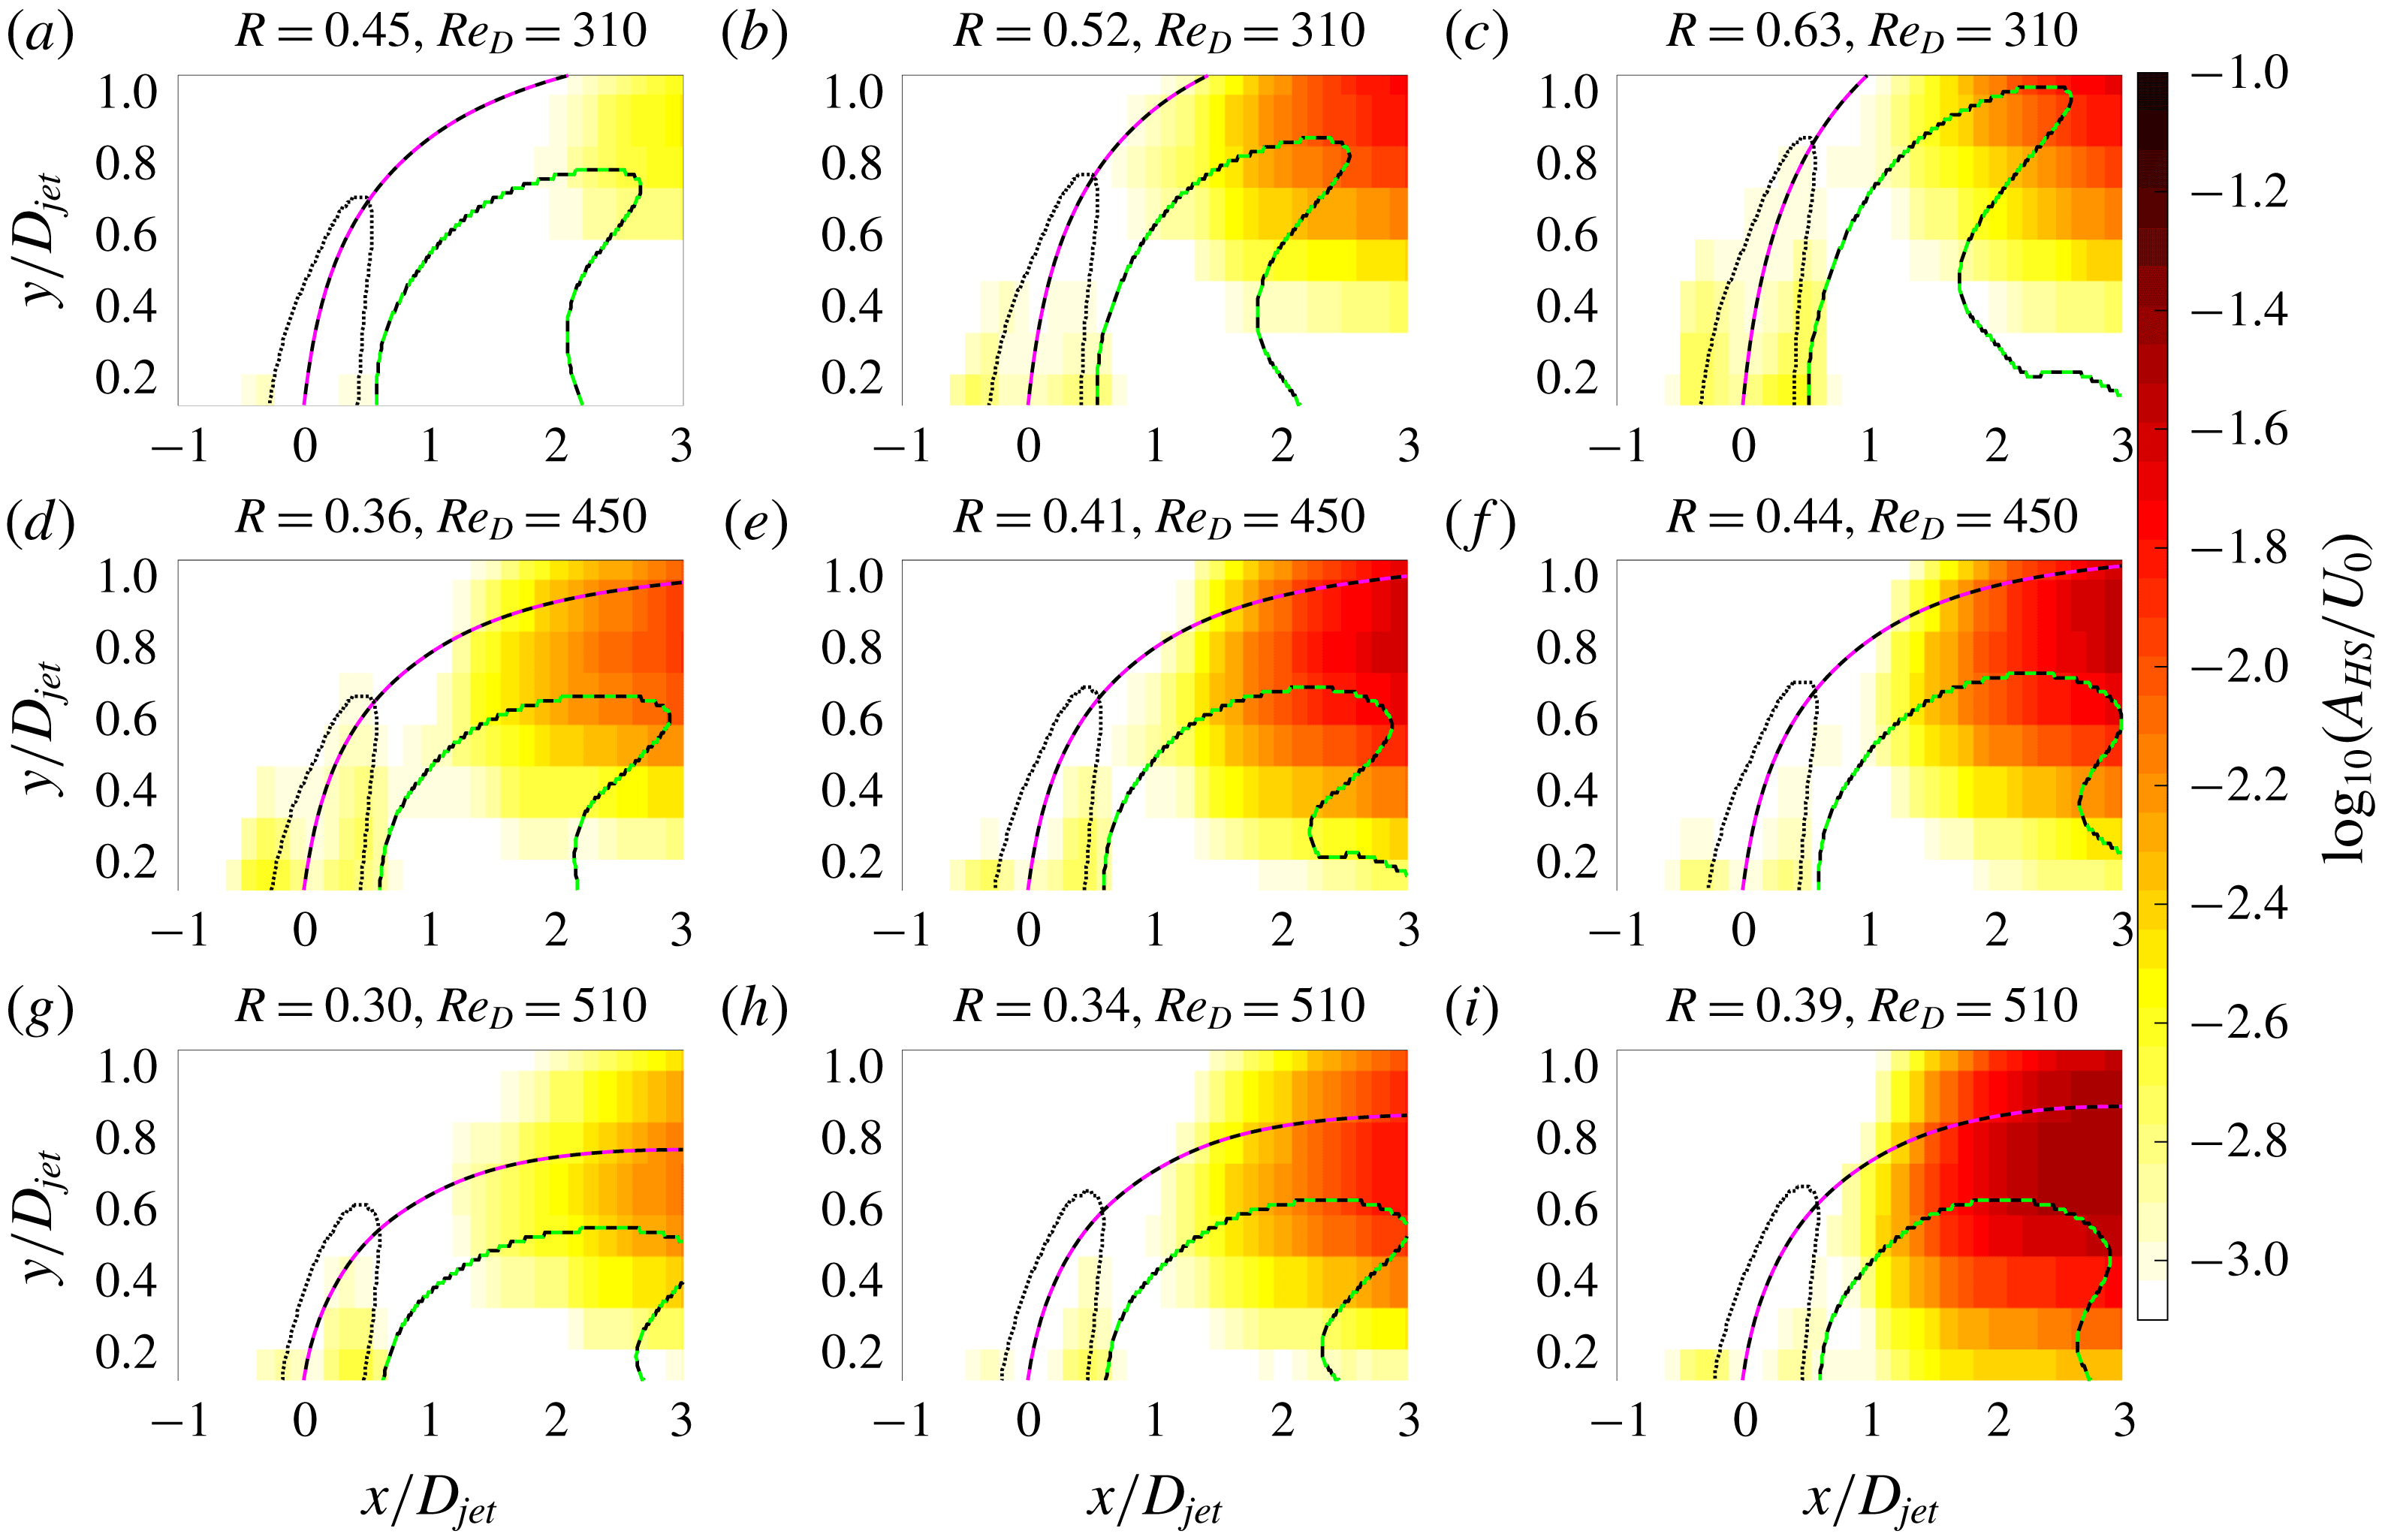
In figure 20 we present the spatial distribution of the global mode of hairpin instability
 $A_{HS}(x,y)/U_{0}$
focused on the region close to the jet orifice (
 $x/D_{jet}\in (-1,3)$
and
 $y/D_{jet}\in (0,1.1)$
) to distinguish between the jet shear layers and hairpin instability. Similar to figure 16, magenta-black dashed, green-black dashed and black dotted curves represent the centreline trajectory, downstream recirculation zone and jet contour corresponding to half the maximal measured vertical velocity of the jet, respectively. One can observe two regions of local weak increase of the amplitude of the hairpin global mode
 $A_{HS}(x,y)/U_{0}$
in the vicinity of the upstream (
 $x/D_{jet}=-0.5$
) and downstream (
 $x/D_{jet}=0.5$
) edges of the jet. Further downstream these peaks are followed by a substantial increase of
 $A_{HS}(x,y)/U_{0}$
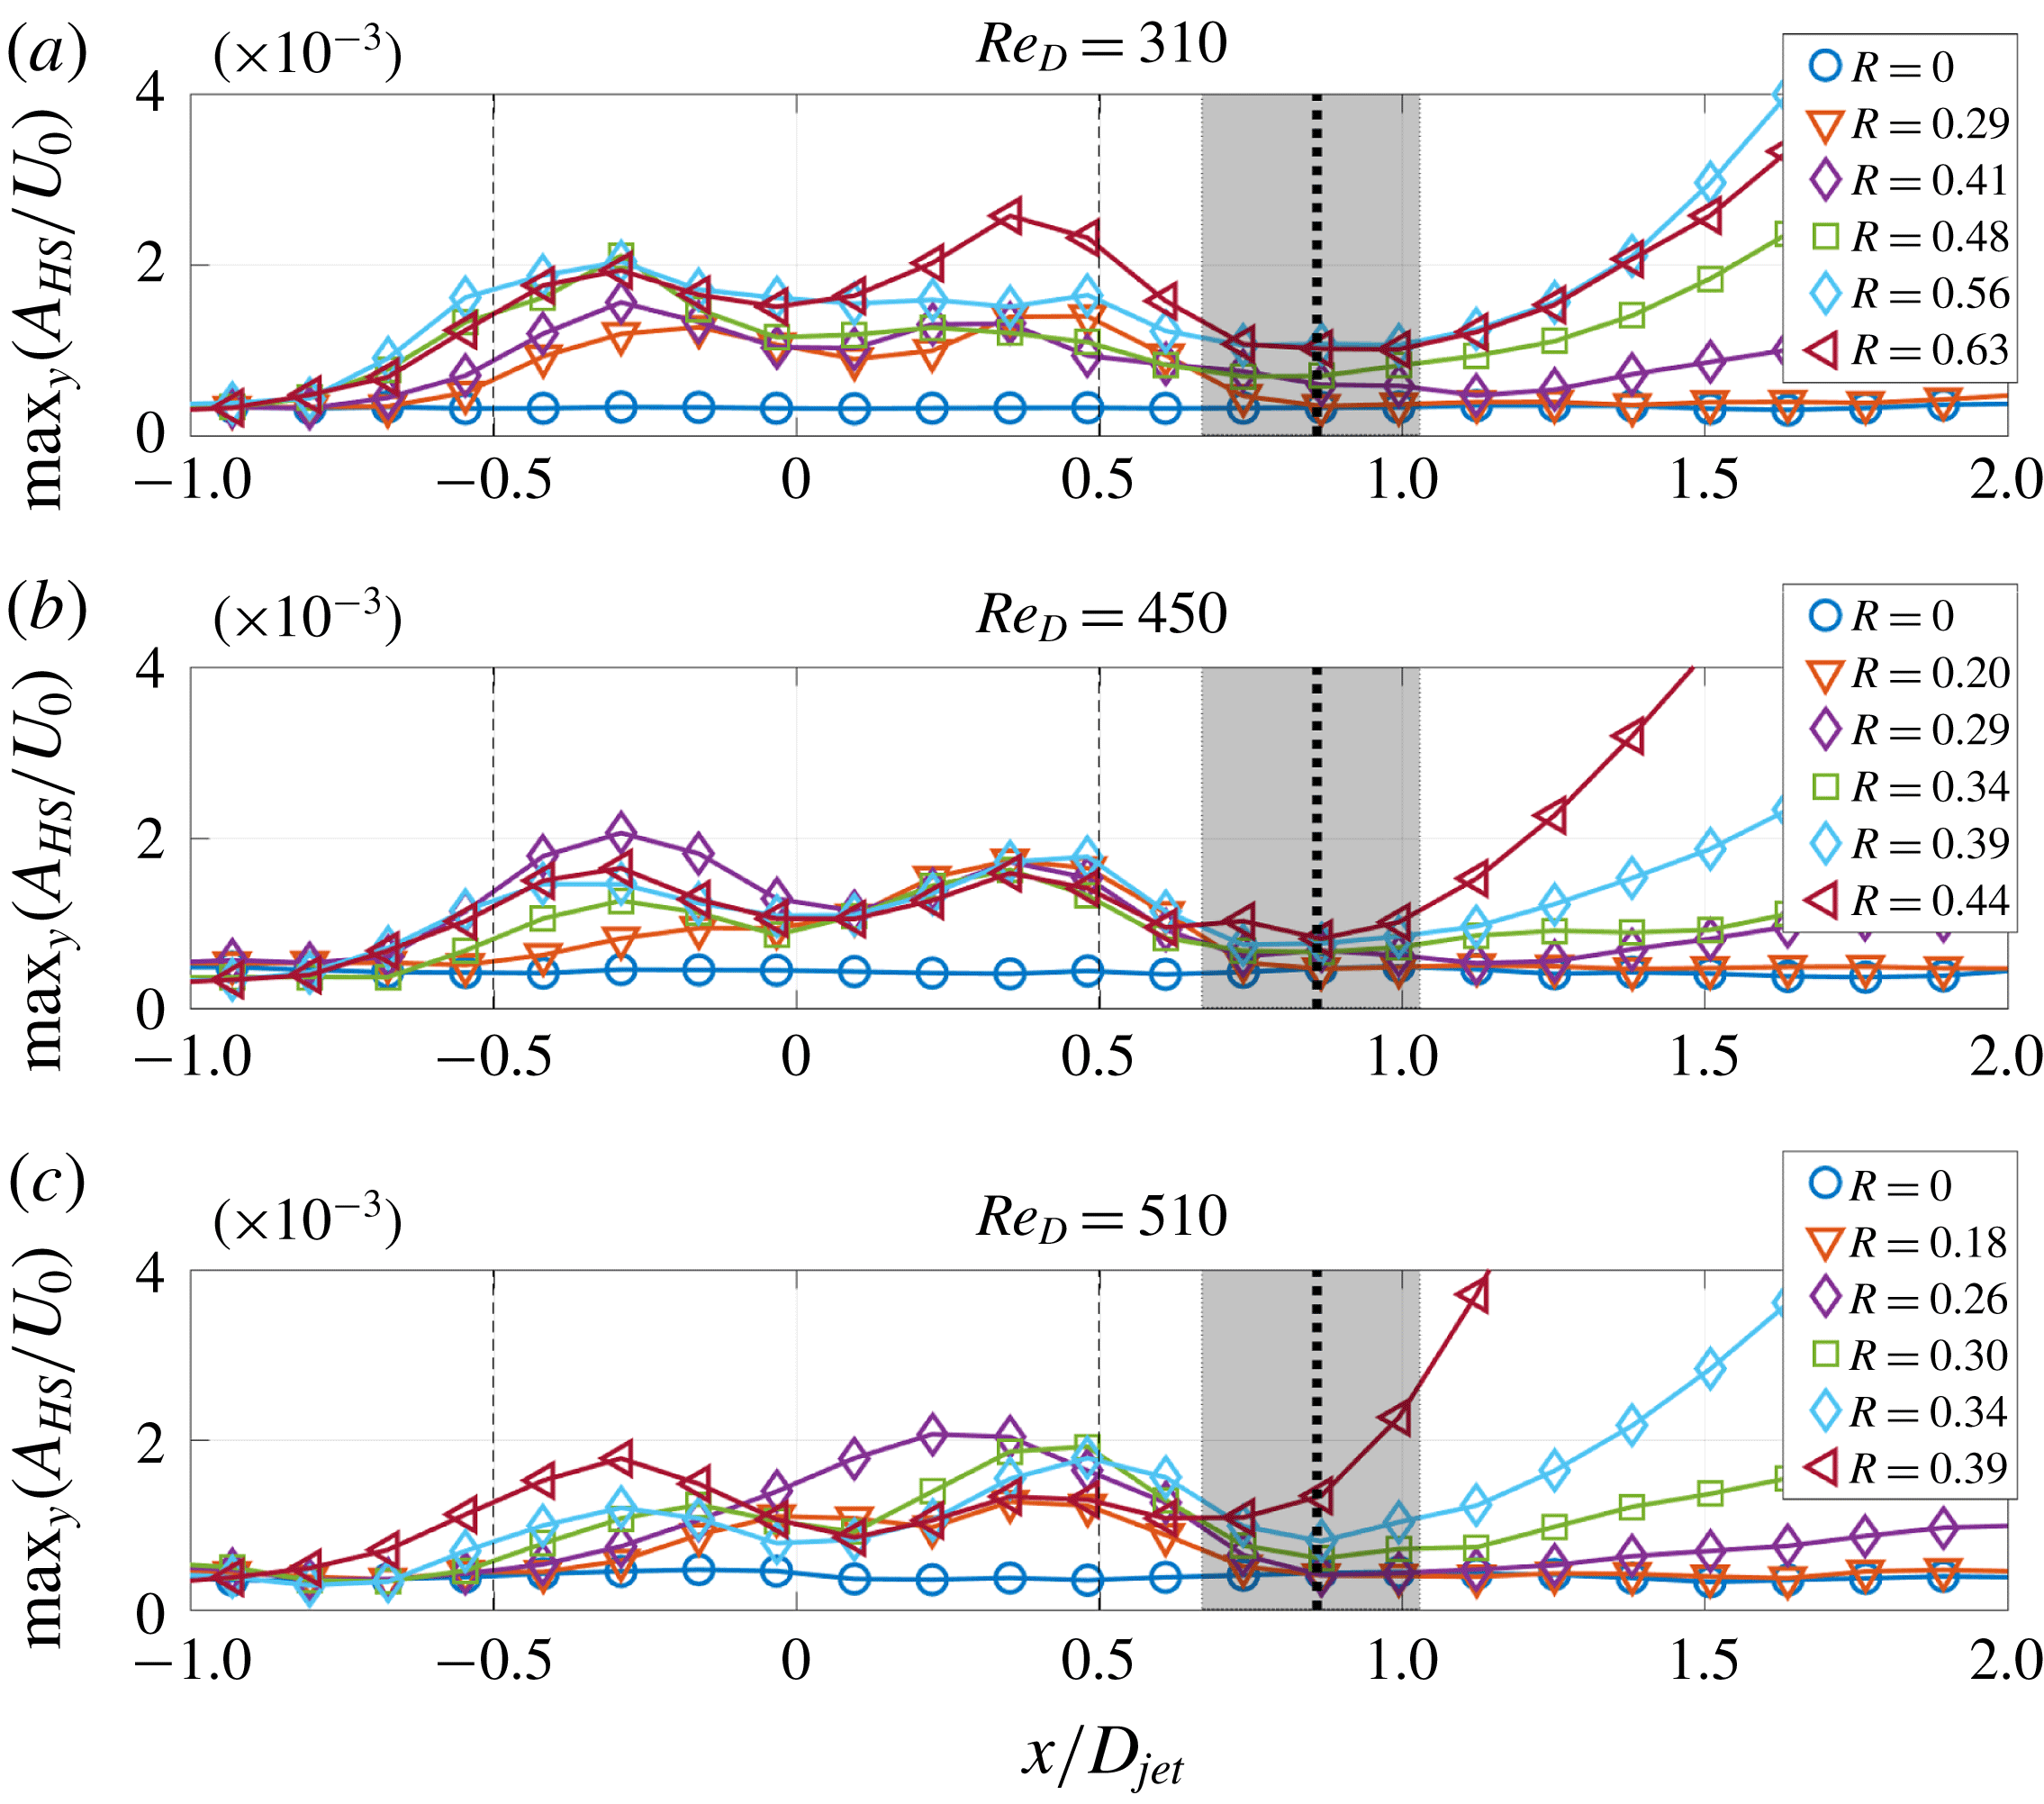
due to the formation of hairpin vortices. In figure 21 we plot the quantity max
 $_{y}$
(
 $A_{HS}/U_{0}$
) to illustrate in more details the spatial evolution of the global mode of hairpin instability. For supercritical conditions (
 $R>R_{cr}$
), the quantity max
 $_{y}$
(
 $A_{HS}/U_{0}$
) does not grow monotonically in the streamwise direction, i.e. two local peaks close to the upstream and downstream jet edges can be distinguished. However, their amplitude is an order of magnitude lower than the global spatial maximum of the hairpin global mode (compare with figure 17). These local peaks are followed in the downstream direction (
 $x/D_{jet}>0.5$
) by a local minimum that we use as the criterion to define the hairpin formation. We determine its location (
 $x_{HS}$
) for each combination of
 $R$
and
 $Re_{D}$
. By ensemble-averaging over these combinations we obtain
 $x_{HS}/D_{jet}=0.85\pm 0.18$
. The error is based on the STD of
 $x_{HS}$
for all combinations and its value is of the same order as the spatial resolution of our measurements. The resulting location of
 $x_{HS}$
is marked by a vertical solid black line in figure 21 and the shaded region corresponds to the estimated error. Also note that the very weak local maxima of upstream and downstream jet shear layers are present even for the subcritical case (
 $0<R<R_{cr}$
, orange triangles in figure 21
a–c), for which self-sustained hairpin shedding from the downstream recirculation zone was not observed.
5 Conclusions
We present a detailed experimental study of the JICF in a low-velocity-ratio regime, varying both crossflow and bulk jet speeds, which spans the region of
 $R\in (0.14,0.75)$
and
 $Re_{D}\in (260,640)$
in the parameter space. Our analysis is mainly focused on the transition to hairpin shedding state and its instability properties. We demonstrate that using the free-stream velocity and jet diameter for normalization, the characteristic Strouhal number of hairpins can be approximated by
 $St_{HS}=0.24\pm 0.02$
for the investigated range of parameters. Dynamical analysis reveals that the square of the hairpin velocity fluctuations grow linearly with velocity ratio
 $R$
. This result is predicted by the Landau model describing the weakly nonlinear saturation of the state after transition, which shows quantitatively that the hairpin instability occurs through supercritical Hopf bifurcation. Using this dependence, we determine the threshold of hairpin shedding instability for the range of
 $Re_{D}$
studied here and show that it decreases monotonically with
 $Re_{D}$
. In addition, the dynamics of hairpin vortices measured experimentally, as well as their characteristic Strouhal number, are in good qualitative agreement with numerical simulations of Ilak et al. (Reference Ilak, Schlatter, Bagheri and Henningson2012) for supercritical range of velocity ratio
 $R>R_{cr}$
. Our results demonstrate that, for the considered range of parameters, the dynamics of self-sustained hairpin shedding in a JICF is an analogue to other hydrodynamical oscillators such as wake behind different bluff bodies. The structure of shed hairpins is similar to the three-dimensional bluff bodies (i.e. traveling wave) and the global mode has a similar spatial evolution in the downstream direction: after initial amplification of the hairpins, their amplitude eventually decays as they are advected downstream. Additionally, global spatial maximum of the amplitude of the hairpin global mode increases and shifts closer to the jet orifice when
 $R$
is increased.
Acknowledgements
We thank J. Rokicki and J. M. Lopez for fruitful discussion, and Guillaume Saingier for help with experiments. L.K. was partially supported by the European Unions Horizon 2020 research and innovation programme under the Marie Skłodowska-Curie grant agreement number 754411.