


INTRODUCTION
As the aging population in the USA grows and becomes more racially/ethnically diverse, ability to detect and monitor age-related diseases that lead to cognitive decline and dementia in diverse older people becomes increasingly relevant. Black and Hispanic individuals are currently the two largest minority groups (U.S. Census Bureau, 2018) and are projected to increase by three and six times by 2060, respectively (Administration for Community Living, 2019). Alzheimer’s disease (AD) and dementia may disproportionally affect minority groups (Mayeda, Glymour, Quesenberry, & Whitmer, Reference Mayeda, Glymour, Quesenberry and Whitmer2016; Tang et al., Reference Tang, Cross, Andrews, Jacobs, Small, Bell and Mayeux2001), but early symptom recognition is not well understood. An important step in addressing health disparities is the availability of sensitive and culturally relevant tools to measure cognition and everyday function.
Measuring subtle changes in cognitive and functional abilities is important for early symptom detection and tracking disease progression over time. The Everyday Cognition (ECog; Farias et al., Reference Farias, Mungas, Reed, Cahn-Weiner, Jagust, Baynes and Decarli2008) scale was developed specifically to measure cognitively relevant functional abilities across six domains (Everyday Memory, Language, Visuospatial Abilities, Planning, Organization, and Divided Attention). Previous work in a fairly demographically diverse cohort has supported the construct validity of these domains (Farias et al., Reference Farias, Mungas, Reed, Cahn-Weiner, Jagust, Baynes and Decarli2008), which are differentially related to neuropsychological domains and regional brain volumes (Farias, Quitania et al., Reference Farias, Quitania, Harvey, Simon, Reed, Carmichael and Mungas2013), applicable to a wide range of impairment levels, sensitive to early and subtle changes in mild cognitive impairment (MCI) (Farias et al., Reference Farias, Mungas, Reed, Harvey, Cahn-Weiner and Decarli2006, Reference Farias, Mungas, Reed, Cahn-Weiner, Jagust, Baynes and Decarli2008), and predict development of MCI and dementia (Farias et al., Reference Farias, Lau, Harvey, Denny, Barba and Mefford2017; Farias, Mungas, Reed, Harvey, & Decarli, Reference Farias, Mungas, Reed, Harvey and Decarli2009). However, the degree of measurement bias in the ECog related to race/ethnicity is unknown.
Measurement bias is an important concern in the assessment of diverse populations. Bias is present when a person’s true level of function is systematically overestimated or underestimated in groups defined by demographic characteristics like race/ethnicity. Methods for detecting and quantifying differential item functioning (DIF) are commonly used to evaluate measurement bias. Valid inferences about individual differences in attributes/abilities of persons from diverse groups cannot be made unless the attributes relate to observed test scores in the same way across the different groups (Gregorich, Reference Gregorich2006). In this study, we directly evaluated measurement bias in the ECog, a critical consideration for an instrument that is intended for use in older adults from diverse racial and ethnic backgrounds.
The goals of this study were to (1) evaluate the degree to which the ECog provides an unbiased assessment of functional abilities across three ethnoracial (ER) groups of older adults [non-Hispanic White (NHW), Hispanic, and Black] and (2) examine whether associations between ECog domains and external validation criteria differed across ER groups and if measurement bias contributed to such differences. We first examined whether each of the six ECog domains demonstrated evidence of DIF across the three ER groups and evaluated the impact of item-level DIF on domain-level scores. Next, we evaluated cross-sectional and longitudinal associations between the ECog and neuropsychological function and neuroimaging measures of brain atrophy across groups. In particular, we were interested in determining whether controlling for DIF would help improve those relationships. The primary hypothesis for our first goal was the null hypothesis that measurement noninvariance was not present. The primary hypothesis for our second goal was that relations with external outcomes were not affected by DIF.
METHODS
Participants
Participants in this study were enrolled in the University of California, Davis (UCD) Longitudinal Diversity Cohort. This cohort approximates the diverse racial, ethnic, socioeconomic, and cognitive function (from normal to mildly impaired to demented) composition. Cohort composition and recruitment methods are described in Hinton et al. (Reference Hinton, Carter, Reed, Beckett, Lara, DeCarli and Mungas2010). Inclusion criteria included age 60 or older at their first examination and ability to speak English or Spanish. Exclusion criteria included unstable major medical or psychiatric illness (including active substance abuse/dependence).
Participants had at least one ECog measurement. This included 1177 NHW, 243 Black, and 216 Hispanic older adults. Many participants had neuropsychological testing at the time the ECog was collected (N = 760) and a substantial percent had longitudinal neuropsychological testing (N = 621). Neuroimaging was available for 740 participants, of which 427 had longitudinal imaging. Participants received clinical evaluations on an annual basis that included diagnosis, based on standard diagnostic criteria (Morris et al., Reference Morris, Weintraub, Chui, Cummings, Decarli, Ferris and Kukull2006), of normal cognition versus MCI versus dementia. All participants signed informed consent, and all human subject involvement was overseen by institutional review boards at UCD and affiliates.
Measurements
Everyday cognition
The ECog scale is an informant-rated questionnaire of cognitively based everyday abilities. It was designed to be sensitive to mild functional limitations that predate dementia and loss of independence (Farias et al., Reference Farias, Mungas, Reed, Cahn-Weiner, Jagust, Baynes and Decarli2008). The ECog comprises 39 items on which the participant’s current level of everyday functioning is compared to their own baseline (referenced as 10 years earlier). Items are rated on a four-point scale: 1: better or no change compared to 10 years earlier; 4: consistently much worse (see Supplementary Table 1). Higher scores indicate greater functional limitations. The ECog has good test–retest reliability (r = .82, p < .001) (Farias et al., Reference Farias, Mungas, Reed, Cahn-Weiner, Jagust, Baynes and Decarli2008); confirmatory factor analysis has supported the theoretically proposed structure of the instrument (Farias, 2008), and it has been shown to discriminate between diagnostic groups (Farias – paper on short form of ECog) and to be related to objective measures of cognition and biomarkers of neurodegenerative disease (Farias, Park, et al., Reference Farias, Park, Harvey, Simon, Reed, Carmichael and Mungas2013).
Cognitive function
The cognitive outcomes included composite measures of episodic memory, semantic memory, executive function, and spatial ability derived from the Spanish and English Neuropsychological Assessment Scales (SENAS). The SENAS has undergone extensive development across race/ethnic groups (Mungas, Reed, Crane, Haan, & Gonzalez, Reference Mungas, Reed, Crane, Haan and Gonzalez2004; Mungas, Reed, Farias, & Decarli, Reference Mungas, Reed, Farias and DeCarli2005; Mungas, Reed, Haan, & Gonzalez, Reference Mungas, Reed, Haan and Gonzalez2005; Mungas, Reed, Marshall, & Gonzalez, Reference Mungas, Reed, Marshall and Gonzalez2000). The episodic memory composite score is derived from a multitrial word-list learning test (Mungas et al., Reference Mungas, Reed, Crane, Haan and Gonzalez2004). The semantic memory composite is derived from highly correlated verbal (object-naming) and nonverbal (picture association) tasks. The executive function composite includes category fluency, phonemic (letter) fluency, and working memory (digit-span backward, visual-span backward, and list-sorting). Spatial ability was measured using the SENAS Spatial Localization scale, which assesses the ability to perceive and reproduce two-dimensional spatial relationships.
Imaging measures
MRI baseline measurements have been described previously (e.g., Fletcher, Reference Fletcher and Chen2014; Lee et al., Reference Lee, Fletcher, Martinez, Zozulya, Kim, Tran and DeCarli2010). Briefly, structural MRI images were processed to remove the skull using an atlas-based method (Aljabar, Heckemann, Hammers, Hajnal, & Rueckert, Reference Aljabar, Heckemann, Hammers, Hajnal and Rueckert2009), followed by human quality control to provide generally minor cleanup if needed. Structural MRI brain images were then nonlinearly registered to a minimal deformation template synthetic brain image (Kochunov et al., Reference Kochunov, Lancaster, Thompson, Woods, Mazziotta, Hardies and Fox2001) adapted for the age range of 60 and above; the registration was performed by a cubic B-spline deformation (Rueckert, Aljabar, Heckemann, Hajnal, & Hammers, Reference Rueckert, Aljabar, Heckemann, Hajnal and Hammers2006). The segmentation of gray, white, and cerebral spinal fluid tissues was performed by an algorithm designed to enhance accuracy at likely tissue boundaries (Fletcher, Singh, Harvey, Carmichael, & DeCarli, Reference Fletcher, Singh, Harvey, Carmichael and DeCarli2012). White matter hyperintensity (WMH) volume was computed from accompanying intensity-normalized FLAIR images aligned to subject T1 MRI scans. We used a threshold-based approach, segmenting intensities greater than 2.0 standard deviations (SDs) above the mean of the normalized intensity distribution but locally modified using priors of location likelihood for WMH presence. This created a mask of WMH locations overlaid on native T1 MRI, whose volume gave WMH brain load. Total gray matter (GM) was calculated as the sum of the cingulum, frontal, occipital, parietal, and temporal regional GM. These regions were derived from standard regions of interests in the Mindboggle Atlas (Klein et al., Reference Klein, Ghosh, Bao, Giard, Hame, Stavsky and Keshavan2017). Hippocampal volume was the sum of left and right hippocampal volume regions.
For participants having at least two longitudinal structural MRI scan acquisitions, we computed measured change in total GM volume and hippocampal volume between the most widely separated time points. We used a tensor-based morphometry method designed to enhance sensitivity and specificity for biological change by incorporating estimates of likely tissue boundaries (Fletcher, Reference Fletcher and Chen2014; Fletcher et al., Reference Fletcher, Knaack, Singh, Lloyd, Wu, Carmichael and DeCarli2013) whose application to quantifying local longitudinal change has been fully described in recent previous work (Fletcher et al., Reference Fletcher, Gavett, Harvey, Farias, Olichney, Beckett and Mungas2018).
Statistical Analysis
The analyses in this study focused on evaluating (a) differential item functioning (DIF) of the ECog domains across NHW, Black, and Hispanic older adults and (b) impact of DIF on the association between the ECog and measures of cognition and brain imaging.
Differential item functioning
DIF analysis is often used to evaluate measurement invariance across different groups. DIF is present if individuals from two groups who have the same true ability have different probabilities of success on the item of interest. In the context of this paper, a domain-specific item of the ECog shows DIF if persons from different ER groups with the same level of independent function in the specific domain have different expected scores on the item. Figure 1 depicts a model of one form of DIF (uniform DIF) in relation to the ECog. It is expected that item response will be strongly related to the latent ability being measured; if not, the item is a poor measure of ability. An item is free of DIF related to an external variable like ER group (Figure 1) when group differences in the item response are due to group differences in ability. Conversely, an item demonstrates DIF when the group (ER) has an effect on item response that is independent of ability, that is, the item response is determined by both ability and an effect that will differ across groups. In Figure 1, Items 1 and 2 are DIF-free, while Items 3 and 4 have ER-related DIF.
The unobserved ability in each domain is shown in the oval at the top. The observed composite score and observed item response (Items 1–4) are depicted by boxes. Ethnoracial category can have direct effects on ability in each domain (solid arrow from ER to ability), which in turn influences item response. When ER effect on item responses is entirely due to effects on ability, an unadjusted composite score based on these items provides an unbiased estimate of ability. However, when ER has influences on some item responses independent of ability (dotted arrows to Items 3 and 4), these items have DIF and introduce bias.

Item-level DIF is present when an item has different relations to true ability in different groups. The impact of DIF at the test level is a complex function that represents the combined effects of the presence and direction of DIF on individual items. DIF analysis and adjustment for item-level DIF are important methods for assuring that a test-level score has the same relation to the underlying ability being measured in different groups. Importantly, groups may systematically differ in the underlying true ability being measured, and careful DIF analysis is a prerequisite to knowing that observed differences in test scores are not simply due to measurement bias. Also, a specific ability may have a different relation to an external outcome of interest in different groups even if there is no group-related bias in measuring that ability.
An unadjusted ECog score provides an unbiased estimate of true ability when there is no DIF present in items. However, if DIF is present for some items, the scale-level estimate of ability might be biased for at least one of the groups, that is, it might overestimate or underestimate true ability. Explicitly modeling group effects on item responses enables estimates of ability that are not biased by group differences in measurement properties. In essence, group-specific measurement models are developed that utilize empirically estimated parameters group-specific. However, DIF-free linking items, that is, items that have the same measurement parameters in the different groups, are required to establish a common metric across groups.
There are a number of methods to identify and estimate DIF (Teresi, Reference Teresi2006). For this study, we used an iterative multiple group confirmatory factor analysis approach for ordinal item scores patterned after Jones (Reference Jones2006) to identify items whose measurement properties differed across groups and to adjust scale scores for DIF. The iterative DIF evaluation process was as follows: (1) We started with a base multiple group model in which loadings and thresholds for all items were constrained to be equal across groups. The person-specific estimates of the ECog latent traits from this model were saved and used in subsequent analyses as unadjusted ECog scores. (2) In the first round of iterations, the loading and thresholds for one item at a time were freely estimated in the different groups (parameters for all other items were constrained to equality), and the model fit was compared to that of the fully constrained model; DIF was indicated by significantly better fit in the freely estimated model. (3) The next round of iterations started with a model in which items that showed DIF in the previous round were freely estimated in the two groups, but non-DIF items from the previous round were constrained to equality (round-specific base model). Equality constraints were then freed one at a time for each of these putative non-DIF items, and the fit of this more freely estimated model was compared with that of the round-specific base model to identify additional items with DIF. (4) Additional rounds of iterations were performed until items identified as having DIF did not change from the previous round. Person-specific estimates of the ECog latent traits from the final model that accounted for all empirically identified DIF were saved and used in subsequent analyses as DIF-adjusted ECog scores. All models were fit through the Mplus8 (Muthén & Muthén, Reference Muthén and Muthén1998–2017) platform using R version 3.4.1 (R Core Team, 2017) and the MplusAutomation module (Hallquist & Wiley, Reference Hallquist and Wiley2018) to control the sequence of iterations.
We evaluated DIF across ER groups for each of the six ECog domain scores. We identified the NHW group as the reference group and compared the Black and Hispanic groups with the NHW group in sets of separate analyses. The selection of NHW as the reference group was arbitrary and was primarily because the sample size of this group was substantially larger.
Association of ECog and Measures of Disease
Next, we evaluated whether adjusting for DIF would affect the association between the ECog and cognition/brain injury. Specifically, we evaluated whether DIF adjusted versusunadjusted ECog scores were more strongly associated with cognitive function (concurrent and longitudinal change in cognition) and brain injury as measured by brain imaging (cross-sectional and longitudinal change). A series of multilevel models in which baseline ECog scores, adjusted and unadjusted for DIF, were used to predict domain-specific baseline SENAS composite scores and global cognitive change averaged across domains. In the within part of the multilevel model, the four SENAS scores were regressed on time in study. This yielded person-specific estimates of baseline score (intercept random effect) and change over time (linear slope random effect). The intercept and slope random effects for the four SENAS variables were modeled in the between part of the model. Previous studies with this cohort have shown that the four slope random effects are highly correlated and are most effectively modeled as a global change second-order factor, whereas the intercepts are less correlated and are best modeled separately (Brewster et al., Reference Brewster, Melrose, Marquine, Johnson, Napoles, MacKay-Brandt and Mungas2014; Fletcher et al., Reference Fletcher, Gavett, Harvey, Farias, Olichney, Beckett and Mungas2018; Gavett et al., Reference Gavett, Fletcher, Harvey, Farias, Olichney, Beckett, DeCarli and Mungas2018; Melrose et al., Reference Melrose, Brewster, Marquine, MacKay-Brandt, Reed, Farias and Mungas2015). Consequently, the four intercept random effects and the global slope factor were regressed on ECog scores and covariates. The within and between parts of these models were estimated simultaneously. Similarly, multiple linear regression models were used to evaluate whether DIF adjusted versus unadjusted ECog scores were more strongly associated with three cross-sectional MRI measures and with annualized change in total GM and hippocampal volume. Each MRI measurement was adjusted by total intracranial volume and Blom standardized. Age at baseline, years of education, and gender were included as covariates.
Multiple group analyses were used to test whether ECog variable had different effects on cognitive and MRI outcomes in the ER groups. The same model was estimated in each of the three ER groups, but specific effects were alternately constrained to be equal in the three groups or were freely estimated. The difference in model fit between the constrained and freely estimated models was evaluated with the likelihood ratio difference test (Satorra & Bentler, Reference Satorra and Bentler2001) to determine if the more constrained model had significantly poorer fit, that is, if the effect of interest significantly differed across the three groups.
RESULTS
Descriptive Statistics
Demographic characteristics of the 1636 participants are shown in Table 1. NHW participants had the highest percentage of individuals with dementia (50%); Black and Hispanic participants had 25% and 37%, respectively. Within each domain, ECog average scores for NHW participants were significantly different between diagnostics groups (normal, MCI, and dementia). Among Black participants, all ECog scores were significantly different across normal versus dementia groups and dementia and MCI comparisons but were not significantly different between Normal and MCI for the Everyday Language, Memory, Planning, and Visuospatial domains. Among the Hispanic group, all ECog scores differed when comparing normal and dementia, and dementia and MCI but there were not significant differences between normal and MCI in any of the ECog domains, except for Everyday Memory (Table 2). After controlling for baseline diagnosis, all three ER groups had statistically different ECog scores across the six domains, with the exception of the Visuospatial domain in the NHW and Hispanic participants. In general, across the ECog domains, NHW participants had the greatest functional difficulties, followed by Hispanic participants, and Black participants had least impairment. In addition, after controlling for baseline diagnosis, the three groups differed significantly in their total GM (NHW participants had the largest volume, followed by Hispanic and then Black individuals) but not in total hippocampal volume. Black and Hispanic participants statistically differed in their total WMH levels at baseline after controlling for baseline diagnosis (both Black and NHW participants had greater WMH volume than Hispanic participants). Generally, the ECog scores were associated with age and years of education in NHW but were not associated with gender. There was very little association of the ECog scores with age, years of education, and gender in both minority groups (Table 3).
Participant characteristics at baseline

a NHW and Black, statistically different after controlling for baseline diagnosis, p < .05.
b NHW and Hispanic, statistically different after controlling for baseline diagnosis, p < .05.
c Black and Hispanic, statistically different after controlling for baseline diagnosis, p < .05.
d Total gray matter and total hippocampal volume residualized on total intracranial volume.
ECog across diagnostic groups. Average ECog scores across diagnostic groups (normal, MCI, and Dementia) by ethnoracial category

a Normal and MCI, statistically different after controlling for baseline diagnosis, p < .05.
b Normal and dementia, statistically different after controlling for baseline diagnosis, p < .05.
c MCI and dementia, statistically different after controlling for baseline diagnosis, p < .05.
ECog and key demographics. Association between age, education, and gender with each ECog domain

a p-value < .05.
Evaluation of DIF
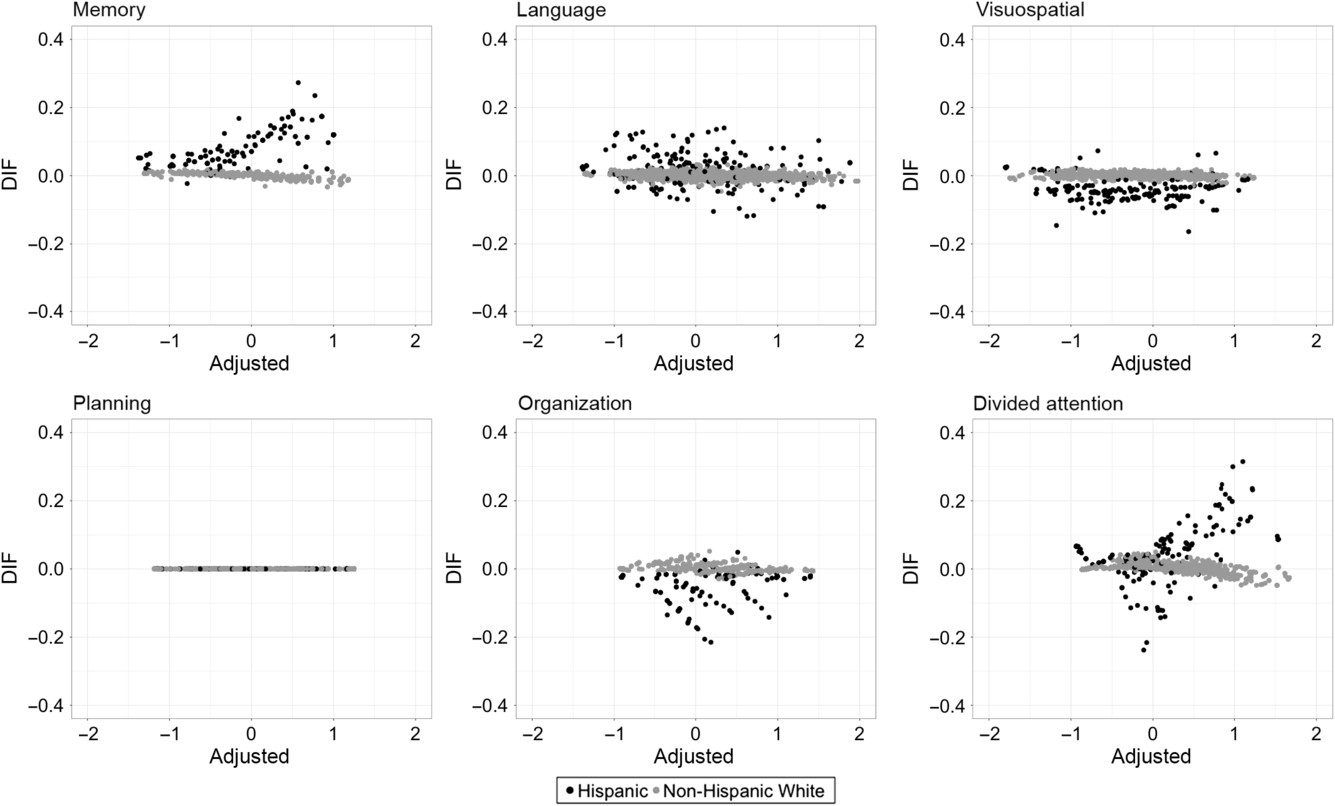
Figures 2 and 3 depict the degree of DIF for each ECog domain for Black (black dots) compared with NHW (gray dots) participants and Hispanic (black dots) compared with NHW (gray dots) participants, respectively. The Y-axis represents the difference between unadjusted and adjusted domain scale scores (unadjusted – adjusted), while the X-axis represents the DIF-adjusted score. The adjusted score is a better representation of true ability, so deviation from zero shows bias in the unadjusted score in relation from this estimate of true ability. Across both group comparisons, the overall impact of DIF was relatively small. For most measures, DIF-adjusted scores differed from unadjusted scores by less than .2 SD for almost all participants.
The degree of DIF for each ECog domain for Black participants (black dots) versus NHW participants (gray dots). The Y-axis represents the difference between unadjusted and adjusted domain scale scores (unadjusted – adjusted), while the X-axis represents the DIF-adjusted score.

The degree of DIF for each ECog domain for Hispanic participants (black dots) versus NHW participants (gray dots). The Y-axis represents the difference between unadjusted and adjusted domain scale scores (unadjusted – adjusted), while the X-axis represents the DIF-adjusted score.
Among Black participants (Figure 2), the greatest impact of DIF was observed in Everyday Visuospatial, Memory, and Language domains as compared to NHWs. For the Everyday Memory domain, there was a consistent underestimation of functional impairment, particularly with increasing level of impairment. However, the amount of bias due to DIF was small (<.2 SD). For the Everyday Language domain, DIF magnitude was small but Everyday Language was more often overestimated by unadjusted scores as degree of impairment increased. DIF adjustment had the biggest impact on Everyday Visuospatial scores with scores changing by nearly ±.40 SD for some individuals, but there was no consistent relation of DIF impact on this measure with level of impairment. The three everyday executive domains (Divided Attention, Planning, and Organization) showed minimal to no DIF in Black participants.
Among Hispanic participants, there was a somewhat different pattern of DIF impact. Similar to Black participants, there was relatively more DIF in the Everyday Visuospatial domain; however, functional impairment tended to be underestimated by unadjusted scores in those with lower levels of impairment and overestimated at the other end of the spectrum. The Divided Attention domain showed some degree of DIF impact in the Hispanic group, with unadjusted scores tending to overestimate impairment, particularly at the more impaired end of the spectrum. Unadjusted score for Planning tended to underestimate impairment, particularly at the more impaired end of the spectrum. In the Language domain, there was no consistent pattern of DIF with over- and underestimation of impairment. Within the Memory domain, unadjusted scores underestimate adjusted scores at all levels of impairment but the magnitude of differences was small. There was no DIF in the Everyday Organizational domain.
Association of ECog and Measures of Disease
Cognitive function
We next examined the association between the ECog domains and longitudinal cognitive domains among the three ER groups and whether those relationships were altered when controlling for DIF. In terms of the association between ECog domains and neuropsychological cognitive trajectories among the groups, a very similar pattern of results was obtained for each of the ECog domains. For illustrative purposes, data presented here utilize the ECog Memory domain and how it relates to the neuropsychological domains and global cognitive change (Table 4). Supplementary Table 2 includes results for the other ECog domains. The effect estimates and standard errors of the adjusted ECog Memory domain on cognitive intercepts and global cognitive change in the SENAS are presented in Table 4. There were significant cross-sectional associations between the ECog Memory domain and all of the neuropsychological measures (p-value < .001), with no significant differences between ER groups in these relationships. All three groups showed similarly strong cross-sectional/concurrent relationships between ECog Memory and neuropsychological functioning. When examining the association with ECog Memory and global cognitive change, there was a significant difference across the three groups (β NHW = −.070, β Black = −.040, β Hispanic = −.030, likelihood-ratio test p-value < .01), indicating that baseline ECog Memory was more strongly associated with changes in cognition in the NHW group than in the two minority groups. We then examined whether the associations between the ECog Memory and the four cognitive domains and global cognitive change were altered by adjusting for DIF. Here, we found no appreciable difference between the adjusted and unadjusted baseline ECog Memory scores in relation to their effect on cross-sectional and longitudinal neuropsychological performance. The effect estimates for unadjusted scores were highly similar to those for adjusted scores. Results were similar when comparing DIF adjusted and unadjusted scores for the other ECog domains. Thus, differences in the relationship between ECog and cognitive variables do not appear to be attributable to test bias of the ECog.
ECog and cognitive function

Note. Effect estimates and standard errors of both unadjusted (UnAdj.) and DIF-adjusted (Adj.) ECog Memory on cognitive intercepts and global cognitive change in the SENAS. Within each ethnoracial category, there were significant cross-sectional associations between the MEM domain and the SENAS across each SENAS domain.
a p-value < .001.
b Significant difference between ethnoracial groups.
Brain injury
Finally, we examined the association between ECog domains and three brain variables and whether adjusting for DIF altered that relationship. Of the 1636 participants used in this analysis, we had longitudinal brain imaging on 454 participants (roughly 1/3). Broken down by race/ethnicity, we had longitudinal imaging on 99/243 Black (∼40%), 94/216 Hispanic (∼43%), and 234/1177 NHW participants (20%). We adjusted for age at measurement, education, and gender in all analyses. In cross-sectional analysis (see Table 5), all or most of the ECog domains were related to the three brain imaging variables in the NHW and Hispanic groups. Among Black participants, ECog scores were related to hippocampal volume but not to total GM volume or WMH volume. When examining the relationship between baseline ECog scores and change in total GM volume and hippocampal volume, these relationships differed substantially across the three ER groups (Table 6). Among NHW participants, most ECog domains were consistently related to change in hippocampal volume but were not associated with change in total GM volume. In the Hispanic group, two of the ECog domains were associated with change in GM volume (ECog Memory and Visuospatial abilities) but none were associated with change in hippocampal volume. In Black participants, none of the ECog domains were associated with change in either brain imaging variable.
ECog and cross-sectional brain injury

Note. Brain injury cross-sectional: total gray matter, hippocampal volume, and white matter hyperintensity. DIF-adjusted effect estimates of association between total brain volume and each ECog domain, controlling for baseline age, education, and gender.
a p-value < .05.
ECog and longitudinal brain injury

Note. Brain injury longitudinal: total gray matter, hippocampal volume. DIF-adjusted effect estimates of association between total brain volume and each ECog domain, controlling for baseline age, education, and gender.
a p-value < .05.
Importantly, while there were group differences in the association between ECog domains and the brain variables across the three ER groups, the pattern of associations remained similar when adjusting for DIF. As such, this suggests that differences in the relationship between the brain variables and ECog domains do not appear due to instrument bias.
DISCUSSION
With the expected rising rates of AD and related disorders coupled with the increasingly diverse older adult population in the USA, it is imperative to have tools to accurately detect and monitor early functional changes across ER groups. This is essential as subtle changes in everyday functioning have been shown to be an early sign of AD and other neurodegenerative processes (Farias et al., Reference Farias, Lau, Harvey, Denny, Barba and Mefford2017; Lau, Parikh, Harvey, Huang, & Farias, Reference Lau, Parikh, Harvey, Huang and Farias2015). To this end, we evaluated the measurement invariance of the ECog across three ER groups (NHW, Black, and Hispanic). We further sought to determine if the relationships between the ECog and external measures of disease (cognition and brain structure) varied by group and whether this relationship was improved by adjusting for DIF. Overall, we found that the impact of DIF among the ECog domains was modest. On average, the amount of measured DIF was less than half a standard error of measurement. Such findings suggest that the relationship to ECog scores and underlying functional ability level is fairly similar across NHW, Black, and Hispanic participants. That said, there was some evidence of modest measurement bias in select ECog domains. For example, there was evidence of DIF among Black and Hispanic participants when compared to an NHW sample in the Everyday Visuospatial domain. There was not a very consistent pattern of under or overestimation of functional impairment in either group. Among Black participants, two other ECog domains showed the impact of DIF. The Everyday Memory domain underestimated functional impairment; the Everyday Language domain showed evidence of DIF but without a consistent directional effect. In contrast, among the Hispanic group, besides Everyday Visuospatial domain, Everyday Divided Attention overestimated impairment and the Everyday Planning domain underestimated impairment when not adjusting for DIF. In sum, there seemed to be the most consistent evidence of a relatively small degree of DIF particularly in the Everyday Visuospatial domain across both minority groups. The reason for this is unclear, but it could suggest this area of functioning may be less culturally relevant. Several of the items from the Everyday Visuospatial domain pertain to driving and navigational skill which could be influenced by socioeconomic factors. Other reasons to account for DIF across groups may related to difference in levels of support, expectations associated with aging, and coping styles (Fleishman, Spector, &Altman, Reference Fleishman, Spector and Altman2002).
Next, we sought to evaluate the strength of the associations between the ECog and other indicators of possible neurodegenerative disease including cognitive function and structural brain imaging and further determine if this relationship was strengthened by accounting for DIF. The strength of the cross-sectional relationship between ECog and neuropsychological abilities was very similar across the three ER groups. On average, the strength of these relationships was moderate, which is consistent with other literature examining associations between everyday abilities and neuropsychological performance (Royall et al., Reference Royall, Lauterbach, Kaufer, Malloy, Coburn and Black2007). The strength of the relationships between the ECog domains and a global measure of cognitive change was statistically significant among all groups (p < .01) but differed in strength, with the strongest association seen in the NHW group, the weakest in the Hispanic group, and intermediate in the Black group. Importantly, however, this pattern was not altered when we statistically accounted for DIF in ECog scores, suggesting that the different pattern of relationships among the ECog domains and change in global cognition across the groups is unlikely to be a function of test bias and instead may reflect real although, as yet, unexplained group differences. The reason why the relationship between the ECog and subsequent change in global cognition is not as tightly coupled particularly in the Hispanic group is not clear.
Associations between the ECog and regional brain volumes were also examined. Among the NHW group, there were consistent cross-sectional relationships between all ECog domains and the three brain volumes, with the strongest relationships with hippocampal volume, similar to some of our previous work (Farias et al., Reference Farias, Quitania, Harvey, Simon, Reed, Carmichael and Mungas2013). A similar pattern was seen in the Hispanic sample, with the exception of the association between the ECog and total GM. Among Black participants, significant cross-sectional relationships between all ECog domains were observed with hippocampal volume and across the memory and visuospatial domains with total GM but not with WMHs. Again, this pattern of relationships among ECog domains and brain variables remained unchanged when statistically adjusting for DIF. Finally, when examining the association between the ECog and subsequent change in total GM and hippocampal volume, among NHW participants the ECog was related to change in hippocampal volume, whereas in Hispanic participants, two of the ECog domains were related to GM change. Among Black participants, the ECog was not significantly related to change in either hippocampal or total GM volumes. This pattern of associations was also not altered when adjusting for DIF, suggesting that differing results across groups do not seem to be associated with test bias but rather true group differences. The reason for different patterns of relationships between the ECog and cognition and brain volumes is unclear but could reflect differences in the prevalence of underlying disease.
Strengths and Weaknesses
As with any study, there are strengths and weaknesses. This study utilized a fairly large and well-characterized sample of diverse older adults. We focused on the two largest minority groups in the USA, Black and Hispanic individuals. Hispanic individuals are known to be a diverse group. The majority of our Hispanic older adults are of Mexican or Central/South American origin, and it cannot be assumed that results of this study generalize to other Hispanic/Latino populations. Future work examining DIF in the ECog among other minorities will also be important. The present study utilized the informant-based ECog. There are biases inherent in informant report (Jorm, Reference Jorm1994; Teri, Reference Teri1997). There is also a self-report version of the ECog which was not the focus of this study which has been shown to be equally as good, if not slightly better than informant report in predicting the development of MCI (Farias et al., Reference Farias, Lau, Harvey, Denny, Barba and Mefford2017). An extension of the present work will extend our evaluation of the ECog among diverse populations to the self-report version.
Implications and Conclusions
The burden of AD and dementia disproportionally affects minority groups, including Black and Hispanic groups. Yet, early symptom recognition in these groups is poor and leads to suboptimal care. An important step to addressing this health disparity is the identification of sensitive and culturally appropriate tools for early detection of AD, symptom monitoring to assess disease progression, and responsiveness to treatment among diverse older adult populations. Changes in everyday functional abilities accompany even early cognitive changes and are a key component of the diagnosis of MCI and dementia. The ECog was designed to measure the presence of early functional limitations due to cognitive difficulties, and in early work we have shown that it is a useful tool for early disease detection and tracking disease progression (Farias et al., Reference Farias, Mungas, Reed, Harvey, Cahn-Weiner and Decarli2006, Reference Farias, Mungas, Reed, Cahn-Weiner, Jagust, Baynes and Decarli2008). While our previous work in this area utilized a racially/ethnically diverse cohort, we have not previously examined how the ECog performs across different ER groups. The current findings suggest that while there is some evidence of DIF in select ECog domains among select minority groups, the size of the DIF impact is relatively small and it does not alter the relationship between the instrument and other indicators of disease outcomes. Still, there may be room for improving the cultural applicability of the ECog across diverse groups. In particular, items within the Everyday Visuospatial domain could be a target of instrument improvement and revision and should be the focus of future work.
ACKNOWLEDGMENTS
This study was supported by the following grants from the National Institutes of Health (S.F., grant number AG056563-01; D.M., grant number AG031563-06A1; R.W., grant numbers AG050782 01A1, RF1 AG052132-02; and C.D., grant number P30AG10129).
CONFLICTS OF INTEREST
The authors have no conflicts of interest.
SUPPLEMENTARY MATERIALS
To view supplementary material for this article, please visit https://doi.org/10.1017/S1355617719001437



