INTRODUCTION
Conservation managers are faced with the task of choosing management strategies that will be most effective for achieving conservation goals (Polasky et al. Reference Polasky, Carpenter, Folke and Keeler2011). This task requires an understanding of specific ecological and socioeconomic contexts, and relationships between human behaviour and biodiversity conservation (Schultz Reference Schultz2011; Veríssimo Reference Veríssimo2013). Depending on the context, conservation managers and protected area authorities have to choose between different spatial approaches (e.g. site- versus landscape-based) and decide how best to allocate limited resources between conservation activities (e.g. increasing law enforcement within existing protected areas versus increasing interventions to change human behaviour) in order to improve the long-term conservation prospects of a species, population or ecological system of interest (DeFries et al. Reference DeFries, Hansen, Turner, Reid and Liu2007; Hansen & DeFries Reference Hansen and DeFries2007).
Identifying appropriate management strategies also requires information about the potential consequences of management choices (Peterson et al. Reference Peterson, Cumming and Carpenter2003; Parrott & Meyer Reference Parrott and Meyer2012). However, this crucial information is rarely available to conservation managers, thereby limiting their ability to develop strategies that are robust in the face of uncertainty inherent in dynamic systems such as regional landscapes (Parrott & Meyer Reference Parrott and Meyer2012). The development of a number of decision-support systems, including those based on decision theory, threshold analysis, resilience thinking and scenario planning, is therefore necessary. These systems can provide systematic frameworks to gain insight into ecosystem dynamics, possible future states and the likely impacts of different conservation activities (Wilson et al. Reference Wilson, Underwood, Morrison, Klausmeyer, Murdoch, Reyers, Wardell-Johnson, Marquet, Rundel, McBride, Pressey, Bode, Hoekstra, Andelman, Looker, Rondinini, Kareiva, Shaw and Possingham2007; Polasky et al. Reference Polasky, Carpenter, Folke and Keeler2011).
Scenario planning is a process that visualizes probable future conditions and assesses the potential impacts of alternative management options (Peterson et al. Reference Peterson, Cumming and Carpenter2003). It uses a few contrasting scenarios to explore the future consequences of conservation activities. By understanding how different conservation activities are likely to impact conservation goals, managers can then be in a better position to choose those that could be most effective. Scenario planning has been used to inform conservation planning and management in complex landscapes, for example, to explore the consequences of wildlife conservation and industrial logging in the Dzanga-Sangha landscape in the Central African Republic (Sandker et al. Reference Sandker, Semboli, Roth, Péllisier, Ruiz-Pérez, Sayerf, Turkalo, Omoze and Campbell2011). It is also increasingly used in combination with agent-based modelling, for example, scenario planning and agent-based simulations were used to inform sustainable management of maritime traffic activities for whale conservation in the St. Lawrence River Estuary, Canada (Parrott et al. Reference Parrott, Chion, Martins, Lamontagne, Turgeon, Landry, Zhens, Marceau, Michaud, Cantin, Ménard and Dionne2011), and to reconcile agricultural expansion, forest protection and carbon conservation in Indonesia (Koh & Ghazoul Reference Koh and Ghazoul2010).
An agent-based model is a computational model for simulating the actions of autonomous agents (individual or collective entities) and their often repetitive, competitive interactions between themselves and with the environment aimed at assessing their effects on complex systems (Bonabeau Reference Bonabeau2002). Agent-based modelling (ABM) is a powerful simulation modelling technique with applications in many real-life situations in different fields. In ABM, an individual agent evaluates its situation in relation to other agents and its environment and makes decisions based on a set of rules (Bonabeau Reference Bonabeau2002). Even a simple agent-based model can exhibit complex behaviour patterns and provide valuable information about the dynamics of the real-world system that it emulates. In addition, agents may be capable of evolving, allowing unanticipated behaviours to emerge. Agent-based models are increasingly used to study spatial and temporal patterns of human land use and their consequences on ecological systems (Bousquet et al. Reference Bousquet, Le Page, Bakam and Takforyan2001; Manson & Evans Reference Manson and Evans2007; Matthews et al. Reference Matthews, Gilbert, Roach, Polhill and Gotts2007).
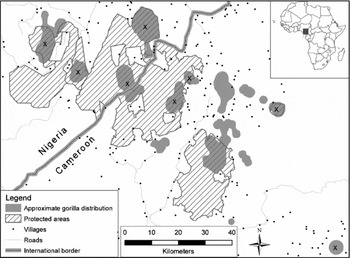
The Cross River gorilla Gorilla gorilla diehli (CRG) that we focus on in this study inhabits a complex, increasingly human-influenced landscape in the Nigeria–Cameroon border region, which forms part of the Gulf of Guinea forest, a global biodiversity ‘hotspot’ (Oates et al. Reference Oates, Bergl and Linder2004; Fig. 1). The population is small, with fewer than 300 individuals estimated to survive, restricted to 14 small hilly areas across a region of c. 12 000 km2 (Oates et al. Reference Oates, Sunderland-Groves, Bergl, Dunn, Nicholas, Takang, Omeni, Imong, Fotso, Nkembi and Williamson2007; Dunn et al. Reference Dunn, Bergl, Byler, Eben-Ebai, Etiendem, Fotso, Ikfuingei, Imong, Jameson, Macfie, Morgan, Nchanji, Nicholas, Nkembi, Omeni, Oates, Pokempner, Sawyer and Williamson2014) even though large areas of ecologically suitable habitat exist, due to human disturbance (Imong et al. Reference Imong, Robbins, Mundry, Bergl and Kühl2014 a). Hunting pressure in the region is high (Fa et al. Reference Fa, Seymour, Dupain, Amin, Albrechtsen and Macdonald2006) and poses a serious threat to the gorillas. Although gorillas are not targeted by hunters in the study area, they are hunted opportunistically and occasionally get caught in wire snares set for smaller game resulting in the loss of an estimated 1–2 individuals per year (Oates et al. Reference Oates, McFarland, Groves, Bergl, Linder, Disotell, Taylor and Goldsmith2003, Reference Oates, Sunderland-Groves, Bergl, Dunn, Nicholas, Takang, Omeni, Imong, Fotso, Nkembi and Williamson2007), which is a significant loss given the small size of the population and their relatively slow reproduction rate. Furthermore, although many subpopulations remain connected by forest, the functionality of putative dispersal corridors is threatened by increasing human disturbance (Imong et al. Reference Imong, Robbins, Mundry, Bergl and Kühl2014 b).
Map of the study area showing the approximate Cross River gorilla distribution and protected areas in the landscape. Gorilla localities currently protected are marked X.

Until recently, CRG conservation efforts focused on six areas including four government protected areas and two community managed forests, which together covered eight of the 14 small areas occupied by CRG (Fig. 1). Limited law enforcement and human behaviour change interventions (e.g. awareness campaigns, support for alternative livelihood activities and increased involvement of communities in conservation management) were implemented in these areas. Since 2007 there has been increasing promotion of a landscape-based approach to conservation of the CRG (Oates et al. Reference Oates, Sunderland-Groves, Bergl, Dunn, Nicholas, Takang, Omeni, Imong, Fotso, Nkembi and Williamson2007; Dunn et al. Reference Dunn, Bergl, Byler, Eben-Ebai, Etiendem, Fotso, Ikfuingei, Imong, Jameson, Macfie, Morgan, Nchanji, Nicholas, Nkembi, Omeni, Oates, Pokempner, Sawyer and Williamson2014) as a result of improved understanding of its distribution, ecology and conservation needs. The landscape-based approach emphasizes the importance of raising local awareness about the status of the CRG and the need for sustainable forest management, creating opportunities for alternative sustainable economic activities for local communities and promoting conservation activities in unprotected areas, in addition to law enforcement within protected areas and an increased research presence. There is also increasing collaboration between stakeholders in both Nigeria and Cameroon for joint implementation of transboundary activities (Dunn et al. Reference Dunn, Bergl, Byler, Eben-Ebai, Etiendem, Fotso, Ikfuingei, Imong, Jameson, Macfie, Morgan, Nchanji, Nicholas, Nkembi, Omeni, Oates, Pokempner, Sawyer and Williamson2014). However, there was little active conservation management in many unprotected areas where over a third of the CRG population and critical dispersal corridors were located. The long-term conservation of the CRG population requires management approaches that are effective in protecting the gorillas from hunting and other human disturbances as well as maintaining functional connectivity among subpopulations (i.e. individual spatially distinct aggregations of groups that may not necessarily be genetically distinct).
A constraint to accurate analysis of functional connectivity for fragmented populations of wide-ranging threatened species is the scarcity of detailed data on human activities that directly impact their survival, such as hunting and other human disturbances over large spatial scales. In order to overcome this problem, we used a spatially explicit agent-based model to simulate human pressure (a proxy for intensity of hunting and other human disturbances) in the study area, which complemented traditional satellite-derived land cover data. Using this approach allowed us to better account for hunting pressure and other human activities that are less detectable from satellite imagery and therefore permitted a clearer understanding of threats to functional connectivity of the CRG population. Accounting for the influence of hunting pressure in the analysis of connectivity is particularly useful in tropical forest environments where over hunting has depleted wildlife (especially large mammals) in many areas of otherwise intact forest (‘empty forest syndrome’; Redford Reference Redford1992).
We combined ABM with scenario planning to assess the effectiveness of alternative management scenarios for improving CRG habitat suitability and functional connectivity. Even though maintaining viable CRG populations is the ultimate goal of conservation efforts, we focused on habitat suitability and connectivity since modelling actual gorilla population numbers requires additional life history and demographic data currently not available (Bergl Reference Bergl2006). We contrasted scenarios in which conservation management focused on law enforcement within existing protected areas with scenarios where conservation interventions were extended to the whole study region and focused on changing human behaviour towards natural resource use.
METHODS
Study area
The study area covered the mountainous southern border region between Nigeria and Cameroon (longitudes E 8.7°–10° E; latitudes 5.6°–6.5°N) and included the entire known range of CRG as of 2010 (Fig. 1). It encompasses seven protected areas (predominantly intact tropical rainforest) as well as large areas of unprotected forest. Human population density in this region is among the highest in Africa, with some areas having 500 people per km2 (Oates et al. Reference Oates, Bergl and Linder2004), and this population is highly dependent on the forest. Pressure from hunting and collection of other forest products is currently high (Sunderland et al. Reference Sunderland, Besong, Ayeni, Sunderland, Comiskey and Sunderland-Groves2003; Fa et al. Reference Fa, Seymour, Dupain, Amin, Albrechtsen and Macdonald2006). The annual deforestation rate in the region was estimated at 3.7% between 2000 and 2010 (Food and Agriculture Organization of the United Nations 2010).
Data sources and processing
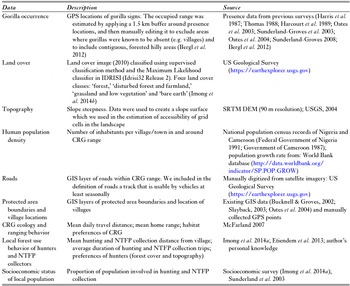
We integrated a number of data sets in this study including gorilla presence, land cover, topography, human population and road density, geographic information system (GIS) layers of locations of protected areas and villages, CRG ecology and ranging behaviour, local forest use and other socioeconomic data (Table 1).
Summary of type and source of data used in the agent-based model of human pressure. CRG = Cross River gorilla; GIS = Geographic information system; NTFP = Non-timber forest products.

The gorilla presence data from multiple years (Table 1) that we used did not differ from the current distribution of CRG, as more recent surveys showed continued presence of gorillas in all earlier known occupied areas (Bergl et al. Reference Bergl, Warren, Nicholas, Dunn, Imong, Sunderland-Groves and Oates2012). Applying a buffer around presence locations (Table 1) was necessary to account for gorillas occasionally using adjacent areas of suitable habitat. We chose a distance of 1.5 km for the buffer because it is roughly the mean daily travel distance of CRG (McFarland Reference McFarland2007) and represented a reasonable and conservative additional area that could have been used by the gorillas.
Model description
We used an agent-based model (Grimm et al. Reference Grimm, Berger, Bastiansen, Eliassen, Ginot, Giske, Goss-Custard, Grand, Heinz, Huse, Huth, Jepsen, Jørgensen, Mooij, Müller, Pe'er, Piou, Railsback, Robbins, Robbins, Rossmanith, Rüger, Strand, Souissi, Stillman, Vabø, Visser and DeAngelis2006; Matthews et al. Reference Matthews, Gilbert, Roach, Polhill and Gotts2007) to map relative human pressure in the study area, because no such data with sufficient spatial resolution were available for the study area.
We based the agent-based model on human population density, road density, accessibility of the landscape (factors known to influence intensity of hunting and other human activities; Oates et al. Reference Oates, McFarland, Groves, Bergl, Linder, Disotell, Taylor and Goldsmith2003, Reference Oates, Sunderland-Groves, Bergl, Dunn, Nicholas, Takang, Omeni, Imong, Fotso, Nkembi and Williamson2007; Kuehl et al. Reference Kuehl, Nzeingui, Yeno, Huijbregts, Boesch and Walsh2009) and known local forest use patterns. We simulated agents (‘hunters’ and ‘other forest users’) moving into the landscape from their villages (with the number of agents per village equalling its total number of inhabitants). The predominant forest-based livelihood activities in the study area are farming, collection of non-timber forest products (NTFPs) and hunting. A large proportion (70%) of the population in the study area collects forest products for consumption and sale (Sunderland et al. Reference Sunderland, Besong, Ayeni, Sunderland, Comiskey and Sunderland-Groves2003; Imong et al. Reference Imong, Robbins, Mundry, Bergl and Kühl2014 a). We distinguished between hunters and other forest users to reflect known differences between these two types of forest use. Hunters are known to travel longer distances and move into more difficult terrain where wildlife is likely to be more abundant (Sawyer & Brashares Reference Sawyer and Brashares2013; Imong et al. Reference Imong, Robbins, Mundry, Bergl and Kühl2014 a). We assigned 10% of agents (chosen randomly) to be hunters based on information from household interviews (Imong et al. Reference Imong, Robbins, Mundry, Bergl and Kühl2014 a) and personal knowledge. We did not consider sex and age of agents because all (except children and the aged) are involved in farming and NTFP collection.
All agents (hunters and other forest users) moved around in the landscape following a probabilistic random walk based on three rules, discussed below.
First, their likelihood of moving out of their current location (a cell sized c. 180 × 180 m of the simulated landscape) was proportionate to the total number of agents in the cell. At each step of the simulation, the decision to move an agent or not was made by randomly drawing from a binomial distribution (zero or one) with the probability of drawing a one equalling the number of agents in the cell divided by 11, whereby the number of agents in the cell was set to ten when it was larger. When a zero was drawn the agent stayed in the respective cell, otherwise it moved.
Second, all agents could move to each of the eight cells directly adjacent to their current cell, depending on the steepness of the terrain (agents preferred cells with more gentle terrain) and the direction in which they were moving (either away from or toward their home village). Specifically, the probability of moving into each of the eight cells was determined as the product of two values, one being a matrix with the accessibility of the cells, the other being a directional preference matrix determined from the distances of the cells from the agent's village of origin. As accessibility, we used the negative slope, normalized over the entire study area to a range from zero to one. Because humans prefer to walk along roads, we set the accessibility of cells with roads to equal one (rivers are not an important means of travelling in the study area, and sufficient information about the network of trails was not available to us). Cells without roads had a summed accessibility value of 0.5.
Third, to determine the direction of an agents movements, we first calculated the distance of each of the eight cells from the village of origin and then normalized these to range from zero to one. When the agent was moving away from its village of origin this revealed the directional preference matrix, but when it was approaching its natal village, one minus the normalized distances revealed the directional preference matrix. Constructing the directional preference matrix this way allowed us to give agents a preferred movement direction (away from or towards their village of origin). We randomly sampled the final cell into which an agent moved from the eight possible cells with the probability of moving into any particular cell being proportionate to the product of the two matrices. Agents were assigned predetermined distances from their village of origin which they had to reach before returning home. These distances were randomly chosen from a normal distribution with a mean of zero and a standard deviation of 10 km, chosen because in the study area most of the human activity originating from villages happens within c. 10 km (Etiendem et al. Reference Etiendem, Funwi-Gabga, Tagg, Hens and Indah2013; Imong et al. Reference Imong, Robbins, Mundry, Bergl and Kühl2014 a). When agents on their way home reached within three cells of their village of origin (540 m, roughly corresponding to the median radius of settlements in the study area) they changed their direction after a new distance to be reached was randomly chosen as above.
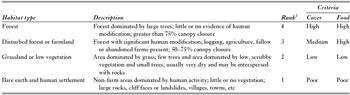
We specified two additional rules for the movement of hunter agents to differentiate them from the other agents (other forest users). First, hunter movements had to be in the direction away from their respective village of origin and toward a suitable area for hunting. This suitability was determined based on a 180 × 180 m map of 2010 land cover (Imong et al. Reference Imong, Robbins, Mundry, Bergl and Kühl2014 b) and served as a proxy for CRG habitat condition. Land cover types were categorized as bare earth (including human settlements and roads), grassland or low vegetation, disturbed forest or farmland, and forest. We assigned scores to the land cover categorizations based on suitability for CRG (Table 2). We averaged the ranked habitat suitability per cell and normalized the values across the entire study area to be between zero and one. We assumed that hunters preferred to move into areas with higher habitat suitability. For the second rule of movement, we derived a normal probability score based on the distance between each cell on the map and the village of origin (we assumed a mean of zero and a standard deviation of 10 km, as for the other agents), which we subsequently normalized to range between zero and one. The final goal for each agent was then one randomly chosen cell whereby the probability of a particular cell to be chosen depended on the product of its normalized habitat cover value and its normalized distance based probability score.
Ranking of land cover classes. 1Rank: 4 = highest, 1 = lowest suitability for gorillas.

Once hunters reached within five cells of their goal (c. 900 m), they stopped moving systematically and instead moved around in the area of the goal (within an area of c. 1 km2), whereby they preferred to move into cells with larger habitat scores. That is, from the eight immediately adjacent cells, one was randomly chosen such that the probability of choosing any one of the eight cells was proportionate to its habitat score. As with other agents, the probability that hunters moved out of their current cell or into a new cell was proportionate to the number of agents already in the cell. The time that hunters moved around in the vicinity of their goal was set to 10% of the time it took them to reach the goal. However, if they reached their goal after only a few time steps (such that 10% of the movement time was less than one time step), the time to move around was set to one time step of the simulation. After hunters had moved around the area of their goal for the determined time interval they headed back to their village of origin. When they reached within 540 m of the village location (see above) they were assigned a new goal.
We ran the simulation for 100 000 time steps. At each step, we saved the location of each agent, the average distance of the agents from their villages of origin, and also the proportion of agents that headed away from their village. The distance that all agents travelled from their village of origin and the proportion of agents that headed away from their village showed that the simulation stabilized after c. 2000 steps. Hence we discarded these first 2000 steps from further evaluation. Similarly, after every 100th simulation, the numbers of agents per cell in different simulation steps no longer correlated, therefore we only kept every 100th simulation, which we averaged to derive the final estimate of human pressure (i.e. average number of agents per cell). The resulting map was the basis for the simulation of different management scenarios, that is, we implemented them by altering the density of the agents per cell.
Modelling management scenarios
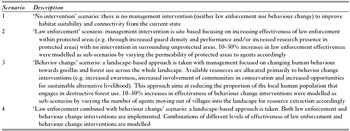
We developed four management scenarios: ‘no intervention’, ‘law enforcement’, ‘behaviour change’ and ‘law enforcement combined with behaviour change’ (Table 3).
Description of modelled management scenarios.

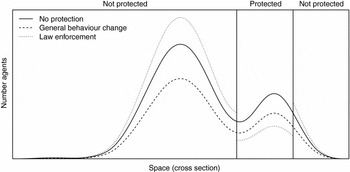
We modelled guard and researcher presence by modifying the number of agents in protected areas (PAs) or in the entire area, rather than introducing ‘non-harmful agents’ (guards and researchers) directly into the model to keep computation time and model complexity at a reasonable level. More specifically, we modelled the effect of varying investments into law enforcement (Scenario 2) by reducing the number of agents within PAs by the respective percentage. Subsequently we added the respective number of agents to cells in unprotected areas such that the increase in the number of agents per cell was proportionate to the number of agents already in it (i.e. more agents were allocated to cells that already had larger numbers of agents). In Scenario 3 (‘behaviour change’) the number of agents in each cell across the whole landscape was reduced by the respective percentage, and in Scenario 4 we decreased the number of agents inside PAs and also in the entire study area (Fig. 2). These modifications of the distribution and/or number of agents were done disregarding whether the agents were hunters or other forest users.
Visualization of the simulated effects of different scenarios. Shown is the number of agents (y-axis) along a fictional spatial dissection of the study area (x-axis) and a fictitious distribution of agents revealed from the agent-based model (solid line). Simulated law enforcement leads to a decrease in the number of agents within protected areas and a corresponding increase in the number of agents outside protected areas (whereby the increase per cell is proportionate to the number of agents already in the cell), whereas simulated human behaviour change leads to a decrease in the number of agents everywhere in the landscape (and proportionate to the number of agents in the cells).

Estimating functional connectivity and amount of suitable habitat
We measured cost-weighted distance (a GIS raster function that measures the cumulative cost of moving through grid cells in a landscape; Petit & Burel Reference Petit and Burel1998; Drielsma et al. Reference Drielsma, Ferrier and Manion2007; Drielsma & Ferrier Reference Drielsma and Ferrier2009) between areas occupied by gorillas as a indication of their functional connectivity (Imong et al. Reference Imong, Robbins, Mundry, Bergl and Kühl2014 b). The cost-weighted distance approach takes into account heterogeneous habitat in the landscape between habitat patches in contrast to Euclidean (linear) distance, which assumes a homogeneous landscape. To calculate cost-weighted distances we created two matrices describing suitability, one based on human pressure, the other on habitat type, which were ranked based on how much cover and food were provided for gorillas (Table 2). We normalized the habitat matrix to values theoretically ranging from zero to one, with one representing maximum suitability of cells for gorillas to move through (forest) and zero representing minimum suitability (bare earth). For this analysis we also normalized the human pressure matrix, by first truncating it per cell at five agents (to prevent the few cells with very large numbers of agents from having a disproportionately large influence). We then modified the number of agents per cell according to the different management scenarios (see above; Table 3) and finally normalized all human pressure matrices such that, across all scenarios, the maximum value per cell was one. Furthermore, we squared the values in both matrices to account for the likely larger effect of a change in suitability of cells with larger values (e.g. higher density of agents) compared to cells with smaller values. For example, in a cell with only a few hunters, the addition of one more hunter would have a larger effect on the suitability of that cell to gorillas than the addition of one more hunter to a cell already containing several hunters. Finally, we combined the two matrices (habitat type and human pressure) by multiplying them. Cost-weighted distances were calculated for the borders of pairs of gorilla occupied areas (between an occupied area and each of the other occupied areas), taking the shortest distance between two occupied areas as the final distance between them. To keep computation time reasonable we decreased the resolution of the original maps (human pressure 180 × 180 m; habitat 30 × 30 m) to c. 920 m by averaging cells. This cell size was considered appropriate because it falls within the range of daily travel distance of CRG (McFarland Reference McFarland2007).
To estimate the amount of suitable habitat we first determined the 95% quantile of the number of agents (of the original agent-based model) in grid cells within areas inhabited by gorillas (i.e. the maximum number of agents per cell in areas inhabited by gorillas; after exclusion of those 5% of cells with the largest number of agents). We then considered a cell as suitable when the number of agents it contained was below or equal to this value, given that human pressure and not food availability determined current CRG distribution (Imong et al. Reference Imong, Robbins, Mundry, Bergl and Kühl2014 a). Hence, areas inhabited by gorillas represent those areas where human pressure is low enough for gorillas to live (suitable habitat). Finally, we determined the amount of suitable habitat in the landscape as the number of grid cells that meet this criterion.
For each scenario, we evaluated the potential amount of suitable habitat in the landscape and potential functional connectivity between CRG subpopulations in 5, 10 and 15 years from baseline (2010). To account for future changes in human population density in the study area, we incorporated estimated human population density for each of the three periods into the analysis (estimated based on a mean population growth rate of 2.7% for the study region obtained from World Bank database: http://data.worldbank.org/indicator/SP.POP.GROW).
Model implementation
The agent-based model, processing of maps and cost-weighted distance calculations were implemented in R (R Development Core Team 2011; version 2.14.1). Reading of geographical shapefiles was carried out using the Read and Write ESRI Shapefiles package (Stabler Reference Stabler2006). The splancs package (Rowlingson & Diggle Reference Rowlingson and Diggle1993) was used for determining whether pixels were in or outside protected areas. Cost-weighted distances were derived using the costDistance function of the gdistance package (Van Etten Reference Van Etten2011) and parallelized using the R parallel package (R Development Core Team 2011).
RESULTS
Impact of alternative management scenarios on functional connectivity
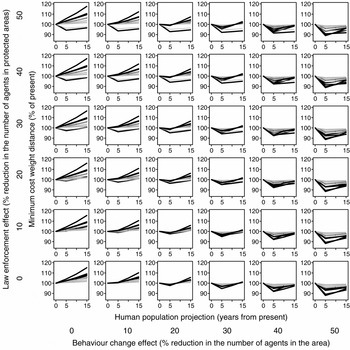
With no increase in law enforcement and behaviour change interventions, functional connectivity among most subpopulations decreased drastically over the 15 year period (Fig. 3, bottom left panel). Increasing only law enforcement effectiveness (i.e. reducing the number of agents in protected areas; Scenario 2) by up to 30–50% improved functional connectivity between only a few subpopulations and only when the number of agents within protected areas was reduced by at least 20% (Fig. 3, left panel). However, for most populations connectivity decreased, obviously because a reduction of the number of agents inside protected areas leads to a corresponding increase in the number of agents outside of the area. Only increasing effectiveness of behaviour change interventions across the landscape (i.e. reducing the proportion of agents moving into the landscape for hunting and other destructive forest activities; Scenario 3) by 30–50% improved functional connectivity of most subpopulations and seemed sufficient to maintain the current level of connectivity between some subpopulations over the entire 15 year period and beyond (Fig. 3, bottom panel). However, for some subpopulations this was not sufficient to maintain improvements in functional connectivity beyond the first 5 years. In fact, connectivity of some subpopulations that had improved from the baseline level during the first 5 years began to decrease again. Even though connectivity did not reach baseline levels again over the modelled 15 year period, there were indications that on an intermediate time scale (<20–30 years), even drastic behaviour changes would be completely outweighed by human population growth. Scenarios combining law enforcement and behaviour change interventions were most effective in improving functional connectivity (Scenario 4; Fig. 3, plots in the top right panels). For example, at 30–50% law enforcement and behaviour change effectiveness, functional connectivity of most subpopulations improved and was maintained over the 15 year period (Fig. 3).
Influence of law enforcement (ranger patrolling to deter poaching agents) and behaviour change (reduced poaching) interventions on functional connectivity of Cross River gorilla habitats (measured as percentage change in cost-weighted distance between occupied areas; y-axis of individual plots). The simulation considered projected human population growth over 15 years (x-axis of individual plots). Habitat connectivity decreases with increasing cost-weighted distance values (y-axis of individual plots). Each individual plot represents a scenario from ‘no intervention’ to 50% effectiveness (i.e. 50% decrease in poaching agents) of law enforcement (bottom to top) and behaviour change interventions (left to right) and varying combinations of law enforcement and behaviour change. Each line represents the change in the minimum cost-weighted distance over time between a given Cross River gorilla population and any other. Black lines depict populations located within protected areas.

Impact of alternative management scenarios on habitat suitability
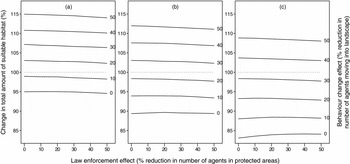
Increasing law enforcement within protected areas did not increase the total amount of suitable habitat in the study area. As in the case of functional connectivity, a landscape approach with increased intervention in unprotected areas (i.e. interventions to increase behaviour change) was more effective in improving habitat conditions and increasing the amount of suitable habitat in the landscape (Fig. 4). Over the first 5 years, a 20% reduction in the proportion of the population engaging in destructive forest activities (20% behaviour change effect) improved habitat conditions by 15% (Fig. 4 a). However, due to a high estimated increase in human population density over the latter two periods (10 and 15 years from baseline), this level of human behaviour change was not sufficient to improve or maintain habitat conditions. Over 10 years, habitat suitability decreased slightly from baseline (Fig. 4 b), and by a greater magnitude over 15 years (Fig. 4 c). Greater change in human behaviour towards forest resource use was needed to improve or maintain habitat suitability.
Effects of increased law enforcement (% reduction in number of poaching agents in protected areas; x-axis within individual plots) and behaviour change interventions (% reduction in number of agents involved in destructive forest activities; different lines within individual plots; y-axis on the right hand side) on the amount of suitable habitat in the study area (y-axis on the left hand side) over (a) 5 years, (b) 10 years and (c) 15 years. The grey dotted line at 100% depicts current habitat suitability. Note that law enforcement had a minor (and usually negative) effect on overall habitat suitability, whereas human behaviour change positively affected habitat suitability (elevation of lines per plot). Note also that only large behaviour changes could maintain current habitat suitability or even improve it in the long term (lines above dotted grey line).

DISCUSSION
We demonstrated that in the case of the CRG, focusing mainly on law enforcement within existing protected areas (which make up only c. 25% of the total forest area in the study area), that without considerable behaviour change and other management interventions in the surrounding landscape there will be a decrease in functional connectivity among subpopulations (Fig. 3). We found that under the law enforcement scenario (Scenario 2 in Table 3) only a few subpopulations will remain functionally connected as they are now over the next 15 years, even at high levels of law enforcement (Fig. 3). Similarly, the law enforcement scenario led to a decrease in the amount of suitable habitat in the study area over the simulation period (Fig. 4). These results can be explained by the increased agent density in unprotected areas due to increased law enforcement within protected areas – an effect which should be considered in conservation planning and management of fragmented populations where some subpopulations and important movement corridors occur outside protected areas.
Conversely, our model indicated that influencing human behaviour at the landscape-level has greater potential to improve habitat conditions and functional connectivity (Fig. 3 and 4). An explanation for this result could be that behaviour change leads to a reduction in the proportion of the local human population that engages in destructive forest activities, thereby reducing human pressure both within and outside protected areas. Overall, the best scenarios were when both law enforcement and behaviour change increased since the impact of behaviour change on connectivity increased with increasing law enforcement effectiveness. It has been argued that conservation can only be achieved by changing human behaviour (Schultz Reference Schultz2011). Promoting behaviour change can improve law enforcement and management of natural resources by local communities (Andriamalala et al. Reference Andriamalala, Peabody, Gardner and Westerman2013; Veríssimo Reference Veríssimo2013).
Model caveats
As much as possible, we based the rules and settings of the model (e.g. the distinction between hunters and other forest users, the distance from their village of origin at which agents turned back home or the rule according to which agents decided to move on or stay in their current cell) on available data and personal knowledge of the study area. Furthermore, the main aim of the model was to provide a map of the relative human pressure (amount of human activities) in the study area. Hence, the key feature of the simulated map was the average number of agents in any given cell in relation to the average number of agents in other cells, but not the absolute number of agents (which is certainly unrealistic). Since a visual inspection of the derived map revealed that this relative number of agents closely followed the expected patterns (e.g. more agents closer to villages and roads and in more densely human populated areas), we believe that our results were largely robust with regard to the particular details of the movement rules.
CONCLUSIONS AND POLICY IMPLICATIONS
With the high and rapidly increasing human population density in the study area, law enforcement within existing protected areas alone is unlikely to sufficiently reduce human pressure on gorilla habitat. Promoting behaviour change and thereby reducing the proportion of the population that constitutes a threat to the gorillas and their habitat should become a main focus of management in addition to law enforcement. Such behaviour change could be achieved through increased conservation awareness, a focused and sustained CRG campaign, increased opportunities for alternative sustainable economic activities, as well as greater involvement of local communities, governments, corporate bodies, development agencies and other stakeholders in conservation planning and management.
The landscape-based approach to conservation being implemented in the study area (Dunn et al. Reference Dunn, Bergl, Byler, Eben-Ebai, Etiendem, Fotso, Ikfuingei, Imong, Jameson, Macfie, Morgan, Nchanji, Nicholas, Nkembi, Omeni, Oates, Pokempner, Sawyer and Williamson2014) should be maintained, with increased focus on behaviour change actions. This approach has been shown to be effective in other regions (Painter et al. Reference Painter, Alves, Bertsch, Bodmer, Castillo, Marques, Noss, Painter, de Deus, Puertas, de Queiroz, Varese, Venticinque and Wallace2008; Stokes et al. Reference Stokes, Strindberg, Bakabana, Elkan, Iyenguet, Madzoké, Malanda, Mowawa, Moukoumbou, Ouakabadio and Rainey2010; Yanggen et al. Reference Yanggen, Angu and Tchamou2010). Our results also highlight the need for additional protected areas, which include corridors, to enhance connectivity of the CRG population.
Our modelling approach allowed for increased understanding of potential future changes in CRG habitat availability and functional connectivity under different management interventions. While this study focused on the CRG, our approach can be applied to other species living in small, fragmented populations in human-dominated landscapes. However, for results to be relevant for conservation planning, studies adopting this approach should consider and integrate relevant ecological and anthropogenic factors that influence habitat suitability and dispersal of target species as well as known socioeconomic and other drivers of habitat disturbance in their analysis.
ACKNOWLEDGEMENTS
We thank the Wildlife Conservation Society (WCS-Beinecke African Scholarships), Max Planck Society, Rufford Small Grants Foundation, Primate Conservation, Inc. and Wildlife Conservation Network for financial support for this project.