INTRODUCTION
Cotton is a row crop with an indeterminate growth habit that is extremely vulnerable during the reproductive stage, due mainly to harsh environmental conditions. In general, even moderate stresses can terminate reproductive development by disabling pollen vectors, or by causing sterility, asynchrony in pollen and ovule production or even abortion of reproductive structures (Chiariello & Gulmon Reference Chiariello, Gulmon, Mooney, Winner and Poll1991). Ovule fertilization in cotton is a critical process closely determining the successful production of the crop. According to Ritchie et al. (Reference Ritchie, Jost, Brown and Bednarz2005), anything that can reduce egg and pollen viability or pollen tube growth in a flower can adversely affect the final yield of that boll.
Polyamines are intimately involved in successful reproductive development; they were first accepted as plant growth regulators at the International Conference of Plant Growth Substances in 1982 (Davies Reference Davies1987). These metabolites are organic polycations involved in cell proliferation and differentiation, and they can act as regulators of many physiological processes including flower induction (Evans & Malmberg Reference Evans and Malmberg1989; Faust & Wang Reference Faust and Wang1992; Bagni et al. Reference Bagni, Altamura, Biondi, Mengoli, Torrigiani, Roubelakis-Angelakis and Tran Thanh Van1993; Kakkar & Rai Reference Kakkar and Rai1993; Bouchereau et al. Reference Bouchereau, Duhaze, Martin-Tanguy, Guegan and Larher1999). Polyamines are known to be involved in flower development, and also in cell division and DNA replication (Bais & Ravishankar Reference Bais and Ravishankar2002).
Putrescine (Put) is the precursor of spermidine (Spd) and spermine (Sp) (Kao Reference Kao1997), which are common polyamines. The biosynthesis of common polyamines consists of the synthesis of the diamine Put, and the formation of Spd and Sp resulting from propyl-amino addition to the Put precursor (Palavan-Ünsal Reference Palavan-Ünsal1995). In higher plants, Put is synthesized from either ornithine or arginine by reactions catalysed by ornithine decarboxylase or arginine decarboxylase, respectively (Kao Reference Kao1997). Polyamines are found in every plant cell ranging from 10 μm to approximately millimolar contents and they occur in the free form or conjugated forms with phenolic acids, and bound forms with other low-molecular-weight compounds or macromolecules (Galston & Kaur-Sawhney Reference Galston and Kaur-Sawhney1980).
Free polyamines have been quantified in a variety of plants such as tobacco and grapevine (Paschalidis & Roubelakis-Angelakis Reference Paschalidis and Roubelakis-Angelakis2005a, Reference Paschalidis and Roubelakis-Angelakisb; Paschalidis et al. Reference Paschalidis, Moschou, Toumi and Roubelakis-Angelakis2009), olives (Olea europea L.) (Pritsa & Voyiatzis Reference Pritsa and Voyiatzis2004), tomatoes (Lycopersicum esculendum L.) (Fos et al. Reference Fos, Proano, Alavadi, Nuez, Carbonell and Garcia-Martinez2003), peas (Pisum sativum L.) (Carbonell & Navarro Reference Carbonell and Navarro1989) and arabidopsis (Arabidopsis thaliana L.) (Todorova et al. Reference Todorova, Sergiev, Alexieva, Karanov, Smith and Hall2006). However, limited information exists for cotton (Gossypium hirutum L.), with the only reports being on the occurrences of uncommon polyamines (norspermidine, norspermine, pentamine and hexamine) in cotton under heat stress (Kuehn et al. Reference Kuehn, Rodriguez-Garay, Bagga and Phillips1990) and on polyamine content just prior to rapid fibre elongation (Davidonis Reference Davidonis1995).
As previously mentioned, polyamines play an important role as regulators of many physiological processes including flower induction. In addition, lint yield and quality is affected by the fruiting pattern along the cotton plant (Gokani & Thaker Reference Gokani and Thaker2001; Bolek Reference Bolek2006). However, only limited information exists on the polyamine content and distribution along the cotton plant. This knowledge would allow a focus on flowers with higher yield potential for stabilization of yield variability. Therefore, it is hypothesized that polyamine content varies in flowers in the cotton plant, with a distinct nodal distribution related to reported yield distribution, and that genotypic differences on polyamine content in cotton may exist. The first objective of the present study was to quantify the nodal distribution of Put, Spd and Sp in the cotton ovules of first-position white flowers up the main stem of the cotton plant, and the second was to investigate differences among commercial cotton cultivars in ovarian polyamine content.
MATERIALS AND METHODS
Plant material
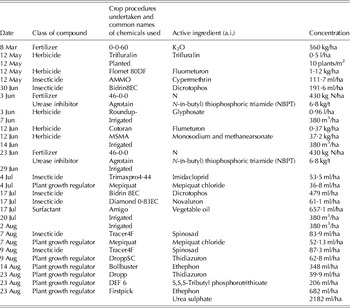
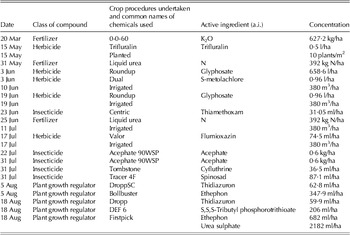
Field studies were conducted in 2005 and 2006 at the Lon Mann Cotton Research Station in Marianna in eastern Arkansas, USA (34°5′N, 90°5′W). The planting dates were 12 May 2005 and 15 May 2006. The cultivars used were Deltapine 444BR (hereafter abbreviated to DP444BR), Stoneville 5599BR (ST5599BR) and Fibermax 960BR (FM960BR). The soil was a Zachary silt loam, fine-silty, mixed, active, thermic oxyaquic fragiudalfs (Soil Survey Staff 2011). The experimental plot size was four rows×15 m. The study was furrow-irrigated based on an irrigation scheduler program (Cahoon et al. Reference Cahoon, Ferguson, Edwards and Tacker1990). The fertilization programme was determined by pre-season soil tests and recommended values for cotton, and weed and insect control were conducted according to Arkansas extension recommendations (Tables 1 and 2). At the first flower stage (15 July 2005 and 18 July 2006) the flowering node was determined and 10 first-sympodial fruiting position white flowers were collected from that node from each plot. The flower was sampled from the first-fruiting position because the weight of seed cotton in a boll varies among different fruiting sites on a sympodial branch with the first, second and third fruiting position contributing 0·60, 0·30 and 0·10 of the yield, respectively (Oosterhuis & Wullschleger Reference Oosterhuis, Wullschleger and Richter1988; Jenkins et al. Reference Jenkins, McCarty and Parrott1990). Sampling was performed weekly, from plants that had not been previously sampled, with first-position white flowers two nodes higher than the previous position, for a total of 4 weeks.
Schedule of irrigation, fertilization, weed and insect control followed in the present study in 2005. Spraying equipment were calibrated to deliver at a rate of 93·5 l/ha

T, tonne.
Schedule of irrigation schedule, fertilization, weed and insect control followed in the present study in 2006. Spraying equipment were calibrated to deliver at a rate of 93·5 l/ha

Polyamine analysis
Put dihydrochloride, Spd trihydrochloride, Sp tetrahydrochloride, hexamethylanediamine, dansyl chloride, 871·1 g/l acetone and sodium carbonate were purchased from Sigma Aldrich (St. Louis, MO, USA).
Polyamines were extracted based on a procedure described by Smith & Davies (Reference Smith and Davies1985) with modifications needed for cotton. Cotton ovaries were separated from petals and sepals. Ovary tissue (0·1 g) was homogenized in mortars with pestles in 0·2 N perchloric acid (HClO4). For unfortified (i.e. samples with no specific quantities of polyamines added) samples, 100 μl 1 mM hexamethylanediamine in 0·2 N HClO4 was added to the tissue prior to the homogenization as an internal standard. The final volume of 2 ml was obtained by adding 1900 μl 0·2 N HClO4. For the fortified samples, 100 μl 1 mM hexanediamine in 0·2 N HCLO4 was added plus the desired volume of fortification solution in 0·2 N HClO4, which was 120 μl 1 mM of Put in 0·2 N HClO4, 120 μl 1 mM Spd in 0·2 N HClO4 and 120 μl 1 mM of Sp in 0·2 N HClO4. The final volume of 2 ml was obtained by adding 1540 μl 0·2 N HClO4. An aliquot of 1·5 ml of the homogenate was transferred to 2 ml plastic micro centrifuge tubes and the samples were centrifuged at 4°C for 20 min at 13 000 rpm.
The polyamines were derivatized by adding 50 μl aliquots of the supernatant to 500 μl 21·2 mM aqueous sodium carbonate (Na2CO3), 200 μl 871·1 g/l acetone and 50 μl of 12·5 mM dansyl chloride in acetone. The mixture was incubated in a thermal reaction block at 60°C for 1 h in the dark. After 1 h in the thermal block, the samples were removed and cooled to near room temperature, and 50 μl of 1 N HClO4 was added to the mixture and mixed. The samples were then centrifuged at 4°C for 20 min at 13 000 rpm after which 700 μl of centrifugate was transferred into 2 ml sample vials and 700 μl of 0·02 N HClO4 was added. The samples were capped and mixed before analysis using high-performance liquid chromatography (HPLC). Derivatization needs to be in a basic solution, whereas the final solution for HPLC needs to be acidic.
A total of six standards were used for the preparation of the standard curves. The standards included Put, Spd, Sp and the internal standard hexamethylanediamine. The content of Put and Spd in the six standards ranged from 30 to 1 nM/ml, whereas the content of Sp ranged from 60 to 2 nM/ml. A 500 μl aliquot of 1 mM hexamethylanediamine was added to the first five standards, while an amount of 1·25 ml of 1 mM hexamethylanediamine was added to the last one. The final volume was 10 ml for the first five standards and 25 ml for the final standard. To bring the standards to the final volume 0·2 N HClO4 was used.
HPLC analysis was performed in a Hitachi HPLC (Hitachi High Technologies America, Inc., Canada) system that included a model L-7100 pump, an L-7200 autosampler, a D-7000 interface, an ERC-3415a degasser and an L-7480 fluorescence detector. The column used in this analysis was a 250×2 mm id 0·5 μm Phenomenex Gemini C18. Injection volume was 40 μl. Polyamines were eluted from the column at 0·3 ml/min with a methanol:water (v/v) gradient from 553·7 g/l methanol to 922·5 g/l methanol over 6 min and then remaining at 922·5 g/l methanol for 16·4 min. The system was re-equilibrated with 553·7 g/l methanol for 15 min before the next injection. For dansyl polyamines, an excitation wavelength of 365 nm was used with an emission wavelength of 510 nm. Data collection and processing were with Hitachi System Manager software based on the internal standard content.
Statistical analysis
The experimental design used was a randomized complete block design with five replications. The treatment design was split-plot in strips (split-block) with main factors ‘cultivars’ that were randomly assigned to the experimental plots, and sub-factors ‘nodal position’ that could not be randomly assigned. The year effect was considered random and not included in the model. Data from each year were analysed and are presented separately. Statistical analysis was performed with the JMP 6 Software (SAS Institute Inc. 2005). Interactions and main effects were tested with analysis of variance at P⩽0·05. When significant effects were detected, means were separated with Student's t test (P⩽0·05).
RESULTS
There was no significant cultivar×nodal position interaction in either year. The P values of the interaction effect for Put were P=0·992 and P=0·569 for 2005 and 2006, respectively. For Spd the P values of the interaction effect were P=0·209 and P=0·347 for 2005 and 2006, respectively, and for Sp the P values of the interaction effect were P=0·430 and P=0·428 for 2005 and 2006, respectively. This lack of interaction allowed the main effects of ‘nodal position’ and ‘cultivar’ to be tested separately.
Nodal position effect on polyamine concentration of cotton ovaries
Put
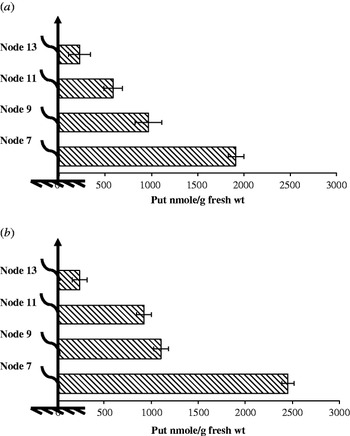
The nodal distribution of Put followed a similar pattern in both years of the study (Fig. 1). In 2005, there was a significant decrease in Put content acropetally along the main stem of the cotton plant (P<0·001) (Fig. 1(a)), with the highest content of Put observed at the 7th node (1913·7 nM/g fresh weight (FW)). The content decreased significantly at the 9th node and even more so at the 11th and 13th nodes. These data indicated that there was a clear pattern of Put titre decreasing significantly up the main stem of the cotton plant. Similarly, in 2006 the nodal position effect was significant for Put content (P<0·001) (Fig. 1(b)). Again the highest content was observed at the 7th node (2455·3 nM/g FW), and Put titre decreased significantly at the 9th and 11th nodes and even more so at the 13th node.
Effect of nodal position on Put content in cotton ovaries in (a) 2005 and (b) 2006. Bars represent s.e.m.

Spd
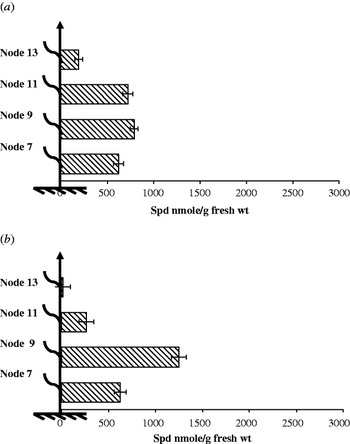
The nodal distribution of Spd followed the same pattern in both 2005 and 2006 (Fig. 2). In 2005, Spd content was significantly less below and above the 9th node (P<0·001) (Fig. 2a). The highest content of Spd was observed at the 9th node (793·9 nM/g FW). Node 11 showed numerically lower Spd titre compared with the 7th node. The content was significantly less at the 7th node compared with the 9th node and even more so at the 13th node. Similarly in 2006, the nodal position effect was significant for Spd content (P<0·001) (Fig. 2b), with the highest content again observed at the 9th node (988·56 nM/g FW). In 2006, the content of Spd decreased significantly at the 7th node and even more so at the 11th and 13th node. In both years tested the 9th node showed the highest amount of Spd and the 13th node the lowest.
Effect of nodal position on Spd content in cotton ovaries in (a) 2005 and (b) 2006. Bars represent s.e.m.

Spermine
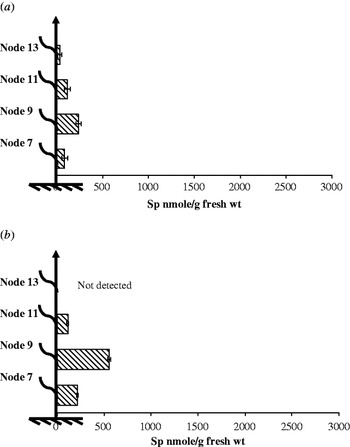
The nodal distribution of Sp was very similar to that of Sp and showed a similar pattern in both years (Fig. 3). In 2005, Sp content was significantly less below and above the 9th node (P=0·004) (Fig. 3a), with the highest content of Sp observed at the 9th node (237·7 nM/g FW). The titre was significantly less at the 7th, 11th and 13th node. Node 13 showed the smallest content (35·5 nM/g FW). Similarly, in 2006 the nodal position significantly influenced Sp content (P<0·001) (Fig. 3(b)). Again, the highest content (572·1 nM/g FW) was observed at the 9th node. In 2006, the content of Sp was significantly less at the 7th node and even more so at the 11th. In node 13, the amount of Sp in the ovary tissue was smaller than the lowest detectable limit for Sp by HPLC, i.e. c. 46 nM/g FW. In both years tested, the 9th node showed the highest amount of Sp and the 13th node the lowest.
Effect of nodal position on Sp content in cotton ovaries in (a) 2005 and (b) 2006. Bars represent s.e.m.

Cultivar effect on polyamine concentration of cotton ovaries
Put
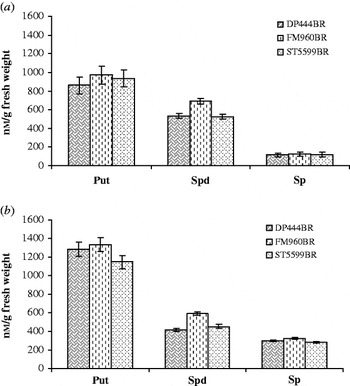
In both years, the cultivar effect on Put content was not significant, i.e. P=0·691 in 2005 and P=0·211 in 2006 (Fig. 4). There was a numerical increase of Put in FM960BR; however, it was not significant in either year tested.
Cultivar effect on Put, Spd and Sp content in cotton ovaries in (a) 2005 and (b) 2006. Bars represent s.e.m.

Spd
In 2005, there were significant cultivar differences on Spd content of cotton ovules (P=0·029; Fig. 4a). Means were separated with Student's t test (P⩽0·05) and showed that FM960BR had significantly higher Spd content compared with DP444BR and ST5599BR. Even though the cultivar effect was significant in 2005, it was not in 2006 (P=0·182) (Fig. 4b), although the trend in 2006 was the same as 2005.
Spermine
In 2005, the cultivar effect on Sp content of cotton ovules was not significant with P=0·945 (Fig. 4a). FM960BR showed slightly higher Sp content compared to the other genotypes, but this was not significant. In 2006, the cultivar effect on Sp content was significant (Fig. 4b). Overall, FM960BR showed significantly higher Sp content compared with ST5599BR and numerically higher Sp content compared with DP444BR.
DISCUSSION
In both years of the present study it was shown that Put content of cotton ovaries decreased significantly up the main stem of the cotton plant. The flowers collected from the 7th node showed the highest Put content, whereas the lowest content was observed at the 13th node. A similar pattern was observed with Spd and Sp, although the highest content of these polyamines was observed on the 9th node. These data showed that the highest amounts of polyamines in cotton ovaries from first-position white flowers were observed at the 7th and 9th nodes of the plant. This was evident in all the genotypes tested. Polyamines are involved in successful reproductive development in crops, and therefore, the higher polyamines content between the 7th and 9th main-stem nodes can probably explain findings from Oosterhuis & Wullschleger (Reference Oosterhuis, Wullschleger and Richter1988) and others that 0·80 of the total yield was derived from the central position of the canopy between the 6th and 10th main-stem nodes. In addition, cotton bolls derived from nodes in the centre of the plant are larger than bolls lower or higher on the plant (Jenkins et al. Reference Jenkins, McCarty and Parrott1990).
The distribution of Put and cadaverine has been reported in the radicle, hypocotyl and hypocotyl hook of soybean seedlings (Glycine max L.) (Lin Reference Lin1984). A spatial and temporal distribution of polyamine levels and polyamine anabolism has been conducted in different organs of tobacco (Nicotiana tabacum L.) (Paschalidis & Roubelakis-Angelakis Reference Paschalidis and Roubelakis-Angelakis2005a, Reference Paschalidis and Roubelakis-Angelakisb). Changes in free polyamine titres have been investigated during the growth of peach (Prunus persica L.) callus in vitro (Liu & Moriguchi Reference Liu and Moriguchi2007). The present study is the first report for the nodal distribution of Put, Spd and Sp in cotton ovaries. It has previously been mentioned that cotton suffers during reproductive development, mainly from harsh environmental conditions (Oosterhuis Reference Oosterhuis2002). This is reflected in excessive abscission of fruit and a reduction in boll size. The similar pattern of polyamine distribution in cotton ovaries up the main stem and the boll size and boll retention up the main stem would suggest that increasing polyamine concentration in the ovaries may improve boll retention and boll size. Therefore, exogenous application of polyamines may provide a means of improving yield productivity in cotton. These data showed that the main area of interest should be focused from the 7th to the 9th main-stem node for stabilization of yield variability, because these nodes contribute the majority of the yield and the highest fibre quality in the cotton plant (Oosterhuis & Wullschleger Reference Oosterhuis, Wullschleger and Richter1988). However, for yield increase attention should be given to higher nodal positions.
The cultivar effect on polyamine concentration was not clear. Even though FM960BR showed a trend for higher Spd content in both years compared with the other two cultivars, the effect was significant only in 2005. A similar pattern was observed with FM960BR for Sp content but the effect was significant only in 2006. These data showed that even though there is an indication of higher polyamines in FM960BR compared with the other cultivars, this effect was not consistent from year to year. The lack of significant differences among the commercial cultivars can be attributed to the narrow genetic pool of the current commercial cultivars. The results did not support the hypothesis about genotypic differences on polyamine concentration in cotton. Polyamine content among different cultivars have been quantified in diverse rice (Oryza sativa L.) cultivars (Lepri et al. Reference Lepri, Bassie, Thu-Hang, Christou and Cappell2002), whereas post-harvest changes in polyamines have been measured in two diverse rose (Rosa sp. L.) species (Sood & Nagar Reference Sood and Nagar2008). The present report is believed to be the first of cotton cultivar screening by quantifying polyamine distribution in ovarian tissue.
The present study has documented the pattern of free polyamine distribution in the cotton plant, supporting the hypothesis that polyamine content varied in flowers in the cotton plant, with a distinct nodal distribution related to reported yield distribution. Knowledge of the nodal distribution of a metabolite in a plant is of particular importance prior to conducting any research. In the case of polyamines, this knowledge allows an explanation of which nodes have higher yield potential. In addition, special care should be taken when sampling flowers for treatment comparison. It can be concluded from the present study that in cotton the first-fruiting positions between the 7th and 9th nodes have higher yield potential. All the factors adversely influencing the reproductive development of cotton should be carefully monitored, especially knowing that these nodes contribute 0·80 of the yield.