Implications
Selection of replacement pigs is common practice in pig farming and should improve the herd economically by improving performance. Incorporating economic aspects when selecting pigs helps ensure selection improves enterprise profitability and results in production and economic efficiency. The results from this study provide the producer with an insight on how much emphasis should be placed on each trait when selecting replacement animals. This approach of determining trait emphases uses the relationship of a trait with income or cost, thus ensuring that improvement in performance is translated to improved profits.
Introduction
Pig breeding programs aim to obtain a successive generation of pigs that will produce desired products more efficiently under future farm economic and social circumstances. This implies that pig breeding programs should make pig enterprises satisfy the producer and consumer, thus becoming profitable, competitive and sustain production. In a capitalist society, profitability is a logical unit of expression for the final evaluation of a pig (MacNeil et al., Reference MacNeil, Nugent and Snelling1997). Modern agriculture has thus shifted from production to productivity and sustainability (Olesen et al., Reference Olesen, Groen and Gjerde2000).
Genetic improvement should be done to those traits that improve enterprise profitability. Thus, economic relevance of traits in the breeding objective should be the primary concern of breeders; hence, should be considered and determined in any breeding program. Designing a comprehensive animal breeding program with a specific objective involves economic considerations (Charfeddine, Reference Charfeddine2010). The breeding program that involves incorporation of economic parameters into breeding objectives is of paramount importance as it ensures economic and production efficiency. Incorporation of economic parameters into breeding programs entails the computation of economic values for traits of economic importance. Therefore, economic values for all biological traits that have an impact on profitability should be calculated (James, Reference James1982).
In South Africa, genetic selection has mainly been based on estimated breeding values and, thus economic parameters have not been satisfactorily accounted for and incorporated into genetic selection programs. Economic values should therefore be derived in order to direct, optimize genetic selection and hence maximize profitability and improve the economic efficiency of selection programs for pigs. The purpose of this study is to integrate economic parameters into genetic selection programs for South African Large White pigs, by deriving economic values for sow productivity, growth and carcass traits.
Material and methods
Biological traits affecting profit
The sow productivity traits were number born alive (NBA), 21-day litter size (D21LS) and weight (D21LWT). NBA is directly related to the number of animals surviving to weaning, thus affecting the number of animals marketed. Twenty-one day litter weight affects post-weaning growth performance; hence production costs. Growth traits included in the analysis were average daily (lifetime) gain (ADG), feed conversion ratio (FCR), age at slaughter (AGES) and ultrasonic backfat thickness (BFAT), while carcass traits were lean content (LEAN) and dressing percentage (DRESS). Ultrasonic BFAT indicates the level of fatness; hence, it can be considered an indicator trait for LEAN. ADG is economically important to pig production as it is directly related to the number of days required to reach market weight; hence it affects production costs. The amount of feed consumed for a unit weight gain should be reduced to improve profits. Thus, FCR has been identified as an important variable in reducing production costs (See et al., Reference See, Zering and Robison1995). Even though LEAN should be improved, producers are also paid for carcass yield and hence the need to improve DRESS.
Base herd structure
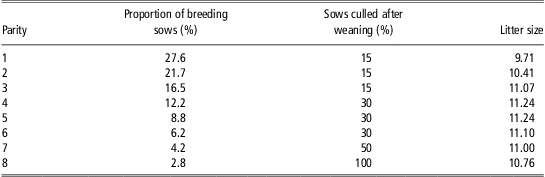
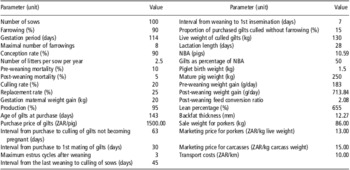
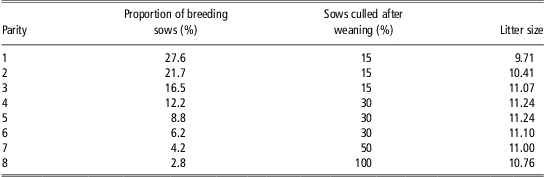
Two simulations, one for a sow productivity production system and the other for a terminal production system, were performed to derive economic values for the traits. In both simulations, maiden females were purchased at the age of 143 days and mated at the first estrus. Mating was by artificial insemination with purchased semen. Females that failed to conceive after three consecutive services were culled. Pregnant sows were fed according to the nutrient requirements for pregnancy with the standard sow meal. After a 114-day gestation period, the sows farrowed and the number of male and female piglets was assumed to be same. Male piglets were castrated at 10 days of age and referred as castrates. The lactating sow was switched to a lactation diet and creep feeding commenced when piglets were 13 days old until weaning at 28 days of age. After weaning, the sows were mated at the first estrus, while the piglets were fed on the growers’ meal. Productive sows were allowed to have a maximum of eight litters. In the simulation for the sow productivity system, growing and finishing commenced at 45 days of age for castrates until they reached 86 kg live weight, when they were slaughtered. Gilts started the growing and finishing phase at the age of 45 days until they reached 120 kg live weight, when they were marketed. Twenty-five percent of the gilts were kept as replacement females. For the terminal production system, growing and finishing commenced at 45 days of age until the gilts and castrates reached 86 kg live weight, when they were all slaughtered. Culled-sows were slaughtered 45 days after weaning so that they could be fattened. Table 1 shows proportions of breeding sows, sows culled and litter sizes per parity. The input parameters shown in Table 2 were obtained from the South African Pork Producers Association and the South African Meat Industry Company.
Proportions of sows, culled sows and litter size in each parity
Input parameters for the base herd structure

NBA = number born alive.
Source: South African Pork Producers Organization (2008).
Profit functions
A hypothetical 100 sow herd was used for convenience of calculations. Five pig categories were distinguished according to age: (1) piglets (0 to 28 days old); (2) weanlings (29 to 44 days old); (3) gilts (>45 days and ⩽120 kg); (4) castrates (>45 days and ⩽86 kg); (5) breeding sows (>120 kg).
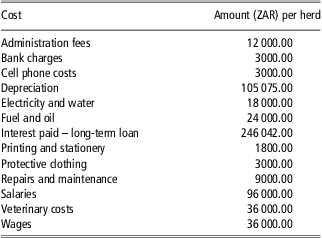
Total annual profit of the herd was derived as the difference between costs and revenues of the system. All costs and prices are expressed in South African Rand (ZAR) and the time unit is 1 year, assuming 2.5 litters/sow per year. The inputs for the production system were feed (creep, grower and finisher and sow meal), management (i.e. labour, spraying or dipping and veterinary services), marketing (i.e. transport of pigs) and fixed costs (housing, electricity, stationery and interests). These costs, excluding feed costs, are shown in Table 3. The outputs were the revenues from sale of porker and cull-sow carcasses and maiden gilts. Supply of labour by the farmer was set to be fixed per pig per year but varied with the size of the herd. It was considered equal for all pig categories except for replacement stock. Replacement stock was assumed to need less care than the young stock and breeding pigs, thus it was considered to require half the amount of labour per pig. Veterinary care was assumed to be optimal and therefore, reasonable average costs have been used. Other costs not related to herd size were included in the fixed costs. Mating was done by artificial insemination and, cost of semen and insemination costs were included in the veterinary costs.
Estimated annual variable and fixed costs of production, excluding feed costs
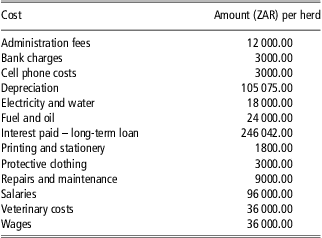
Source: South African Pork Producers Organization (2008).
Total annual profitability of the herd (T h) was described by
 $${{T}_{\rm{h}}}\: = \:\left[ {{{N}_{\rm{e}}}\:\times \:({{R}_{\rm{e}}}\:{\rm{ - }}\:{{C}_{\rm{e}}})} \right]\:{\rm{ - }}\:{{C}_{{\rm{FCH}}}}$$
where N e is the number of sows in the herd per year, R e is average revenue per sow per year, C e is average variable costs per sow per year and C FCH is fixed costs for the herd per year. The revenue (R e) was calculated from the sale of carcasses and maiden gilts:
 $${{R}_{\rm{e}}}\: = \:\mathop{\sum}\limits_{i\: = \:3}^5 {\left[ {{{N}_i}\:\times \:{{f}_i}\:\times \:(1\:{\rm{ - }}\:{{m}_i})\:\times \:{{I}_m}} \right]} $$
where i in this and the following equations refers to pig category, N in this and the following equations refers to number of pigs, f the fraction of pigs/carcasses that are marketed, m the mortality rate of pigs (%). The computations of income from marketed pigs and carcasses, feed costs, herd management costs and marketing costs are shown in the Supplementary material. Feed costs were derived from energy requirements of the pigs, which are discussed in the Supplementary material.
Economic value derivation
Three methods are available for use in the derivation of economic values, viz., the partial budget approach, partial differentiation method (Brascamp et al., Reference Brascamp, Smith and Guy1985; Smith et al., Reference Smith, James and Brascamp1986) and the bio-economic models (Bourdon, Reference Bourdon1998). The partial budget method accounts for marginal returns and marginal costs arising from the improvement, and does not take into account fixed costs. In the partial differentiation method, the partial derivative of the profit function with respect to the trait of interest is obtained. The partial differentiation method requires setting an equation that describes the change in net economic returns as a function of a series of physical, biological and economic parameters (Bett et al., Reference Bett, Kosgey, Bebe and Kahi2007). Bio-economic models consist of numerous equations relating biological, physiological, management and economic parameters.
Economic values for sow productivity traits, ADG, FCR, DRESS and AGES were derived using the partial budget approach. The partial differentiation of the profit function was used to derive economic values for LEAN and BFAT. Change in profit is normally calculated by evaluating herd profit (Tf 1) numerically for each trait, then evaluating it after incrementing by one unit of that trait (thus obtaining Tf 2), and taking the difference Tf 2 – Tf 1 (Ponzoni, Reference Ponzoni1992). Change in each trait was determined while all the other traits remained constant. The profit difference was then multiplied by the genetic standard deviation to produce an economic value per genetic standard deviation (Wolfova et al., Reference Wolfova, Wolf, Kvapilik and Kica2007). This was followed by computing relative economic values for sow productivity traits, by setting NBA as a base trait against which all comparisons for sow productivity traits would be made. Relative economic values for growth and carcass traits were computed by setting BFAT as a base trait against which all their comparisons would be made.
An increase in the average number of piglets born alive per litter was followed by a proportionate increase in the average number of piglets weaned, taking into account pre-weaning mortality. Feed costs for sows and creep in the lactation period were expected to increase, but no change in the average piglet weight at birth and weaning was expected. The feed as well as non-feed costs and the revenues for the extra pigs weaned were accounted for in the feeder and fattening periods.
Improving 21-day litter size without increasing litter size at birth was achieved by improved pre-weaning survival of piglets. This entailed increased nutritional requirements of the suckling sow as it had to nurse more piglets for an extended period of time. An increase in the piglets weaned resulted in more pigs being raised to marketing/slaughter.
Increasing 21-day litter weight was a result of improved pre-21-day weight gain, which was assumed to be catered for by the sow's milk. Birth weight, hence pregnancy costs remained unchanged. Increased pre-weaning daily gains were followed by increased post-weaning daily gain and live weights. This resulted in an increase in daily feed intake for the subsequent growth stages. Although feed costs increased at specific ages/weights, slaughter weight was reached earlier.
ADG considered in this study was calculated from lifetime weight gain. The Gompertz growth function (Wellock et al., Reference Wellock, Emmans and Kyriazakis2004) was used to predict the weight of a pig based on their age. Weight gain per day was calculated as the derivative of weight with respect to age. The energy needed for the daily gains was calculated using the formulae for energy requirements for the different pig categories in the Supplementary material. Increasing ADG was associated with a reduction in the number of days to reach market weight.
FCR, defined as the kilogram of feed consumed to gain 1 kg of live weight, was considered. Improving FCR resulted in improved growth rate; hence reduced days to slaughter weight.
AGES was defined as the number of days taken to reach 86 kg, which is the age adopted from the South African pig performance testing scheme. Improving AGES was associated with improvement in FCR and ADG.
Carcasses consist of lean (protein) and fat, therefore increasing DRESS resulted in an increase in protein and fat, which entailed more energy required for protein and fat deposition. Fat and protein content were determined and the respective deposition energies were computed. Whittemore (Reference Whittemore1993) established the relationship between DRESS, live weight (BW) and backfat (P2) as follows:
 $$ DRESS\,{\rm{(\% )}}\: = \:{\rm{66}}\: + \:{\rm{0}}{\rm{.09}}\:\times \:{\rm{ BW}}\: + \:{\rm{0}}{\rm{.12}}\:\times \:{\rm{P2}} $$
Energy for protein deposition was the sum of energies for protein turnover and protein retention as illustrated by Whittemore et al. (Reference Whittemore, Green and Knap2001). Maximum protein retention was derived from the Gompertz growth function (Whittemore et al., Reference Whittemore, Green and Knap2001). Mature size protein mass was taken to be 40 kg, whereas current protein was determined as described by Whittemore et al. (Reference Whittemore, Kerr and Cameron1995). Protein turnover was estimated from protein retention and degree of maturity (Millward et al., Reference Millward, Nnanyelugo and Garlick1974). Increasing DRESS was associated with increased protein and fat content. Change in fat content was assumed to include BFAT, thus accounting for any increase in BFAT as a result of incrementing DRESS.
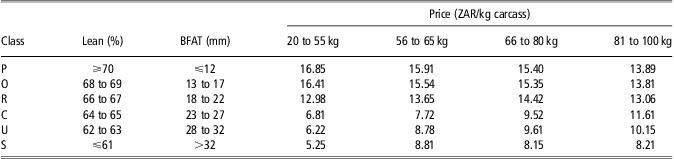
LEAN was calculated by first determining the amount of fat deposited using the relationship with BW (Whittemore et al., Reference Whittemore, Kerr and Cameron1995). Then carcass fat was subtracted from carcass weight to obtain LEAN (McManus, Reference McManus2007). Energy for protein deposition was as described in literature (Whittemore et al., Reference Whittemore, Kerr and Cameron1995; Whittemore et al., Reference Whittemore, Green and Knap2001). The energy obtained was added to maintenance and the total energy was used to calculate the amount of feed required. Feed costs for protein deposition were then computed and added to non-feed costs. Hovenier et al. (Reference Hovenier, Brascamp, Kanis, van der Werf and Wassenberg1993) developed a method to calculate marginal income functions and to derive economic values for traits with an intermediate optimum, such as meat quality. They expressed income per carcass as a function of the trait means and assumed that carcasses were classified into quality classes with different prices. This assumption was extended to the South African pig industry pricing system, a situation in which a trait can show several quality classes, each having a different price level (Table 4). A further extension was that carcasses were classified according to live weight, where there were four different live weight classes.
South African pricing for pigs based on PORCUS classification system
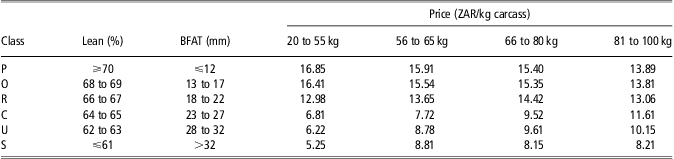
BFAT = backfat thickness.
Source: South African Meat Industry Company (2007).
The economic value derivation adopted was that developed by Hovenier et al. (Reference Hovenier, Brascamp, Kanis, van der Werf and Wassenberg1993). Calculation of the economic value required the definition of quality classes for LEAN. Given the population mean μ and the probability distribution of LEAN f(x|μ), the fraction of the population within the defined quality classes was determined and income per carcass I(μ) was calculated as the average value of carcasses in the population as follows:
 $$I(\mu )\: = \:\mathop{\sum}\limits_{i\: = \:1}^n {{{P}_i}\:\times \:{{F}_i}\: = \:\mathop{\sum}\limits_{i\: = \:1}^n {{{P}_i}\:\times \:{\int}_{{{{\!\!\!\!B}_{i\:{\rm{ - }}\:1}}}}^{{{{B}_i}}} {f(x\:|\:\mu )dx} } } $$
where I(μ) is the average income per carcass, μ the population mean, n the number of quality classes, Pi the price per carcass within the ith lean class, Fi the fraction of the population within the ith lean class, Bi −1 the lower boundary for the ith lean class, Bi the upper boundary for the ith lean class and f(x|μ) the probability distribution.
Because income I(μ) is nonlinear in μ, the economic value EV(μ) is also a function of μ:
 $${ EV(\mu )\: = \:\frac{{\partial I(\mu )}}{{\partial \mu }}\: = \:\frac{\partial }{{\partial \mu }}\left\{ {\mathop{\sum}\limits_{i\: = \:1}^n {{{P}_i}\:\times \:{\int}_{{{{\!\!\!\!B}_{i\:{\rm{ - }}\:1}}}}^{{{{B}_i}}} {f(x\:|\:\mu )dx} } } \right\}\: \cr = \:\mathop{\sum}\limits_{i\: = \:1}^n {{{P}_i}\:\times \:{\int}_{{{{\!\!\!\!B}_{i\:{\rm{ - }}\:1}}}}^{{{{B}_i}}} \,{\frac{\partial }{{\partial \mu }}\left\{ {f(x\:|\:\mu )} \right\}} } dx $$
Assuming the trait is normally distributed,  $$$ f{\rm{(}}x{\rm{|}}\mu {\rm{)}}dx\: = \:\frac{{\rm{1}}}{{\sigma \sqrt {{\rm{2}}\pi } }}{{e}^{{\rm{ - }}\frac{{\rm{1}}}{{\rm{2}}}\left( {\frac{{x\:{\rm{ - }}\:\mu }}{\sigma }} \right)^2}} $$$
Then,
 $${ EV{\rm{(}}\mu {\rm{)}}\: = \:\mathop{\sum}\limits_{i\: = \:{\rm{1}}}^n {{{P}_i}\:\times \:{\int}_{{{{\!\!\!\!B}_{i\:{\rm{ - }}\:1}}}}^{{{{B}_i}}} {\frac{\partial }{{\partial \mu }}\left\{ {\frac{{\rm{1}}}{{\sigma \sqrt {{\rm{2}}\pi } }}{{e}^{{\rm{ - }}\frac{{\rm{1}}}{{\rm{2}}}{{{\left( {\frac{{x\:{\rm{ - }}\:\mu }}{\sigma }} \right)}}^{\rm{2}}} }} } \right\}dx\thinsp}} \cr = \:\frac{{\rm{1}}}{{\sigma \sqrt {{\rm{2}}\pi } }}\mathop{\sum}\limits_{i\: = \:{\rm{1}}}^n {{{P}_i}\:\times \:\left( {{{e}^{{\rm{ - }}\frac{{\rm{1}}}{{\rm{2}}}{{{\left( {\frac{{{{B}_{i\:{\rm{ - }}\:1}}\:{\rm{ - }}\:\mu }}{\sigma }} \right)}}^{\rm{2}}} }} \:{\rm{ - }}\:{{e}^{{\rm{ - }}\frac{{\rm{1}}}{{\rm{2}}}\left( {\frac{{{{B}_i}\:{\rm{ - }}\:\mu }}{\sigma }} \right)}} ^{{\rm{2}}} } \right)} } } $$
Therefore, income was obtained from the product of average carcass weight and price per kilogram, whereas feed costs for lean deposition were added to maintenance costs. Table 5 shows the SAMIC carcass pricing system. LEAN (kg) was obtained from lean percentage of carcass weight, where DRESS was computed as described by Whittemore (Reference Whittemore1993). Incrementing LEAN was expected to increase feed costs only.
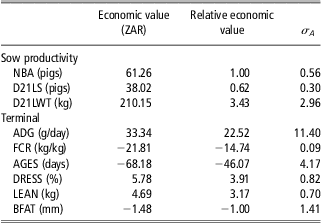
Economic values for sow productivity, growth and carcass traits
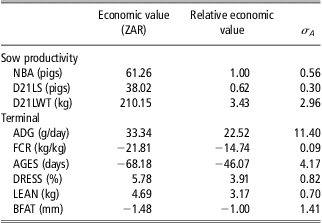
σA = genetic standard deviation; NBA = number born alive; D21LS = 21-day litter size; D21LWT = 21-day litter weight; ADG = average daily gain; FCR = feed conversion ratio; AGES = age at 86 kg; DRESS = dressing percentage; LEAN = lean content; BFAT = ultrasonic backfat thickness.
The definition of quality classes and economic value derivation for BFAT were as described for LEAN. The amount of fat needed to synthesize backfat was calculated with the assumption that 1.5 kg of fat is used to deposit 1 mm of BFAT (Young, Reference Young2003). Energy for fat deposition was 39.6 MJ/kg with an efficiency of 0.74 (ARC, 1981). Energy used in backfat synthesis was computed and added to maintenance. The total energy was used to calculate feed costs, which were added to non-feed costs, and the income lost per 1 mm increase in BFAT was subtracted. According to the SAMIC pricing system, the average loss of income (ZAR) during marketing due to an increase in BFAT per mm backfat increase was 0.39.
Sensitivity analyses
Because of the uncertainty of future feed and marketing prices, the sensitivities of the economic values for traits to changes in prices were analyzed. Different types of feed were used for different categories of animals, with each feed type having a different price; therefore, an average price was used in the sensitivity analyses. The average price of feed was increased from ZAR 3.75/kg to ZAR 5.25/kg by successive ZAR 0.10 increases. Marketing prices for carcasses of ZAR 15.00/kg were increased by 1% up to 10%, while those for maiden gilts of ZAR 1500.00 per animal, were increased by 0.5% up to 5.5%.
Results and discussion
Economic values
Economic values were computed at 95% production by taking the difference between revenues and costs (Ponzoni, Reference Ponzoni1988). The economic values, relative economic values and the genetic standard deviations for the traits analyzed are shown in Table 5 and depended on population means. These economic values indicate the direction and emphases of genetic selection to be applied on the respective traits. Relative economic values indicate how much additional profit can be earned by making an improvement of one standard deviation in one trait relative to NBA in sow productivity traits or BFAT in growth and carcass traits. From an animal improvement point of view, only the range around the actual population mean is interesting for short-to-medium-term considerations (Von Rohr et al., Reference Von Rohr, Hofer and Kunzi1999). This is probably because the economic environment is constantly changing, which requires the continual updating of the economic values. As the economic environment varies from one environment to another and from herd to herd, genetic programs can be custom-made for a particular environment or herd.
Hovenier et al. (Reference Hovenier, Brascamp, Kanis, van der Werf and Wassenberg1993) considered in their example for a meat quality trait three classes with two prices. The same approach was adopted in this study with more classes based on the South African pricing system with each class having a different price. Von Rohr et al., (Reference Von Rohr, Hofer and Kunzi1999) pointed out that the use of quality classes is an advantage because the existing pricing system is already based on quality classes and the experts are familiar with that specific concept of classifying carcasses. The width of the quality classes should be adapted to the phenotypic standard deviation of the trait considered.
There might be benefits resulting from corrections of inefficiencies in the production system, such as feeding management or pre-slaughter handling. These benefits should not be accounted for when estimating economic values (Smith et al., Reference Smith, James and Brascamp1986). In this study, management was assumed to be optimum and hence the economic values obtained fulfil the requirements of Smith et al. (Reference Smith, James and Brascamp1986). Population means might also change as a result of genetic selection, which might cause changes in optimum management (Amer and Fox, Reference Amer and Fox1992). The current study did not consider such potential changes in management.
Sensitivity analyses
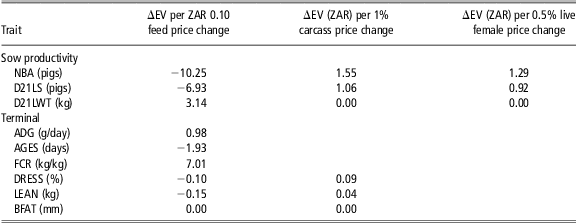
The economic world is constantly changing hence the sensitivities of economic values to changes in feed prices and marketing prices for carcasses and maiden gilts were analyzed. The sensitivity of economic values of traits to circumstances also gives information on the likely direction of future genetic improvement and production system (Smith, Reference Smith1988; Kosgey et al., Reference Kosgey, Arendonk and Baker2003). Table 6 shows the sensitivities of economic values for sow productivity traits to price changes. The economic values for NBA and D21LS decreased with increasing feed prices, whereas the economic value for D21LWT increased as feed prices increased. The income obtained from increasing NBA and D21LS may offset the increase in feed costs. There was no response in the economic value for D21LWT as marketing prices increased, while the economic values for NBA and D21LS increased. Marketing is done at a fixed weight; hence marginal income is only obtained from improvements in NBA and D21LS. These analyses show that when feed prices increase beyond ZAR 4.55 and 4.25/kg, it would be a loss to improve NBA and D21LS, respectively. Simultaneous increases in marketing prices of carcasses and maiden females may counteract the loss due to feed price increases. This is indicated by the positive responses of economic values for NBA and D21LS to increasing marketing prices of carcasses and maiden females. In a study by Houska et al. (Reference Houska, Wolfova and Fiedler2004) on Czech Republican pigs, the economic values for NBA and litter size were also sensitive to changing economic circumstances. This underlines the impact of the economic environment on the reproductive performance of commercial sows.
Sensitivity analyses of economic values for sow productivity, growth and carcass traits to changes in prices
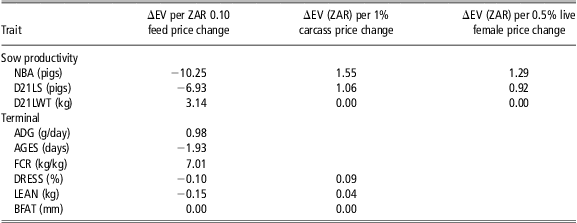
ΔEV = change in economic value; NBA = number born alive; D21LS = 21-day litter size; D21LWT = 21-day litter weight; ADG = average daily gain; FCR = feed conversion ratio; AGES = age at 86 kg; DRESS = dressing percentage; LEAN = lean content; BFAT = ultrasonic backfat thickness.
Sensitivities of economic values for growth and carcass traits to price changes are shown in Table 6. The economic value for BFAT was not sensitive to changes in prices of feed and animals. The greatest response to feed prices was observed in the economic value for DRESS. Economic values for LEAN and DRESS had decreasing responses to feed price increases. The results indicate that when feed prices increase beyond ZAR 32.37 and ZAR 58.70/kg, it would be unprofitable to improve LEAN and DRESS, respectively. Economic values for LEAN and DRESS increased with increasing carcass marketing prices. This is consistent with the study conducted by Houska et al. (Reference Houska, Wolfova and Fiedler2004), which showed that the economic value for ADG is sensitive to changing economic parameters. Assuming carcass marketing prices increase simultaneously with feed prices, the reduction in economic values due to feed price increases may be counterbalanced. On the other hand, economic values for ADG and FCR increased with increases in feed prices. ADG had the lowest response to changes in feed prices, whereas FCR had the highest. However, these results do not imply that feed price increases should be favoured to improve economic values for ADG and FCR.
The study demonstrates that future economic values for responsive traits might change depending on changes in feed, carcass and live animal marketing prices. This knowledge should therefore compel the recalculation of the economic value for each economically relevant trait, regardless of the ease with which that trait can be improved. Kosgey et al. (Reference Kosgey, Arendonk and Baker2003) ointed out that the effort it takes to change a trait can vary considerably between traits, that is, the trait can be of great economic importance but cannot be changed easily. Where profitability is a primary concern, decisions about which traits to target for genetic improvement should be based on the extent to which each trait affects profitability.
Conclusions
Incorporating economic considerations into breeding programs is made possible by the availability of economic values of economically relevant traits. The economic values provide the emphasis and direction of selection for each trait. These estimates of economic values can be useful and reliable as they are based on energy requirements of animals from the population in which genetic selection would be practiced. In addition, information was obtained from major role players in the South African pig industry. The breeding objective developed using economic values reflect future developments in the pig industry. This study revealed the responsiveness of economic values to changes in feed and marketing prices of carcasses and maiden females. Genetic improvement of LEAN, carcass yield and NBA would only benefit the producer up to a certain point where feed prices would discourage any further improvement. This can be counteracted by simultaneous increases in marketing prices.
Acknowledgements
The data for genetic analyses were obtained from the Agricultural Research Council (ARC). Information on production systems was from the South African Pork Producers Organization (SAPPO), while the pricing information was from the South African Meat Industry Company (SAMIC).