I. INTRODUCTION
Nitrogen oxides (NO, NO2, and N2O), one of the major sources for air pollution, can result in photochemical smog, acid rain, ozone depletion, and greenhouse effects. Reference Qi and Yang1 Nitrogen oxides (NO x ) derived from power plants account for a significant proportion in those resulting from combustion. Reference Qi and Yang1 The extremely attractive and efficient technology for reducing NO x emissions from power plants is selective catalytic reduction (SCR) of NO x with ammonia (NH3) as the reducing agent. But there exists an increasing interest in developing a low-temperature SCR catalyst for the removal of NO x . Because such a catalyst can be placed downstream of the desulfurization scrubber and/or particulate control device, however at the downstream part a majority of sulfur dioxide and dust have been removed, thus the deactivation effect can be weakened. Reference Qi and Yang1–Reference Qi, Yang and Chang3 A number of catalysts have been reported to be active for low-temperature (e.g., 100–280 °C) SCR reaction. Reference Costa and Efstathiou4–Reference Wu, Jiang, Liu, Zhao and Guan8 Among these catalysts, manganese–cerium composite oxide (MnO x –CeO2) catalyst, which exhibits good redox ability because of multiple valences of manganese species and the high oxygen storage capacity of CeO2, has been given considerable attention. Reference Chang, Li, Chen, Ma, Yang, Schwank and Hao9,Reference Wang, Ge, Zhan, Li, Qiao and Ling10 In fact, MnO x –CeO2 is used for a number of other catalytic applications, such as catalytic oxidation of CO Reference Zou, Meng and Zha11 and organic compounds. Reference Zou, Meng and Zha11,Reference Arena, Trunfio, Negro and Spadaro12
It is well-known that the preparation method can greatly affect the properties of catalysts. There exists an increasing and diverse interest in the use of structure-directing surfactant molecules to design a variety of metal oxides into ordered mesoporous materials. Reference Zou, Meng and Zha11,Reference Ge, He and Li13–Reference Sun, Zou, Xu and Wang18 The surfactants play the roles of complexant, stabilizing agent, and template. Template-assisted synthesis is an effective route to increase the surface area of catalysts and consequently to enhance catalytic activities. Meng et al. Reference Zou, Meng and Zha11 have reported that MnO x –CeO2 binary mixed oxide catalysts prepared by using cetyltrimethyl ammonium bromide (CTAB)-assisted precipitation exhibited high specific surface area and good catalytic activity for CO and C3H8 oxidation at appropriate Mn/Ce ratio.
Supercritical antisolvent (SAS) precipitation is a novel technique for producing nano- and microsized particles and it is possible to completely eliminate residual organic solvent without postprocessing of the produced particles. Reference Reverchon, De Marco, Adami and Caputo19 In addition, for composite oxides, metal components can be uniformly dispersed through SAS, which contributes to high catalytic activity. Therefore, as a green process route, SAS has seen increasing attention for catalysts and catalyst support preparation, such as CeO2, Reference Tang, Edwards, Bartley, Taylor, Carley, Herzing, Kiely and Hutchings20 Cu/MnO x , Reference Tang, Jones, Aldridge, Davies, Bartley, Carley, Taylor, Allix, Dickinson, Rosseinsky, Claridge, Xu, Crudace and Hutchings21,Reference Tang, Kondrat, Dickinson, Bartley, Carley, Taylor, Davies, Allix, Rosseinsky, Claridge, Xu, Romani, Crudace and Hutchings22 zinc (II) oxide (ZnO), Reference Reverchon, Della Porta, Sannino and Ciambelli23 titanium dioxide (TiO2). Reference Tang, Bartley, Taylor, Hutchings, Gaigneaux, Devillers, De Vos, Hermans, Jacobs, Martens and Ruiz24
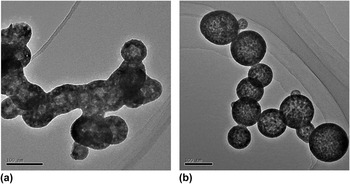
Our group first utilized SAS to prepare MnO x –CeO2 with hollow spherical structure. We used it as a catalyst for low-temperature selective catalytic reduction of nitrogen oxides (SCR deNO x ) reaction with NH3, Reference Jiang, Zhang, Li and Jiang25,Reference Jiang, Zhang and Jiang26 and found that the hollow nanospheres exhibited superior NO conversion in the low-temperature range of 100–200 °C Reference Jiang, Zhao, Jiang and Zhang27 as a result of the strong structure–activity effect. However, the prepared MnO x –CeO2 nanospheres exhibited interconnectivity and agglomeration with string and peanutlike morphology because of the van der Waals' forces between particles Reference Jiang, Zhang, Li and Jiang25,Reference Jiang, Zhao, Jiang and Zhang27 resulting in relatively low surface area. Recently, we reduced the interconnectivity and agglomeration of MnO x –CeO2 by introducing polyvinylpyrrolidone (PVP) in the SAS process and the hollow structure could still be obtained (Fig. 1). In this article, we mainly investigated the effects of the Mn content and the calcination temperature on structure and properties of MnO x –CeO2 prepared by PVP-assisted SAS technique. At the same time, the Mn/Ce molar ratio and calcination temperature were studied by using low-temperature SCR deNO x with NH3 as model reactions.
The transmission electron microscopy (TEM) images of MnO x –CeO2 prepared through SAS (a) without PVP and (b) with PVP.

II. EXPERIMENTAL
A. Materials
Manganese acetylacetonate (Mn(acac)3) with a purity of 97% and cerium acetylacetonate (Ce(acac)3) with a purity of 99% were supplied by Arcos Organics (Belgium) and Yangzhou City Xingye Auxiliaries (Jiangsu, China), respectively. Polyvinylpyrrolidone (PVP, K 30, average Mw 40,000, Fluka), methanol (Analytical purity), and carbon dioxide were brought from Sigma (St. Louis, MO), Kermel (Tianjin, China), and Hexagon (Tianjin, China), respectively. The mixture gases of NO/Ar, NH3/Ar, and O2/Ar were supplied by B Beijing AP BAIF Gases Industry Co., Ltd.
B. SAS experimental apparatus and procedure
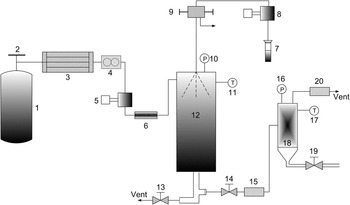
A SAS50 experimental apparatus (Thar Technologies Co., Pittsburgh, PA) was used to precipitate precursor particles of MnO x –CeO2 and Fig. 2 shows the schematic diagram of SAS system using supercritical carbon dioxide (sc-CO2) as antisolvent. At first, the CO2 (1) was cooled down with a bath cooler (3) operating at 0 °C to assure liquid state in the pump. Then the liquefied CO2 at a constant flow rate of 45 g/min was continuously delivered into the precipitation vessel (12) (500 mL) by a high-pressure pump (5). Before entering the precipitation vessel, the CO2 would be heated by preheater (6). The pressure and temperature in the precipitation vessel were controlled by an automatic back-pressure regulator (15) and a temperature controller (not shown in Fig. 2), respectively. The temperature and pressure can be controlled within ±1 °C and ±1 bar of the set points, respectively. When the desired pressure was reached and steady sc-CO2 flow was established, the liquid pump (8) was switched on and the pure methanol solvent (7) at a flow rate of 1 mL/min was sprayed through the nozzle to the vessel to obtain steady state composition conditions during the subsequent precipitation of the solute. Then the flow of methanol was stopped and a mixed methanol solution of Mn(acac)3, and/or Ce(acac)3 and PVP (7) was delivered through the nozzle at the flow rate of 1 mL/min. According to our previous work to prepare hollow MnO x –CeO2 nanospheres, Reference Jiang, Zhang and Jiang26,Reference Jiang, Zhao, Jiang and Zhang27 the total concentration of Mn(acac)3 and Ce(acac)3, operating temperature, operating pressure, and mass ratio of PVP:precursor were fixed at 0.5 wt%, 45 °C, 20 MPa, and 1:3, respectively. Particles precipitate, when the solution droplets contact the sc-CO2. When sufficient particles were obtained, the liquid pump was switched off and the sc-CO2 at a constant flow rate of 20 g/min would continue to flow through the vessel for another 30 min to remove the residual methanol. Then the SAS system was depressurized gradually to atmospheric pressure using the vent valves. The precipitated particles were collected and calcined in air for 2 h to obtain the final MnO x –CeO2 catalysts. In this article, the MnO x –CeO2 catalysts were denoted MC(X)-PVP-Y (X = 1:7, 1:3, 3:5, 1:1, or 5:3, Y = 400, 550, or 700), where X represents the Mn/Ce molar ratio and Y represents the calcination temperature (°C). The pure MnO x and CeO2 catalysts were denoted as MnO x -PVP-400 and CeO2-PVP-400, respectively.
Schematic diagram of the SAS50 experimental apparatus (1) CO2 cylinder; (2, 9, 13,14 19) valve; (3) cooler; (4) mass flow meter; (5) CO2 pump; (6) preheater; (7) liquid container (pure methanol or a mixed methanol solution of Mn(acac)3, and (or) Ce(acac)3 and PVP); (8) liquid pump; (10,16) pressure gauge; (11,17) temperature indicator controller; (12) precipitator vessel; (15) automatic back-pressure regulator; (18) separator; (20) manual back-pressure valve.

C. Characterization
The crystal phases were investigated by x-ray diffraction technique (XRD; Rigaku D/Max 2500, Tokyo, Japan) with Cu Kα radiation operating at 40 kV and 200 mA. The nitrogen adsorption–desorption isotherm was measured with a Micromeritics Tristar 3000 (Norcross, GA) using nitrogen at 77 K after the samples were pretreated in a N2 atmosphere at 250 °C for 8 h. Specific surface area and pore size were calculated by the Brunauer–Emmett–Teller (BET) method and the Barrett–Joyner–Halenda (BJH) method, respectively. Elemental analyses (Mn and Ce) of the catalysts were carried out by an inductively coupled plasma optical emission spectroscopy (ICP-OES, Varian VISTA-MPX, Palo Alto, CA). X-ray photoelectron spectroscopy (XPS) was used to analyze the surface concentration on each sample. The spectra were recorded on a Perkin Elmer PHI-1600 spectrometer (Waltham, MA) using Mg Kα (1253.6 eV) as a radiation source. C1s binding energy (BE) of 284.6 eV was taken as reference to calibrate the BEs. Temperature-programmed reduction (TPR) and temperature-programmed oxidation (TPO) experiments were performed in an Autochem II 2920 (Micromeritic). Prior to TPR and TPO tests, about 50 mg of the samples were pretreated for 30 min in 10 mL/min helium (He) and argon (Ar) flow at ambient temperature, respectively. For the H2-TPR test, then the sample was heated from room temperature to 900 °C at a rate of 10 °C/min and meanwhile was reduced by a gas mixture of H2/Ar containing 10 vol% H2 at a flow rate of 50 mL/min. For the TPO test, the samples were reduced from room temperature to 600 °C at a ramp of 10 °C/min in a mixture gas of 10 vol% H2/Ar. After cooling to room temperature, the sample was treated again for 30 min in 10 mL/min Ar flow at ambient temperature. Then the sample was heated to 900 °C at a rate of 10 °C/min in the atmosphere of 9.989 vol% O2/Ar at 20 mL/min. For both tests, the hydrogen and oxygen consumption were detected by thermal conductivity detector (TCD), before which the gas was purified by a trap containing liquid nitrogen and isopropyl alcohol. Raman spectra were obtained by ThermoFisher Scientific DXR microscope (Waltham, MA). The excitation wave length was 633 nm from a helium–neon (He–Ne) laser with a power of 8 mW on the samples. The scanning range was 200–1000 cm−1.
D. Catalytic activity measurements
The deNO x activity of the catalysts with NH3 was measured in a fixed-bed quartz reactor at atmospheric pressure with the following reactant gas composition: 1000 ppm NO, 1000 ppm NH3, 2% O2, and balance Ar. Approximately 0.2 g of catalysts (60–80 mesh) and 0.4 g quartz sand were mixed adequately for each test. Under ambient conditions, the total flow rate was 100 mL/min and the gas hourly space velocity was 50,000/h. The reaction temperature was regulated from 80 to 240 °C and remained 1 h at each experimental condition. NO and NO2 concentrations were continuously monitored by a flue gas analyzer (KM9106 Quintox Kane International Limited). The effluent streams were also analyzed by a gas chromatograph (Agilent GC-6820, Santa Clara, CA) at 30 °C with 5 Å molecular sieve column for N2 and Porapak Q column for N2O.
III. RESULTS AND DISCUSSION
A. Solid solution
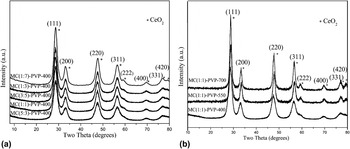
The structural similarity between Ce4+ and Mn3+ makes the formation of Ce–Mn–O solid solution possible. Reference Machida, Uto, Kurogi and Kijima28 Various preparation methods to form the solid solution are reported in literature. Reference Qi and Yang1,Reference Li, Lu, Dai, Wang, Guo and Guo29 The XRD patterns of MnO x –CeO2 with various Mn/Ce molar ratios and calcination temperatures are illustrated in Figs. 3(a) and 3(b), respectively. As shown in the figures, only broad peaks well indexed to a typical cubic fluoritelike structure of CeO2 (Joint Committee on Powder Diffraction Standards (JCPDS) specification 34-0394) were observed and the diffraction peaks pertaining to manganese oxide phase were not observed in any of these samples. Besides, it seems that the peak intensities increased with decreasing Mn content and increasing calcination temperature. These trends suggest that Mn species incorporate into the fluorite lattice of CeO2 to form homogeneous solid solutions and there exists a strong interaction between the manganese and cerium oxides. When the cerium ion is replaced by the manganese ion, because of the requirement of electroneutrality, the decreased coordination number of the manganese ion compared with the cerium ion may lead to the formation of the oxygen vacancies, Reference Li, Lu, Meng, Yao and Chen30 which adsorb and activate molecular oxygen to form active oxygen species and prompt low-temperature redox reaction.
XRD patterns: (a) MC(X)-PVP-400 and (b) MC(1:1)-PVP-Y (X = 1/7, 1/3, 3/5, 1/1, and 5/3; Y = 400, 550, and 700).

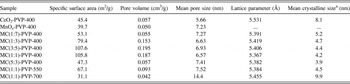
The lattice parameters and mean crystallite sizes obtained from the calculation of the (111) peak of all samples are listed in Table I. It can be seen that the lattice parameters of MC(X)-PVP-Y were smaller than that of the CeO2-PVP, which proves the formation of the solid solution. The CeO2 unit cell contracts after the substitution of Mn n+ for Ce4+, because of the smaller ionic radii of Mnn+ (Mn2+ = 0.83 Å, Mn3+ = 0.65 Å, and Mn4+ = 0.53 Å) than that of Ce4+ (1.01 Å). Reference Qi and Yang1,Reference Jiang, Zhao, Jiang and Zhang27,Reference Li, Lu, Dai, Wang, Guo and Guo29,Reference Murugan, Ramaswamy, Srinivas, Gopinath and Ramaswamy31 However, it can be seen that the lattice parameters increased with increasing calcination temperature, suggesting the high temperature prevented the Mnn+ ions from incorporating into the ceria lattice. This was consistent with Tang et al.’s report Reference Tang, Li, Huang, Xu, Zhu, Wang and Shen32 and they found that MnO x could be detected at 700 °C. However, in this work, the formation of solid solution at 700 °C might be attributed to the PVP-enhanced substitution of Mnn+ for Ce4+ in the fluorite lattice of CeO2. This enhancement was due to that the electrostatic interactions between PVP and the precursor organic salts Reference Yu, Huang, Deng, Lin, Jiang, Huang and Wang33,Reference Engberts34 finally led to the strengthened interactions between the manganese species and the cerium species in the MnO x –CeO2 catalyst. Meanwhile, the mean crystallite sizes decreased and increased with increasing Mn content and calcination temperature, respectively, indicating that the addition of manganese ions in CeO2 actually affected crystallite growth and the high temperature weakened the interactions between manganese and cerium species.
The textural properties of CeO2-PVP-400, MnO x -PVP-400, and MC(X)-PVP-Y (X = 1/7, 1/3, 3/5, 1/1, and 5/3; Y = 400, 550, and 700).

a Calculated from line broadening of CeO2 (1 1 1) by the Scherrer equation.
B. Surface and structure properties
The BET surface area, pore volume, and mean pore size of MnO x –CeO2 with various Mn/Ce molar ratios and calcination temperatures are summarized in Table I. It is clear that with increasing Mn content, specific surface areas and pore volumes of MC(X)-PVP-400 first increased and then gradually decreased and reached the largest values of 107.6 m2/g and 0.195 cm3/g, respectively, at the molar ratio of 3:5. As seen from Table I, the specific surface areas of MC(X)-PVP-400 were larger than CeO2-PVP-400 and MnO x -PVP-400. The interactions between Mn and Ce oxides may inhibit the particle growth of each component, making the binary oxides MC(X)-PVP-400 own larger specific surface areas than the single oxide. If one of the components is much more than the other, the inhibition effect should be weakened. Reference Zou, Meng and Zha11 Therefore, the specific surface areas of MC(X)-PVP-400 first increased and then gradually decreased with increasing Mn content. The optimal Mn/Ce molar ratio is 3:5, which corresponds to the largest specific surface area. Both specific surface areas and pore volumes of MC(1:1)-PVP-Y decreased with increasing calcination temperature and reached 31.1 m2/g and 0.042 cm3/g, respectively, at the calcination temperature of 700 °C, less than for CeO2-PVP at 700 °C, probably due to sintering of the catalysts at high temperature, which was consistent with the result of mean crystalline size. The mean pore sizes of all samples fell into the range of mesopore and the values of MC(1:1)-PVP-Y increased dramatically with increasing calcination temperature and reached 14.4 nm at 700 °C.
C. Surface composition
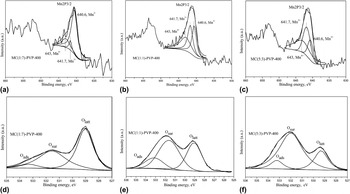
XPS can be used to identify the chemical compositions (atomic concentrations) of the surface layer and to identify the oxidation states of manganese oxides. In this work, the samples with Mn/Ce molar ratios of 1/7, 1/1, and 5/3 were selected for analysis, which represented the samples with low, moderate, and high Mn content, respectively. Figure 4 presents the XPS spectra for Mn2p and O1s levels. And the corresponding fitted results are also given in Table II.
XPS spectra of MC(X)-PVP-400: (a–c) Mn2p and (d–f) O1s (X = 1/7, 1/1, and 5/3).

XPS and ICP-OES results of MC(X)-PVP-400 (X = 1/7, 1/1, and 5/3).

As can be seen from Mn2P XPS spectra [Figs. 4(a)–4(c)] for the three samples, one main peak ascribable to Mn2P3/2 was observed. Reference Thirupathi and Smirniotis35 The Mn2P3/2 signal was split into three subpeaks that gave reasonable fitting with BE of 640.6, 641.7, and 643.0 eV, which were consistent with the BE values of Mn2+, Mn3+, and Mn4+, respectively in MnO x –CeO2, according to Meng et al. Reference Zou, Meng and Zha11 and moreover, the BE also fell into the range of other research findings or are close to them. Reference Li, Lu, Dai, Wang, Guo and Guo29,Reference Shen, Liu, Zhao, Yang and Deng36,Reference Azalim, Franco, Brahmi, Giraudon and Lamonier37 Consequently it is concluded that Mn2+, Mn3+, and Mn4+ are present in MC(X)-PVP-400. However, the surface percentage of manganese and the relative content of high valence manganese ion (Mn4+) were different in these three samples. Table II shows that the surface content of manganese and Mn4+/Mntot increased with increasing Mn content, which was beneficial to redox reaction. According to ICP-OES, the bulk atomic ratios of Mn/(Ce + Mn) in these three samples also increased with increasing Mn content, but were less than the surface values, which demonstrated the enrichment of manganese in the surface. Figures 4(d)–4(f) show that the O1s peaks of the above three samples were also deconvoluted into three subbands and according to the published literature, Reference Li, Lu, Dai, Wang, Guo and Guo29,Reference Wang, Kang and Li38,Reference Larachi, Pierre, Adnot and Bernis39 the peak position at 528.7–530.0 eV was attributed to lattice oxygen (Olatt), at 531.0–532.5 eV was assigned to surface oxygen (Osur), that is, defect oxide or the surface oxygen ions with low coordination situation and weakly bonded oxygen species and at 532.5–534.0 eV was accepted as adsorbed oxygen species (Oads), namely, hydroxyl species and adsorbed water species as contaminants on the surface. Table II shows that surface oxygen composition decreased and Osur/(Osur + Oads + Olatt), which was estimated from the relative area of these subpeaks, increased with increasing Mn content, which meant the high Mn content contributed to the formation of surface active oxygen. The BE positions of the Ce3d peaks corresponded to Ce4+ in the CeO2, Reference Zou, Meng and Zha11,Reference Larachi, Pierre, Adnot and Bernis39 suggesting that the oxidation state of cerium was CeO2 in all the catalysts and the presence of manganese ions didn't affect the oxidation state of cerium. This was also in agreement with the XRD results.
D. Redox properties
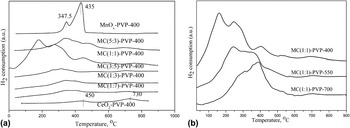
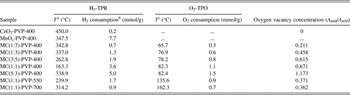
H2-TPR test was performed to study the reducibility of Mn oxides in different samples. Figure 5 shows the H2-TPR profiles of MnO x -PVP-400, CeO2-PVP-400, MC(X)-PVP-400, and MC (1:1)-PVP-Y. The total H2 consumption of the reduction peaks from room temperature to 600 °C and the temperatures corresponding to the first reduction peaks of the samples are listed in Table III. It can be observed that H2-TPR profile of MnO x -PVP-400 shows two overlapping reduction peaks with maxima at 347.5 and 435 °C, respectively. According to other TPR results, Reference Zou, Meng and Zha11,Reference Tang, Li, Huang, Xu, Zhu, Wang and Shen32,Reference Wang, Kang and Li38,Reference Delimaris and Ioannides40 the two reduction peaks might correspond to a two-step process: the reduction peak at a low temperature of 347.5 °C could be assigned to the reduction of MnO2 or Mn2O3 to Mn3O4, while the reduction peak at 435 °C involved the reduction of Mn3O4 to MnO. H2-TPR profile of CeO2-PVP exhibits two small peaks around 450 and 730 °C, which was attributed to the reduction of surface capping and bulk oxygen of CeO2, respectively. Reference Zou, Meng and Zha11,Reference Trovarelli41 However, compared with other research findings, Reference Zou, Meng and Zha11,Reference Jiang, Zhao, Jiang and Zhang27,Reference Delimaris and Ioannides40 it seemed that the positions of the reduction peaks of MnO x -PVP-400 and CeO2-PVP-400 shifted to lower temperature, which meant that PVP might promote the reduction of manganese oxide and cerium oxide. This promotion resulted from the enhanced interactions Reference Zou, Meng and Zha11 among the manganese species and among the cerium species that were induced by the electrostatic interactions Reference Yu, Huang, Deng, Lin, Jiang, Huang and Wang33,Reference Engberts34 between PVP and the precursor organic salts. In contrast to the reduction peaks of MnO x -PVP-400 and CeO2-PVP-400, the reduction profiles of MC(X)-PVP-400 catalysts were more complicated [Fig. 5(a)] and several peaks overlapped over a rather broad temperature range. But in general, the reduction peaks of MC(X)-PVP-400 shifted to lower temperature region, implying that the interactions between manganese and cerium oxides through the formation of Ce–Mn–O solid solution promoted the reduction of manganese and cerium oxides and the mobility of oxygen species was enhanced with increasing Mn content. It can be seen from Table III that with increasing Mn content, the H2 consumption increased and the first reduction temperature initially kept decreasing but increased quickly when the Mn/Ce ratio was higher than 1:1, which meant that oxygen mobility was decreased again at high Mn content. Taking into consideration both the reduction temperature and the H2 consumption, it can be concluded that MC(1:1)-PVP-400 exhibited the highest reducibility. Figure 5(b) demonstrates that with increasing calcination temperature, the reduction peaks of MC(1:1)-PVP-Y shifted to higher temperature and the H2 consumption decreased probably due to the decreased interactions between manganese and cerium oxides caused by sintering at high temperature. Both the very low specific surface area of 31.1 m2/g and the large crystallite size of 9.9 nm of the sample calcined at 700 °C, as revealed by XRD results, resulted from sintering.
H2-TPR profiles: (a) CeO2-PVP-400, MnO x -PVP-400, MC(X)-PVP-400 and (b) MC(1:1)-PVP-Y (X = 1/7, 1/3, 3/5, 1/1, and 5/3; Y = 400, 550, and 700).

Quantitative results of H2-TPR, O2-TPO, and Raman of CeO2-PVP-400, MnO x -PVP-400, and MC(X)-PVP-Y (X = 1/7, 1/3, 3/5, 1/1, and 5/3; Y = 400, 550, and 700).

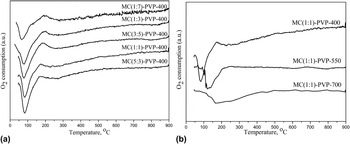
The TPO profiles of the MnO x –CeO2 catalysts with different Mn/Ce molar ratios and calcination temperatures are shown in Fig. 6. The temperature corresponding to the oxygen consumption peaks and the actual oxygen consumption are given in Table III. Before the TPO tests, all the samples were reduced from room temperature to 600 °C, so according to the above TPR analysis, it could be concluded that the oxygen consumption mainly resulted from the oxidation of MnO species. It can be seen from Fig. 6(a) that with increasing Mn content, the oxygen consumption and oxidation temperature increased gradually but when Mn/Ce molar ratio was higher than 1:1, the variation of oxidation temperature was not obvious. Comprehensively considering oxidation temperature and oxygen consumption during TPO, MnO x –CeO2 catalysts with high Mn content possess the highest ability to activate oxygen and contribute to redox reaction. Figure 6(b) displays that higher calcination temperature led to higher oxidation temperature and lower oxygen consumption, implying the decreased capability for oxygen activation. Consequently the low calcination temperature of 400 °C could promote oxygen activation and might lead to high redox activity.
TPO profiles: (a) MC(X)-PVP-400 and (b) MC(1:1)-PVP-Y (X = 1/7, 1/3, 3/5, 1/1, and 5/3; Y = 400, 550, and 700).

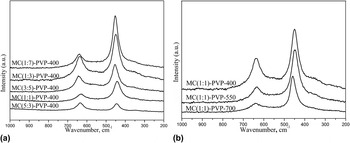
XRD patterns can give information related mainly to the cation sublattice, but Raman spectra of these fluorite-type oxide structures are dominated by oxygen lattice vibrations and are sensitive to the crystalline symmetry, thus being a potential tool to obtain additional structural information. Reference Zhao, Li, Ge, Wang and Zhou42,Reference Fernandez-Garcia, Martinez-Arias, Iglesias-Juez, Belver, Hungria, Conesa and Soria43 The Raman spectra of the MnO x –CeO2 catalysts with different Mn/Ce molar ratios and calcination temperatures are displayed in Fig. 7. It can be seen from Figs. 7(a) and 7(b) that two obvious bands at about 450 and 640 cm−1 were observed. The band at about 450 cm−1 could be attributed to the F2g vibration mode of the fluorite structure, which could be viewed as a symmetric breathing mode of oxygen atoms around cerium ions. Reference Zhao, Li, Ge, Wang and Zhou42,Reference Pu, Lu, Luo and Me44,Reference Zhang, Jiang and Jiang45 The band at around 640 cm−1 could be related to oxygen vacancies in the CeO2 lattice and attributed to the presence of defect structure in MnO x –CeO2 materials. Reference Zhao, Li, Ge, Wang and Zhou42,Reference Si, Zhang, Li, Lin and Yan46 Figure 7(a) shows that high Mn content led to low intensities of 450 and 640 cm−1 bands, however, the positions of the bands changed little with increasing Mn content. Figure 7(b) shows that with increasing calcination temperature, both bands shifted to higher wave number and the intensities became weaker. The peak areas of the band at around 450 cm−1 and the band at 640 cm−1 based on the results in Fig. 7 were calculated and denoted as A450 and A640, respectively. It has been reported that the A640/A450 ratio can reflect the concentration of oxygen vacancies in the solid solution. Reference Pu, Lu, Luo and Me44 The values of A450/A640 related to temperature and Mn content are displayed in Table III. It can be seen that with increasing Mn content, the concentration of oxygen vacancies increased dramatically, while oxygen vacancy concentration decreased with increasing calcination temperature. Thus it can be inferred that high Mn content and low temperature of 400 °C could facilitate the formation of more oxygen vacancies, which would lead to easier oxygen mobility from bulk to surface and more activated oxygen through adsorption on the vacancies. They are beneficial to the NH3 activation in the SCR reaction. The results of Raman tests were consistent with those of XPS, H2-TPR, and TPO.
Raman spectra: (a) MC(X)-PVP-400 and (b) MC(1:1)-PVP-Y (X = 1/7, 1/3, 3/5, 1/1, and 5/3; Y = 400, 550, and 700).

E. NH3-SCR activity
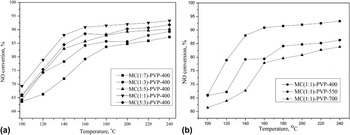
Results on the NO conversion as a function of temperature are given in Fig. 8 for MnO x –CeO2 catalysts with different Mn content and calcination temperatures. It is clear that there was a significant increase of NO conversion when increasing temperature. On the whole, the NO conversion [Fig. 8(a)] in MC(X)-PVP-400 catalysts increased in the order of MC(1:7)-PVP-400 < MC(1:3)-PVP-400 < MC(3:5)-PVP-400 < MC(5:3)-PVP-400 < MC(1:1)-PVP-400. The NO conversion [Fig. 8(b)] in MC(1:1)-PVP-Y catalysts increased in the order of MC(1:1)-PVP-700 < MC(1:1)-PVP-550 < MC(1:1)-PVP-400. In a word, at more than 100 °C MC(1:1)-PVP-400 exhibited the highest catalytic activity and 93.3% NO conversion and 100% N2 selectivity were obtained when the temperature reached 220 °C. On the basis of BET characterization analysis, MC(1:1)-PVP-400 exhibited higher specific area (105.8 m2/g), which provided higher active surfaces and effective contacts for the reactants, and larger pore volume which were considered to facilitate the diffusion of reactants more efficiently. In addition, higher oxygen mobility (TPR), surface richer with active oxygen species and manganese species, the formation of higher valence of manganese (XPS), higher capability of oxygen activation (TPO), and more oxygen vacancies (Raman) were all responsible for the higher catalytic activity of MC(1:1)-PVP-400. Compared with MC(1:1)-PVP-400, even though MC(5:3)–PVP-400 had better results of XPS, TPO, and Raman, the higher specific area might be the dominant factor for higher catalytic activity here.
Low-temperature deNO x activities of (a) MC(X)-PVP-400 and (b) MC(1:1)-PVP-Y (X = 1/7, 1/3, 3/5, 1/1, and 5/3; Y = 400, 550, and 700).

IV. CONCLUSION
The MnO x –CeO2 solid solution was successfully synthesized by PVP-assisted SAS precipitation. It is found that with increasing Mn content, the specific surface areas and pore volumes were largest at 107.6 m2/g and 0.195 cm3/g, respectively for the Mn/Ce molar ratio of 3:5, but both of them decreased with increasing calcination temperature. Higher Mn content contributes to surface richer with active oxygen species and manganese species, the formation of higher valence of manganese (XPS), higher oxygen mobility (TPR), higher capability of oxygen activation (TPO), and more oxygen vacancies (Raman). However, lower calcination temperature favors higher oxygen mobility, higher capability of oxygen activation, and more oxygen vacancies. The catalyst with a moderate Mn/Ce molar ratio of 1:1 and low calcination temperature of 400 °C exhibited the highest catalytic activity for low-temperature SCR deNO x due to the combination of high surface area and high redox performance.
ACKNOWLEDGMENTS
The project is financially supported by the National Natural Science Foundation of China (Grant No. 20976120) and the Natural Science Foundation of Tianjin (Grant No. 09JCYBJC06200).