





Introduction
Rice (Oryza sativa L.) is the staple food for more than half of the global population and plays a pivotal role in ensuring food security, particularly across Asia. In India, especially in Kerala, rice cultivation is closely linked to rural livelihoods, cultural traditions, and the agricultural economy. However, rice production is increasingly constrained by rapid urbanization, climate change, declining water availability, and the continuous reduction in cultivated area. In India, rice is currently grown on approximately 44 million ha (CGIAR 2023), and this area is projected to decline to about 40 million ha in the coming decades due to competing land uses and increasing pressure on water resources (NITI Aayog 2026). The decline is even more pronounced in Kerala, where the area under rice cultivation decreased from 310,521 ha in 2002 to 2003 (GOK 2023) to approximately 191,000 ha in 2022 to 2023 (GOK 2024). Under these circumstances, sustaining rice production will require increasing productivity per unit area while improving the efficient use of land, water, and other agricultural resources.
Weeds are among the major constraints to rice production, causing substantial reductions in yield, grain quality, and farm profitability. Over time, weed species adapt to cropping systems and management practices, becoming well suited to cultivated environments (Tominaga and Yamasue Reference Tominaga and Yamasue2004). Among them, the Echinochloa complex is one of the most problematic weed groups in rice ecosystems because of its adaptation to flooded conditions and strong competitive ability. In Kerala, barnyardgrass [Echinochloa crus-galli (L.) P. Beauv.] is the predominant Echinochloa species, occurring in both short-awned and long-awned forms, with the latter being more prevalent (Aparna et al. Reference Aparna, Menon, Joseph and Prameela2018).
As C4 weeds, Echinochloa species cause substantial yield losses in rice by competing aggressively for light, nutrients, water, and space. Their rapid growth, prolific tillering, and greater plant height enable them to intercept a larger proportion of incoming light, thereby reducing canopy photosynthesis, biomass accumulation, and ultimately grain yield (Sujinah et al. Reference Guntoro2022). Among these species, E. crus-galli is regarded as one of the world’s most destructive weeds in rice. Its C4 photosynthetic pathway, rapid growth, prolific seed production, and strongly competitive nature allow severe infestations to reduce rice yield by up to 50% (Aminpanah et al. Reference Aminpanah, Sorooshzadeh, Zand and Moumeni2013). However, the extent of yield loss varies with species, weed density, crop management practices, and environmental conditions. Zhang et al. (Reference Zhang, Gu, Zhao, Yang, Peng, Li and Bai2017) reported grain yield reductions of 12.7% to 42.6% due to rough barnyardgrass [Echinochloa muricata (P. Beauv.) Fernald var. microstachya Wiegand; syn.: Echinochloa crus-galli var. mitis (Pursh) Peterm.], 22.3% to 55.2% due to alkali barnyardgrass [Echinochloa crus-pavonis (Kunth) Schult. var. macera (Wiegand) Gould; syn.: Echinochloa crus-galli (L.) P. Beauv. var. zelayensis (Kunth) Hitchc.], and 1.5% to 12.1% due to jungle rice [Echinochloa colona (L.) Link]. Even moderate infestations can substantially reduce yield components; for example, a 10% improvement in weed control increased panicle density by 14 m−2 and grain yield by 750 kg ha⁻1 (Ottis and Talbert Reference Ottis and Talbert2007). These findings highlight the importance of understanding the ecology, competitive ability, and emergence dynamics of Echinochloa species in order to develop timely and sustainable weed management strategies.
Seedling emergence is a critical determinant of weed persistence and is strongly influenced by seed burial depth. Previous studies consistently demonstrate that emergence is greatest when seeds remain on or near the soil surface and declines sharply with increasing burial depth, with little or no emergence beyond 6 to 8 cm (Abouziena et al. Reference Abouziena, El-Awadi, El-Saeid, El-Metwally, El-Desouki and Singh2015; Chauhan and Johnson Reference Chauhan and Johnson2011; Opena et al. Reference Opena, Chauhan and Baltazar2014; Walker et al. Reference Walker, Wu and Bell2010; Yuan et al. Reference Yuan, Gao, Fang, Shen and Tian2025). These findings suggest that deep tillage or stale seedbed preparation can effectively suppress weed emergence by placing seeds below their maximum emergence depth.
Water management also plays a crucial role in regulating Echinochloa emergence. Although some species can germinate under submerged conditions, increasing flooding depth and duration generally reduce emergence and seedling survival. For example, no seedlings of cockspur/barnyardgrass (Echinochloa caudata Roshev.) survived under 20 cm of flooding (Liu et al. Reference Liu, Jiang, Tong, Zhang, Wu, Liu and Lu2016), whereas deeper flooding significantly reduced the emergence and biomass of E. colona and jungle rice [E. crus-pavonis (Kunth) Schult.] (Kent and Johnson Reference Kent and Johnson2001). Likewise, flooding to a depth of 10 cm immediately after sowing markedly reduced weed emergence (Estioko et al. Reference Estioko, Miro, Baltazar, Merca, Ismail and Johnson2014), while moderate flooding depths (2 to 5 cm) decreased E. crus-galli emergence by 53% to 65% (Chamara et al. Reference Chamara, Marambe, Kumar, Ismail, Septiningsih and Chauhan2018). Integrating water management with herbicide application has also been reported to improve weed control (Dorji et al. Reference Dorji, Chauhan, Baltazar and Johnson2013).
Cultural practices such as straw mulching provide an effective means of suppressing weeds while reducing dependence on herbicides. Rice straw and other crop residues have been shown to reduce the emergence, plant height, and biomass of E. crus-galli (Balderas and Osillos Reference Balderas and Osillos2023). In direct-seeded rice, mulch application at 7,000 to 9,000 kg ha−1 reduced weed density by more than 98% (Zhu et al. Reference Zhu, Liang, Yang, Wang, Shi, Wang, Zhou, Lu, Islam, Xu and DiTommaso2020), while paddy straw applied at 6,250 kg ha−1 significantly suppressed E. colona (Kaur et al. Reference Kaur, Kaur and Kaur2024). The suppressive effect is primarily attributed to the physical barrier created by the mulch layer, which limits light penetration and impedes seedling emergence. Similar improvements in weed suppression have been reported with mulch rates of 6,000 to 8,000 kg ha−1 (Dash et al. Reference Dash, Priyadarshini, Jena, Behera, Shankar, Palai and Behera2024; Sangramsingh et al. Reference Sangramsingh, Dash, Chowdhury, Nanda, Sar, Behera and Gulati2022). Although manual weeding is environmentally safe and highly effective, it is labor-intensive and often impractical at scale. Herbicides provide efficient and economical weed control; however, their prolonged use is increasingly limited by the evolution of herbicide resistance and environmental concerns (Tranel and Wright Reference Tranel and Wright2002). Consequently, integrating cultural, mechanical, and chemical approaches is essential for sustainable weed management in rice.
Despite extensive research, Echinochloa species remain among the most difficult weeds to manage because of their ecological adaptability, variable emergence patterns, and morphological similarity to rice during early growth. Understanding their responses to key agronomic factors is therefore essential for improving weed management strategies.
Most available information on Echinochloa species has been generated from studies conducted outside India, with relatively limited evidence from the unique rice ecosystems of Kerala. Weed populations often differ in their germination ecology and responses to management practices because of variations in climate, soil conditions, and cropping systems. Consequently, E. crus-galli populations in Kerala may respond differently to seed burial, flooding, and residue management than populations reported in other regions. To address this knowledge gap, the present study provides one of the first comprehensive evaluations in Kerala of three important cultural weed management practices by independently assessing the effects of seed burial depth, flooding depth, and rice straw mulch rate on the emergence and early growth of E. crus-galli. The findings provide location-specific evidence to support the development of effective and sustainable cultural weed management strategies for rice-based production systems in Kerala.
Materials and Methods
Location
Germination studies were conducted in an open net house at the Department of Agronomy, College of Agriculture, Vellayani, Kerala, India (8.50°N, 76.90°E; 29 m above mean sea level) to evaluate the effects of seed burial depth, flooding depth, and rice straw mulch on the emergence of E. crus-galli, with the objective of developing sustainable ecological weed management strategies for wet-seeded rice. Mature seeds of E. crus-galli were collected from natural populations at two nearby locations (8.47°N, 76.96°E and 8.54°N, 76.94°E), representing an area of approximately 0.50 ha. Seeds were sampled from more than 250 individual plants and collected exclusively from primary tillers to ensure uniform seed maturity. After collection, the seeds were shade-dried to a moisture content of approximately 8% and stored in moisture-proof containers at 2 C in a laboratory refrigerator until use. Before the experiments were initiated, seed germination was evaluated using the roll paper method under ambient conditions to confirm seed viability and the absence of dormancy. Only seed lots with a minimum germination of 75% were used in the study.
Soil
Soil for the pot experiments was collected from the Instructional Farm, College of Agriculture, Vellayani. The soil was sterilized by autoclaving at 121 C and 1.5 atm pressure for 2 h to eliminate viable seeds. The soil was acidic (pH 5.5) with normal electrical conductivity (0.1 dS m−1), medium organic carbon (0.56%), low available nitrogen (245.2 kg ha−1), high available phosphorus (45.2 kg ha−1), and medium available potassium (226.7 kg ha−1).
Effect of Seed Burial Depth on Emergence and Seedling Growth
Two consecutive trials were conducted during August to September 2024 in an open net house with a translucent polycarbonate roof (4-mm thick) at the Department of Agronomy, College of Agriculture, Vellayani, Kerala, India. The first trial (August 1 to 14, 2024) recorded maximum and minimum temperatures of 33.2 C and 23.3 C, respectively, with a total rainfall of 29 mm. The second trial (August 25 to September 7, 2024) recorded temperatures of 31.6 C and 22.7 C, respectively, with a total rainfall of 78.2 mm. The experiment was conducted using plastic pots (22-cm height and 20-cm diameter) arranged in a completely randomized design (CRD) with nine treatments representing seed burial depths of 0 to 8 cm, each replicated three times.
Twenty-five seeds of E. crus-galli were placed in each pot at the respective depths. Burial depth was established by filling each pot to the required level, placing the seeds, and covering them with additional soil to reach the designated depth. Pots were irrigated as needed to maintain soil moisture near field capacity.
Seedling emergence was recorded daily up to 14 d after sowing (DAS). Seedlings were considered emerged when the coleoptile or first leaf emerged above the soil surface. At 14 DAS, seedlings were carefully uprooted to avoid damage, and shoot length and root length were measured. Shoot length was measured from the stem base to the tip of the longest leaf, whereas root length was measured from the stem base to the root tip. Samples were then oven-dried at 65 ± 5 C until constant weight, and seedling biomass (shoot and root combined) was expressed as milligrams per plant. Measurements of shoot length, root length, seedling length, and biomass were recorded from five randomly selected plants per pot, and mean values were calculated. Shoot length, root length and seedling length were expressed in cm and seedling biomass was expressed in milligram. When fewer than five plants were available for certain treatments, observations were taken from all available plants and averaged.
Effect of Flooding Depth on Seedling Survival and Seedling Growth
Two consecutive trials were conducted during September to October 2024 in an open net house with a translucent polycarbonate roof (4-mm thick) to evaluate the effect of flooding depth on seedling survival and seedling growth of E. crus-galli. The first trial (September 11 to October 1, 2024) recorded maximum and minimum temperatures of 32.4 C and 21.2 C, respectively, with a total rainfall of 80.1 mm. The second trial (October 1 to 21, 2024) recorded temperatures of 32.4 C and 21.2 C, respectively, with a total rainfall of 305.4 mm.
The experiment was conducted in plastic pots (22-cm height and 20-cm diameter) without drainage holes. Treatments consisted of eight flooding depths (1 to 8 cm) arranged in a CRD with three replications.
Twenty-five seeds of E. crus-galli were sown on the soil surface in each pot. In the flooding experiment, pots were maintained at field capacity for the first 4 d to facilitate seed germination. Flooding treatments were initiated at 4 DAS according to the respective treatment levels and maintained continuously for 21 d. Floodwater depth was monitored daily and maintained at the designated treatment level throughout the experimental period.
Seedling emergence was recorded daily up to 21 DAS. Shoot length, root length, seedling length, and biomass were determined as described for the seed burial experiment. In treatments with fewer than five plants, observations were recorded from all available plants and averaged accordingly
Effect of Rice Straw Mulch on Emergence and Seedling Growth
Two consecutive trials were conducted during October to November 2024 in the open net house with a translucent polycarbonate roof (4-mm thick) to evaluate the effect of rice straw mulch rate on the emergence and seedling growth of E. crus-galli. The first trial (October 20 to November 2, 2024) recorded maximum and minimum temperatures of 32.6 C and 22 C, respectively, with a total rainfall of 121.7 mm. The second trial (November 10 to 23, 2024) recorded temperatures of 33.0 C and 21.5 C, respectively, with a total rainfall of 33 mm.
The experiment was conducted in plastic pots (22-cm height and 20-cm diameter) arranged in a CRD with six rice straw mulch rates (0, 2,000, 4,000, 6,000, 8,000 and 10,000 kg ha−1), each replicated three times.
Twenty-five seeds were sown on the soil surface (0-cm depth) in each pot. The required quantity of rice straw per pot was calculated based on pot surface area and applied uniformly. Seedling emergence was recorded daily up to 14 DAS. Daily seedling emergence was calculated from the difference between cumulative emergence counts recorded on successive days. At 14 DAS, seedlings were carefully uprooted.
In this experiment, shoot length, root length, seedling length, and seedling biomass were measured using the same procedure as in the seed burial depth and flooding depth experiments. The following emergence and seedling vigor indices were calculated using daily emergence counts, total seedling emergence, seedling length, and seedling biomass recorded in each experiment.
Emergence percentage (EP) (ISTA 1985):
 ${\rm{EP}}\, = \left( {{{{\rm{Number}}\;{\rm{of}}\;{\rm{seedlings}}\;{\rm{emerged}}} \over {{\rm{Total}}\;{\rm{number}}\;{\rm{of}}\;{\rm{seeds}}\;{\rm{sown}}}}} \right) \times 100$
Speed of emergence (SE) (Czabator Reference Czabator1962):
 ${\rm{SE}}\; = \Sigma \left( {{{ni} \over {{\rm{di}}\;}}} \right)$
where ni is the number of seeds emerged on day i, and di is the days after sowing.
Emergence rate index (ERI) (Esechi Reference Esechi1994):
 ${\rm{ERI}}\; = \Sigma \left( {{{Ei} \over {{\rm{di}}\;}}} \right)$
where Ei is the emergence percentage on day i, and di is the day of observation.
Emergence index (EI) (Benech et al. Reference Benech, Fenner and Edwards1991):
 ${\rm EI} = 14{\rm{ }} \times {n}_1 + 13{\rm{ }} \times {n}_2 + ... + 1{\rm{ }} \times {n_{14}}$
where n 1 is the number of seeds emerged on day 1, n 2 is the number of seeds emerged on day 2…n 14.
Seedling vigor indices (Abdul-Baki and Anderson Reference Abdul-Baki and Anderson1973):
 $\rm {SVI\;I = EP \times mean\;seedling\;length}$
 $\rm{SVI\;II = EP{\rm{ }} \times mean\;seedling\;dry\;weight}$
Statistical Analyses
Three independent pot experiments were conducted in a CRD with three replications. Confirmatory trials were performed to ensure the reliability of the results. Data were tested for homogeneity of variance using Bartlett’s test. Because the treatment by trial interaction was not significant for emergence indices and other measured parameters, the data were pooled for further analysis. Variables showing high variability were subjected to a square-root transformation to stabilize variance and improve normality.
Each experiment was analyzed independently using ANOVA as described by Panse and Sukhatme (Reference Panse and Sukhatme1985). The statistical model included a single fixed factor corresponding to the treatment factor evaluated in each experiment, namely seed burial depth, flooding depth, or rice straw mulch rate. Significance was tested using the F-test (Snedecor and Cochran Reference Snedecor and Cochran1967), and treatment means were compared using the LSD test at P < 0.05. Pearson’s correlation analysis was performed to examine the relationships between seed burial depth, flooding depth, rice straw mulch rate, and the emergence indices and seedling vigor of E. crus-galli. Regression analyses were performed to characterize the relationships of seed burial depth, flooding depth, and rice straw mulch rate with seedling length and biomass of E. crus-galli. Linear models were fit initially, and quadratic models were adopted only when the quadratic term was significant (P < 0.05). Model selection was further supported using adjusted R2 and Akaike information criterion (AIC), with all analyses performed using individual replicate observations.
All analyses were carried out using GrapesAgri1, an open-source R-based package developed by Kerala Agricultural University and ICAR–IASRI (Gopinath et al. Reference Gopinath, Parsad, Joseph and VS2021).
Results and Discussion
Effect of Seed Burial Depth on Emergence and Seedling Growth
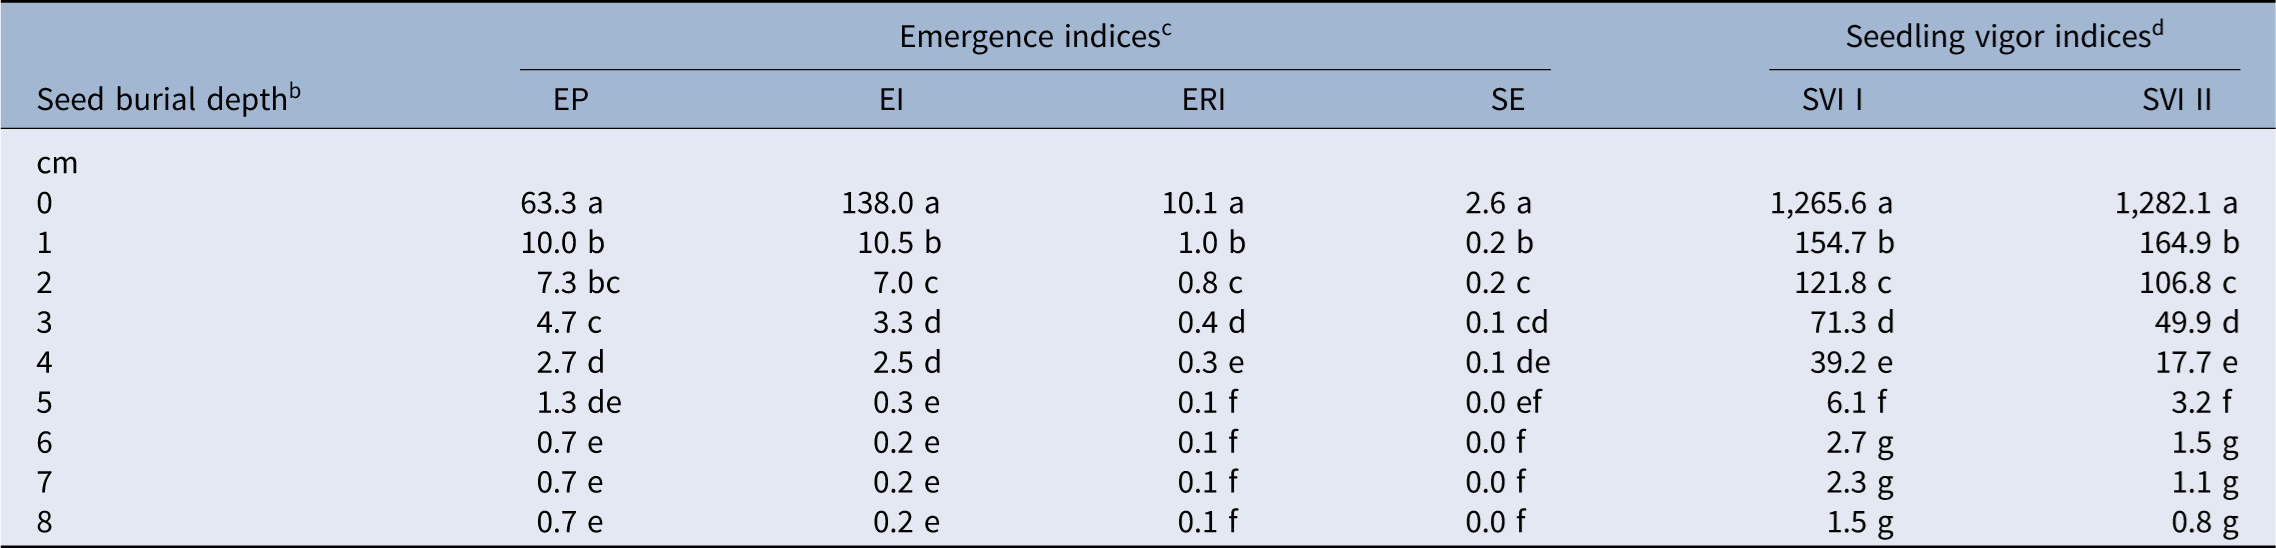
Seed burial depth significantly influenced the emergence parameters of E. crus-galli. Pooled data indicated that surface placement resulted in significantly higher emergence (63.3%), followed by seed burial at 1 cm. Emergence declined progressively with increasing burial depth, with an 84% reduction observed at 1 cm compared with surface placement. Although emergence occurred at greater depths (6 to 8 cm), it was negligible (<1%).
A similar trend was observed for the EI, ERI, and SE. Surface-placed seeds recorded the highest EI (138.0), ERI (10.1), and SE (2.6), whereas the lowest values were observed at greater burial depths (6 to 8 cm) (Table 1). All emergence parameters consistently decreased with increasing burial depth.
Effect of seed burial depth on the emergence and seedling vigor indices of Echinochloa crus-galli a

Table 1. Long description
The table presents data on the effect of seed burial depth on emergence and seedling vigor indices of Echinochloa crus-gallia. It has 9 rows and 8 columns. The columns are labeled as follows: Seed burial depth (cm), EP, EI, ERI, SE, SVI I, and SVI II. The row labels indicate the seed burial depth in centimeters ranging from 0 to 8. Each row provides values for the emergence indices (EP, EI, ERI, SE) and seedling vigor indices (SVI I, SVI II) at different burial depths. Notable trends include the highest values for EP, EI, ERI, SE, SVI I, and SVI II at 0 cm burial depth, with values decreasing as burial depth increases. The lowest values are observed at burial depths of 6 to 8 cm.
a Values presented are original (untransformed) mean values for emergence indices and seedling vigor indices, based on the pooled data from two independent trials. Means with the same letter within a column are not significantly different at P ≤ 0.05 based on Fisher’s protected LSD test.
b Seed burial depth includes nine different depths: 0, 1, 2, 3, 4, 5, 6, 7, and 8 cm.
c EI, emergence index; EP, emergence percentage; ERI, emergence rate index; SE, speed of emergence. Emergence indices EP, SE, EI, and ERI were calculated by considering the E. crus-galli seedlings that emerged on each day up to 14 d after sowing.
d SVI I, seedling vigor index I; SVI II, seedling vigor index II. Seedling vigor index SVI I was calculated by considering the emergence percentage and seedling length of E. crus-galli, and SVI II was calculated by considering the emergence percentage and seedling biomass.
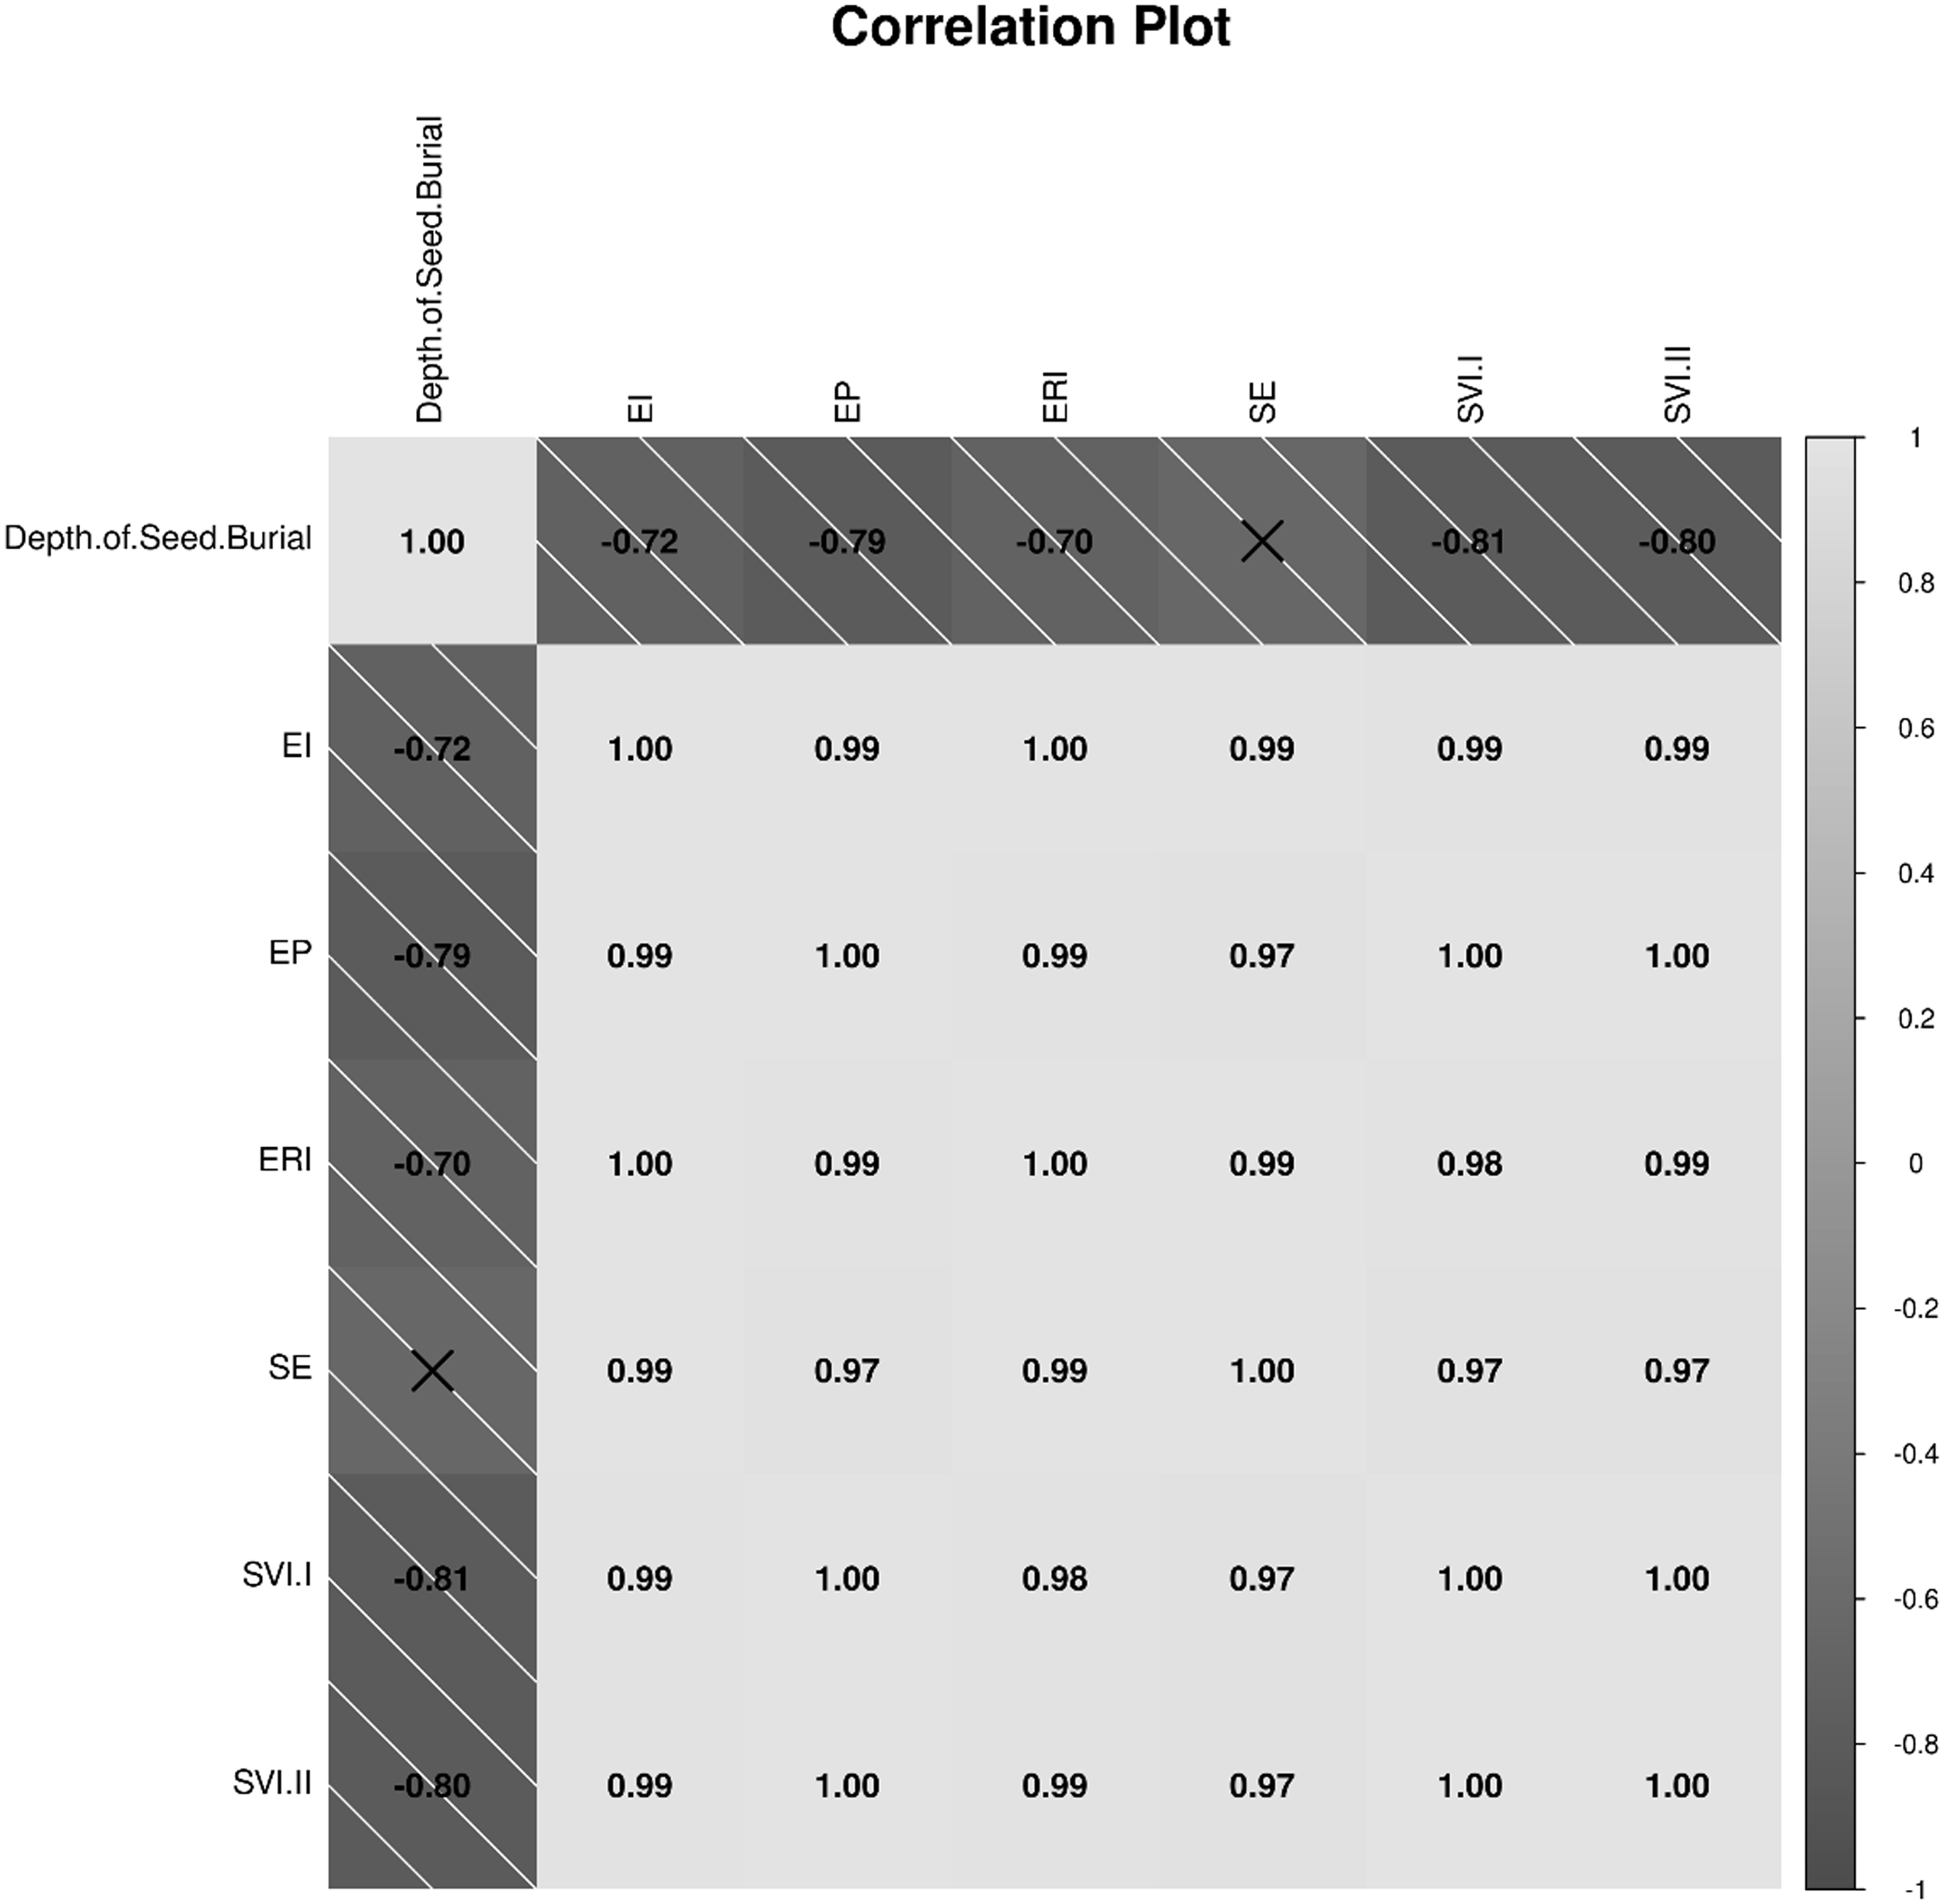
Seedling vigor indices were also significantly affected. Surface placement recorded the highest SVI I and SVI II (1,265.6 and 1,282.1, respectively), whereas the lowest values were recorded at 8-cm depth (1.5 and 0.8, respectively). Pearson correlation analysis revealed a strong negative relationship between burial depth and all emergence parameters, indicating that deeper seed placement (>6 cm) effectively suppresses seedling establishment (Figure 1).
Correlation matrix depicting the relationships among depth of seed burial and emergence indices: emergence index (EI), emergence percentage (EP), emergence rate index (ERI), speed of emergence (SE), seedling vigor index I (SVI I) and seedling vigor index II (SVI II) of Echinochloacrus-galli seedlings.

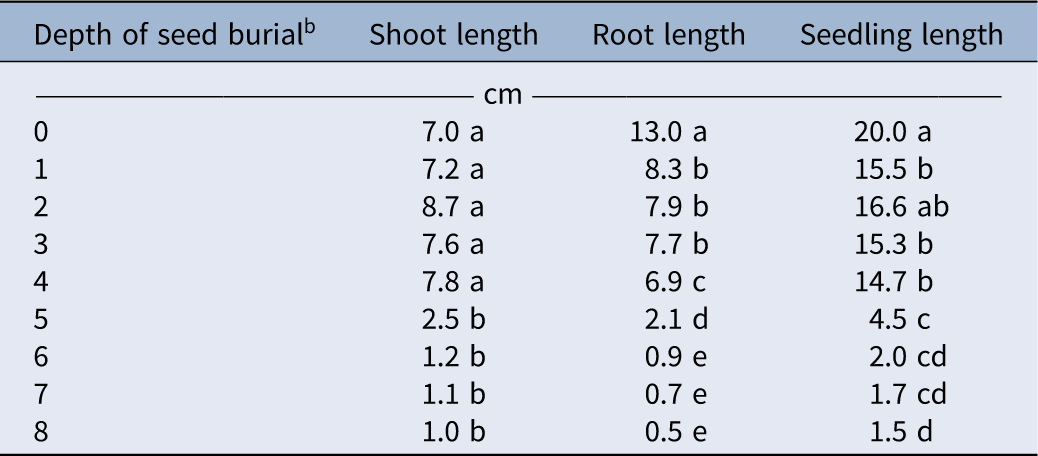
Seedling growth parameters, including shoot length, root length, total seedling length (shoot + root) (Table 2), and seedling biomass (Figure 2), were significantly influenced by seed burial depth. Shoot length was highest at a burial depth of 2 cm (8.7 cm) and was statistically comparable with that of surface-placed seeds and seeds buried at 1, 3, and 4 cm. Shoot length at 5-cm depth was significantly lower than that recorded at shallower burial depths (0 to 4 cm), but was statistically comparable with that at 6, 7, and 8 cm.
Effect of seed burial depth on shoot, root, and seedling length of Echinochloa crus-galli at 14 d after sowinga

Table 2. Long description
The table presents data on seedling growth parameters, including shoot length, root length, and seedling length, at various seed burial depths. It has 9 rows and 4 columns. The columns are labeled ‘Depth of seed burial’, ‘Shoot length’, ‘Root length’, and ‘Seedling length’. The row labels indicate the depth of seed burial in centimeters, ranging from 0 to 8. Each row provides the corresponding measurements in centimeters for shoot length, root length, and seedling length. Notable trends include the highest shoot length at a burial depth of 2 cm and significant variations in root and seedling lengths across different burial depths.
a Values presented are original (untransformed) mean values for shoot length, root length, and seedling length across different treatments, based on the pooled analysis of two independent trials. Means with the same letter within a column are not significantly different at P ≤ 0.05 based on Fisher’s protected LSD test.
b Seed burial depth includes nine different depths: 0, 1, 2, 3, 4, 5, 6, 7, and 8 cm.
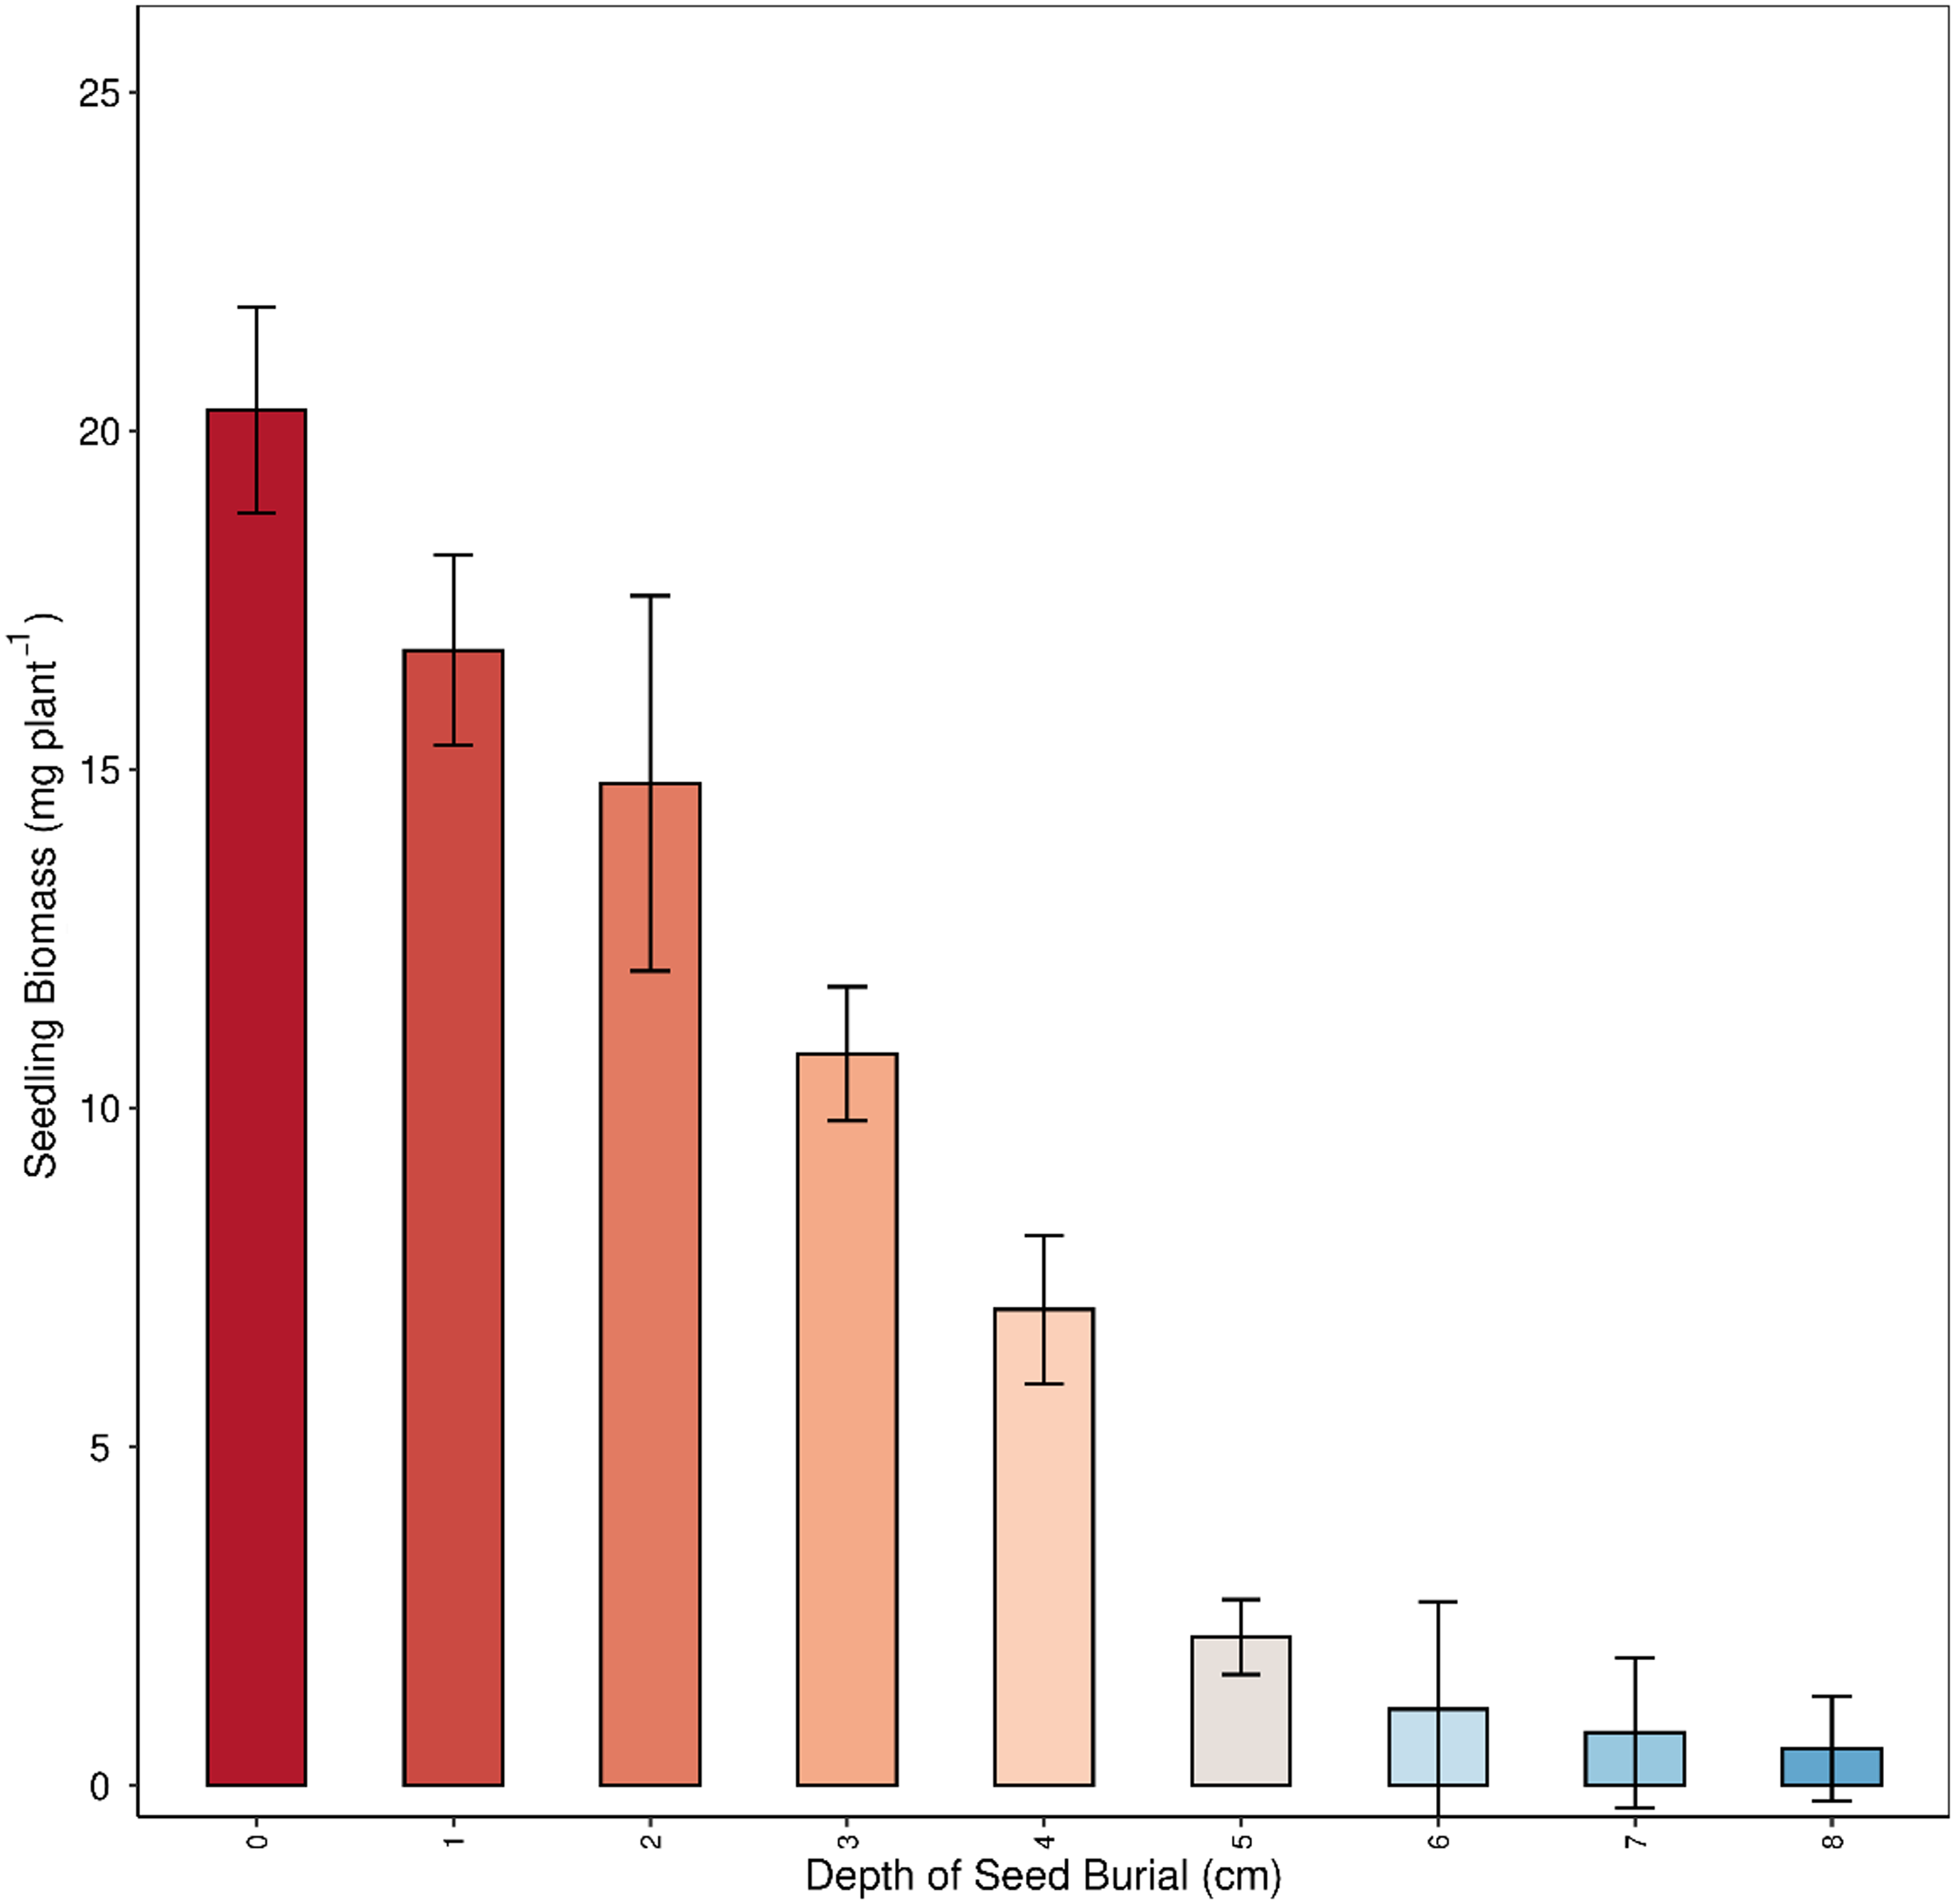
Effect of depth of seed burial on Echinochloa crus-galli seedling biomass at 14 d after sowing.

Root length was greatest in surface-placed seeds (13 cm), followed by seeds buried at 1 cm, and was statistically comparable with those at burial depths of 2, 3, and 4 cm. Seeds buried at 8 cm produced the shortest roots, although they were statistically comparable with those at 6 and 7 cm.
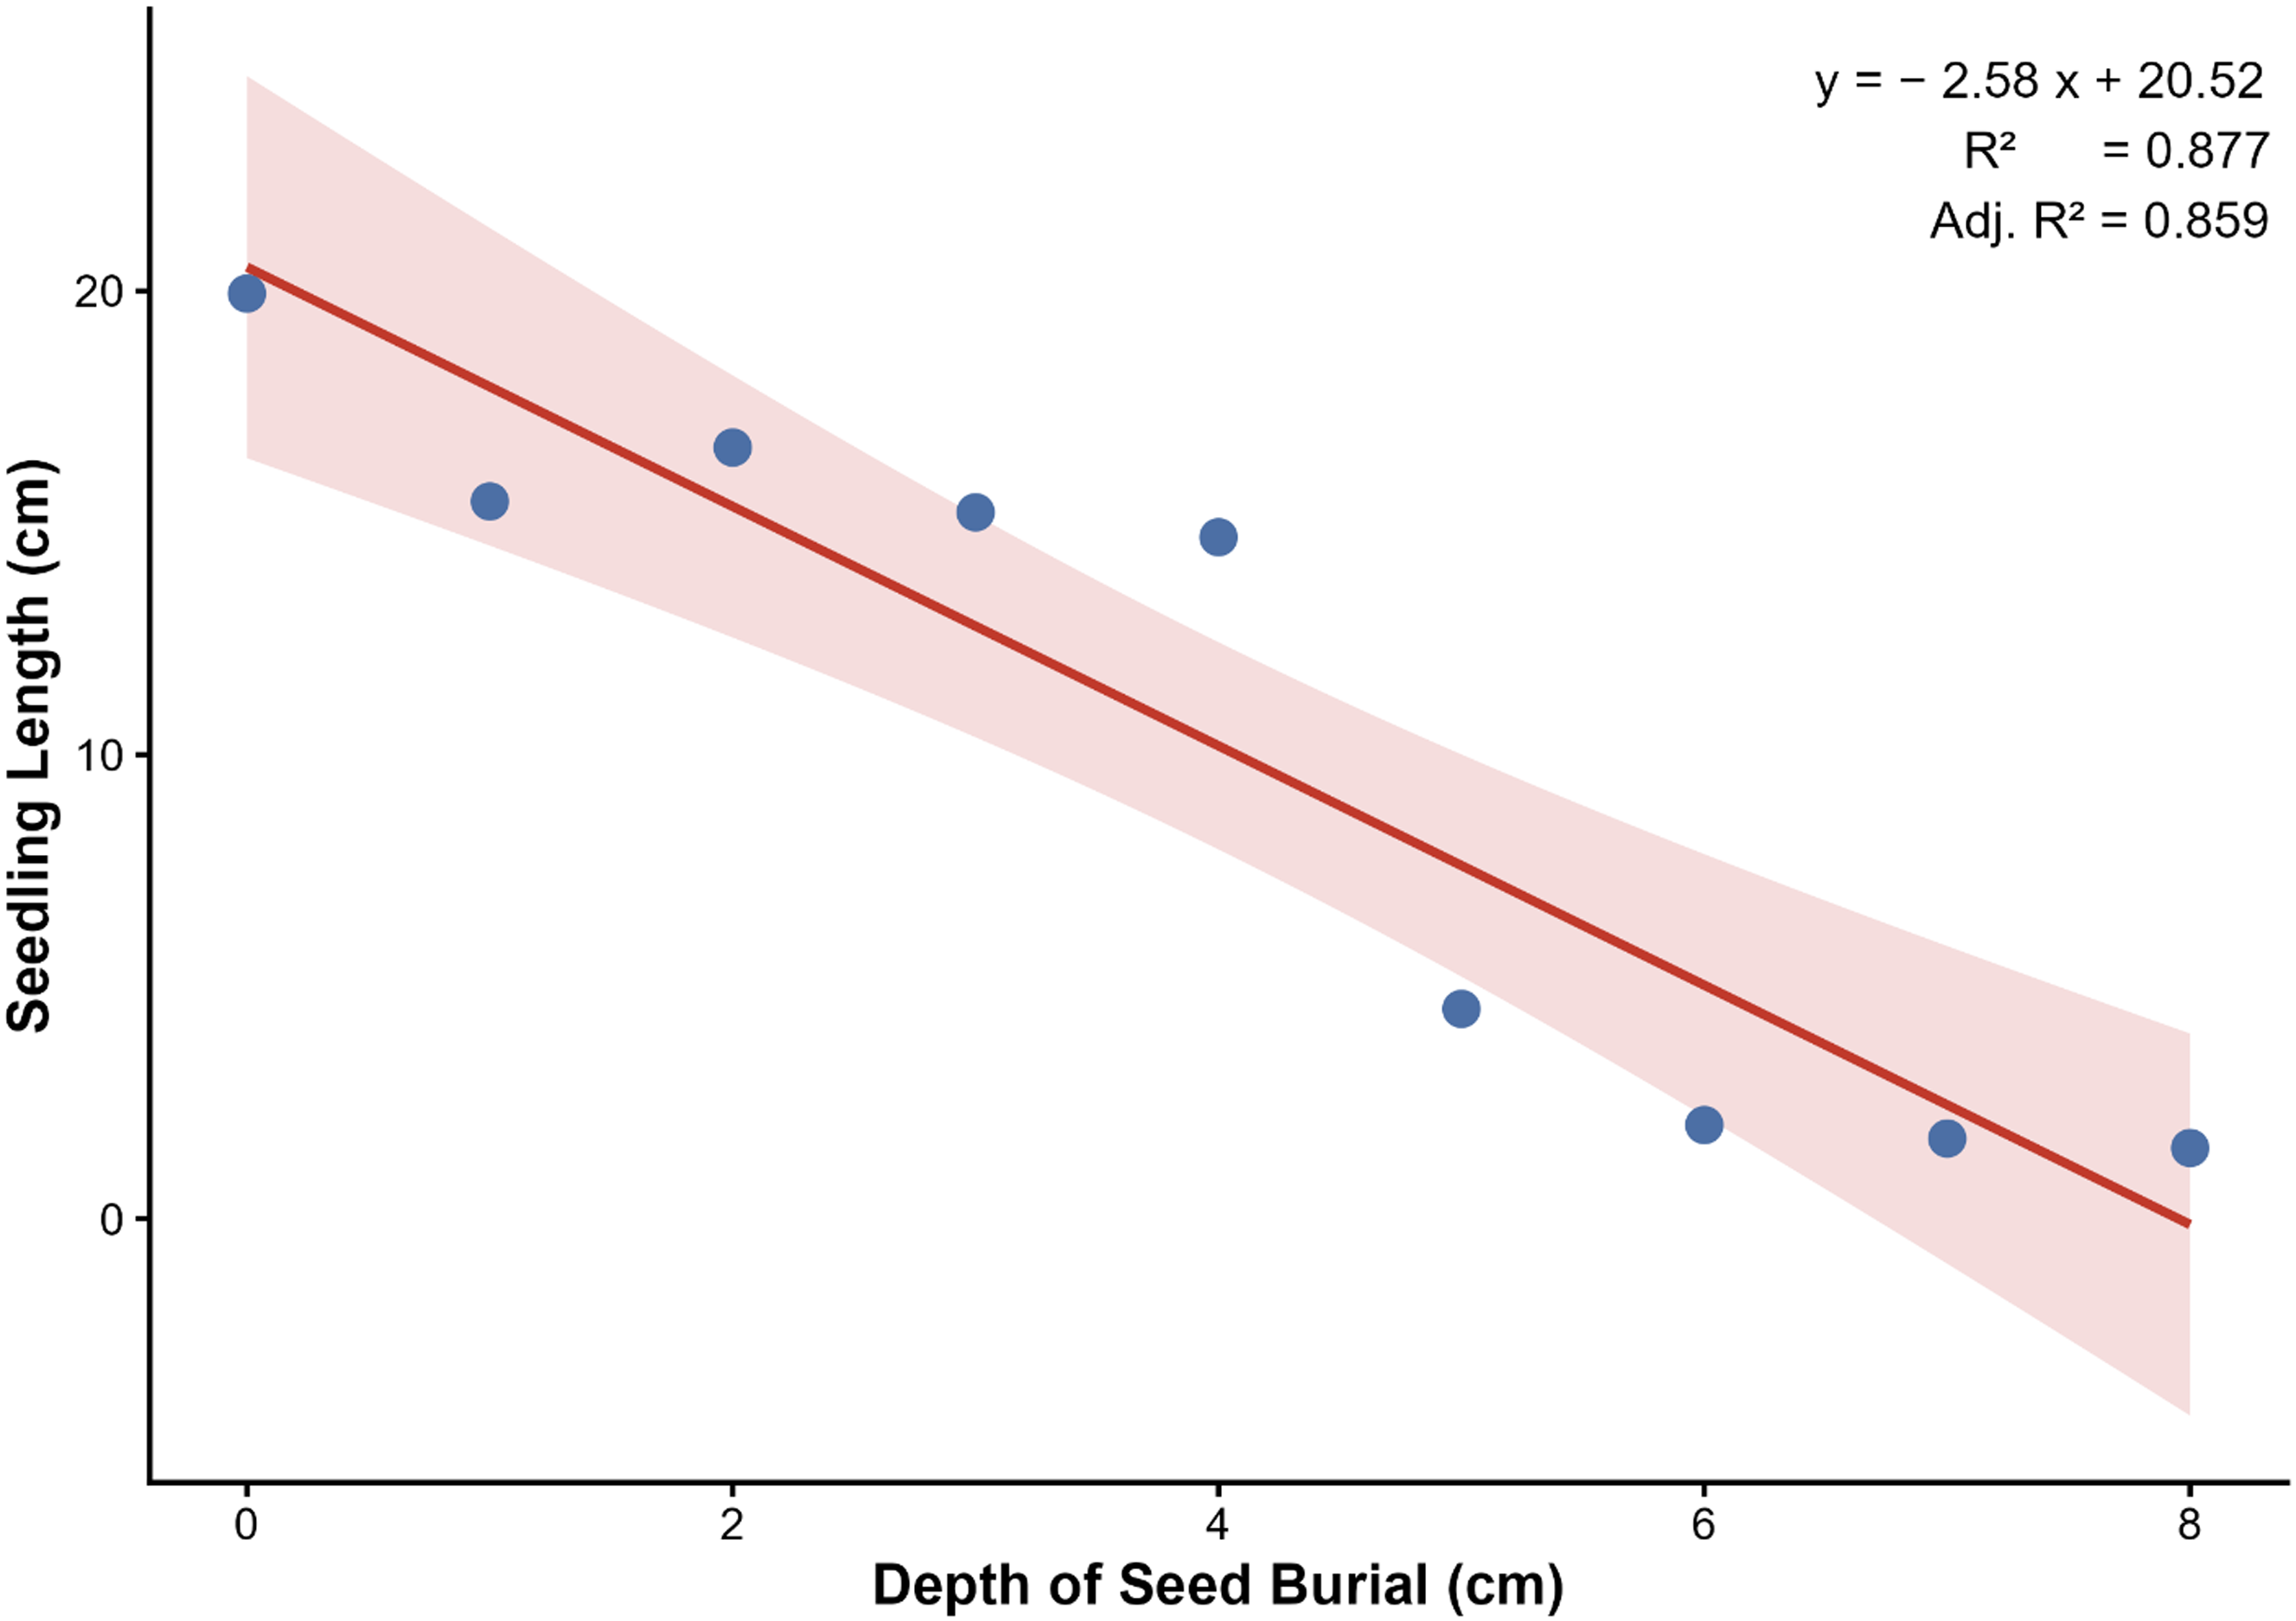
Total seedling length followed a trend similar to that of root length, with a sharp decline beyond 4 cm, including an approximately 70% reduction between 4- and 5-cm burial depth. Seeds buried at 8 cm produced the shortest seedlings.
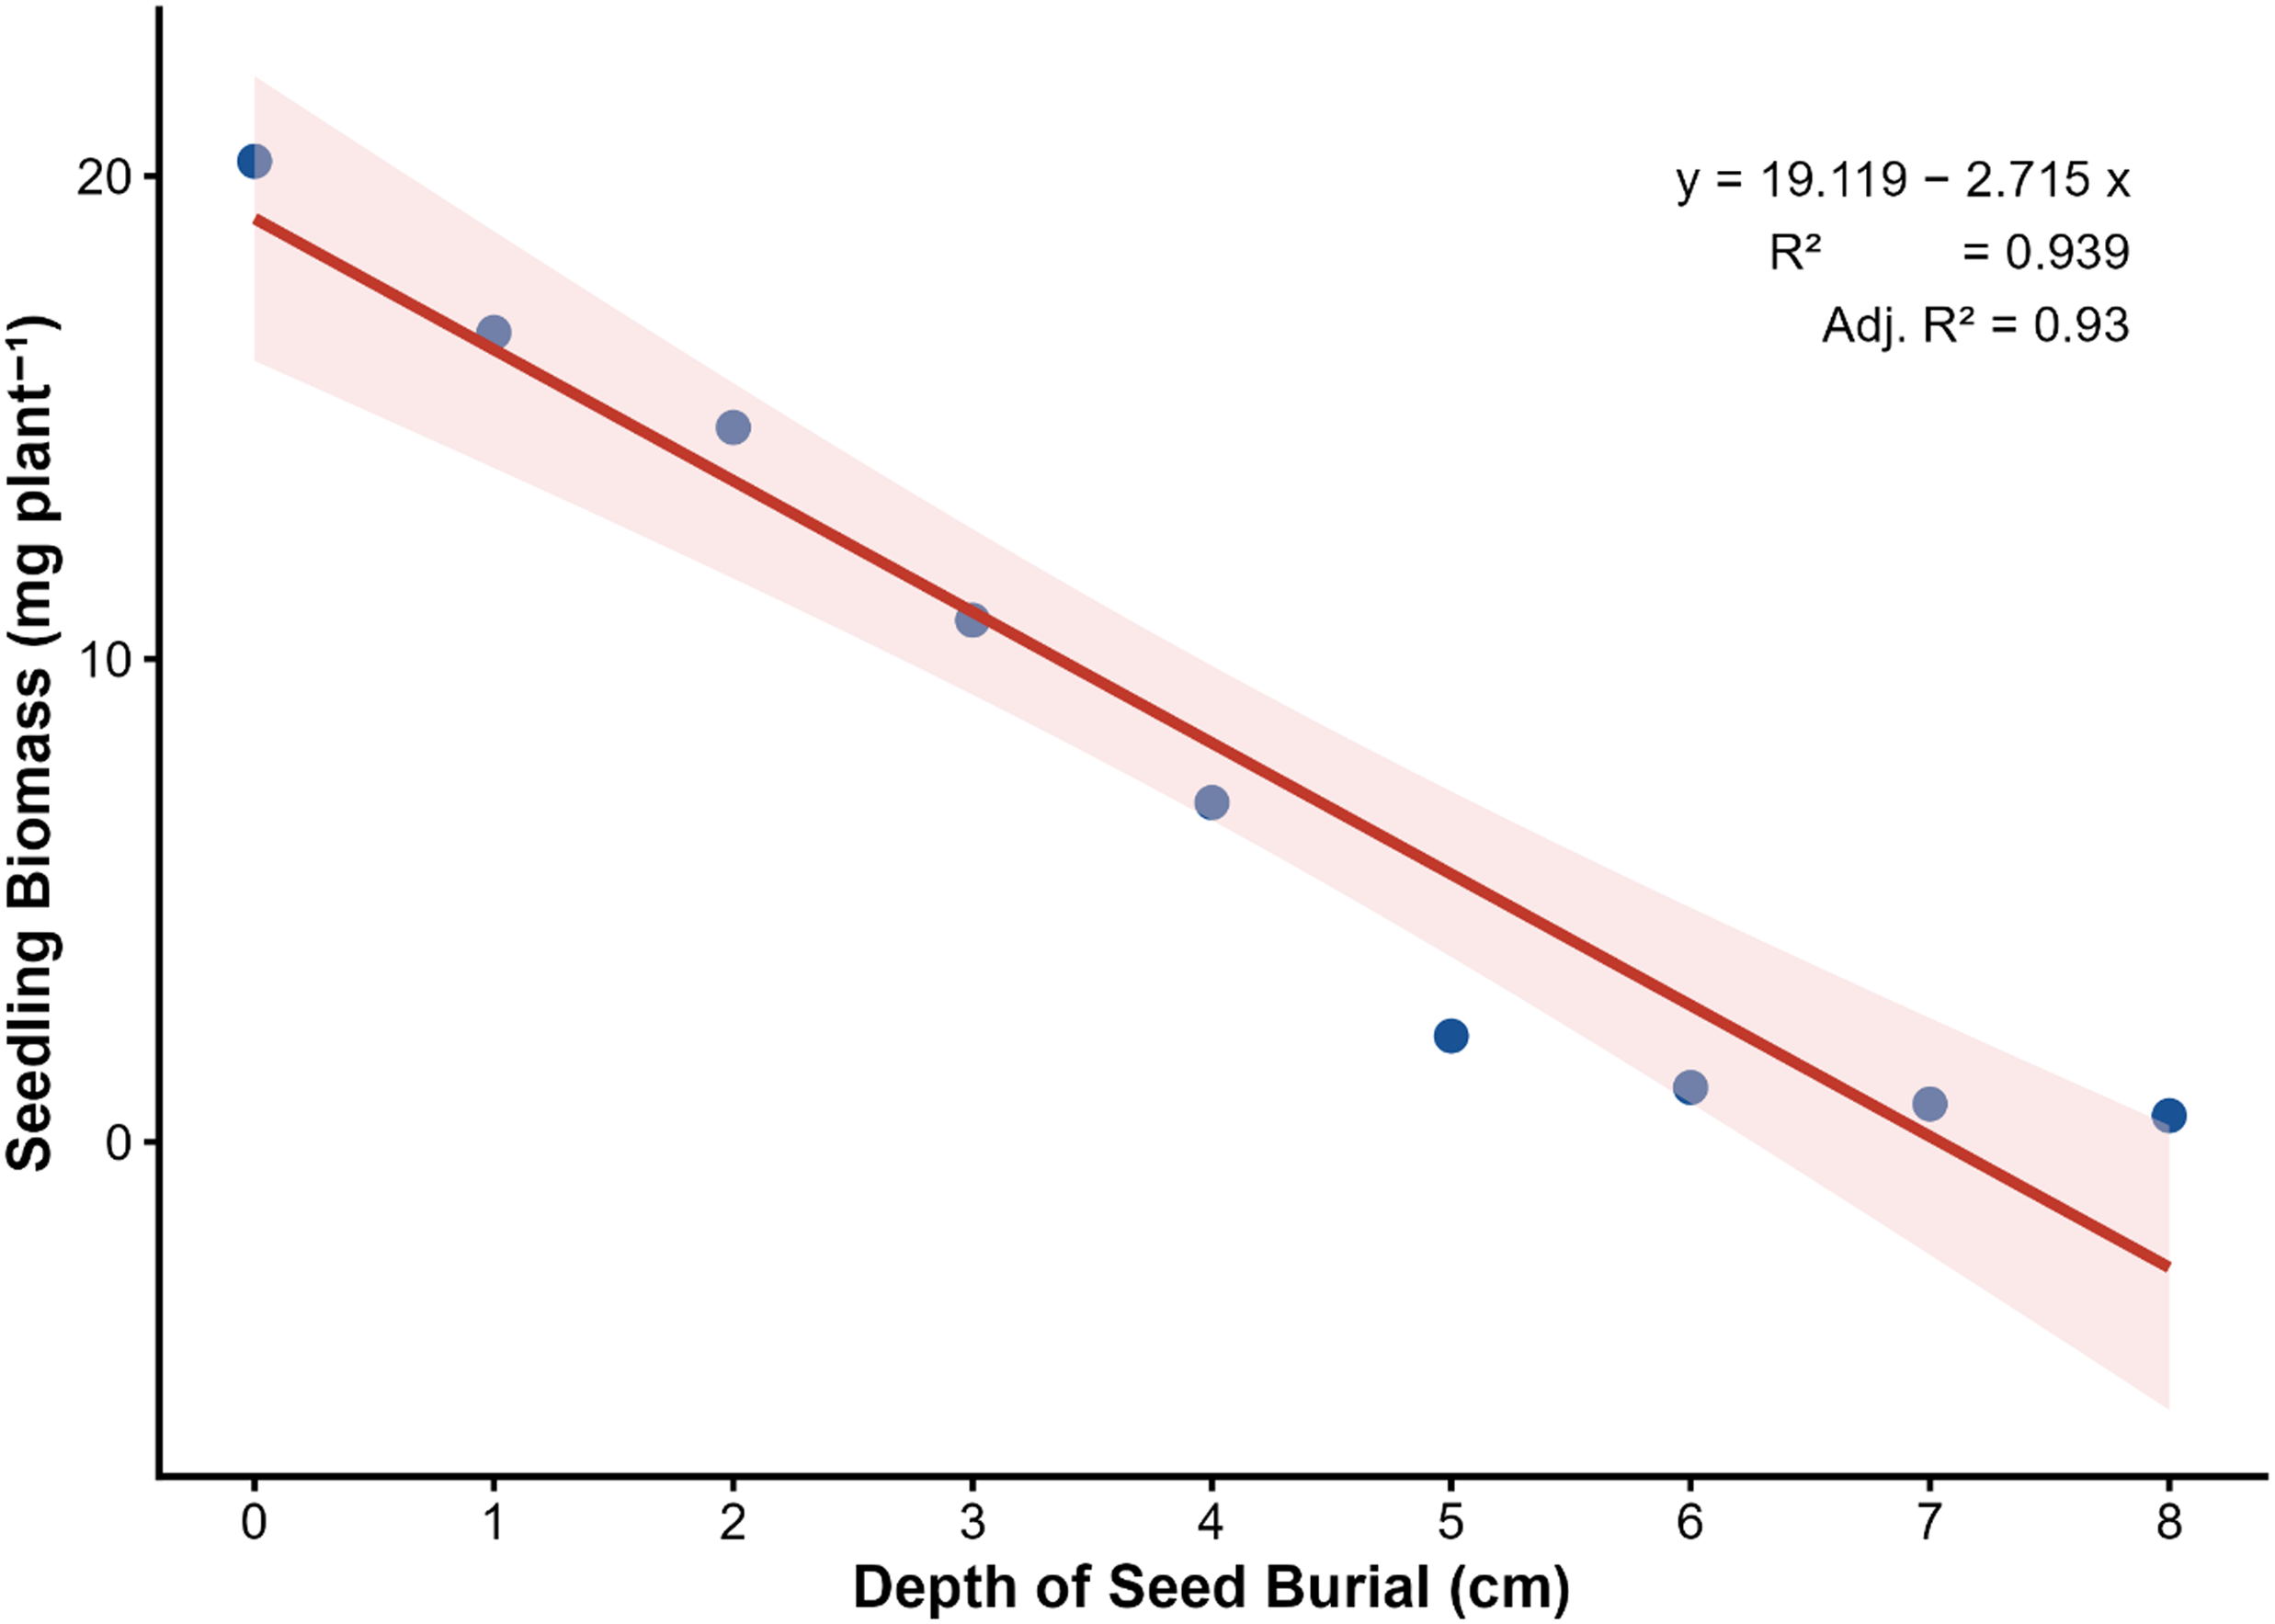
Seedling biomass declined progressively with increasing seed burial depth (Figure 2). Surface-placed seeds produced the highest seedling biomass (20 mg plant−1), which was significantly greater than that of all other treatments, followed by seeds buried at 1 cm (17 mg plant−1). Seeds buried at 8 cm produced the lowest seedling biomass (0.5 mg plant−1), which was significantly lower than that recorded at all other burial depths.
Higher seedling emergence and vigor under surface placement can be attributed to favorable conditions such as greater light availability, improved aeration, and minimal mechanical resistance, all of which promote rapid germination and seedling establishment. In contrast, reduced emergence and seedling growth at greater burial depths are likely due to limited seed reserves, increased soil resistance, and reduced oxygen availability (Abayechaw and Wulchafo Reference Abayechaw and Wulchafo2020; Benvenuti and Mazzoncini Reference Benvenuti and Mazzoncini2018). Seeds buried deeper must expend more energy to reach the soil surface and often lack sufficient reserves, resulting in delayed or failed emergence (Jorgensen et al. Reference Jorgensen, Labouriau and Olesen2019). Restricted gaseous diffusion and hypoxic conditions in deeper soil layers further inhibit seedling emergence (Javaid et al. Reference Javaid, Mahmood, Alshaya, AlKahtani, Waheed, Wasaya, Khan, Naqve, Haider, Shahid and Nadeem2022).
Regression analysis revealed a significant negative linear relationship between seed burial depth and both seedling biomass and seedling length (Figures 3 and 4), indicating that increasing burial depth consistently reduced seedling growth and biomass accumulation in E. crus-galli. Seedlings emerging from deeper soil layers often fail to reach the surface before exhausting their energy reserves (Batlla and Benech-Arnold Reference Batlla and Benech-Arnold2014). Reduced emergence and poor seedling growth at greater burial depths have also been attributed to limited light availability and restricted soil gas exchange (Benvenuti and Macchia Reference Benvenuti and Macchia1995). Opena et al. (Reference Opena, Chauhan and Baltazar2014) similarly reported reduced emergence and biomass of Echinochloa glabrescens Munro ex Hook. f. with increasing burial depth, while Yuan et al. (Reference Yuan, Gao, Fang, Shen and Tian2025) emphasized the importance of light for normal seedling growth in Echinochloa species.
Linear regression model depicting the relationship between depth of seed burial and Echinochloa crus-galli seedling biomass at 14 d after sowing.

Linear regression model depicting the relationship between depth of seed burial and Echinochloa crus-galli seedling length at 14 d after sowing.

These findings are consistent with earlier reports indicating maximum emergence of Echinochloa species at or near the soil surface, with negligible emergence beyond 6 cm. Seed size plays a critical role, as smaller seeds with limited energy reserves exhibit reduced emergence at greater burial depths (Harrison et al. Reference Harrison, Regnier, Schmoll and Harrison2007; Unnikrishnan et al. Reference Unnikrishnan, Raj, Jacob, Pillai, Ameena and Chauhan2025). For instance, the emergence of perennial ryegrass (Lolium perenne L.) declines progressively with increasing burial depth and is completely inhibited beyond 6 to 7 cm (Javaid et al. Reference Javaid, Mahmood, Alshaya, AlKahtani, Waheed, Wasaya, Khan, Naqve, Haider, Shahid and Nadeem2022). Similarly, E. colona shows high emergence under surface placement but no emergence at 6-cm depth (Chauhan and Johnson Reference Chauhan and Johnson2009), while other studies have reported peak emergence at 0 to 0.5 cm and no emergence beyond 6 cm (Yuan et al. Reference Yuan, Gao, Fang, Shen and Tian2025; Zhang et al. Reference Zhang, Wang, Cao, Li and Chauhan2023). However, in the present study, minimal emergence was observed even at 8-cm depth, and the seedlings that emerged exhibited very poor vigor.
Effect of Flooding Depth on Seedling Survival and Seedling Growth
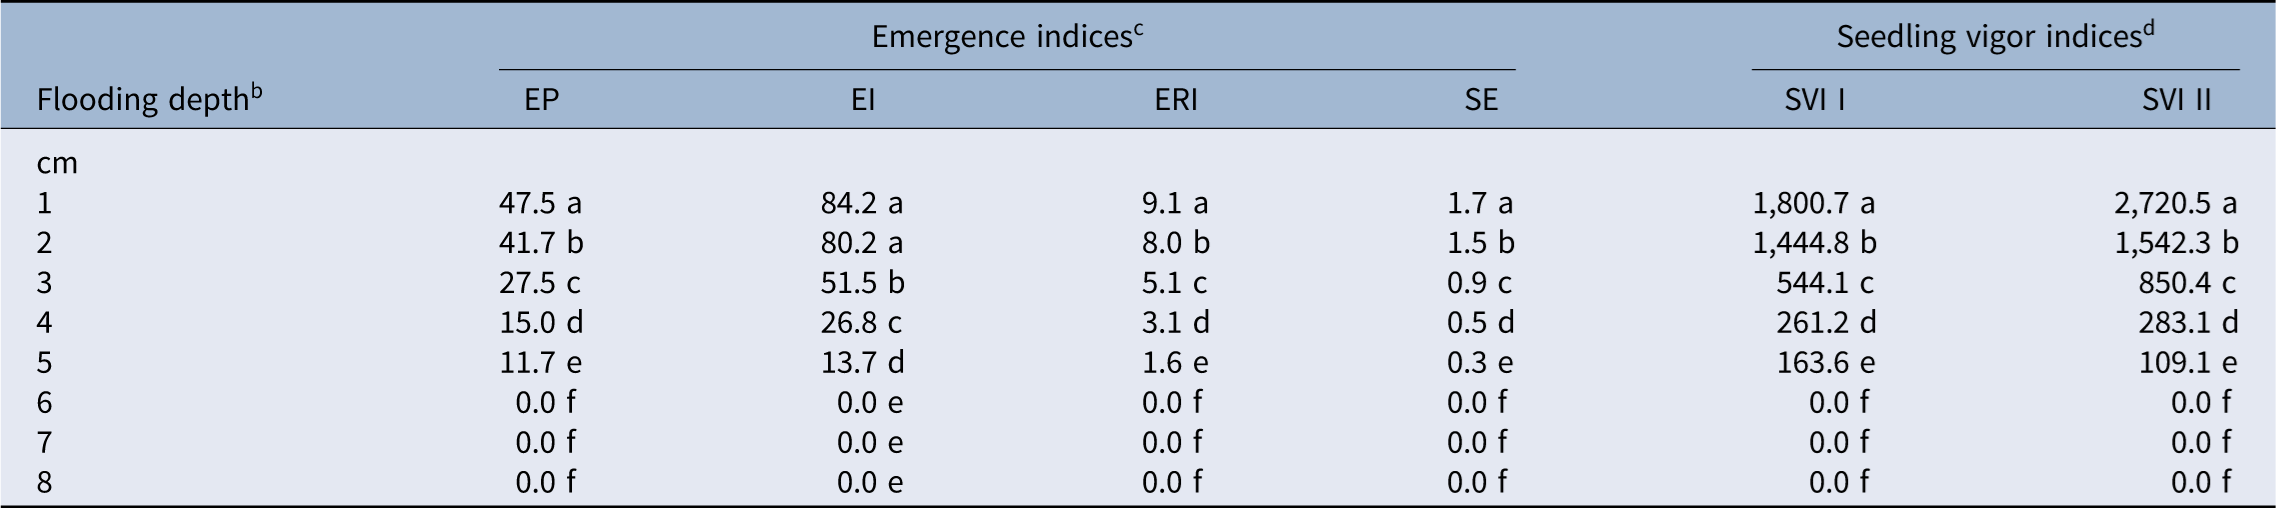
Pooled analysis of the two trials revealed that flooding depth significantly influenced the seedling emergence and vigor of E. crus-galli (Table 3). EP declined progressively with increasing flooding depth, with the highest EP (47.5%) recorded at 1-cm flooding, followed by 2 cm. No emergence was observed at flooding depths ≥6 cm.
Effect of flooding depth on the germination parameters and seedling vigor of Echinochloa crus-galli a

Table 3. Long description
A table with 8 rows and 8 columns. The columns are labeled as Flooding depth, EP, EI, ERI, SE, SVI 1, and SVI 2. The row labels are flooding depths in centimeters ranging from 1 to 8. The table presents data on emergence indices and seedling vigor indices at different flooding depths. Row 1: Flooding depth, 1 cm; EP, 47.5; EI, 84.2; ERI, 9.1; SE, 1.7; SVI 1, 1800.7; SVI 2, 2720.5. Row 2: Flooding depth, 2 cm; EP, 41.7; EI, 80.2; ERI, 8.0; SE, 1.5; SVI 1, 1444.8; SVI 2, 1542.3. Row 3: Flooding depth, 3 cm; EP, 27.5; EI, 51.5; ERI, 5.1; SE, 0.9; SVI 1, 544.1; SVI 2, 850.4. Row 4: Flooding depth, 4 cm; EP, 15.0; EI, 26.8; ERI, 3.1; SE, 0.5; SVI 1, 261.2; SVI 2, 283.1. Row 5: Flooding depth, 5 cm; EP, 11.7; EI, 13.7; ERI, 1.6; SE, 0.3; SVI 1, 163.6; SVI 2, 109.1. Row 6: Flooding depth, 6 cm; EP, 0.0; EI, 0.0; ERI, 0.0; SE, 0.0; SVI 1, 0.0; SVI 2, 0.0. Row 7: Flooding depth, 7 cm; EP, 0.0; EI, 0.0; ERI, 0.0; SE, 0.0; SVI 1, 0.0; SVI 2, 0.0. Row 8: Flooding depth, 8 cm; EP, 0.0; EI, 0.0; ERI, 0.0; SE, 0.0; SVI 1, 0.0; SVI 2, 0.0.
a Values presented are original (untransformed) mean values for emergence indices and seedling vigor indices, based on the pooled data from two independent trials.
Means with the same letter within a column are not significantly different at P ≤ 0.05 based on Fisher’s protected LSD test.
b Flooding depths includes eight different: 1, 2, 3, 4, 5, 6, 7, and 8 cm.
c EI, emergence index; EP, emergence percentage; ERI, emergence rate index; SE, speed of emergence. Emergence indices EP, SE, EI, and ERI were calculated by considering the E. crus-galli seeds emerged on each day up to 21 d after sowing.
d SVI I, seedling vigor index I; SVI II, seedling vigor index II. SVI I was calculated by considering the emergence percentage and seedling length of E. crus-galli, and SVI II was calculated by considering the emergence percentage and seedling biomass of E. crus-galli.
A similar trend was evident for the EI and ERI. Flooding at a depth of 1 cm resulted in the highest EI and ERI values (84.2 and 9.1, respectively). However, EI at 1-cm flooding was statistically comparable with that at 2 cm, whereas ERI was significantly higher under 1-cm flooding than under the other treatments. Both parameters declined progressively with increasing flooding depth and reached zero at depths of 6 to 8 cm because of complete inhibition of survival.
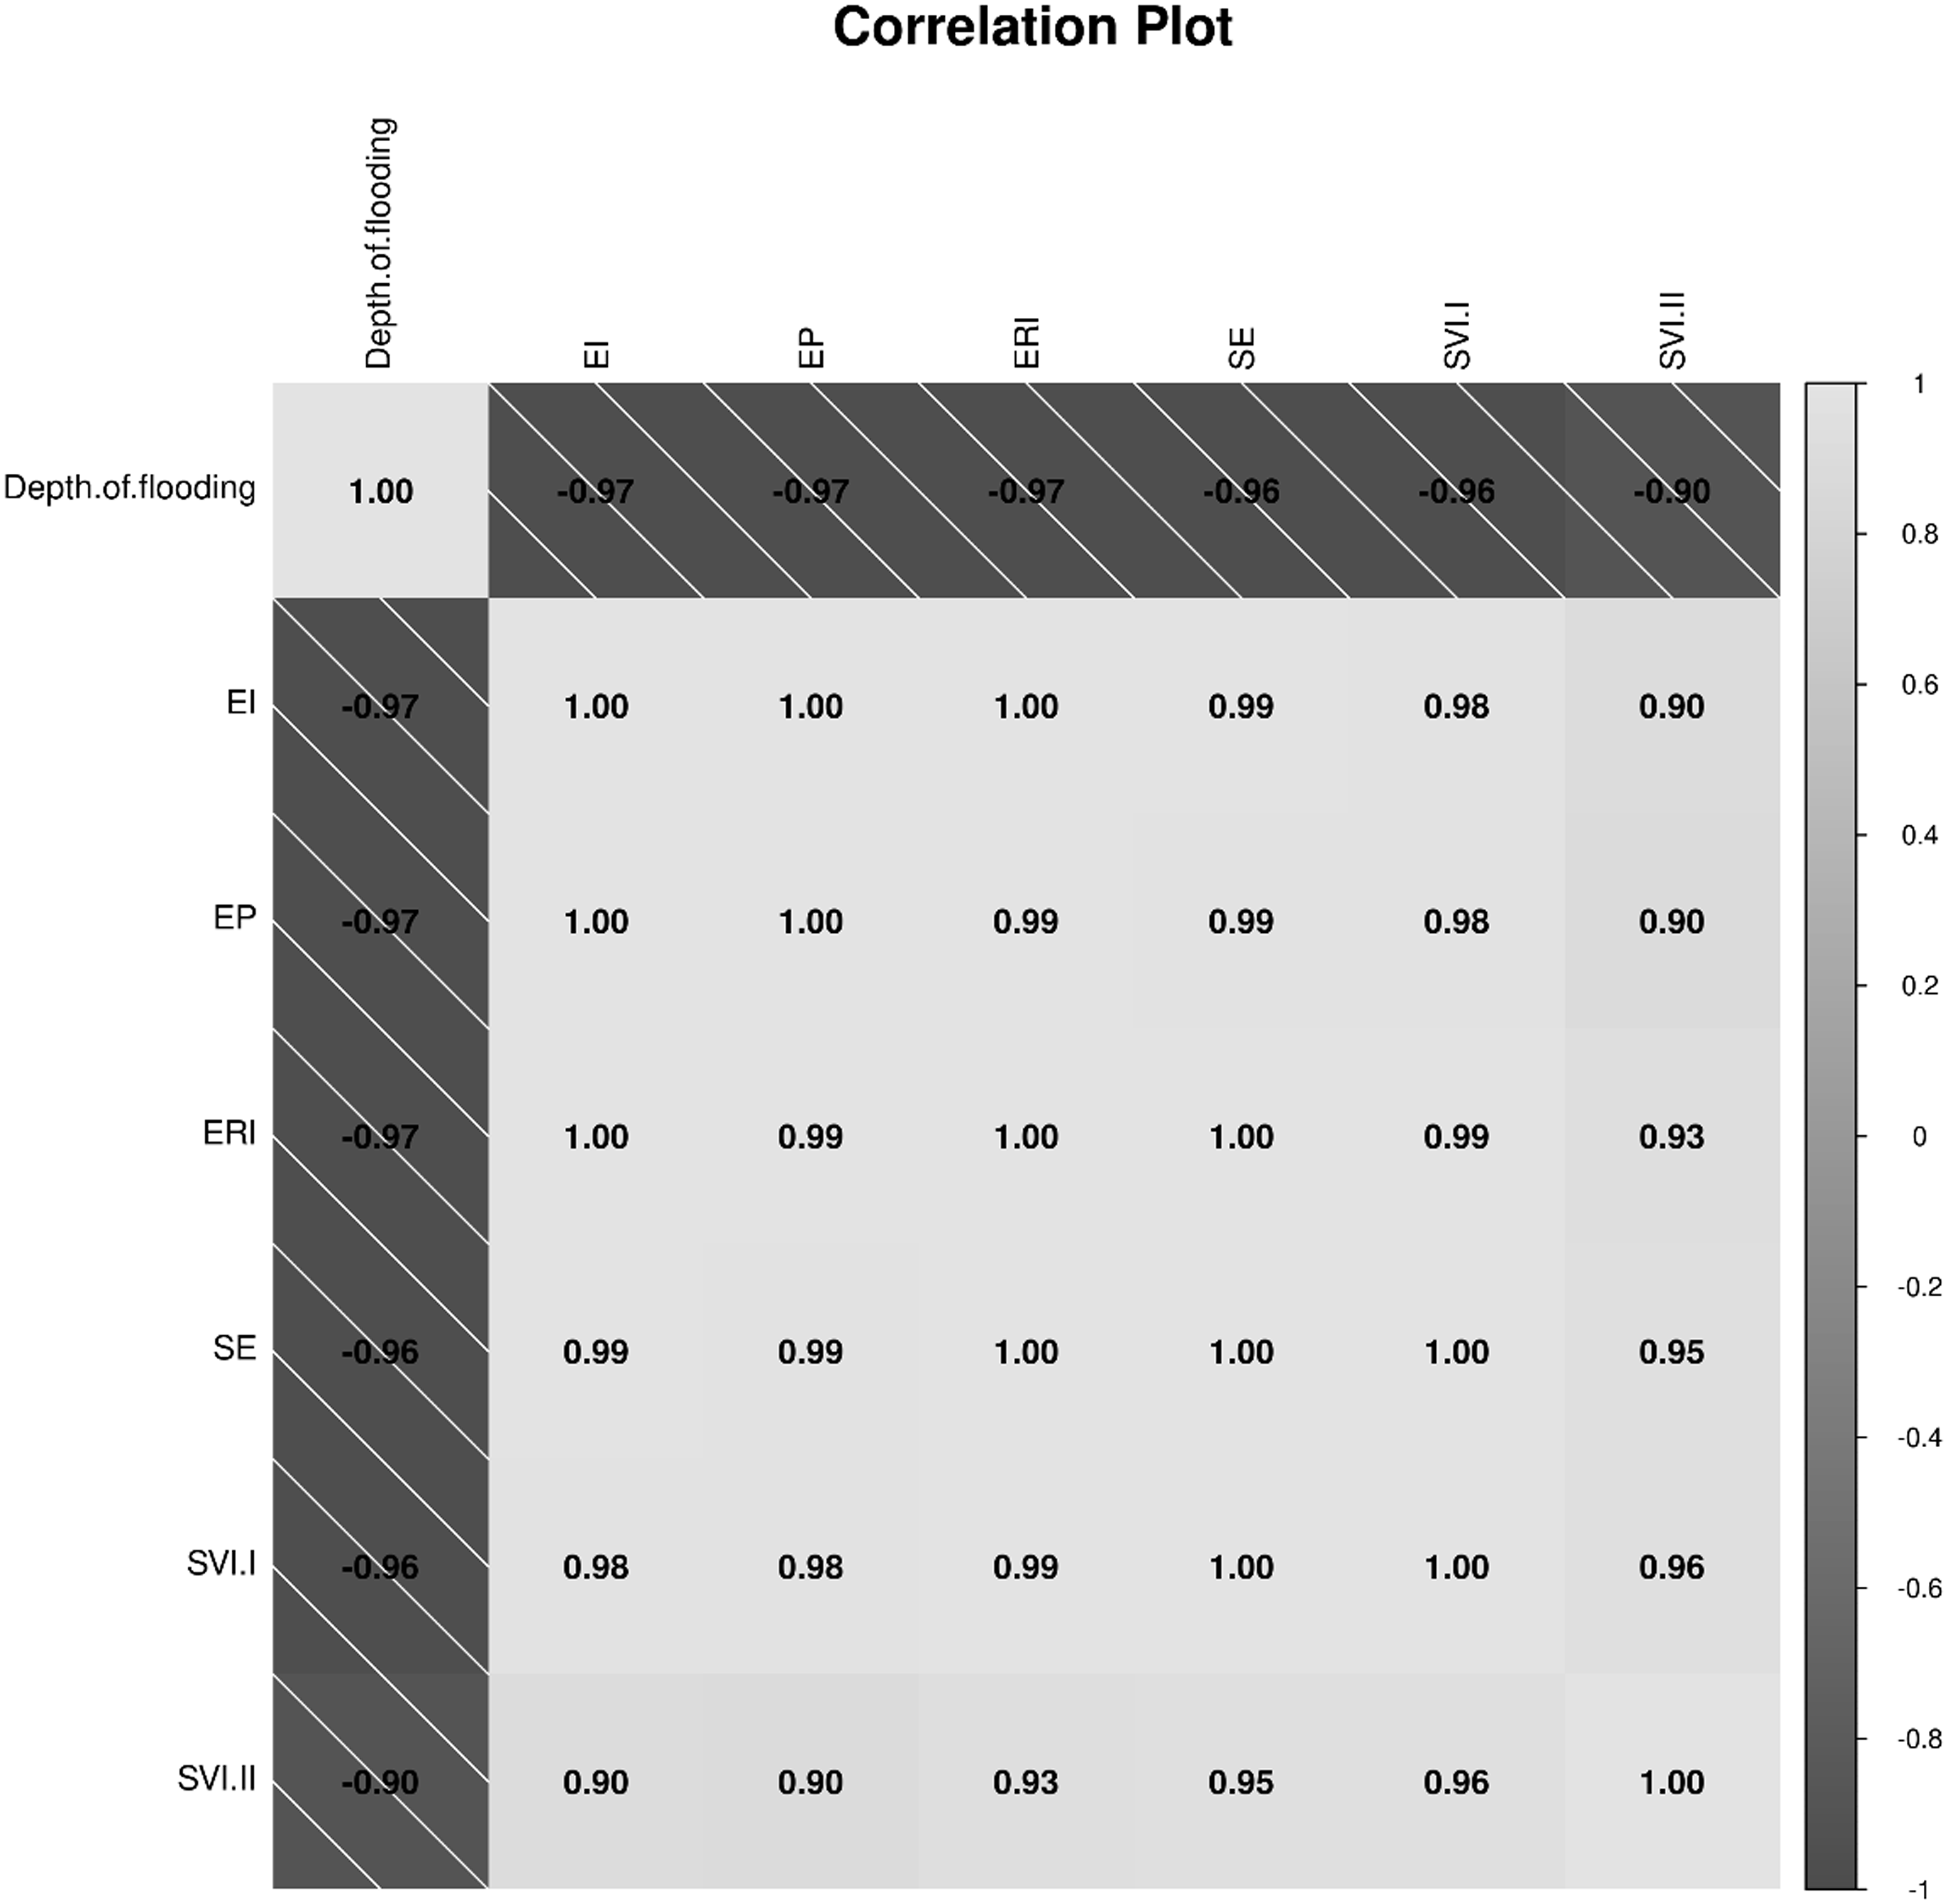
Seedling vigor indices (SVI I and SVI II) were also significantly affected. The highest values were observed under 1-cm flooding, followed by 2 cm, whereas both indices were zero at flooding depths ≥6 cm. Pearson correlation analysis confirmed a strong negative relationship between flooding depth and all emergence parameters, indicating that increasing water depth effectively suppresses seedling establishment (Figure 5).
Correlation matrix depicting the relationships among depth of flooding and emergence indices-emergence index (EI), emergence percentage (EP), emergence rate index ERI), speed of emergence (SE), seedling vigor index I (SVI I) and seedling vigor index II (SVI II) of Echinochloacrus-galli seedlings.

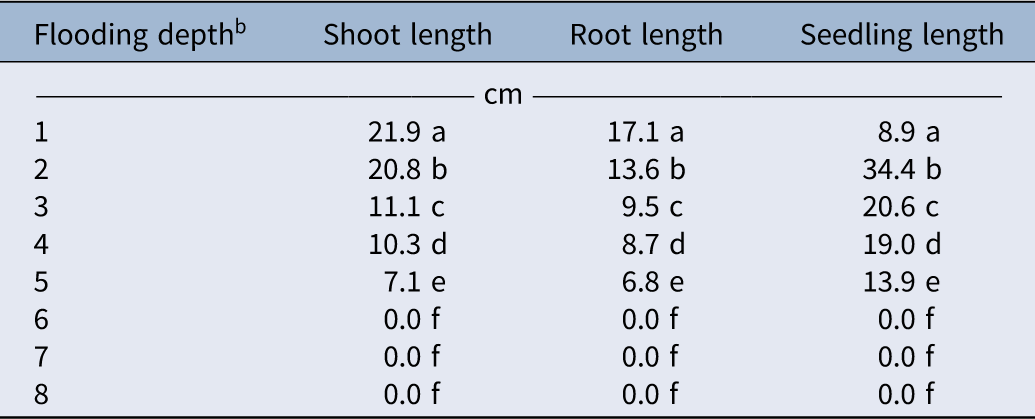
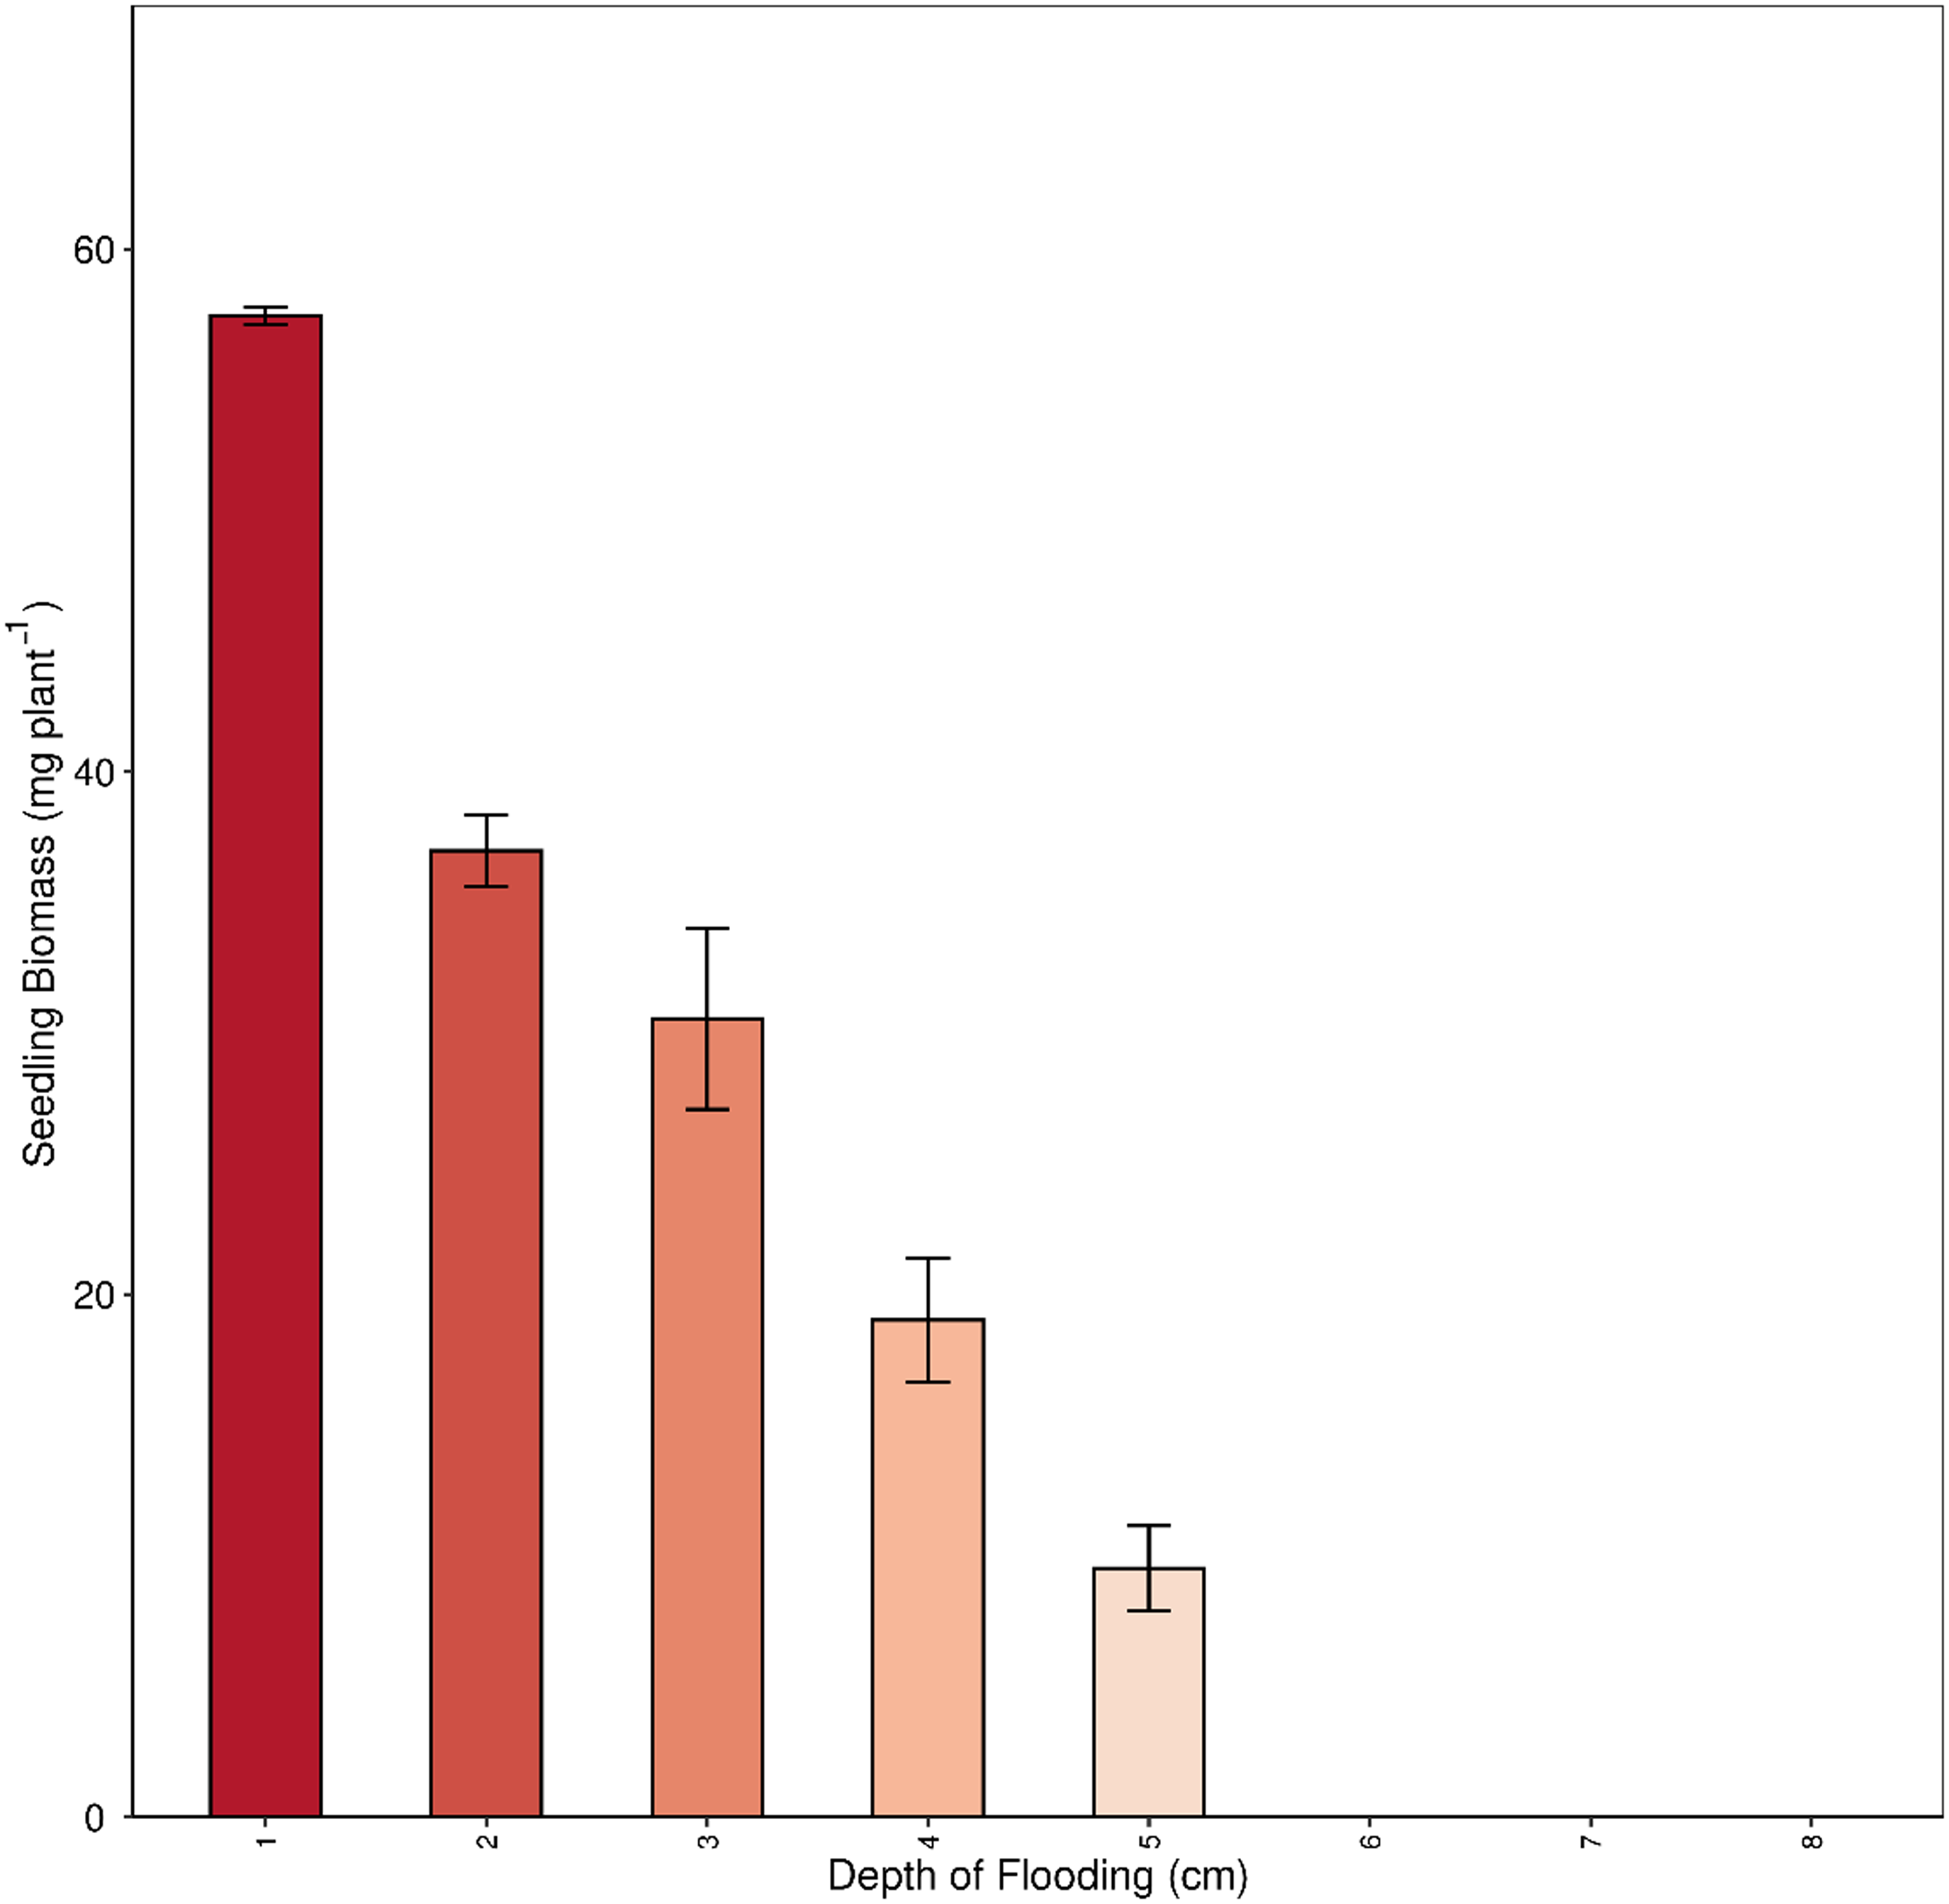
Shoot length, root length, total seedling length, and seedling biomass decreased progressively with increasing flooding depth, and seedling emergence was completely inhibited at flooding depths ≥6 cm (Table 4; Figure 6). Compared with 1-cm flooding, seedling length and biomass at a flooding depth of 5 cm were reduced by 64% and 83%, respectively. Flooding at 1 cm produced the greatest seedling length and biomass, whereas flooding at ≥6 cm completely suppressed seedling establishment.
Effect of flooding depth on shoot, root, and seedling length of Echinochloa crus-galli at 21 d after sowinga

Table 4. Long description
A table comparing the effect of flooding depth on shoot, root, and seedling length of Echinochloa crus-galli at 21 days after sowing. The table has 8 rows and 4 columns. The columns are labeled ‘Flooding depth’, ‘Shoot length’, ‘Root length’, and ‘Seedling length’. The row labels indicate flooding depths in centimeters from 1 to 8. Row 1: Flooding depth 1 cm, Shoot length 21.9, Root length 17.1, Seedling length 8.9. Row 2: Flooding depth 2 cm, Shoot length 20.8, Root length 13.6, Seedling length 34.4. Row 3: Flooding depth 3 cm, Shoot length 11.1, Root length 9.5, Seedling length 20.6. Row 4: Flooding depth 4 cm, Shoot length 10.3, Root length 8.7, Seedling length 19.0. Row 5: Flooding depth 5 cm, Shoot length 7.1, Root length 6.8, Seedling length 13.9. Row 6: Flooding depth 6 cm, Shoot length 0.0, Root length 0.0, Seedling length 0.0. Row 7: Flooding depth 7 cm, Shoot length 0.0, Root length 0.0, Seedling length 0.0. Row 8: Flooding depth 8 cm, Shoot length 0.0, Root length 0.0, Seedling length 0.0.
a Values presented are original (untransformed) mean values for shoot length, root length, and seedling length of different treatments of pooled data of two trials. Means with the same letter within a column are not significantly different at P ≤ 0.05 based on Fisher’s protected LSD test.
b Flooding depth includes eight different: 1, 2, 3, 4, 5, 6, 7, and 8 cm.
Effect of depth of flooding on the seedling biomass of Echinochloa crus-galli at 21 d after sowing.

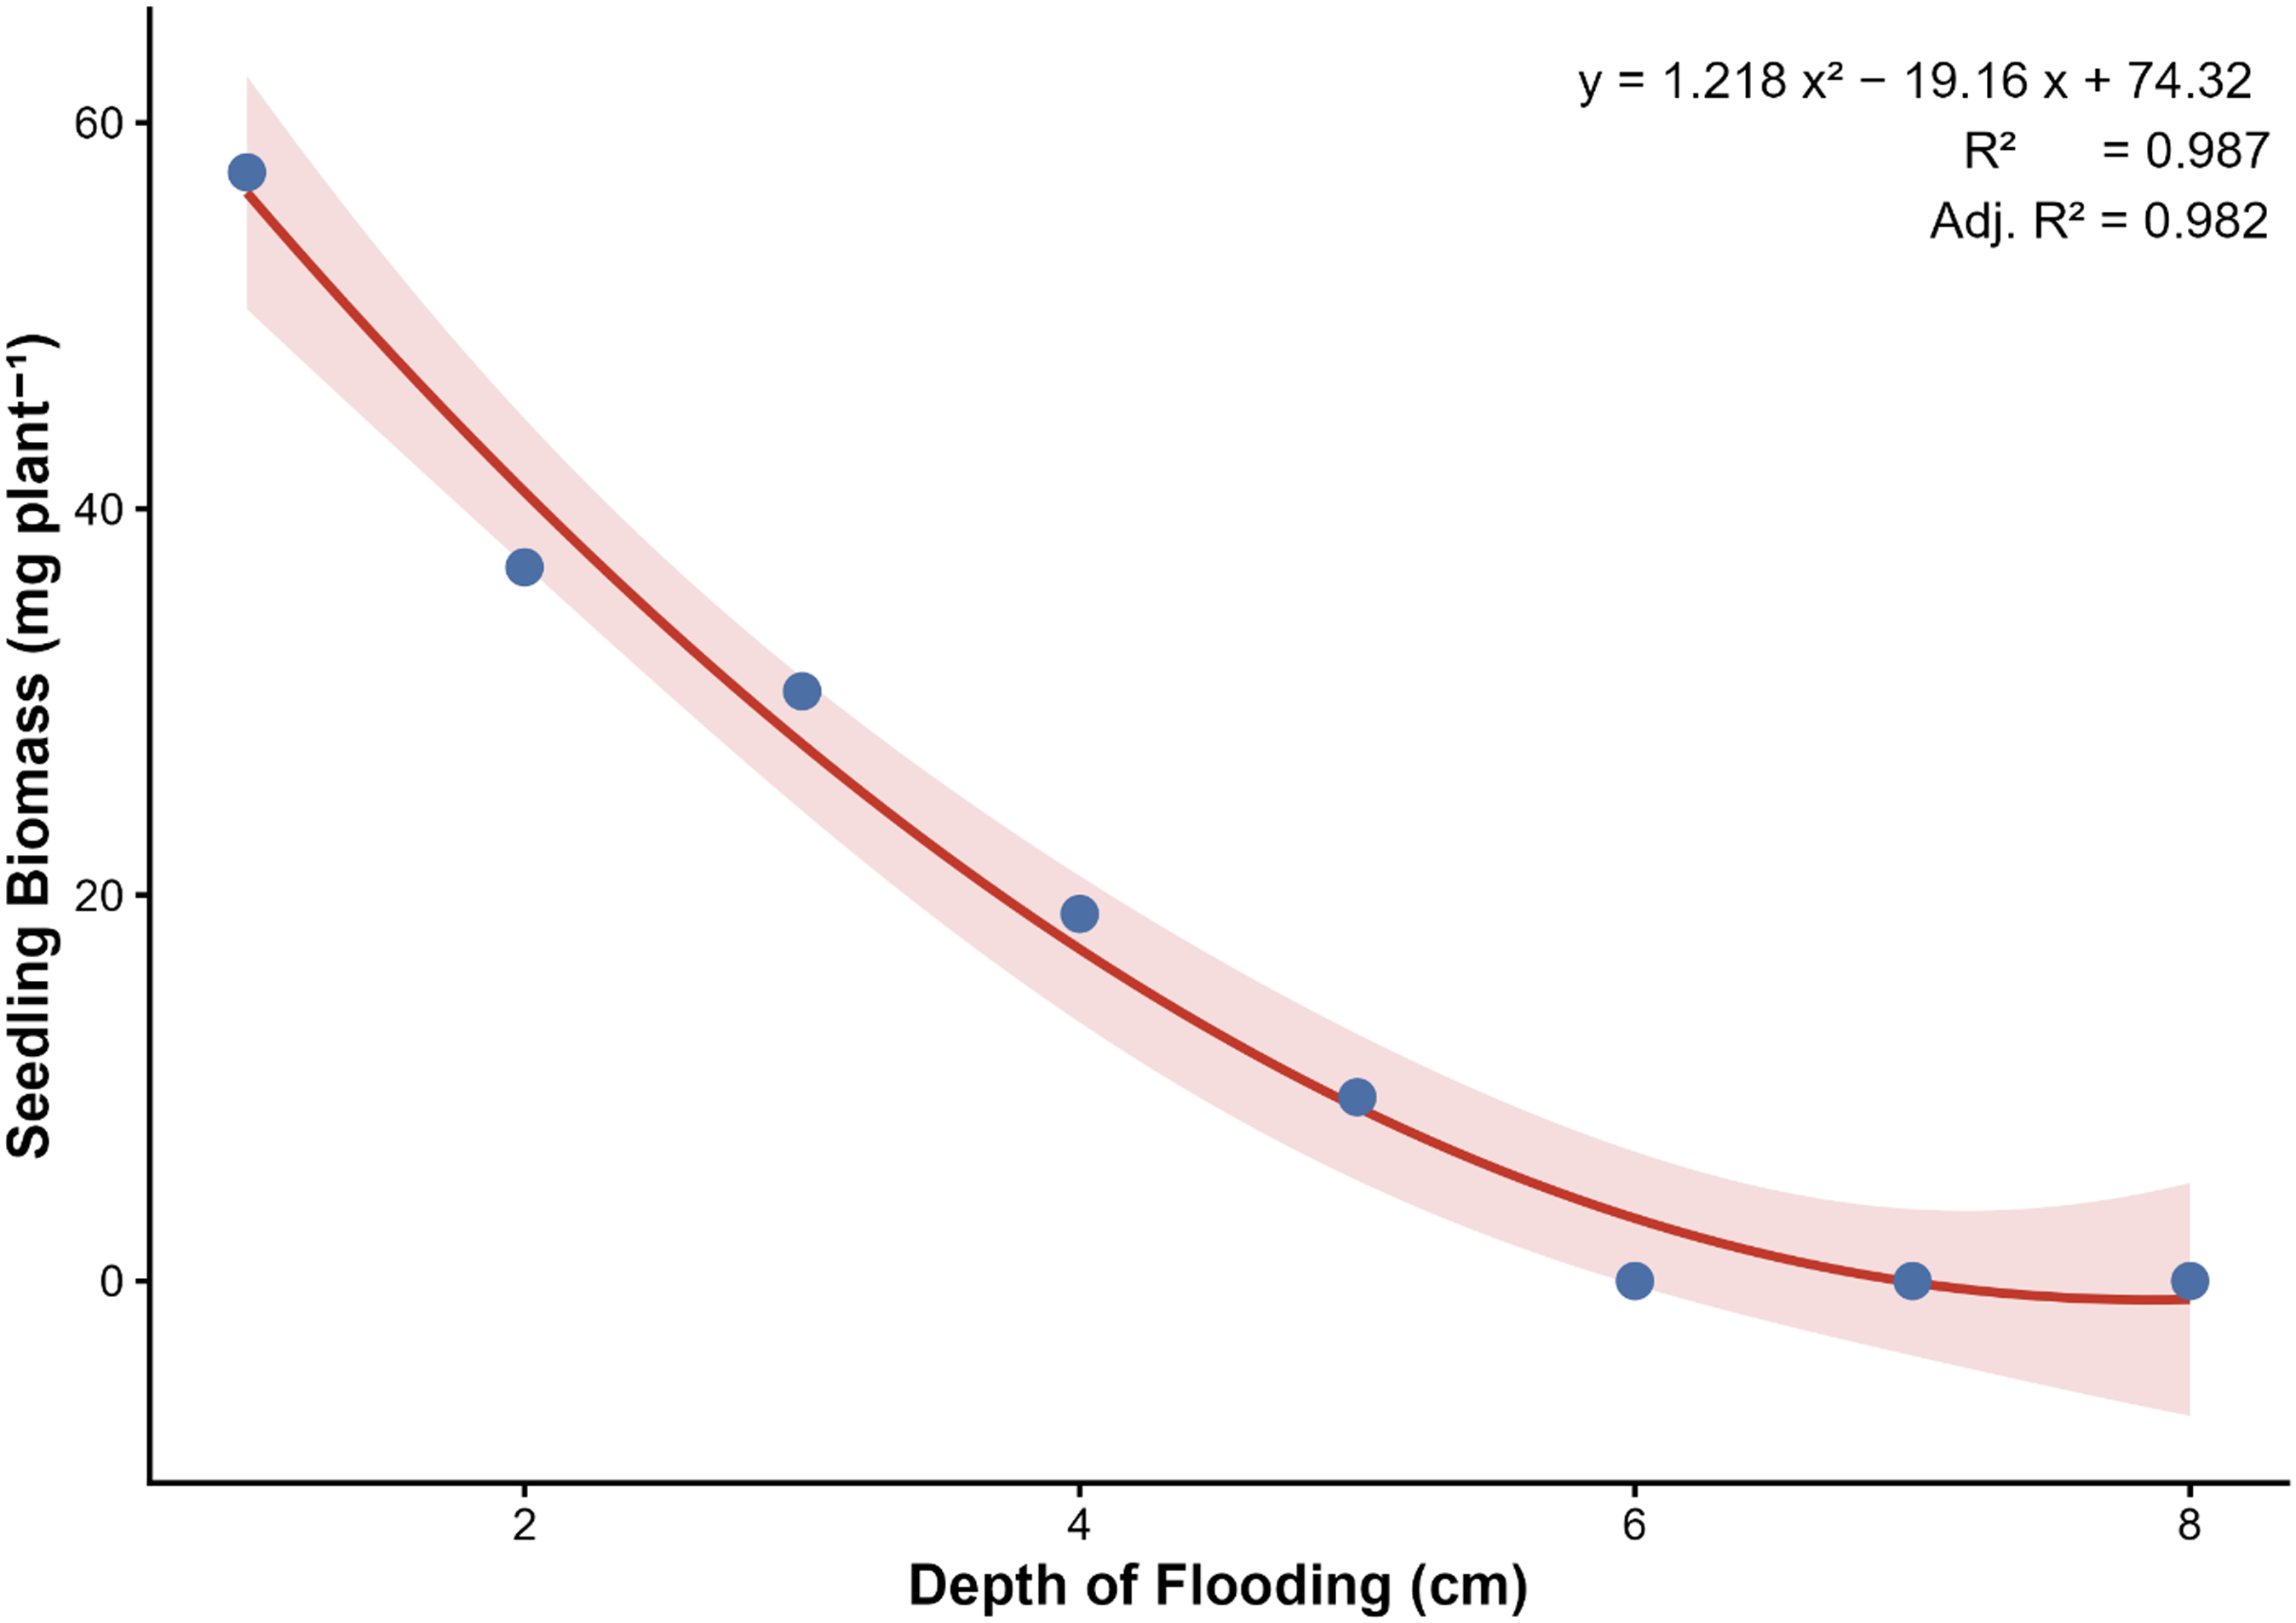
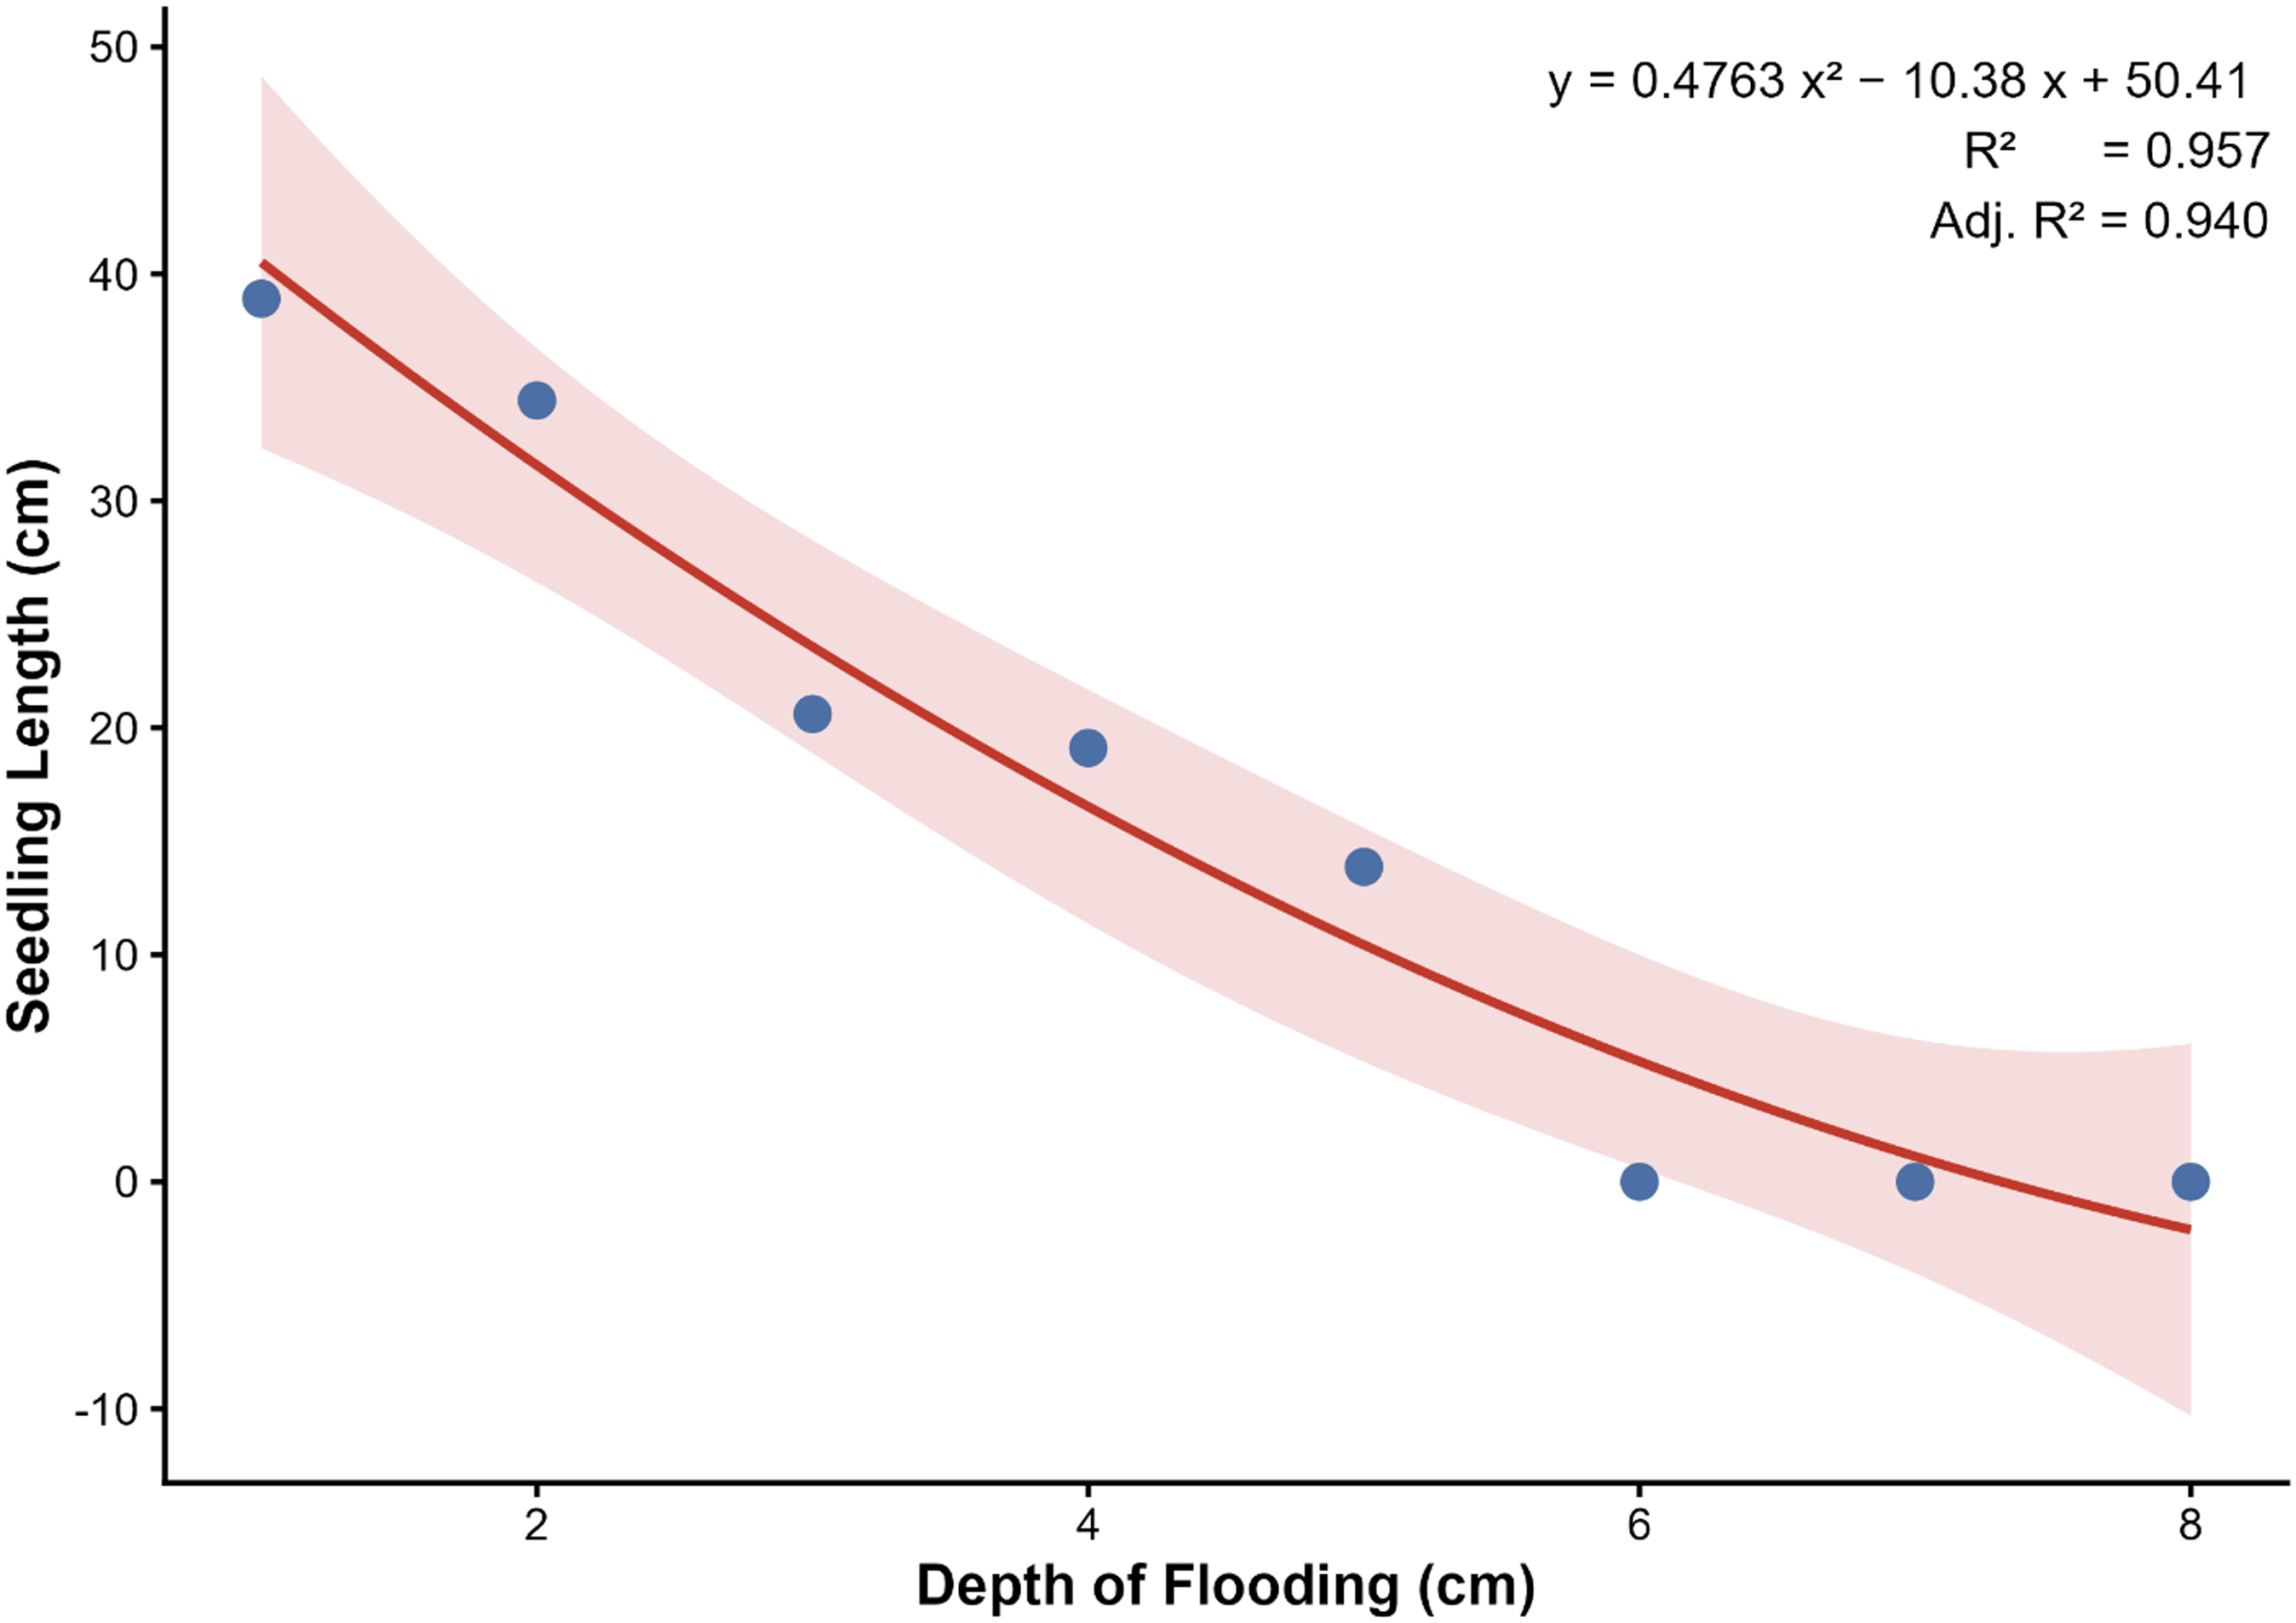
A quadratic regression model provided a better fit than the linear model for describing the relationship between flooding depth and seedling biomass of E. crus-galli (R2 = 0.99 vs. 0.91), indicating a nonlinear response to increasing flooding depth (Figure 7). Similarly, seedling length exhibited a curvilinear relationship with flooding depth (Figure 8). These findings indicate that the suppressive effects of flooding intensified with increasing water depth, resulting in progressively greater reductions in seedling biomass and seedling length rather than a uniform decline across flooding levels.
Quadratic regression model depicting the relationship between depth of flooding and seedling biomass of Echinochloa crus-galli at 21 d after sowing.

Quadratic regression model depicting the relationship between depth of flooding and seedling length of Echinochloa crus-galli at 21 d after sowing.

Higher emergence, vigor, biomass accumulation, and greater seedling length under shallow flooding (1-cm depth) can be attributed to the availability of adequate moisture and sufficient oxygen, which support active respiration and metabolic processes during germination. Seed germination is an energy-intensive process that relies on the mobilization of stored food reserves. Under shallow flooding, where oxygen can readily diffuse to the germinating seed, aerobic respiration predominates as the primary pathway for energy production. In contrast, under deeper flooding, oxygen diffusion is severely restricted, resulting in hypoxic (low oxygen) or anoxic (oxygen-deficient) conditions. These conditions limit efficient energy production and adversely affect germination and early seedling growth, as reported by Narsai et al. (Reference Narsai, Edwards, Roberts, Whelan, Joss and Atwell2015).
The reduction in weed emergence and biomass under flooded conditions may be attributed to multiple interacting factors, particularly reduced oxygen availability, which restricts aerobic respiration in weed seeds and consequently suppresses germination, emergence, and seedling vigor (Paiman et al. Reference Paiman, Subeni and Yusof2022). Zhou et al. (Reference Zhou, Chen, Meng, Chandrasekaran, Luo, Yang and Shu2020) reported that waterlogging negatively affects seed germination by inducing oxygen-deficient conditions. Similarly, Yasin and Andreasen (Reference Yasin and Andreasen2016) demonstrated that a decline in oxygen concentration from 20.9% to 15% significantly reduced germination in several weed species. Furthermore, waterlogging alters soil physical and biochemical properties, including redox potential and nutrient dynamics, which may in turn influence weed seed germination and early seedling establishment (Ferronato et al. Reference Ferronato, Marinari, Francioso, Bello, Trasar-Cepeda and Antisari2019).
The present findings are consistent with earlier studies demonstrating the inhibitory effects of flooding on Echinochloa species. Chauhan and Johnson (Reference Chauhan and Johnson2011) reported that early and deep flooding markedly suppressed seedling survival and growth of E. crus-galli. Similarly, Chauhan (Reference Chauhan2012) demonstrated that maintaining a flooding depth of 2 to 4 cm under field conditions effectively reduced the emergence and establishment of E. colona. Estioko et al. (Reference Estioko, Miro, Baltazar, Merca, Ismail and Johnson2014) observed that immediate flooding significantly reduced the emergence and seedling growth of E. colona and E. crus-galli. Likewise, Liu et al. (Reference Liu, Jiang, Tong, Zhang, Wu, Liu and Lu2016) and Zhang et al. (Reference Zhang, Wang, Cao, Li and Chauhan2023) documented significant reductions in the emergence and biomass of E. crus-galli and E. colona as flooding depth increased. In addition, Abouziena et al. (Reference Abouziena, El-Awadi, El-Saeid, El-Metwally, El-Desouki and Singh2015) reported that deep flooding markedly suppressed the growth of E. crus-galli. Similarly, Sahid and Hossain (Reference Sahid and Hossain1995) observed reductions in weed dry weight, shoot length, and root length with increasing flooding depth, while Opena et al. (Reference Opena, Chauhan and Baltazar2014) found that early flooding at 2 cm reduced shoot growth by approximately 50% compared with non-flooded conditions. Overall, the present findings confirm the effectiveness of water management as an important cultural strategy for controlling E. crus-galli in wet-seeded rice cultivation.
Effect of Rice Straw Mulch on Emergence and Seedling Growth
Pooled analysis of the two trials showed that rice straw mulch significantly influenced the emergence indices and seedling vigor of E. crus-galli. EP was highest in the no-mulch treatment (32.3), which was statistically comparable with the 2,000 kg ha−1 mulch treatment. Beyond this level, EP declined progressively as mulch rates increased, with more than a 50% reduction observed between 2,000 and 8,000 kg ha−1. Complete inhibition of emergence occurred at 10,000 kg ha−1 (Table 5).
Effect of rice straw mulch rate on the emergence parameters and seedling vigor of Echinochloa crus-galli a

Table 5. Long description
A table with 7 rows and 8 columns comparing the effect of different rice straw mulch rates on emergence indices and seedling vigor of Echinochloa crus-gallia. The columns are labeled as Rice straw mulch rate, EP, EI, ERI, SE, SVI I, and SVI II. The row labels are No mulch, 2,000 kg ha⁻¹, 4,000 kg ha⁻¹, 6,000 kg ha⁻¹, 8,000 kg ha⁻¹, and 10,000 kg ha⁻¹. The values in the table show the emergence indices and seedling vigor indices for each mulch rate. Notable trends include a decline in EP as mulch rates increase, with complete inhibition of emergence at 10,000 kg ha⁻¹.
a Values presented are original (untransformed) mean values for emergence indices and seedling vigor indices based on the pooled data from two independent trials.
Means with the same letter within a column are not significantly different at P ≤ 0.05 based on Fisher’s protected LSD test.
b Rice straw mulch rate includes six different rates of application: 0, 2,000, 4,000, 6,000, 8,000, and 10,000 kg ha−1.
c EI, emergence index; EP, emergence percentage; ERI, emergence rate index; SE, speed of emergence. Emergence indices EP, SE, EI, and ERI were calculated by considering the E. crus-galli seedlings that emerged on each day up to 14 d after sowing.
d SVI I, seedling vigor index I; SVI II, seedling vigor index II. Seedling vigor index SVI I was calculated by considering the emergence percentage and seedling length of E. crus-galli, and SVI II was calculated by considering the emergence percentage and seedling biomass of E. crus-galli.
A similar pattern was observed for EI, ERI, and SE. The highest values were recorded in the no-mulch treatment, followed by 2,000 kg ha−1, and all parameters decreased consistently with increasing mulch rates. No emergence was recorded at 10,000 kg ha−1, resulting in zero values for EI, ERI, and SE.
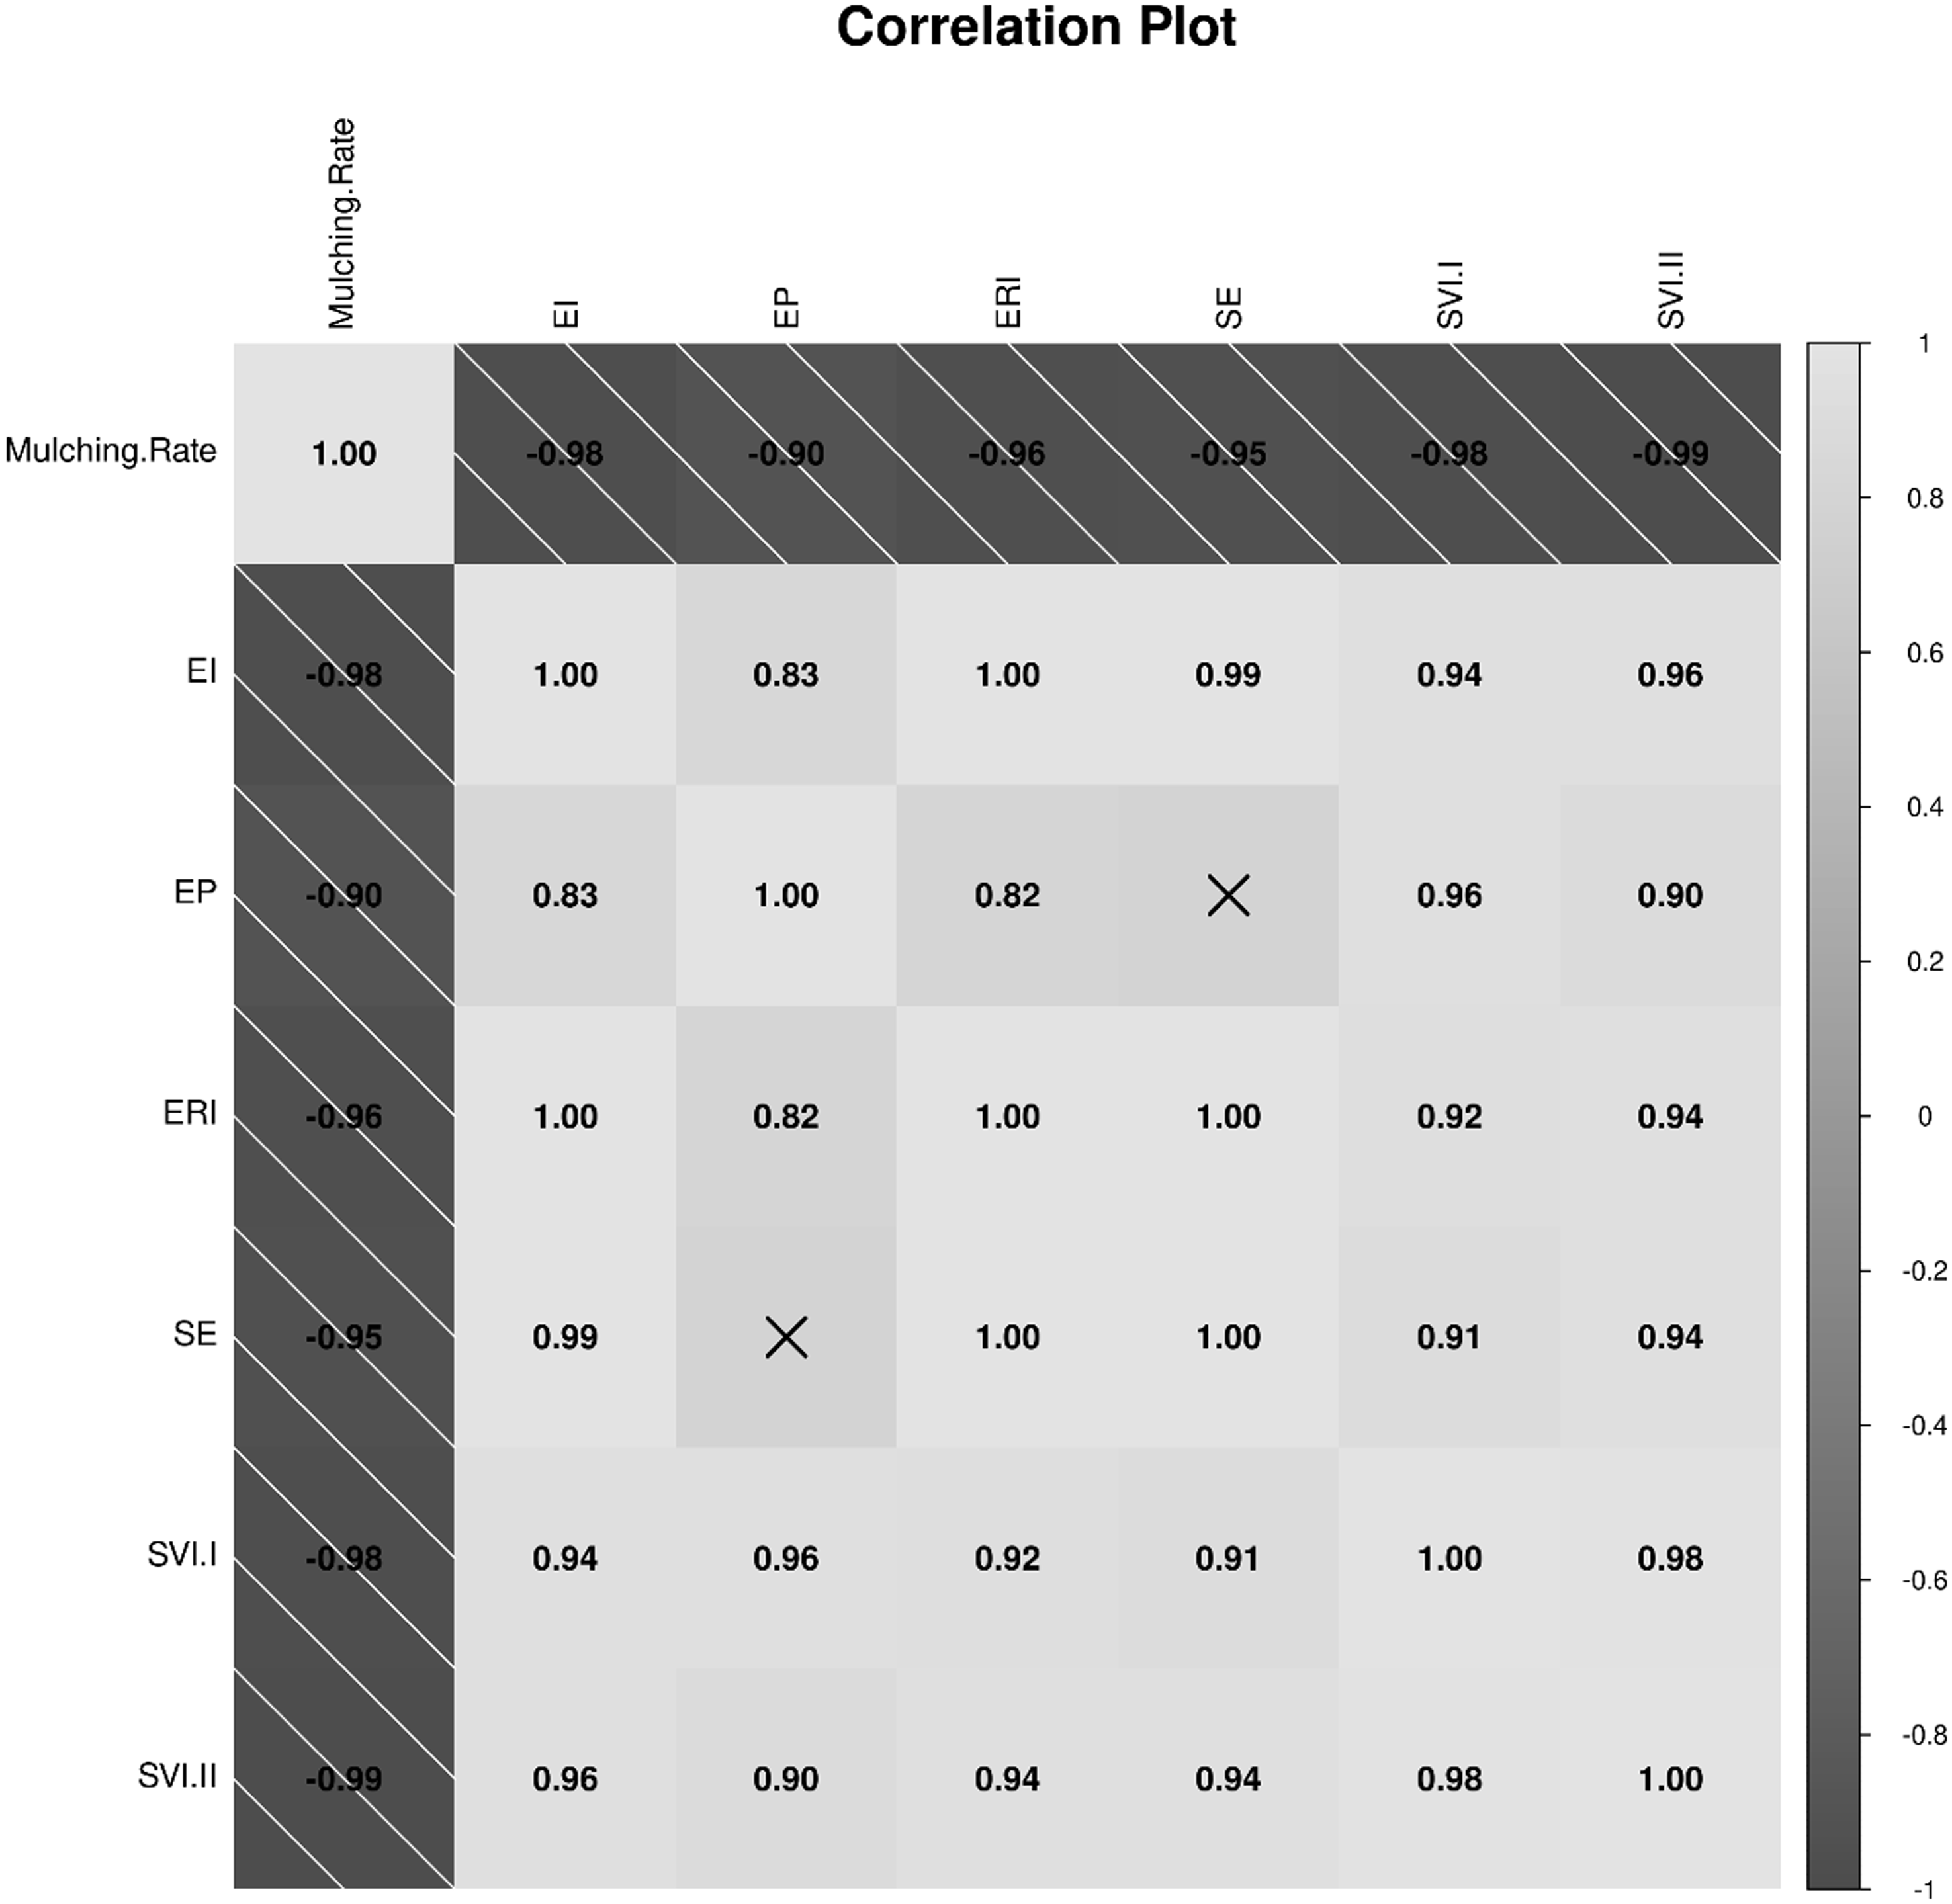
Seedling vigor indices were also significantly affected by rice straw mulch. The highest values were observed in the no-mulch treatment, whereas among the mulch treatments, 2,000 kg ha−1 recorded the highest vigor values. Both indices declined progressively with increasing mulch rates and reached zero at 10,000 kg ha−1 due to complete inhibition of emergence. Pearson correlation analysis confirmed a negative association between mulch rate and all emergence parameters (Figure 9), indicating that increasing mulch rates effectively suppresses E. crus-galli emergence.
Correlation matrix depicting the relationships among rice straw mulch rate and emergence indices-emergence index (EI), emergence percentage (EP), emergence rate index (ERI), speed of emergence (SE), seedling vigor index I (SVI I) and seedling vigor index II (SVI II) of Echinochloacrus-galli seedlings.

Figure 9. Long description
A correlation matrix depicting the relationships among rice straw mulch rate and emergence/vigor indices: emergence index (EI), emergence percentage (EP), emergence rate index (ERI), speed of emergence (SE), seedling vigor index I (SVI I), and seedling vigor index II (SVI II). The matrix has seven rows and seven columns, with the diagonal elements showing a correlation coefficient of 1.0. The matrix is symmetrical. Notable trends include strong negative correlations between mulching rate and all indices, with values ranging from -0.90 to -0.99. Positive correlations among the indices range from 0.82 to 1.00. The highest positive correlations are observed between EI and SE (0.99), and between SVI I and SVI II (0.98).
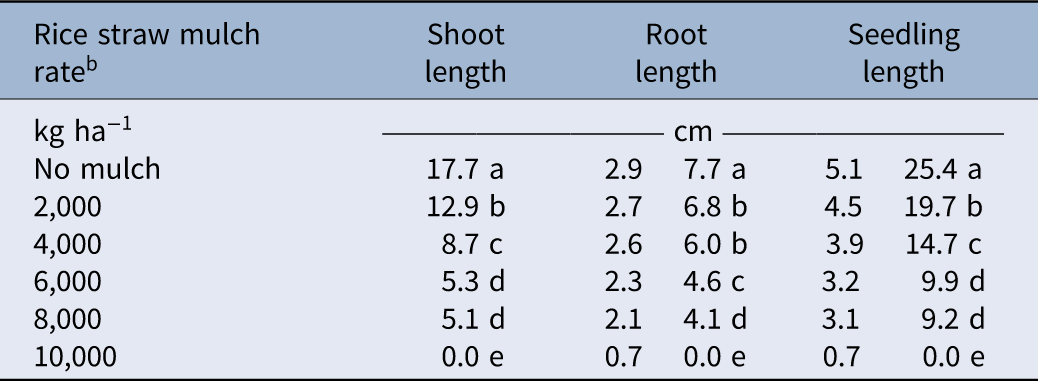
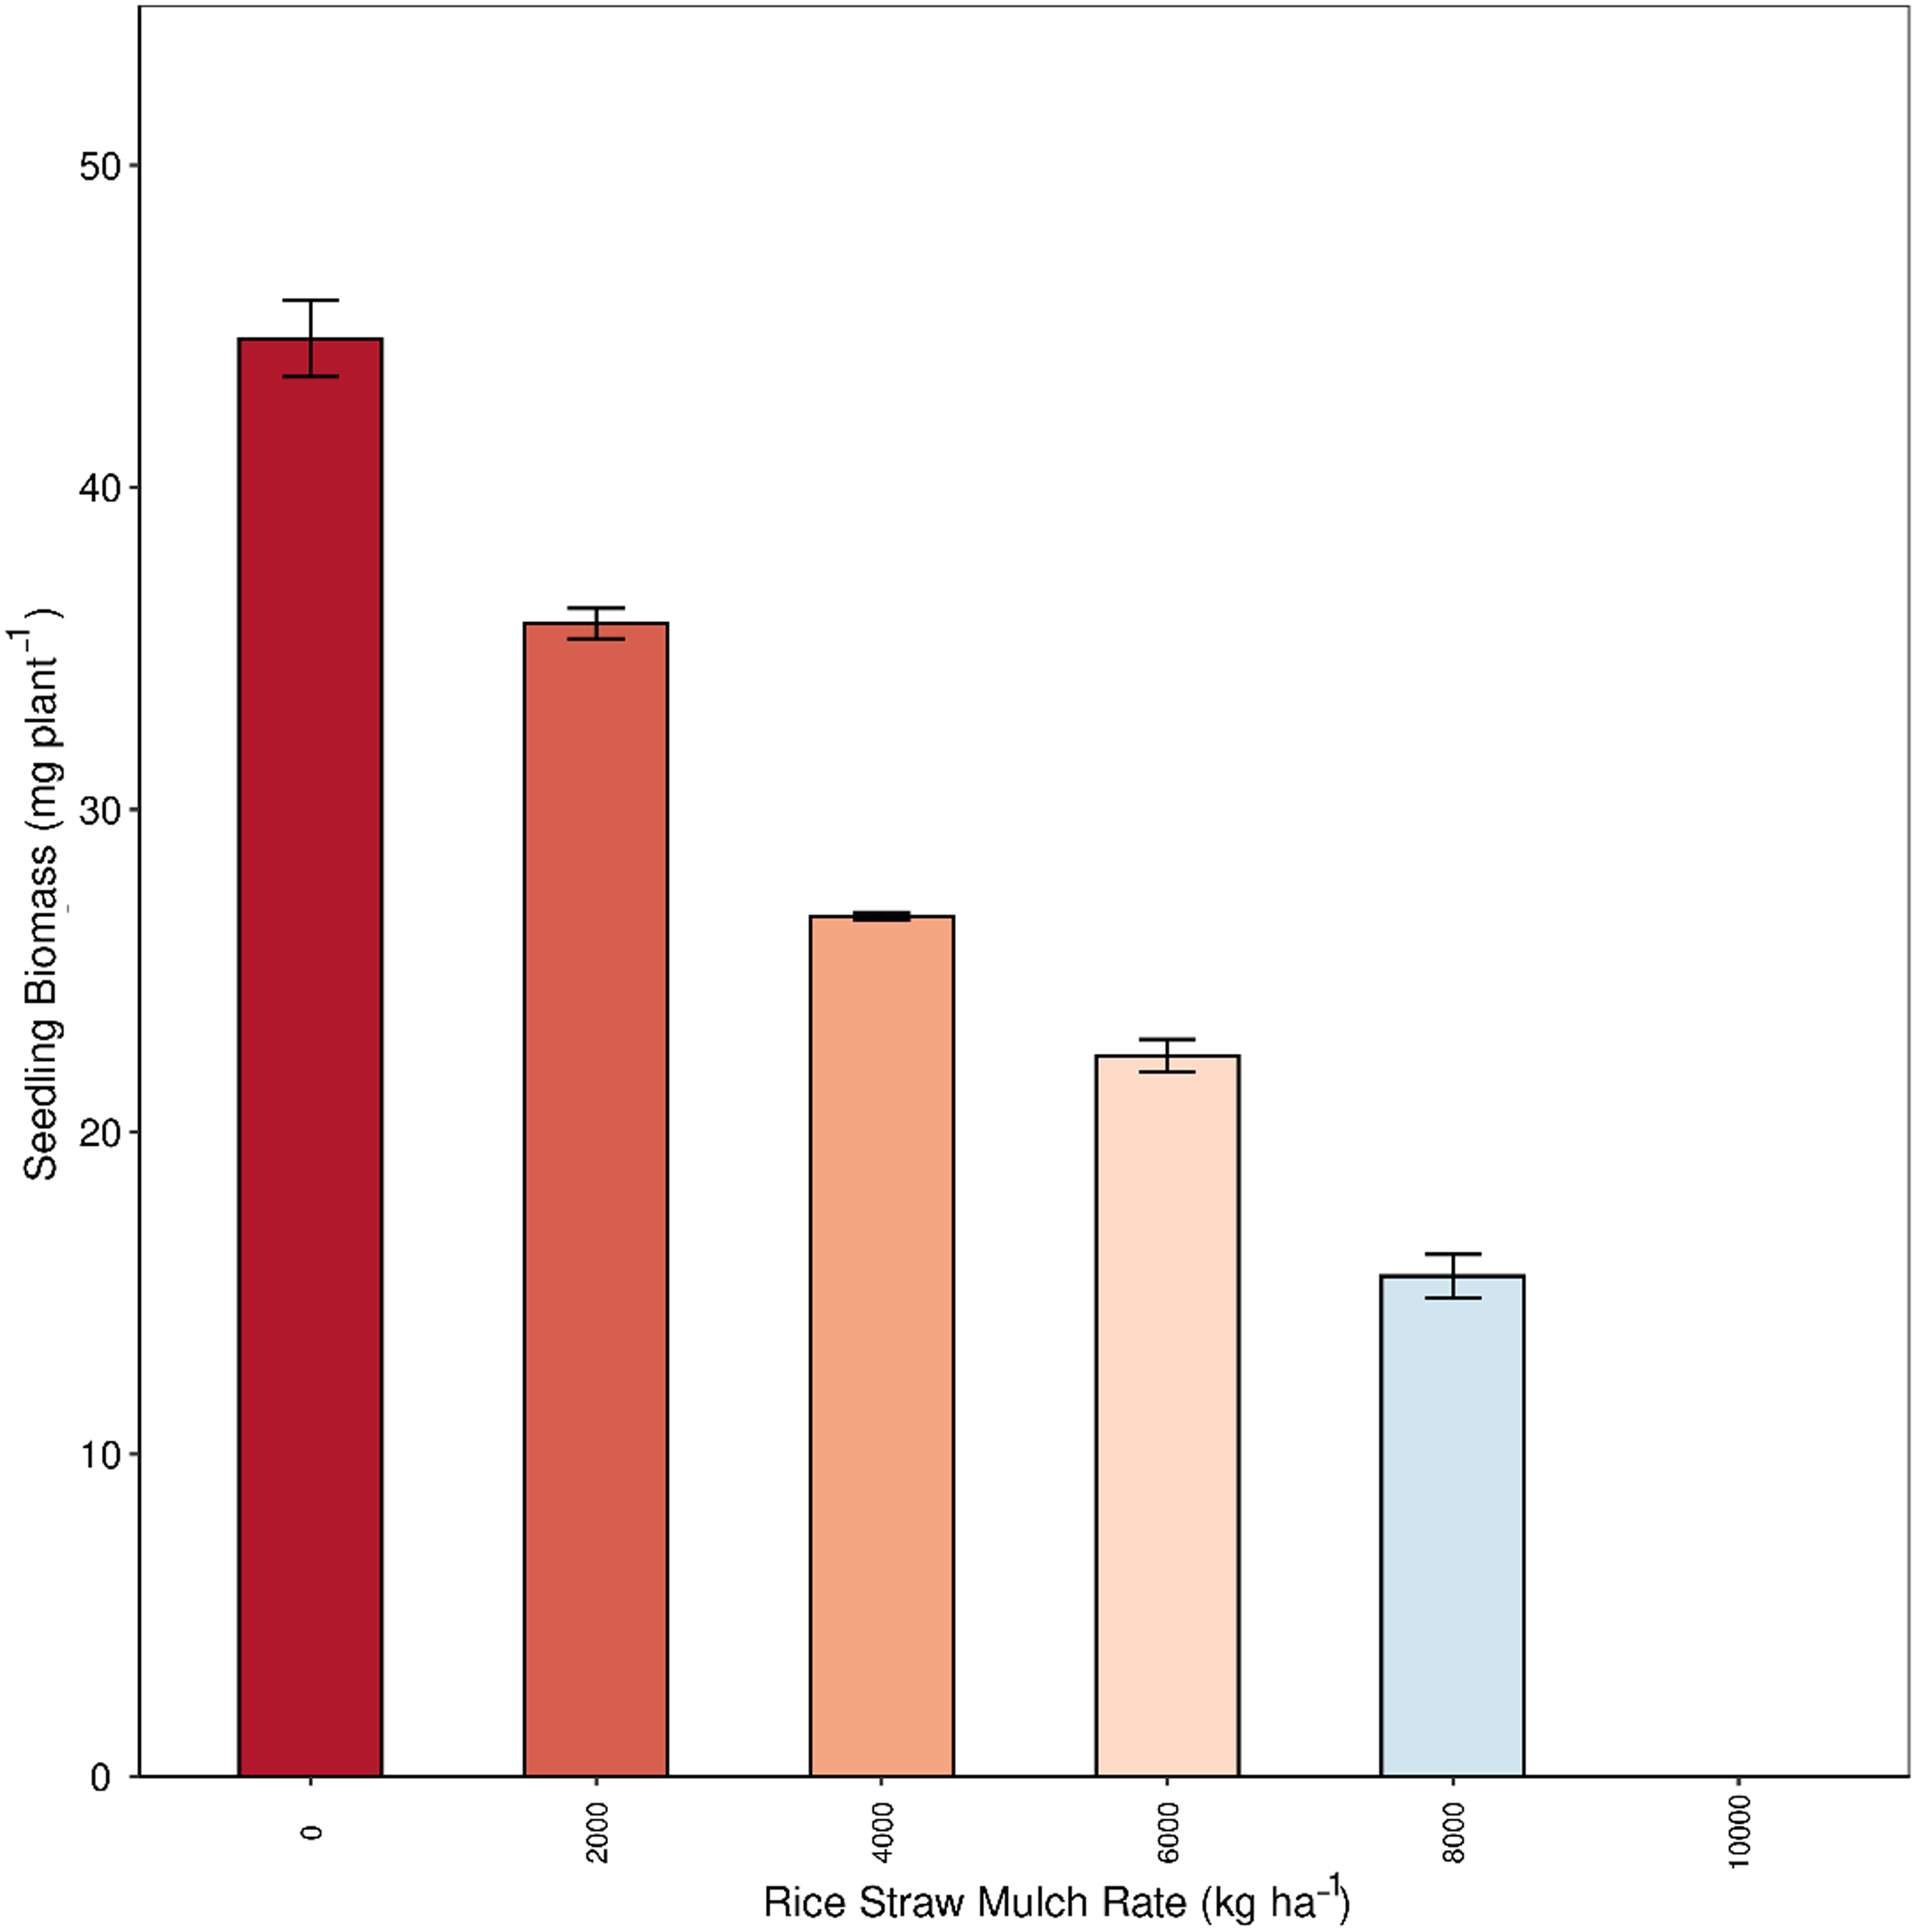
Rice straw mulch application significantly influenced shoot length, root length, total seedling length, and biomass of E. crus-galli (Table 6; Figure 10). Seedling growth parameters declined progressively as mulch rates increased, and no emergence was observed at 10,000 kg ha−1.
Effect of rice straw mulch rate on shoot, root, and seedling length of Echinochloa crus-galli at 14 d after sowinga

Table 6. Long description
A table with four columns and six rows, including a header row. The columns are labeled ‘Rice straw mulch rate’, ‘Shoot length’, ‘Root length’, and ‘Seedling length’. The row labels indicate different mulch rates in kg per hectare: No mulch, 2,000, 4,000, 6,000, 8,000, and 10,000. The values are given in centimeters. Row 1: No mulch, Shoot length 17.7, Root length 2.9, Seedling length 5.1. Row 2: 2,000 kg ha⁻¹, Shoot length 12.9, Root length 2.7, Seedling length 4.5. Row 3: 4,000 kg ha⁻¹, Shoot length 8.7, Root length 2.6, Seedling length 3.9. Row 4: 6,000 kg ha⁻¹, Shoot length 5.3, Root length 2.3, Seedling length 3.2. Row 5: 8,000 kg ha⁻¹, Shoot length 5.1, Root length 2.1, Seedling length 3.1. Row 6: 10,000 kg ha⁻¹, Shoot length 0.0, Root length 0.7, Seedling length 0.7. The table shows a progressive decline in shoot, root, and seedling lengths as the mulch rate increases.
a Values presented are original (untransformed) mean values for shoot length, root length, and seedling length of different treatments of pooled data of two trials.
Means with the same letter within a column are not significantly different at P ≤ 0.05 based on Fisher’s protected LSD test.
b Rice straw mulch rate includes six different rates: no mulch, 2,000, 4,000, 6,000, 8,000, and 10,000 kg ha−1.
Effect of rice straw mulch rate on the seedling biomass of Echinochloa crus-galli at 14 d after sowing.

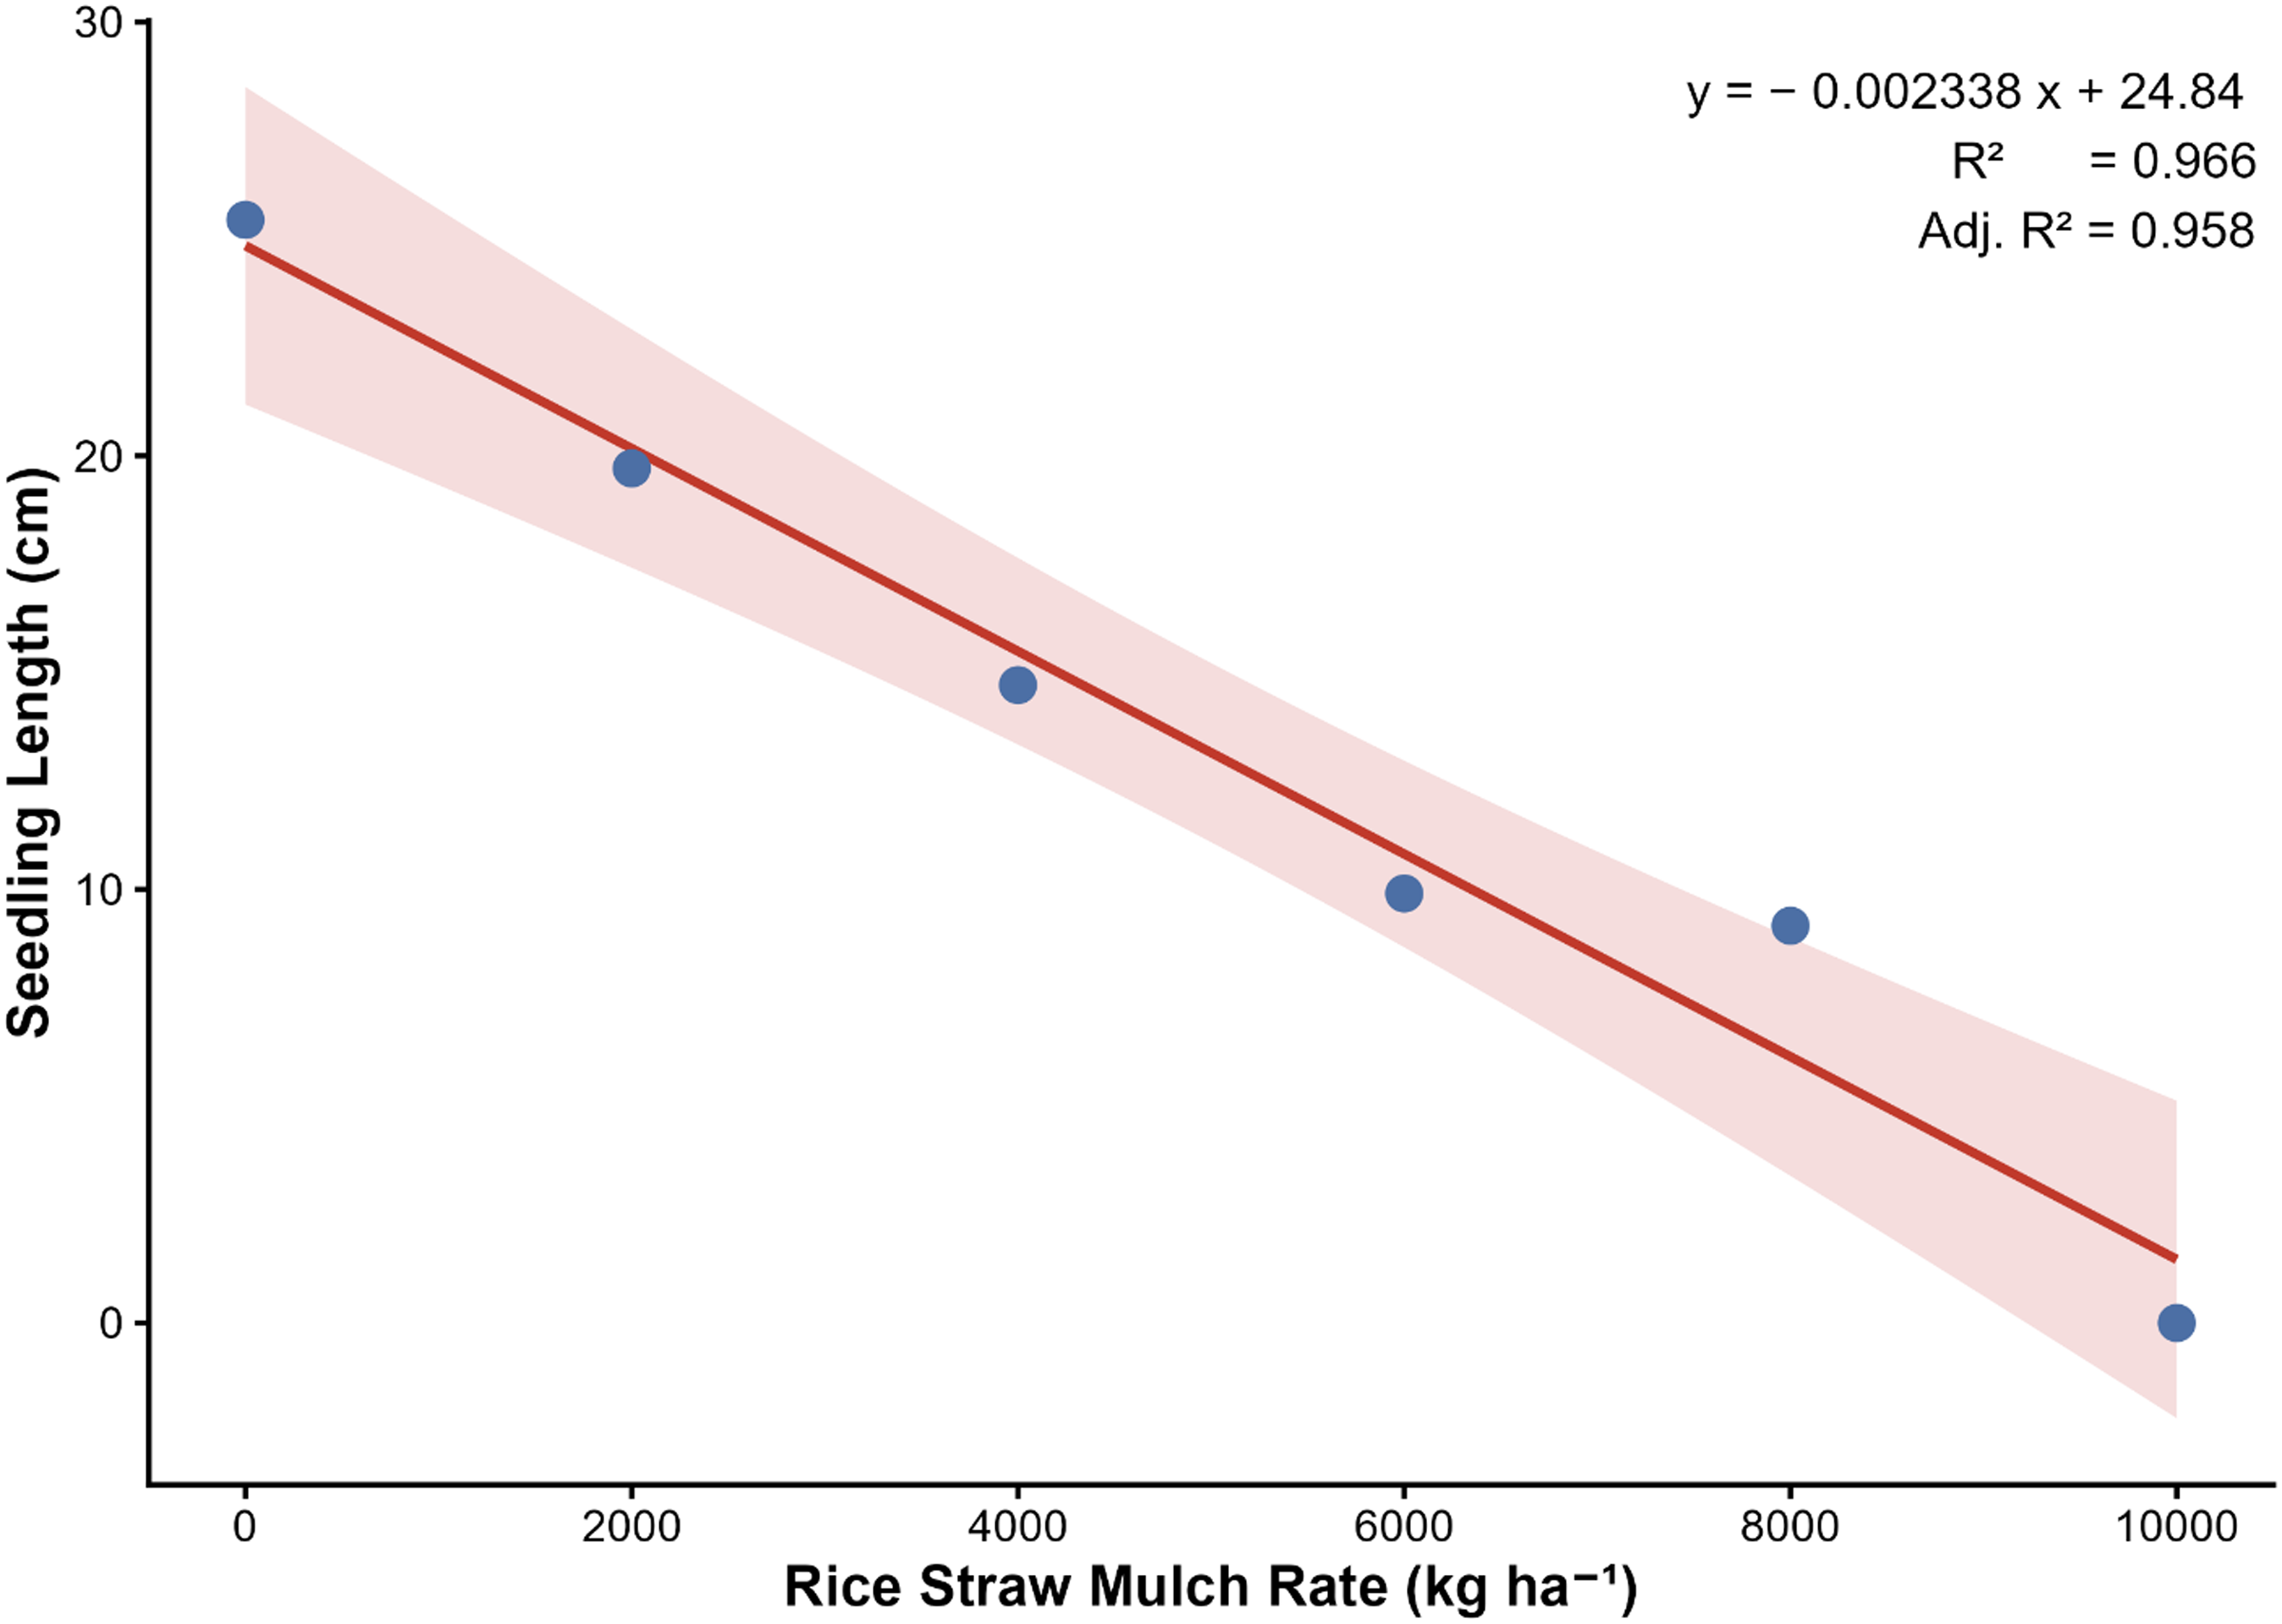
The no-mulch treatment recorded the highest shoot length, root length, and seedling biomass (Table 6). Increasing the mulch rate from 2,000 to 8,000 kg ha−1 resulted in reductions of 64% in seedling length and 62% in biomass. Complete inhibition of emergence at 10,000 kg ha−1 highlights the effectiveness of rice straw mulch as a cultural weed management practice.
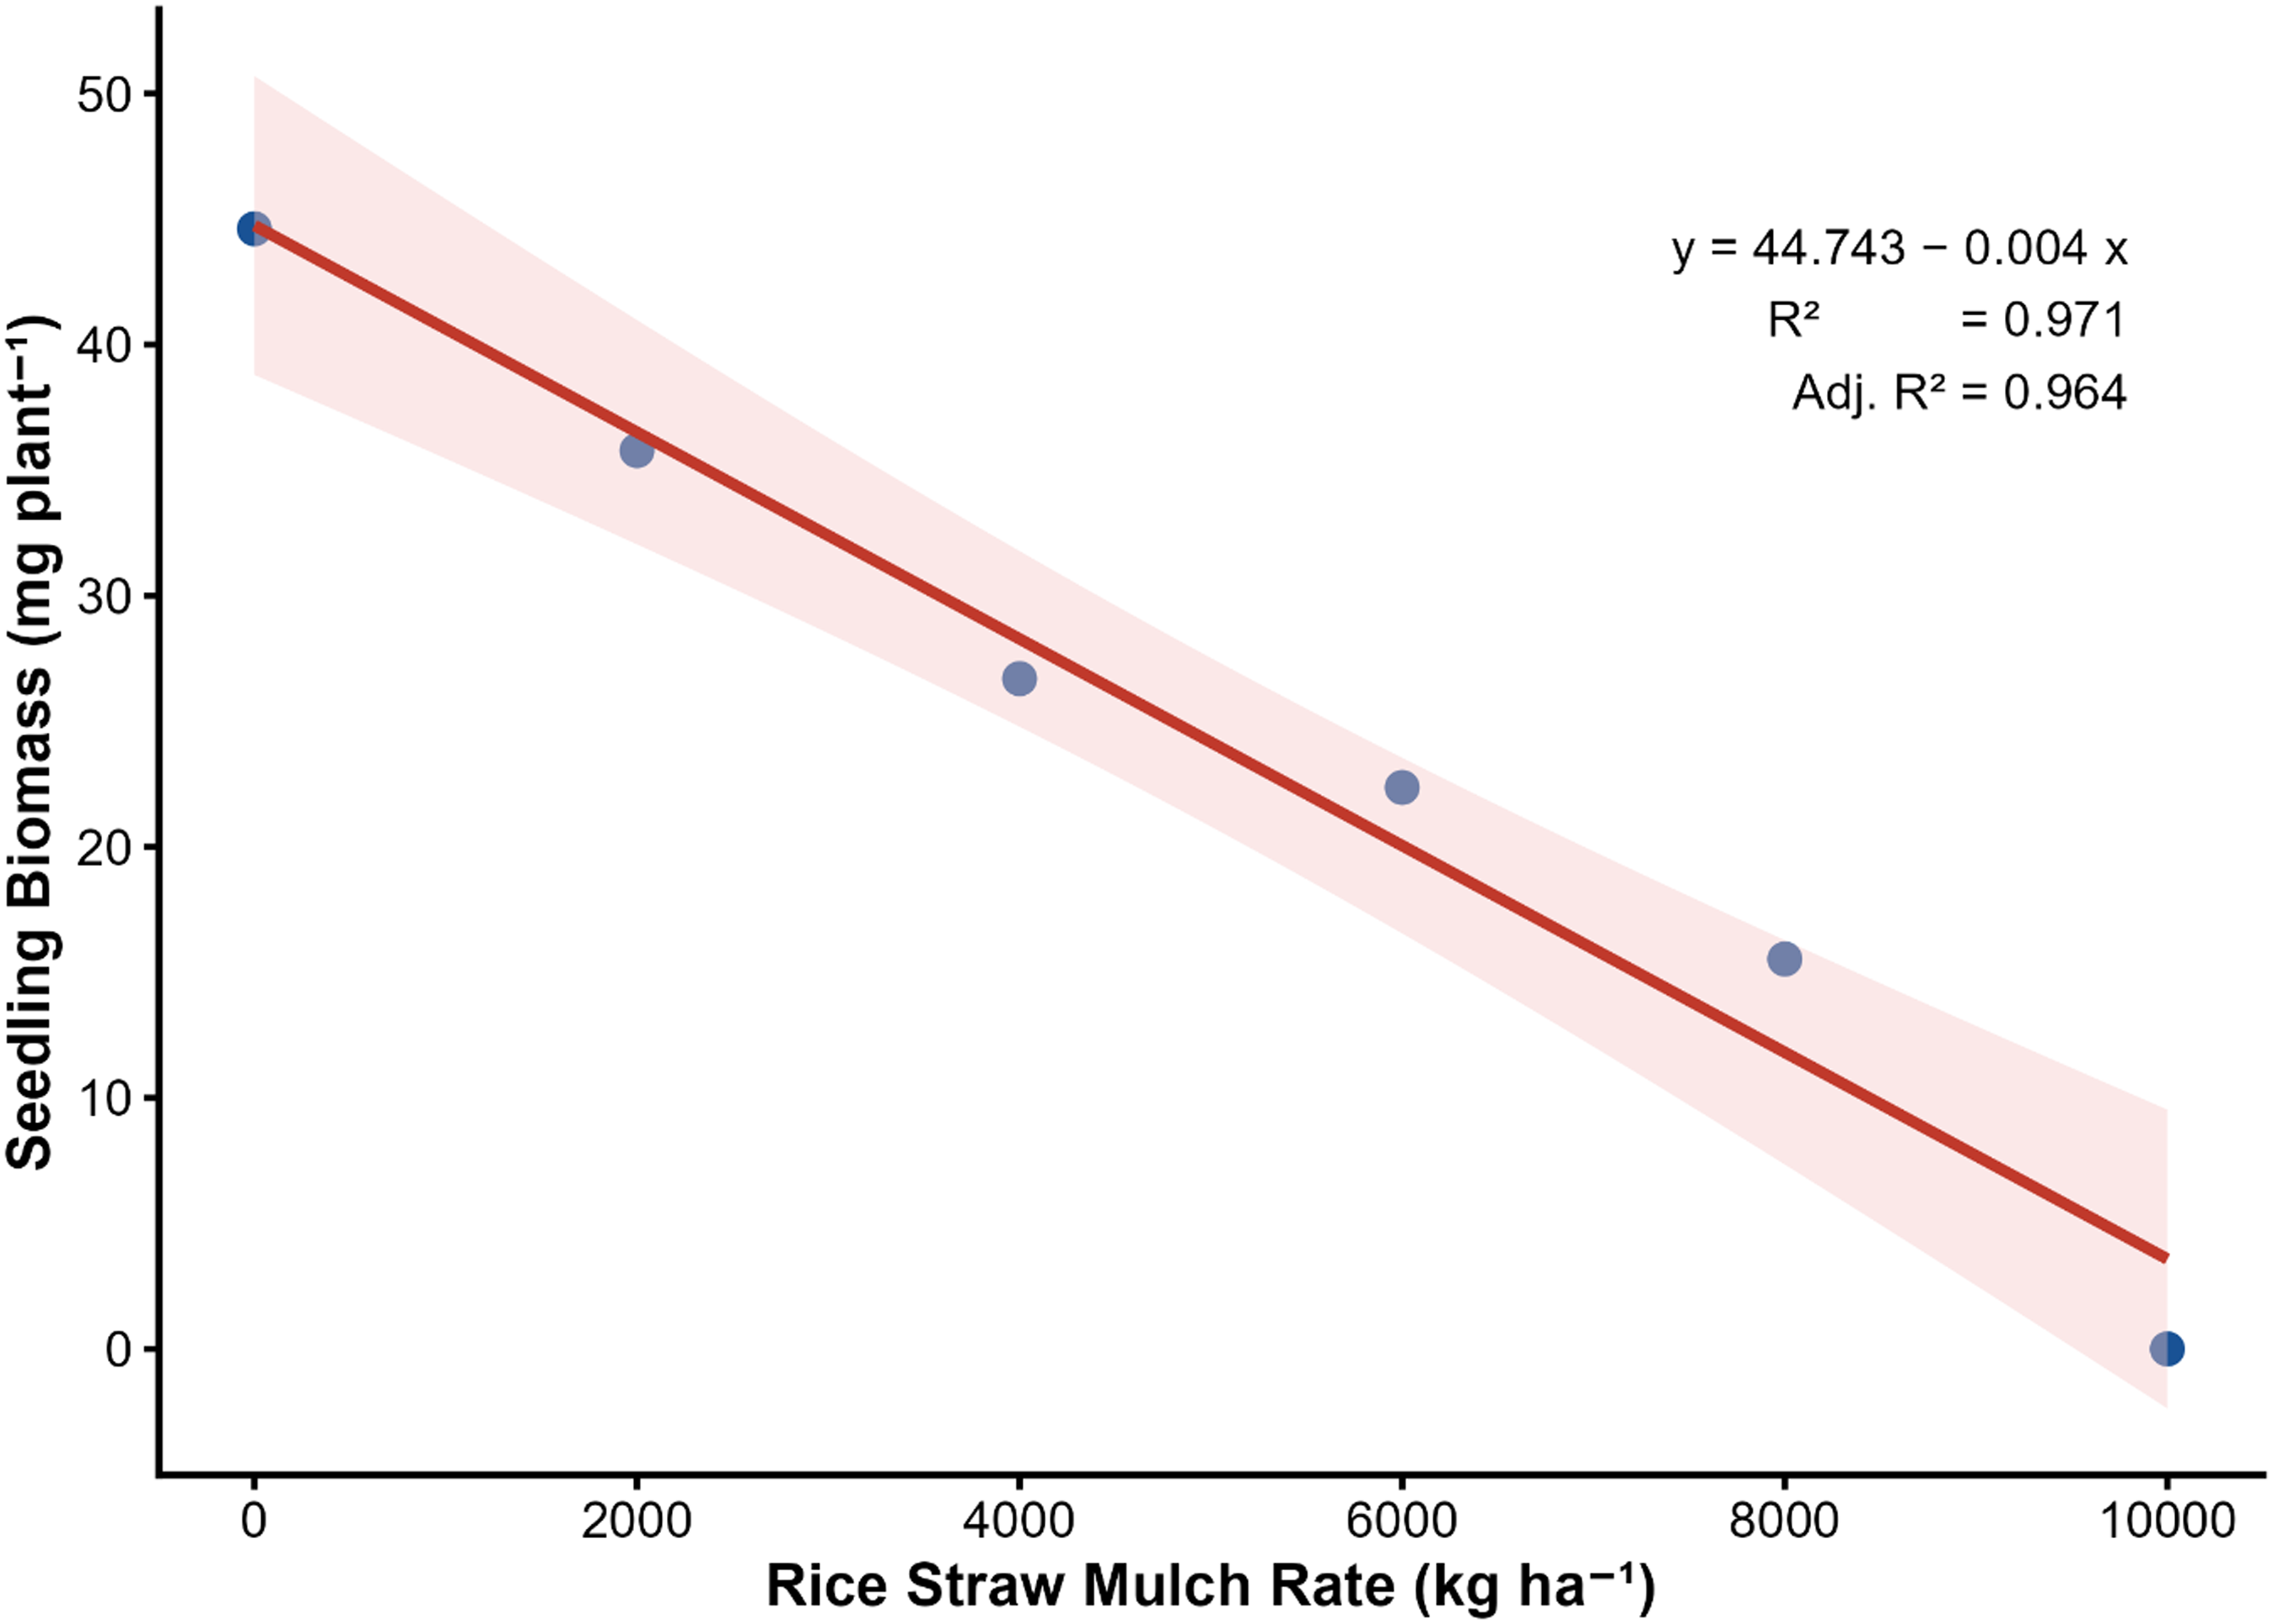
Regression analysis revealed a significant negative linear relationship between mulch rate and seedling biomass (Figure 11) and seedling length (Figure 12), indicating that increasing mulch rates progressively reduced seedling growth of E. crus-galli.
Linear regression model depicting the relationship between rice straw mulch rate and seedling biomass of Echinochloa crus-galli at 14 d after sowing.

Linear regression model depicting the relationship between rice straw mulch rate and seedling length of Echinochloa crus-galli at 14 d after sowing.

The reduction in emergence, seedling vigor, seedling length, and biomass with increasing rice straw mulch rates can primarily be attributed to the physical barrier created by the mulch layer, which restricts light penetration and increases mechanical resistance to seedling emergence. Reduced light availability is particularly important for small-seeded species such as E. crus-galli, which require light for optimal germination. Similar reductions in weed emergence under crop residues have been reported by Chauhan and Johnson (Reference Chauhan and Johnson2010) and Nikolic et al. (Reference Nikolić, Loddo and Masin2021).
Crop residues may restrict water movement and influence seed germination, with residue thickness being a key determining factor (Iqbal et al. Reference Iqbal, Raza, Valipour, Saleeem, Zaheer, Ahmad, Toleikiene, Haider, Aslam and Nazar2020). Residues act as a physical barrier by restricting light penetration, modifying soil temperature, and altering soil moisture conditions, thereby collectively suppressing germination and seedling emergence. Reduced light transmission and changes in light quality beneath mulch are important factors limiting weed germination (Ossom et al. Reference Ossom, Pace, Rhykerd and Rhykerd2001). Similarly, Prem et al. (Reference Prem, Ranjan, Seth and Patle2020) and Stigter et al. (Reference Stigter, Ramesh and Upadhyay2018) reported that organic mulches reduce weed emergence by restricting seedling growth. In addition, mulch can reduce oxygen diffusion and modify the soil microenvironment, further inhibiting germination and early seedling development. Chauhan and Johnson (Reference Chauhan and Johnson2009, Reference Chauhan and Johnson2011) also observed reduced emergence of E. crus-galli with increasing crop residue levels.
The present findings, however, differ from those of Chauhan and Johnson (Reference Chauhan and Johnson2011), who reported an increase in seedling biomass of E. crus-galli with mulch application up to 4,000 kg ha−1. In contrast, the present study observed a progressive decline in both seedling length and biomass with increasing mulch rates. This reduction may be attributed to the greater mechanical resistance imposed by thicker mulch layers, which can exceed the energy reserves of germinating seeds, thereby limiting emergence and seedling vigor. Altered soil temperature and moisture conditions under mulch may further constrain early seedling growth. At the highest mulch rate (10,000 kg ha−1), the thick straw layer completely prevented emergence, demonstrating its strong suppressive potential.
In addition to physical effects, rice straw residues may influence weed emergence by releasing phytotoxic compounds during decomposition, thereby inhibiting germination and seedling growth. Similar findings were reported by Feng et al. (Reference Feng, Yakob, Orbagabir, Okbatisae and Mam2023), who observed greater weed suppression with thicker organic mulch layers due to enhanced allelopathic effects. Kosterna (Reference Kosterna2014) also reported significant reductions in weed population and biomass at higher mulch application rates (10 t ha−1), while Uwah and Iwo (Reference Uwah and Iwo2011) observed decreased weed biomass with increasing mulch rates from 2,000 to 8,000 kg ha−1.
Chung et al. (Reference Chung, Kim, Ahn, Lee, Kim and Hahn2003) and Devasinghe et al. (Reference Devasinghe, Premarathne and Sangakkara2011) reported effective weed suppression by rice straw mulch in rice systems, findings further supported by Radics and Szné Bognar (Reference Radics and Szné Bognár2004), Petersen and Röver (Reference Petersen and Röver2005), and Ramakrishna et al. (Reference Ramakrishna, Hoang, Wani and Tranh2006). Similarly, Yadav et al. (Reference Yadav, Das, Lal, Babu, Meena, Patil, Saha and Datta2018) observed reduced grassy weed biomass under straw mulch in direct-seeded rice, while Zhang et al. (Reference Zhang, Wang, Cao, Li and Chauhan2023) reported reduced emergence and biomass of Echinochloa species under residue mulching.
It can be concluded that seed burial depth, flooding, and rice straw mulching are key ecological factors regulating the emergence and early growth of E. crus-galli. Seed burial beyond 6 cm, maintaining flooding depths of ≥6 cm, and applying adequate rice straw mulch effectively suppressed weed establishment by limiting seed germination and seedling growth. These findings demonstrate that integrating deep tillage, stale seedbed preparation, appropriate water management, and residue retention can provide an effective nonchemical approach for managing E. crus-galli in rice-based systems. Adoption of these complementary practices can reduce dependence on herbicides while supporting more sustainable and resilient weed management.
Practical Implications
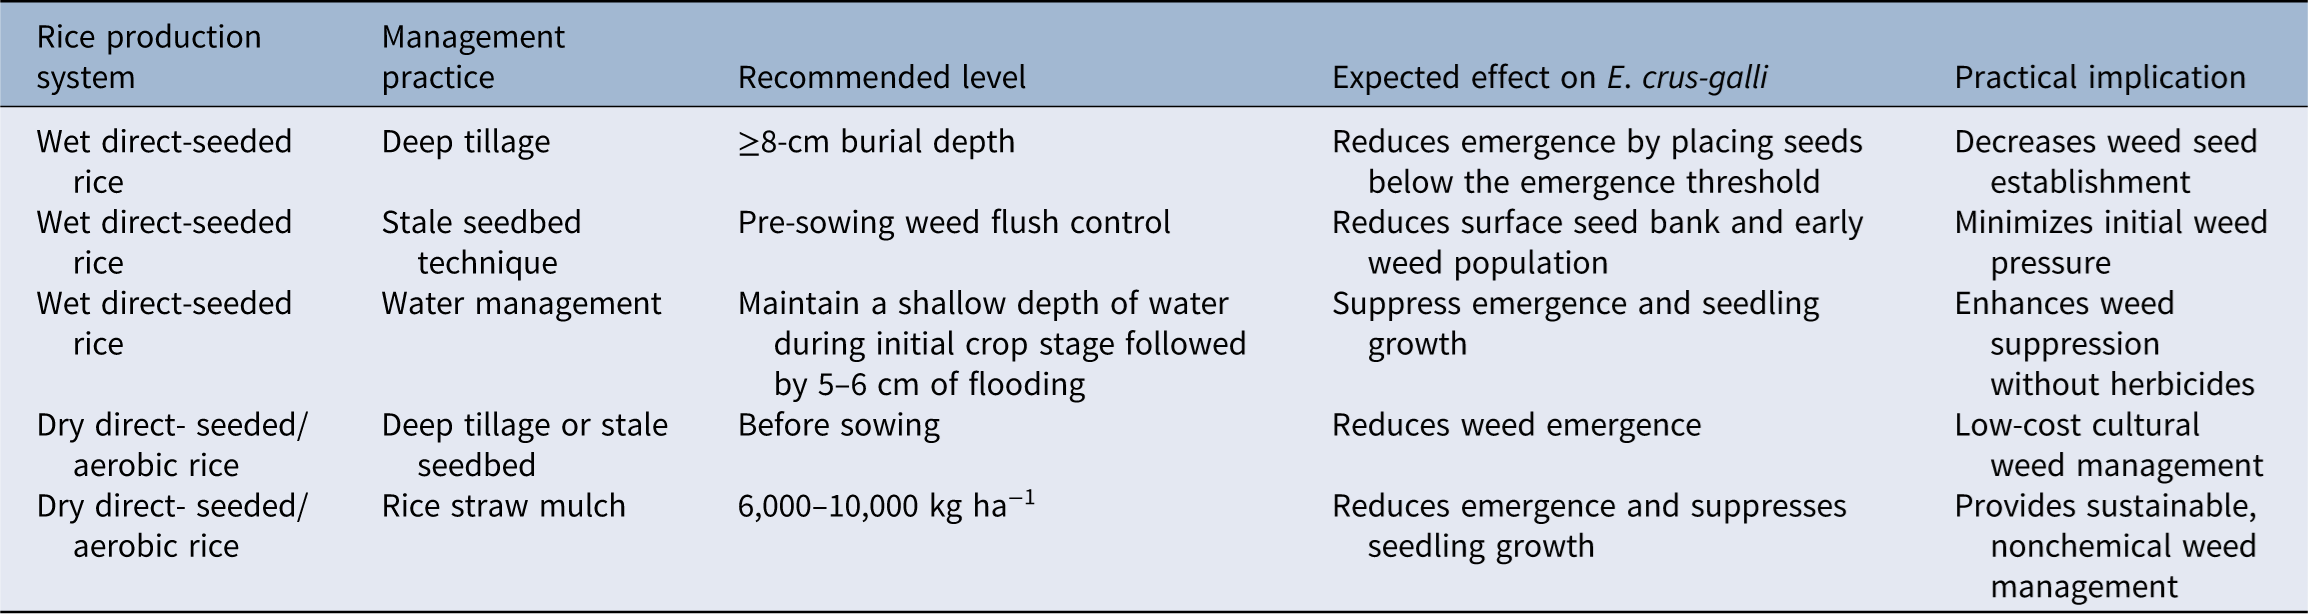
The results provide clear guidance for managing E. crus-galli in rice-based systems through integrated cultural practices. In wet direct-seeded rice, deep tillage (≥8 cm) or the stale seedbed technique can reduce the surface seedbank, while maintaining shallow water depth of 5 to 6 cm during early crop stages can suppress weed emergence and survival. In dry direct-seeded and aerobic systems, deep tillage or stale seedbed preparation combined with rice straw mulching (6,000 to 10,000 kg ha−1) effectively reduces weed emergence. A summary of the recommended cultural management practices and their implications is provided in Table 7. These approaches offer reliable, low-cost, nonchemical options to minimize herbicide use and promote sustainable weed management.
Integrated cultural management strategies for suppression of Echinochloa crus-galli in different rice-based production systems.

Table 7. Long description
A table comparing rice production systems and management practices for suppressing Echinochloa crus-galli. The table has 5 rows and 5 columns. Column headers are Rice production system, Management practice, Recommended level, Expected effect on E. crus-galli, and Practical implication. Row 1: Wet direct-seeded rice, Deep tillage, >=8-cm burial depth, Reduces emergence by placing seeds below the emergence threshold, Decreases weed seed establishment. Row 2: Wet direct-seeded rice, Stale seedbed technique, Pre-sowing weed flush control, Reduces surface seed bank and early weed population, Minimizes initial weed pressure. Row 3: Wet direct-seeded rice, Water, management, Maintain a shallow depth of water during initial crop stage followed by 5-6 cm of flooding, Suppress emergence and seedling growth. Row 4: Enhances weed suppression without herbicides, Deep tillage or stale seedbed, Before sowing, Reduces weed emergence, Low-cost cultural weed management. Row 5: Dry direct-seeded/aerobic rice, Rice straw mulch, 6,000-10,000 kg ha^-1, Reduces emergence and suppresses seedling growth, Provides sustainable, nonchemical weed management.
Acknowledgments
The authors acknowledge Kerala Agricultural University, Thrissur, Kerala, India, for providing the infrastructure for conducting experiments. During the preparation of this work, the authors used ChatGPT in order to improve the language. After using this tool/service, the authors reviewed and edited the content as needed and take full responsibility for the content of the publication.
Funding statement
This research received no specific grant from any funding agency or the commercial or not-for-profit sectors.
Competing interests
The authors declare no conflicts of interest.


 Open access

