





Introduction
Major depressive disorder (MDD) is one of the most prevalent mental illnesses in the United States with an estimated 22.5 million adults reporting a major depressive episode in 2022 (SAMHSA, 2024). MDD prognosis and intervention outcomes are complicated by a variety of factors such as sex differences in prevalence and treatment (Altemus et al., Reference Altemus, Sarvaiya and Neill Epperson2014; Shi et al., Reference Shi, Yang, Zhao, Chen, Ren and Dai2021; Sundbom, Bingefors, Hedborg, & Isacson, Reference Sundbom, Bingefors, Hedborg and Isacson2017; Zhong et al., Reference Zhong, Kremers, Yawn, Bobo, Sauver, Ebbert, Finney Rutten, Jacobson, Brue and Rocca2014), a frequent (47.5%) comorbidity with an anxiety disorder (COM) (Kessler et al., Reference Kessler, Sampson, Berglund, Gruber, Al-Hamzawi, Andrade, Bunting, Demyttenaere, Florescu, De Girolamo, Gureje, He, Hu, Huang, Karam, Kovess-Masfety, Lee, Levinson, Medina Mora and Wilcox2015), and widespread use of antidepressant medications (13.2% of US adults over 18 take antidepressants) (Brody & Gu, Reference Brody and Gu2020). Identifying and characterizing transdiagnostic, functional processes that underline symptom development and maintenance of MDD, such as inhibitory control, become increasingly difficult with this population variance in comorbidities, sex/gender, and common psychopharmacological treatments. Integrating these differences within the population into our descriptions, phenotyping, and prediction of MDD could clarify variability in past descriptions of MDD from previous work and could inform intervention design to be better equipped to handle normal and pathological deviations in specific domains of MDD. Recruiting large samples with enough heterogeneity in comorbidity, sex/gender, and recorded antidepressant use is a significant pragmatic challenge. Thus, the current study employs rigorous, empirical quantification of inhibitory control among a sample of adults with and without MDD and variability in comorbidity, sex, and recorded use of serotonergic antidepressants to delineate the functional implications of these factors on inhibitory control in MDD.
Inhibitory control is an executive function that entails preventing oneself from committing a prepotent response (Diamond, Reference Diamond2013) and is operationalized by varying experimental paradigms such as the stop signal task (SST; Logan, Cowan, & Davis, Reference Logan, Cowan and Davis1984; Verbruggen & Logan, Reference Verbruggen and Logan2008). The dual mechanisms of control framework (Braver, Reference Braver2012) situates inhibitory control under the proactive and reactive control domains such that alterations in task design measure inhibitory control if asking participants to ‘strategize’ or ‘react’, respectively. Specifically, the SST asks participants to respond to a series of stimuli, but participants are instructed to withhold their response when a stop-signal occurs, interrupting a series of prepotent response stimuli. Deficits in this reactive inhibitory control have been observed in MDD and anxiety disorders (Bruder, Kayser, & Tenke, Reference Bruder, Kayser and Tenke2012; Infantolino et al., Reference Infantolino, Crocker, Heller, Yee, Miller, Cacioppo, Tassinary and Berntson2016; Kaiser et al., Reference Kaiser, Unger, Kiefer, Markela, Mundt and Weisbrod2003; Klawohn, Santopetro, Meyer, & Hajcak, Reference Klawohn, Santopetro, Meyer and Hajcak2020; Palmwood et al., Reference Palmwood, Krompinger and Simons2017; Ruchsow et al., Reference Ruchsow, Groen, Kiefer, Beschoner, Hermle, Ebert and Falkenstein2008; Santopetro et al., Reference Santopetro, Brush, Bruchnak, Klawohn and Hajcak2021; Snyder, Reference Snyder2013; Zhang, Zhao, & Xu, Reference Zhang, Zhao and Xu2007) as well as a variety of psychiatric conditions (McTeague et al., Reference McTeague, Huemer, Carreon, Jiang, Eickhoff and Etkin2017; White et al., Reference White, Demuth, Nacke, Kirlic, Kuplicki, Spechler, McDermott, DeVille, Stewart, Lowe, Paulus and Aupperle2023). Inhibitory control is indexed in behavioral, cognitive, and neural domains, but electroencephalography (EEG) is the predominant technique measuring the neurocognitive correlates of reactive inhibitory control. Event-related potentials (ERPs) derived from EEG are well-established neurocognitive markers of conflict and error monitoring, categorization processes, and resource allocation (Luck, Reference Luck2014b). The N200 component – an anterior, negative-going wave peaking around 200–300 ms post-stimulus onset – indexes conflict monitoring and is sensitive to inhibition demands (Folstein & Van Petten, Reference Folstein and Van Petten2008). The P300 component – a parietal, positive-going wave emerging around 300–500 ms post-stimulus onset – reflects attentional deployment and is sensitive to task conditions such as increased attentional demands (Polich, Reference Polich, Luck and Kappenman2012). While the N200 and P300 components appear regardless of accuracy, the correct-related negativity (CRN) – an anterior, sharp negative deflection appearing around 50–100 ms after a correct go response (Gehring et al., Reference Gehring, Liu, Orr, Carp, Luck and Kappenman2012; Vidal, Burle, & Hasbroucq, Reference Vidal, Burle and Hasbroucq2022), such as responding after the absence of stop-signal presentation in the context of the SST.
Although past work has emphasized the general trend of inhibitory control in MDD, the ecological reality of MDD still involves a significant amount of variability unaccounted for by a mere diagnosis. Individuals with MDD in inhibitory paradigms tend to have similar N200 and blunted (less positive) P300 amplitudes relative to healthy controls during trials require response inhibition (Kaiser et al., Reference Kaiser, Unger, Kiefer, Markela, Mundt and Weisbrod2003; Klawohn et al., Reference Klawohn, Santopetro, Meyer and Hajcak2020; Palmwood et al., Reference Palmwood, Krompinger and Simons2017; Ruchsow et al., Reference Ruchsow, Groen, Kiefer, Beschoner, Hermle, Ebert and Falkenstein2008; Santopetro et al., Reference Santopetro, Brush, Bruchnak, Klawohn and Hajcak2021, Reference Santopetro, Thompson, Garron, Keith, Brush, Schmidt and Hajcak2025; Zhang et al., Reference Zhang, Zhao and Xu2007), but participants with generalized anxiety disorder (GAD) and high-test anxiety demonstrate more positive P300 amplitudes compared to healthy controls during response inhibition as measured by the Go/Nogo and SST paradigms (Baughman et al., Reference Baughman, Wilhelm, Spechler, McNaughton, Demuth, Lawrence, Riddle, Shadlow, Kominsky, Stewart, Aupperle, Paulus and White2023; Sehlmeyer et al., Reference Sehlmeyer, Konrad, Zwitserlood, Arolt, Falkenstein and Beste2010). Previous work interested in defining COM that has focused on inhibitory control has mixed findings (Crane et al., Reference Crane, Jenkins, Dion, Meyers, Weldon, Gabriel, Walker, Hsu, Noll, Klumpp, Phan, Zubieta and Langenecker2016; Lyche et al., Reference Lyche, Jonassen, Stiles, Ulleberg and Landrø2010; Quinn, Harris, & Kemp, Reference Quinn, Harris and Kemp2012; Ren et al., Reference Ren, Mann, Wilhelm, Stewart, Kuplicki, Edwards, Guinjoan, Park, Aupperle, Victor, Paulus, White and Tsuchiyagaito2025; X. Zhou et al., Reference Zhou, Lin, Yang, Xiang, Zhou and Zou2023). Despite potential cognitive and symptomatic distinctions between MDD and COM, common pharmacological treatments for both are serotonergic antidepressants. Clinical psychophysiology studies investigating inhibitory control often ignore, statistically control for, or exclude participants based on their pharmacological treatment, such as in Kaiser et al. (Reference Kaiser, Unger, Kiefer, Markela, Mundt and Weisbrod2003), Palmwood et al. (Reference Palmwood, Krompinger and Simons2017), and Ruchsow et al. (Reference Ruchsow, Groen, Kiefer, Beschoner, Hermle, Ebert and Falkenstein2008). With an understanding of the relation between EEG/ERPs and neurotransmission (Andreassi, Reference Andreassi2007; Luck, Reference Luck2014a), the neuronal source of the EEG signal – pyramidal cells – being dense with serotonin receptors (Andrade, Reference Andrade2011; Puig & Gulledge, Reference Puig and Gulledge2011), and SSRIs and SNRIs’ known modes of action (Artigas, Reference Artigas1995; Stahl, Reference Stahl1998), it is unwise to discount how these medications may modulate neural correlates of inhibitory control in MDD. Treatment response of SSRIs and SNRIs have been tested with psychophysiological methods to answer questions about the modulation of neural correlates of other deficits in MDD, including ERP components indexing reward processing (i.e. reward positivity [RewP]) (Burkhouse et al., Reference Burkhouse, Gorka, Klumpp, Kennedy, Karich, Francis, Ajilore, Craske, Langenecker, Shankman, Hajcak and Phan2018; Kujawa et al., Reference Kujawa, Burkhouse, Karich, Fitzgerald, Monk and Phan2019), motivational salience and attention (late positive potential [LPP]) (Bunford et al., Reference Bunford, Kujawa, Fitzgerald, Swain, Hanna, Koschmann, Simpson, Connolly, Monk and Phan2017), error monitoring (error-related negativity [ERN]) (Barnes et al., Reference Barnes, O’Connell, Nandam, Dean and Bellgrove2014; De Bruijn et al., Reference De Bruijn, Sabbe, Hulstijn, Ruigt and Verkes2006; Fischer et al., Reference Fischer, Endrass, Reuter, Kubisch and Ullsperger2015b; Gorka et al., Reference Gorka, Burkhouse, Klumpp, Kennedy, Afshar, Francis, Ajilore, Mariouw, Craske, Langenecker, Shankman and Phan2018), stimulus perception (N100) (Spronk et al., Reference Spronk, Arns, Barnett, Cooper and Gordon2011), stimulus categorization (P300) (d’Ardhuy et al., Reference d’Ardhuy, Boeijinga, Renault, Luthringer, Rinaudo, Soufflet, Toussaint and Macher1999; Jaworska et al., Reference Jaworska, De Somma, Blondeau, Tessier, Norris, Fusee, Smith, Blier and Knott2013; Wakode, Hulke, Sutar, & Thakare, Reference Wakode, Hulke, Sutar and Thakare2022; Zhao et al., Reference Zhao, Zhou, He, Peng, Hu, Ma, Liu, Tao, Chen, Jiang, Zhang, Liao, Xiang, Zeng, Dai, Zhang, Hong, Wang and Kuang2024; L. Zhou, Wang, & Wang, Reference Zhou, Wang and Wang2018), and frequency and spectral analyses to understand responders versus nonresponders to the medications (Bruder et al., Reference Bruder, Sedoruk, Stewart, McGrath, Quitkin and Tenke2008; Dumont, De Visser, Cohen, & Van Gerven, Reference Dumont, De Visser, Cohen and Van Gerven2005; Le et al., Reference Le, Wong, Lu, Vasudeva, Gill, Badulescu, Portelles, Zheng, Teopiz, Meshkat, Kwan, Ho, Rhee, Rosenblat, Mansur and McIntyre2025). No published study has interrogated correlation or causal claims of serotonergic antidepressants impacting the neural correlates of inhibitory control within MDD, although behavioral inhibition has been shown to improve after participants with MDD begin taking SSRIs (Atique-Ur-Rehman & Neill, Reference Atique-Ur-Rehman and Neill2019; Herrera-Guzmán et al., Reference Herrera-Guzmán, Herrera-Abarca, Gudayol-Ferré, Herrera-Guzmán, Gómez-Carbajal, Peña-Olvira, Villuendas-González and Joan2010; Prado et al., Reference Prado, Watt and Crowe2018). Notably, females are twice as likely as males to be prescribed at least one antidepressant and diagnosed with a serious mental illness (SAMHSA, 2024; Sundbom et al., Reference Sundbom, Bingefors, Hedborg and Isacson2017; Zhong et al., Reference Zhong, Kremers, Yawn, Bobo, Sauver, Ebbert, Finney Rutten, Jacobson, Brue and Rocca2014), and there are known sex differences in the neural correlates of inhibitory control in healthy controls such that females have less negative N200 and no differences in P300 amplitudes as compared to male participants (Clayson, Clawson, & Larson, Reference Clayson, Clawson and Larson2011; Gaillard et al., Reference Gaillard, Fehring and Rossell2021; Knežević, Reference Knežević2018; Ramos-Loyo, Angulo-Chavira, Llamas-Alonso, & González-Garrido, Reference Ramos-Loyo, Angulo-Chavira, Llamas-Alonso and González-Garrido2016). It is clear that a precision psychiatry framework is warranted in research and treatment of MDD to clarify from and for whom our descriptions and interventions involving inhibitory control are derived, respectively.
The present study
The current study investigates differences in the cognitive cascade during inhibitory control – indexed by the N200 and P300 components elicited by the stimulus presentation during an SST – and performance monitoring – quantified by the CRN component induced by correctly responding during go trials – between healthy controls (HCs) and MDD/COM participants and within MDD and COM participants. Comparisons between the HC and MDD/COM participants focused on comorbidity and sex differences, and comparisons within MDD/COM participants focused on comorbidity, sex differences, and treatment with serotonergic antidepressants. We hypothesized (Hypothesis 1: H1) a main effect of group, wherein the MDD group would have similar stop-N200 amplitudes and more attenuated (less positive) stop-P300 amplitudes as compared to the COM and HC groups; (Hypothesis; H2) a main effect of sex, wherein females would have less negative stop-N200 but similar P300 amplitudes as compared to males; and (Hypothesis 3; H3) within MDD and COM groups, participants treated with serotonergic antidepressants will have more normalized inhibitory and performance-related ERPs – less negative stop-N200, more positive stop-P300, and more positive CRN amplitudes – than participants not treated with these medications.
Methods
Participants
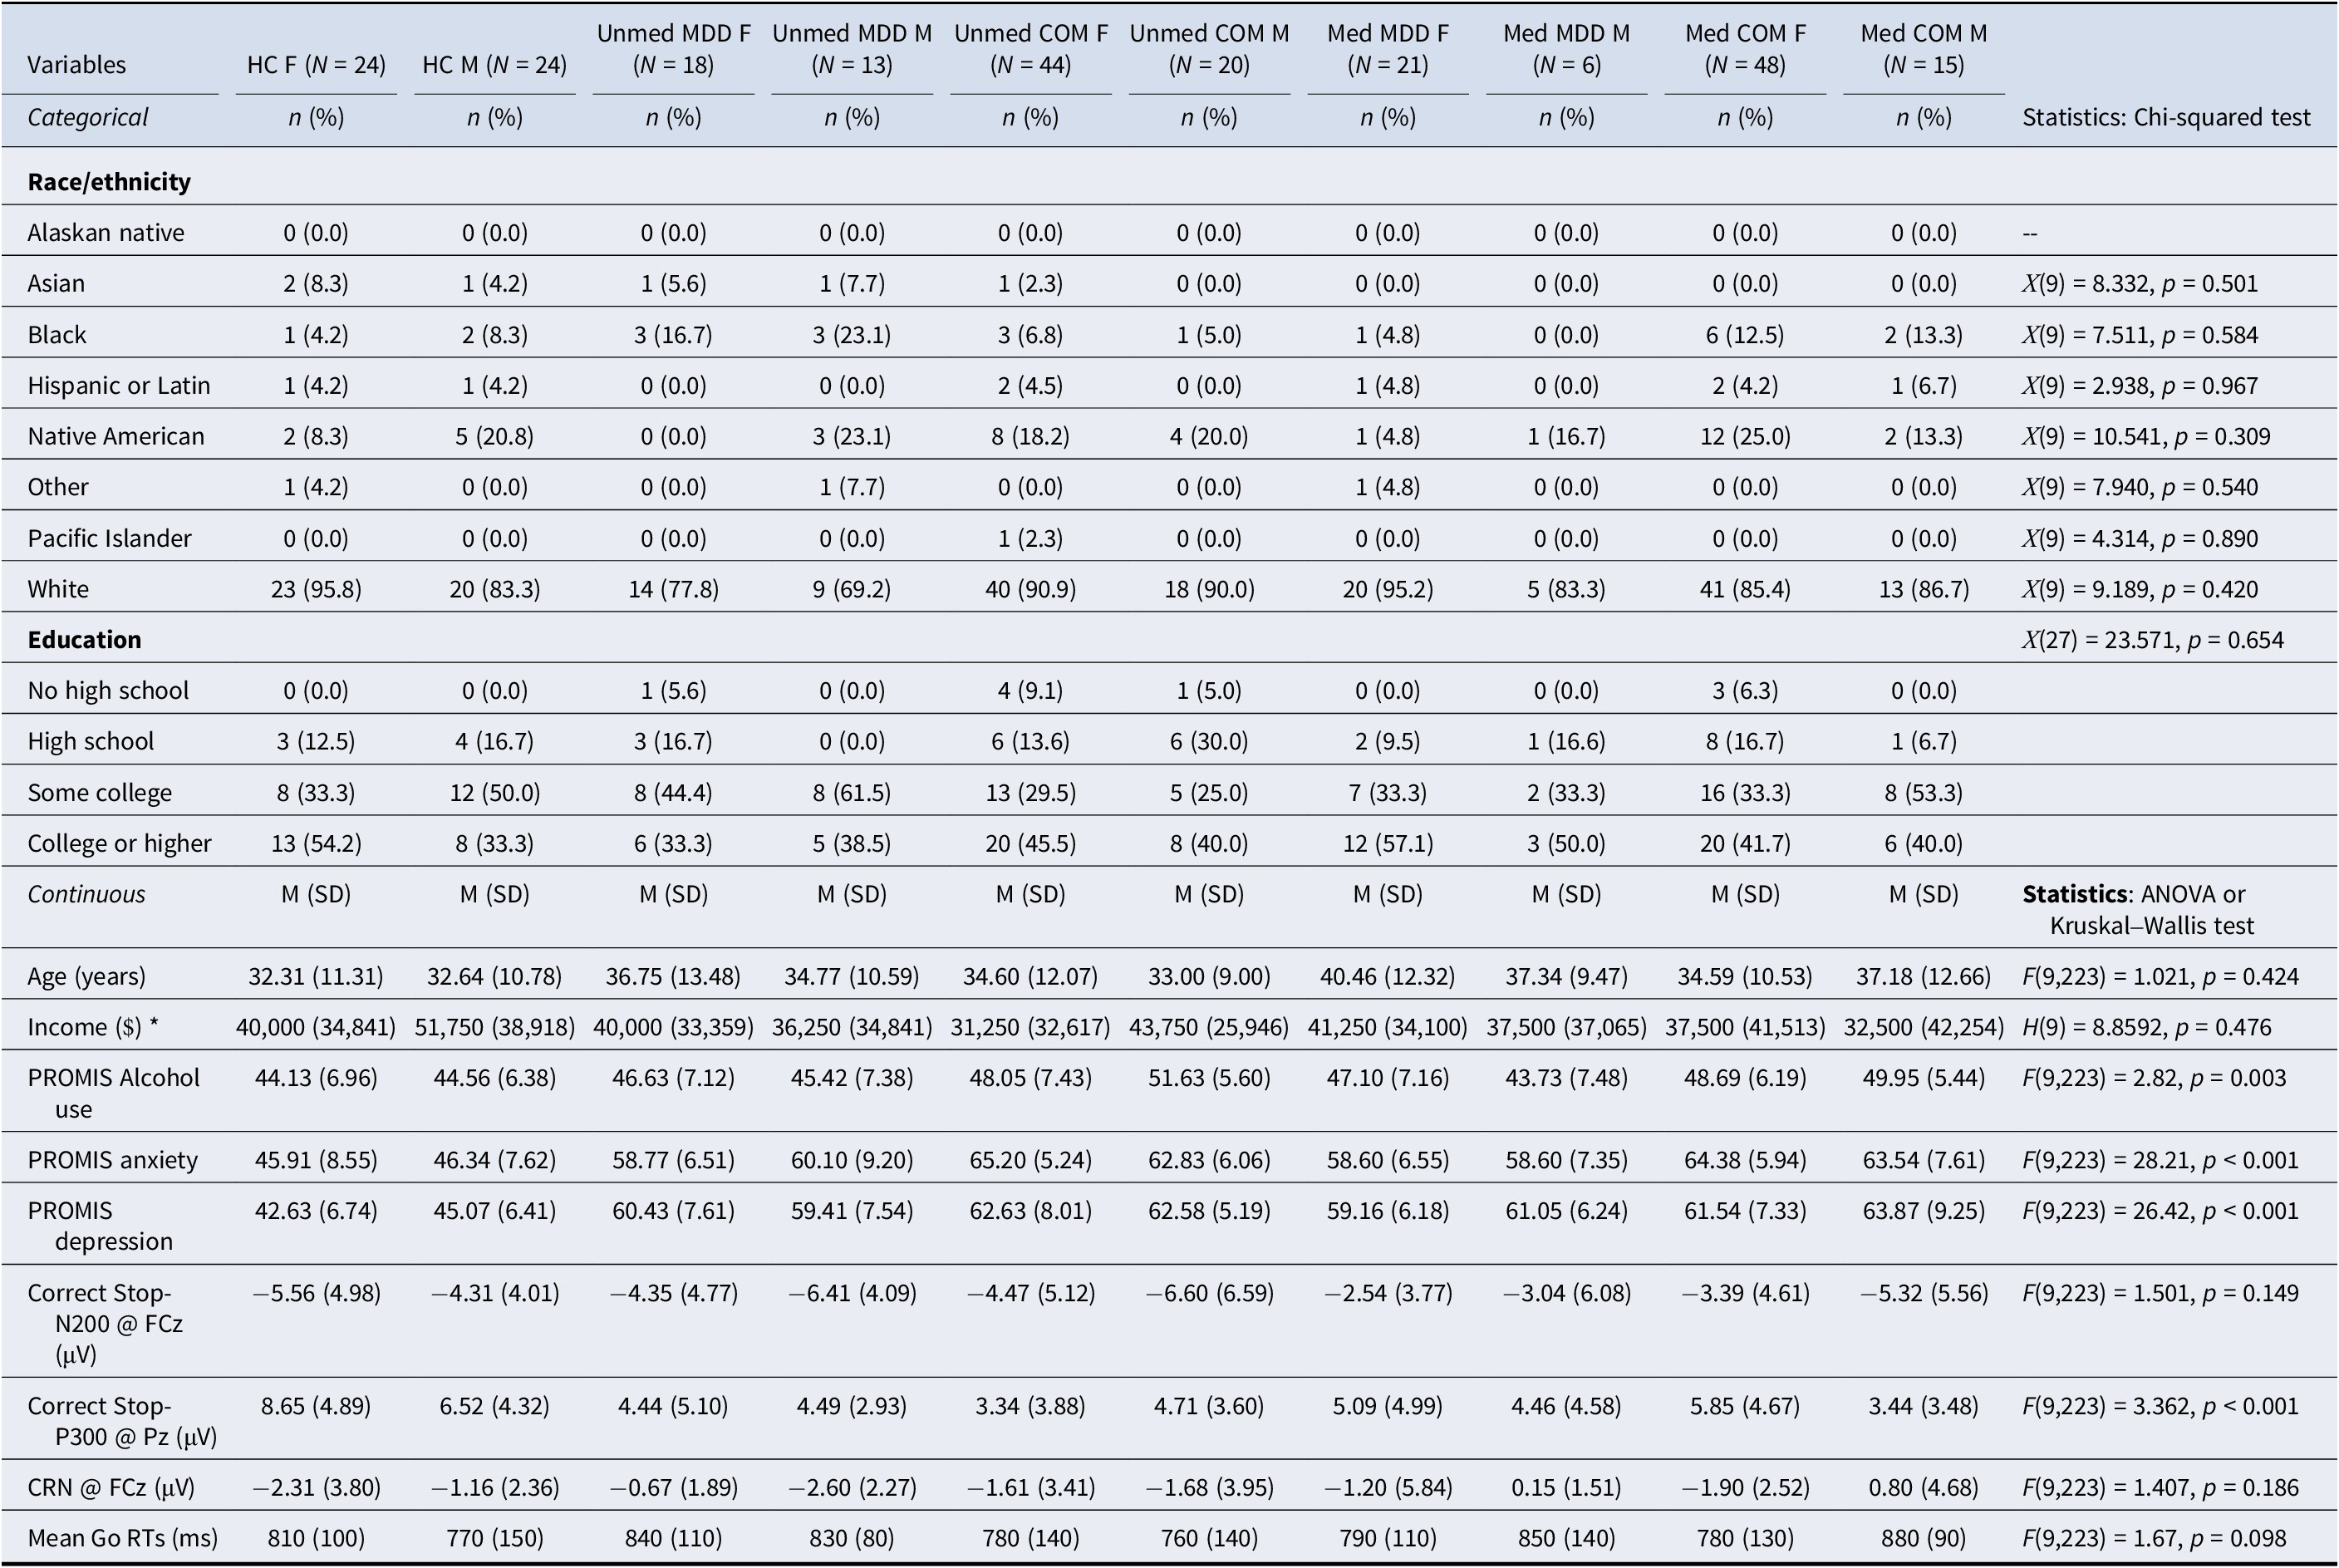
Male and female participants ages between 18 and 65 years old were selected from the Tulsa 1000 study (Victor et al., Reference Victor, Khalsa, Simmons, Feinstein, Savitz, Aupperle, Yeh, Bodurka and Paulus2018) conducted at the Laureate Institute for Brain Research. Participants completed a demographic questionnaire, Mini International Neuropsychiatric Interview (MINI) 6.0 or 7.0 (Sheehan et al., Reference Sheehan, Lecrubier, Sheehan, Amorim, Janavs, Weiller, Hergueta, Baker and Dunbar1998), and Patient-Reported Outcomes Measurement Information System (PROMIS) Depression, Anxiety, and Alcohol Use scales (Cella et al., Reference Cella, Riley, Stone, Rothrock, Reeve, Yount, Amtmann, Bode, Buysse, Choi, Cook, DeVellis, DeWalt, Fries, Gershon, Hahn, Lai, Pilkonis, Revicki and Hays2010) before simultaneous electroencephalograph-magnetic resonance (EEG-MRI) recording. Inclusion criteria were based on diagnosis and available EEG data for the stop signal ERPs such that participants were included if (a) they had >8 correct go trials (Olvet & Hajcak, Reference Olvet and Hajcak2009; Pontifex et al., Reference Pontifex, Scudder, Brown, O’Leary, Wu, Themanson and Hillman2010; Rietdijk, Franken, & Thurik, Reference Rietdijk, Franken and Thurik2014) and 20 available stop signals (Clayson & Larson, Reference Clayson and Larson2013; Cohen & Polich, Reference Cohen and Polich1997; Rietdijk et al., Reference Rietdijk, Franken and Thurik2014); (b) they were a healthy control or diagnosed with major depressive disorder or major depressive disorder comorbid with an anxiety disorder (generalized anxiety, social anxiety, panic, and post-traumatic stress disorders); and (c) if treated with serotonergic antidepressants, they were treated only with SSRIs or SNRIs. Exclusion criteria were based on diagnosis such that participants were excluded if they were diagnosed with a substance use disorder of cannabis, cocaine, amphetamines, opioids, sedatives, hallucinogens, or inhalants. The current study has 233 participants (155 females, Mage = 34.96, SDage = 11.37), including 48 HCs and 185 individuals with a diagnosis of MDD with or without comorbid anxiety (COM; n = 127). Included participants’ demographics, clinical characteristics, ERP amplitudes, and behavioral measures are reported in Table 1. Data collection was approved by the Western Institutional Review Board and carried out in accordance with the Declaration of Helsinki. All participants provided written informed consent and were compensated after participation.
Group demographics, clinical characteristics, ERP amplitudes, and behavioral measures

Table 1. Long description
The table contains 10 group columns: H C F (N=24), H C M (N=24), Unmed M D D F (N=18), Unmed M D D M (N=13), Unmed C O M F (N=44), Unmed C O M M (N=20), Med M D D F (N=21), Med M D D M (N=6), Med C O M F (N=48), and Med C O M M (N=15).
Categorical Variables (n and percentage):
* Race/ethnicity: Predominantly White across all groups (ranging from 69.2% to 95.8%). Other categories include Asian, Black, Hispanic or Latin, Native American, and Pacific Islander. Statistics show no significant differences (p values 0.309 to 0.967).
* Education: Categories include No high school, High school, Some college, and College or higher. No significant difference (p = 0.654).
Continuous Variables (Mean and S D):
* Age: Ranges from 32.31 to 40.46 years (p = 0.424).
* Income (Median and M A D): Ranges from $31,250 to $51,750 (p = 0.476).
* P R O M I S Alcohol use: Significant difference (F = 2.82, p = 0.003).
* P R O M I S anxiety: Highly significant difference (F = 28.21, p < 0.001), with clinical groups scoring higher (58.60 to 65.20) than controls (approx. 46).
* P R O M I S depression: Highly significant difference (F = 26.42, p < 0.001), with clinical groups scoring higher (59.16 to 63.87) than controls (approx. 43-45).
* Correct Stop-N 2 0 0 at F C z: Ranges from -2.54 to -6.60 microvolts (p = 0.149).
* Correct Stop-P 3 0 0 at P z: Significant difference (F = 3.362, p < 0.001), with H C F showing the highest amplitude (8.65) and Unmed C O M F the lowest (3.34).
* C R N at F C z: Ranges from -2.60 to 0.80 microvolts (p = 0.186).
* Mean Go R T s: Ranges from 760 to 880 milliseconds (p = 0.098).
Note: * Income is reported in Median (MAD). Abbreviations: HC, healthy controls; F, female; M, male; Med, participants treated with SSRIs or SNRIs; Unmed, participants not treated with SSRIs or SNRIs, MDD, major depressive disorder; COM, major depressive disorder with a comorbid anxiety disorder; PROMIS, patient-reported outcomes measurement information system. Missing data: HC F – Income (n = 3); HC M – Hispanic or Latin (n = 1), Income (n = 2); Unmed MDD F – Income (n = 1); Unmed MDD M – Income (n = 1); Unmed COM F – Education (n = 1), Income (n = 14); Unmed COM M – Income (n = 6); Med MDD F – Income (n = 2); Med MDD M – Income (n = 1); Med COM F – Education (n = 1), Income (n = 7), PROMIS Alcohol use (n = 1).
Stop signal task (SST)
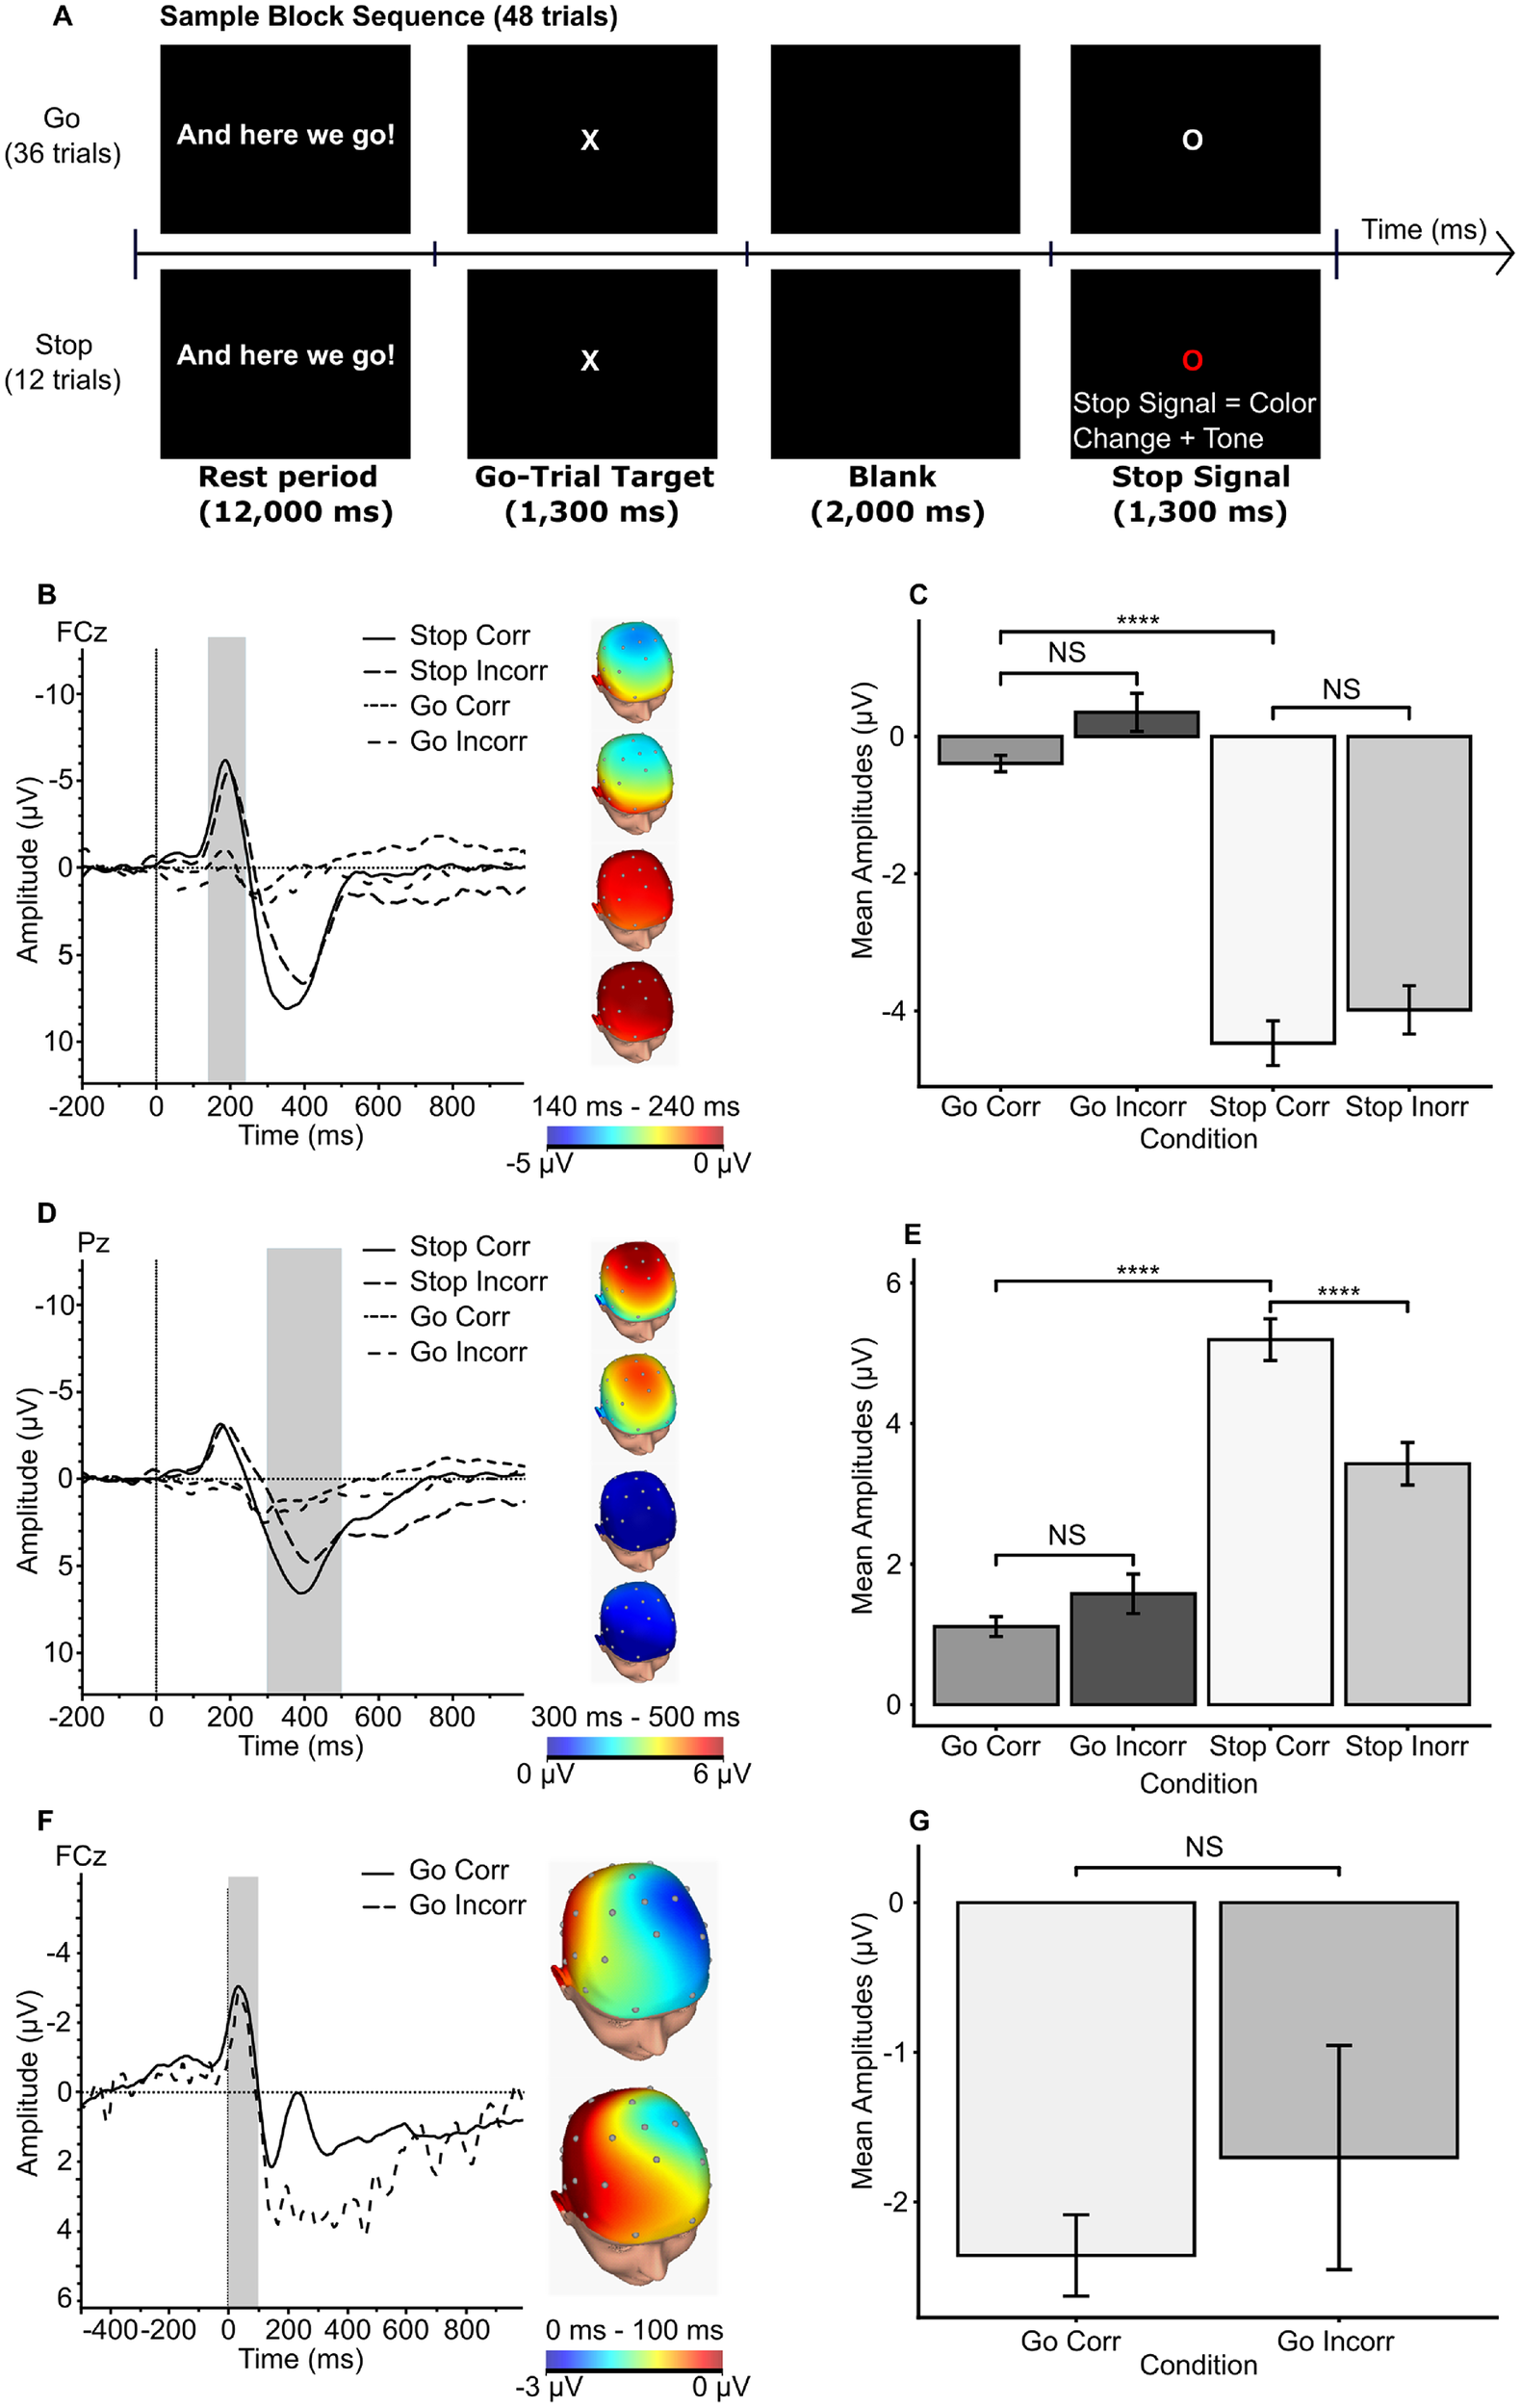
Before the simultaneous EEG-MRI scan, participants underwent an SST practice run to estimate their mean reaction time (MRT), which was subsequently utilized to determine the appropriate delays of stop signals (SSDs) during the actual task. In the EEG-MRI session, participants completed six task blocks, each comprising a total of 48 trials (12 stop and 36 nonstop trials). During each trial, participants were required to press the left button box when an ‘X’ was displayed on the screen and the right button when an ‘O’ appeared. Participants were instructed not to press any button when the color of letters changed to red, and a tone was played through earphones; see Figure 1 for a detailed task schematic and validation of the SST. An inter-trial interval of 200 ms was implemented, and the trial order was pseudo-randomized and counterbalanced throughout the task.
Stop Signal Task (SST) schematic and task validation. Note: (a) A task diagram of the stop signal task (SST). (b) Grand average waveform of the cue-locked N200 at FCz, grouped by task condition: stop correct trials, stop incorrect trials, go correct trials, and go incorrect trials. (c) Bar graph of mean amplitudes of the N200, grouped by task condition, verifying the SST’s elicitation of the N200. (d) Grand average waveform of the cue-locked P300 at Pz, grouped by task condition. (e) Bar graph of the mean amplitudes of the P300 grouped by task condition, verifying the SST’s elicitation of the P300. (f) Grand average waveform of the response-locked CRN/ERN at FCz, grouped by task condition. (g) Bar graph of the mean amplitudes of the CRN/ERN grouped by task condition; unable to verify the SST’s elicitation of the ERN. *p < 0.05, **p < 0.01, ***p < 0.001.

Figure 1. Long description
Panel A is a flowchart of a Sample Block Sequence. A horizontal time axis shows four stages: Rest period (12,000 ms), Go-Trial Target (1,300 ms), Blank (2,000 ms), and Stop Signal (1,300 ms). Go trials show a white ‘O’, while Stop trials show a red ‘O’ with a tone.
Panel B shows a line graph of cue-locked N 200 waveforms at F C z. The y-axis is amplitude in microvolts from 10 to -10; the x-axis is time from -200 to 800 ms. A grey shaded region highlights 140 to 240 ms. Stop Correct and Stop Incorrect trials show a sharp negative peak around 200 ms. To the right, four topographic head maps show voltage distribution.
Panel C is a bar graph of mean N 200 amplitudes. Go Correct and Go Incorrect bars are near 0, while Stop Correct and Stop Incorrect bars show significantly larger negative amplitudes around -4 microvolts.
Panel D shows cue-locked P 300 waveforms at P z. A grey shaded region highlights 300 to 500 ms. Stop trials show a large positive deflection.
Panel E is a bar graph for P 300. Stop Correct trials have the highest mean amplitude (approx 5 microvolts), significantly higher than Go trials (approx 1 to 1.5 microvolts).
Panel F shows response-locked C R N or E R N waveforms at F C z. A grey shaded region highlights 0 to 100 ms. Both Go Correct and Go Incorrect trials show a negative peak immediately after the response.
Panel G is a bar graph for C R N or E R N. Go Correct is approximately -2.4 microvolts and Go Incorrect is approximately -1.7 microvolts, labeled N S for non-significant difference.
ERP quantification and extraction
ERP segmentations were time-locked to stimulus presentation in correct stop trials to measure N200 and P300 amplitudes, and additional segmentations were time-locked to response onset in go trials to measure CRN amplitudes. Cue-locked segmentations were epoched from −200 to 1000 ms before and after cue presentation and were baseline corrected using the −200 to 0 ms time window. Response-locked segmentations were epoched from −500 to 1000 ms before and after response commission and were baseline corrected using the −500 to −300 ms time window. Waveforms from correct stop, incorrect stop, correct go, and incorrect go trials were averaged per participant, and the mean N200, P300, and CRN amplitudes were selected a priori according to previous work in cognitive control in MDD, so they were quantified at FCz, Pz, and FCz, respectively, within predefined time windows (140–240, 300–500, and 0–100 ms). Segmentations of the error-related negativity (ERN) were not included in this analysis, as included participants had an insufficient number of incorrect stop trials to reliably measure the ERN component.
Data analytic strategy
Data wrangling, visualization, and statistical analyses were performed in RStudio (build 147; R v4.6.1). To evaluate our hypotheses of inhibitory control and performance ERPs being impacted by comorbidity, sex, and medication status in MDD, three statistical techniques (10,000 sample bootstrapped linear mixed effect modeling, type III between-subjects ANOVAs, and optimal full propensity matching) were utilized using N200, P300, and CRN mean amplitudes as dependent variables and continuous and categorical measures of comorbidity (PROMIS Depression/Anxiety; HC, MDD, and COM), sex (F and M), and medication status (Med and Unmed) as main and interaction effects. A total of three LMEs, six ANOVAs, and three optimal full propensity matching procedures to get serotonergic antidepressants’ ‘average treatment effect’ (ATE) were conducted using functions from the ‘lme4’, ‘lmerTest’, ‘rstatix’, ‘emmeans’, ‘MatchIt’, ‘optmatch’, ‘cobalt’, ‘lmtest’, and ‘sandwich’ packages (Austin & Stuart, Reference Austin and Stuart2017; Bates et al., Reference Bates, Maechler, Bolker, Walker, Ly and Jagan2003; Greifer, Reference Greifer2025; Hansen et al., Reference Hansen, Fredrickson, Errickson and Buckner2024; Ho, Imai, King, & Stuart, Reference Ho, Imai, King and Stuart2011; Hothorn et al., Reference Hothorn, Zeileis, Farebrother and Cummins2022; Kassambara, Reference Kassambara2025; Kuznetsova, Brockhoff, & Christensen, Reference Kuznetsova, Brockhoff and Christensen2017; Lenth, Reference Lenth2025; Zeileis & Lumley, Reference Zeileis and Lumley2024). LMEs were conducted according to best practice guidelines by Meteyard & Davies (Reference Meteyard and Davies2020), and the following general equation was constructed per LME: Amplitudes ~ PROMIS Depression + PROMIS Anxiety + Sex + Age + Medication status * Condition + (1 | id). All ANOVAs were corrected for multiple comparisons using the Bonferroni approach, and they either used a 3 (Group [HC, MDD, COM]) × 2 (Sex [M, F]) or 2 (Group [MDD, COM]) × 2 (Sex [M, F]) × 2 (Medication [Med, Unmed]). The following general equation was constructed per weighted regression after propensity match balancing, using all the covariates except Medication status: Amplitudes ~ PROMIS Depression + PROMIS Anxiety + Diagnosis + Sex + Age + Go reaction times + Medication status. More detailed descriptions of data wrangling, visualization, statistical analysis, and software usage are reported in the Supplementary Materials.
Results
Bivariate correlation and descriptives
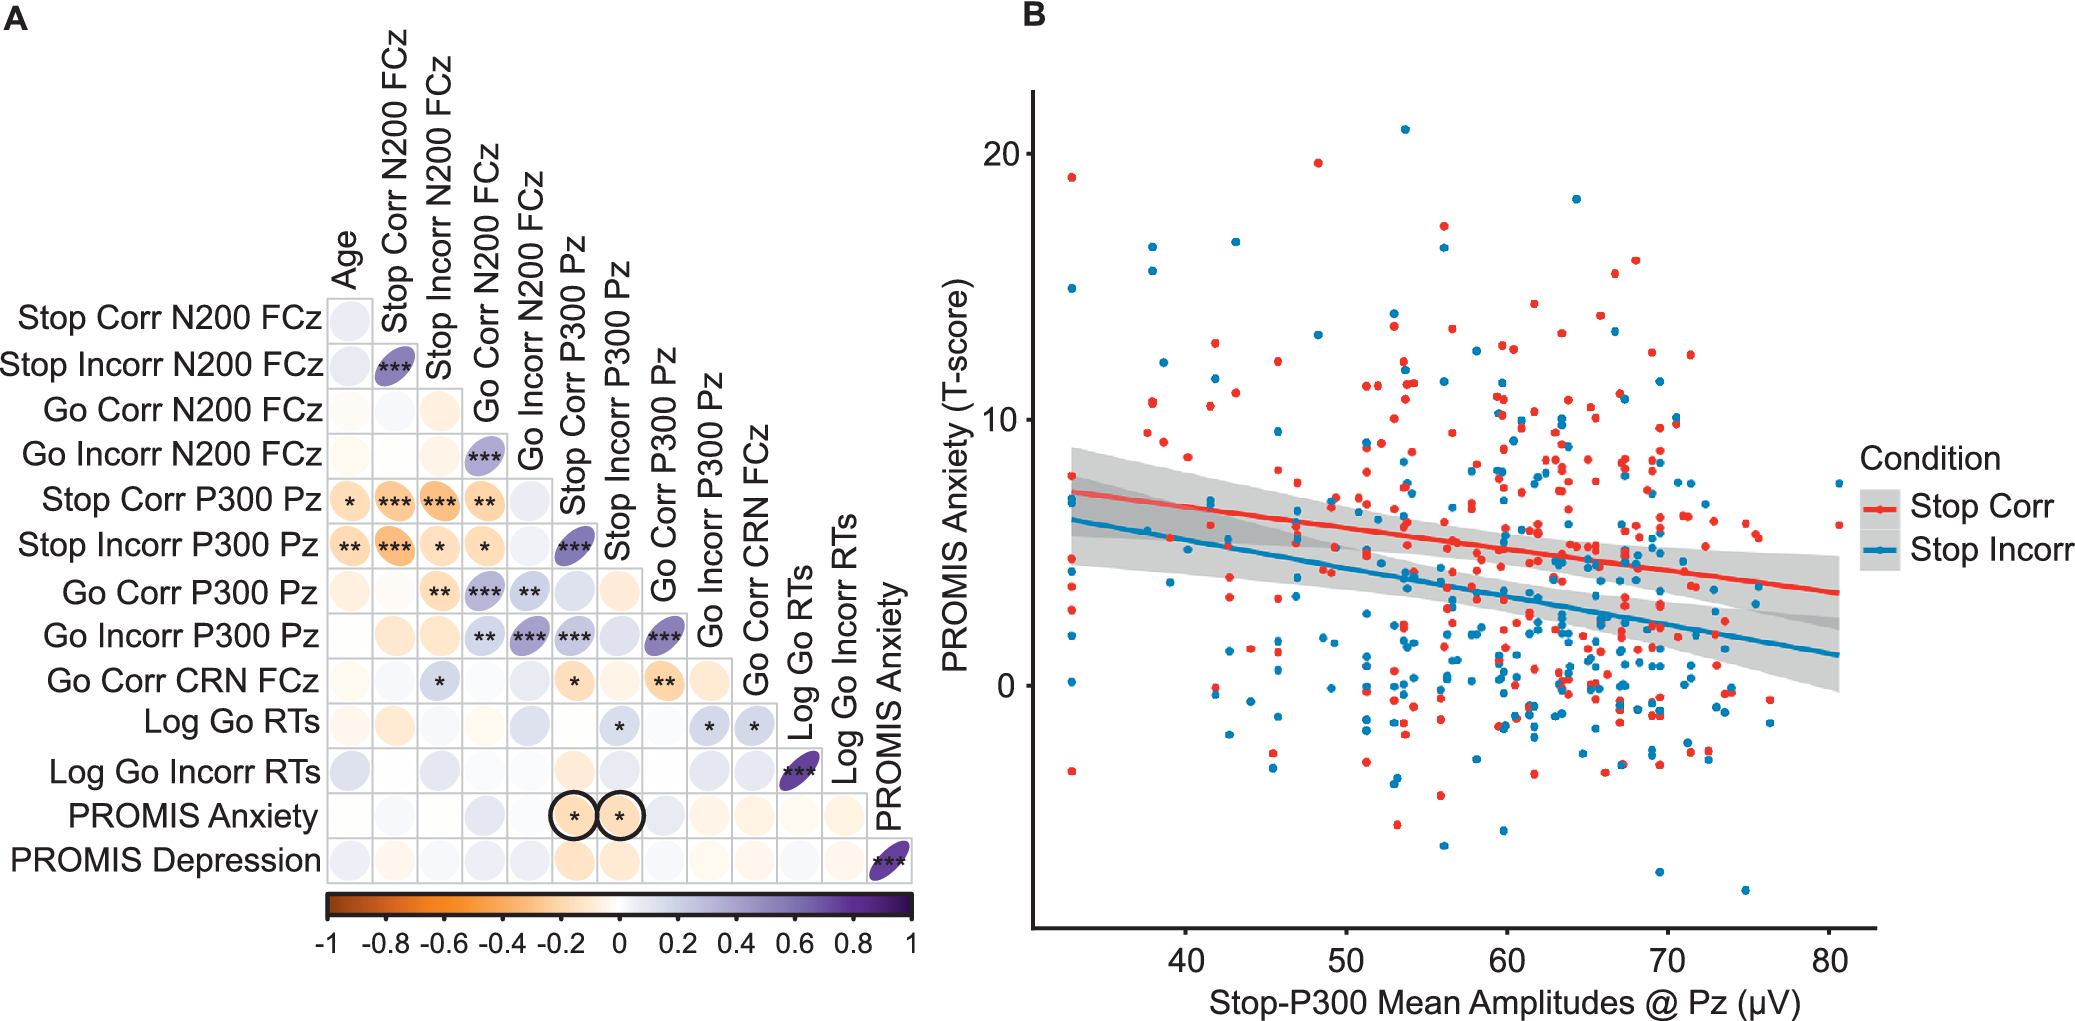
Spearman correlation coefficients between ERP amplitudes, PROMIS measures, and log-transformed reaction times are presented in Figure 2.
Bivariate correlations. Note: (a) Spearman correlation for all participants. (b) Scatterplot of the association between stop-correct P300 amplitudes at Pz and PROMIS Anxiety T-scores in all participants and between stop-incorrect P300 amplitudes at Pz and PROMIS Anxiety T-scores in all participants. Abbreviations: Corr, ‘Correct stop trials’; Incorr, ‘Incorrect stop trials’; FCz, ‘frontocentral electrode site’; Pz, ‘parietal electrode site’; log, ‘logarithm base 10 transformation’, RTs, ‘reaction times (ms)’; PROMIS, ‘patient-reported measurement information system’. *p < 0.05, **p < 0.01, ***p < 0.001.

Figure 2. Long description
Panel A is a triangular Spearman correlation matrix. The vertical y-axis and horizontal x-axis list variables including Age, Stop Corr N 2 0 0 F C z, Stop Incorr N 2 0 0 F C z, Go Corr N 2 0 0 F C z, Go Incorr N 2 0 0 F C z, Stop Corr P 3 0 0 P z, Stop Incorr P 3 0 0 P z, Go Corr P 3 0 0 P z, Go Incorr P 3 0 0 P z, Go Corr C R N F C z, Log Go R T s, Log Go Incorr R T s, P R O M I S Anxiety, and P R O M I S Depression. A color scale at the bottom ranges from orange (negative 1) to white (0) to purple (positive 1). Significant correlations are marked with asterisks. Notable negative correlations (orange) appear between Age and P 3 0 0 amplitudes. Positive correlations (purple) are seen between various N 2 0 0 and P 3 0 0 measures. Two cells relating P R O M I S Anxiety to Stop Corr P 3 0 0 P z and Stop Incorr P 3 0 0 P z are highlighted with black circles.
Panel B is a scatterplot. The x-axis represents Stop-P 3 0 0 Mean Amplitudes at P z in microvolts, ranging from 40 to 80. The y-axis represents P R O M I S Anxiety T-scores, ranging from 0 to 20. Two data series are plotted: Stop Corr (red dots) and Stop Incorr (blue dots). Both series show a slight negative linear trend, indicated by a red regression line for Stop Corr and a blue regression line for Stop Incorr, both with gray shaded 95 percent confidence intervals. The blue line for Stop Incorr has a slightly steeper negative slope than the red line.
N200
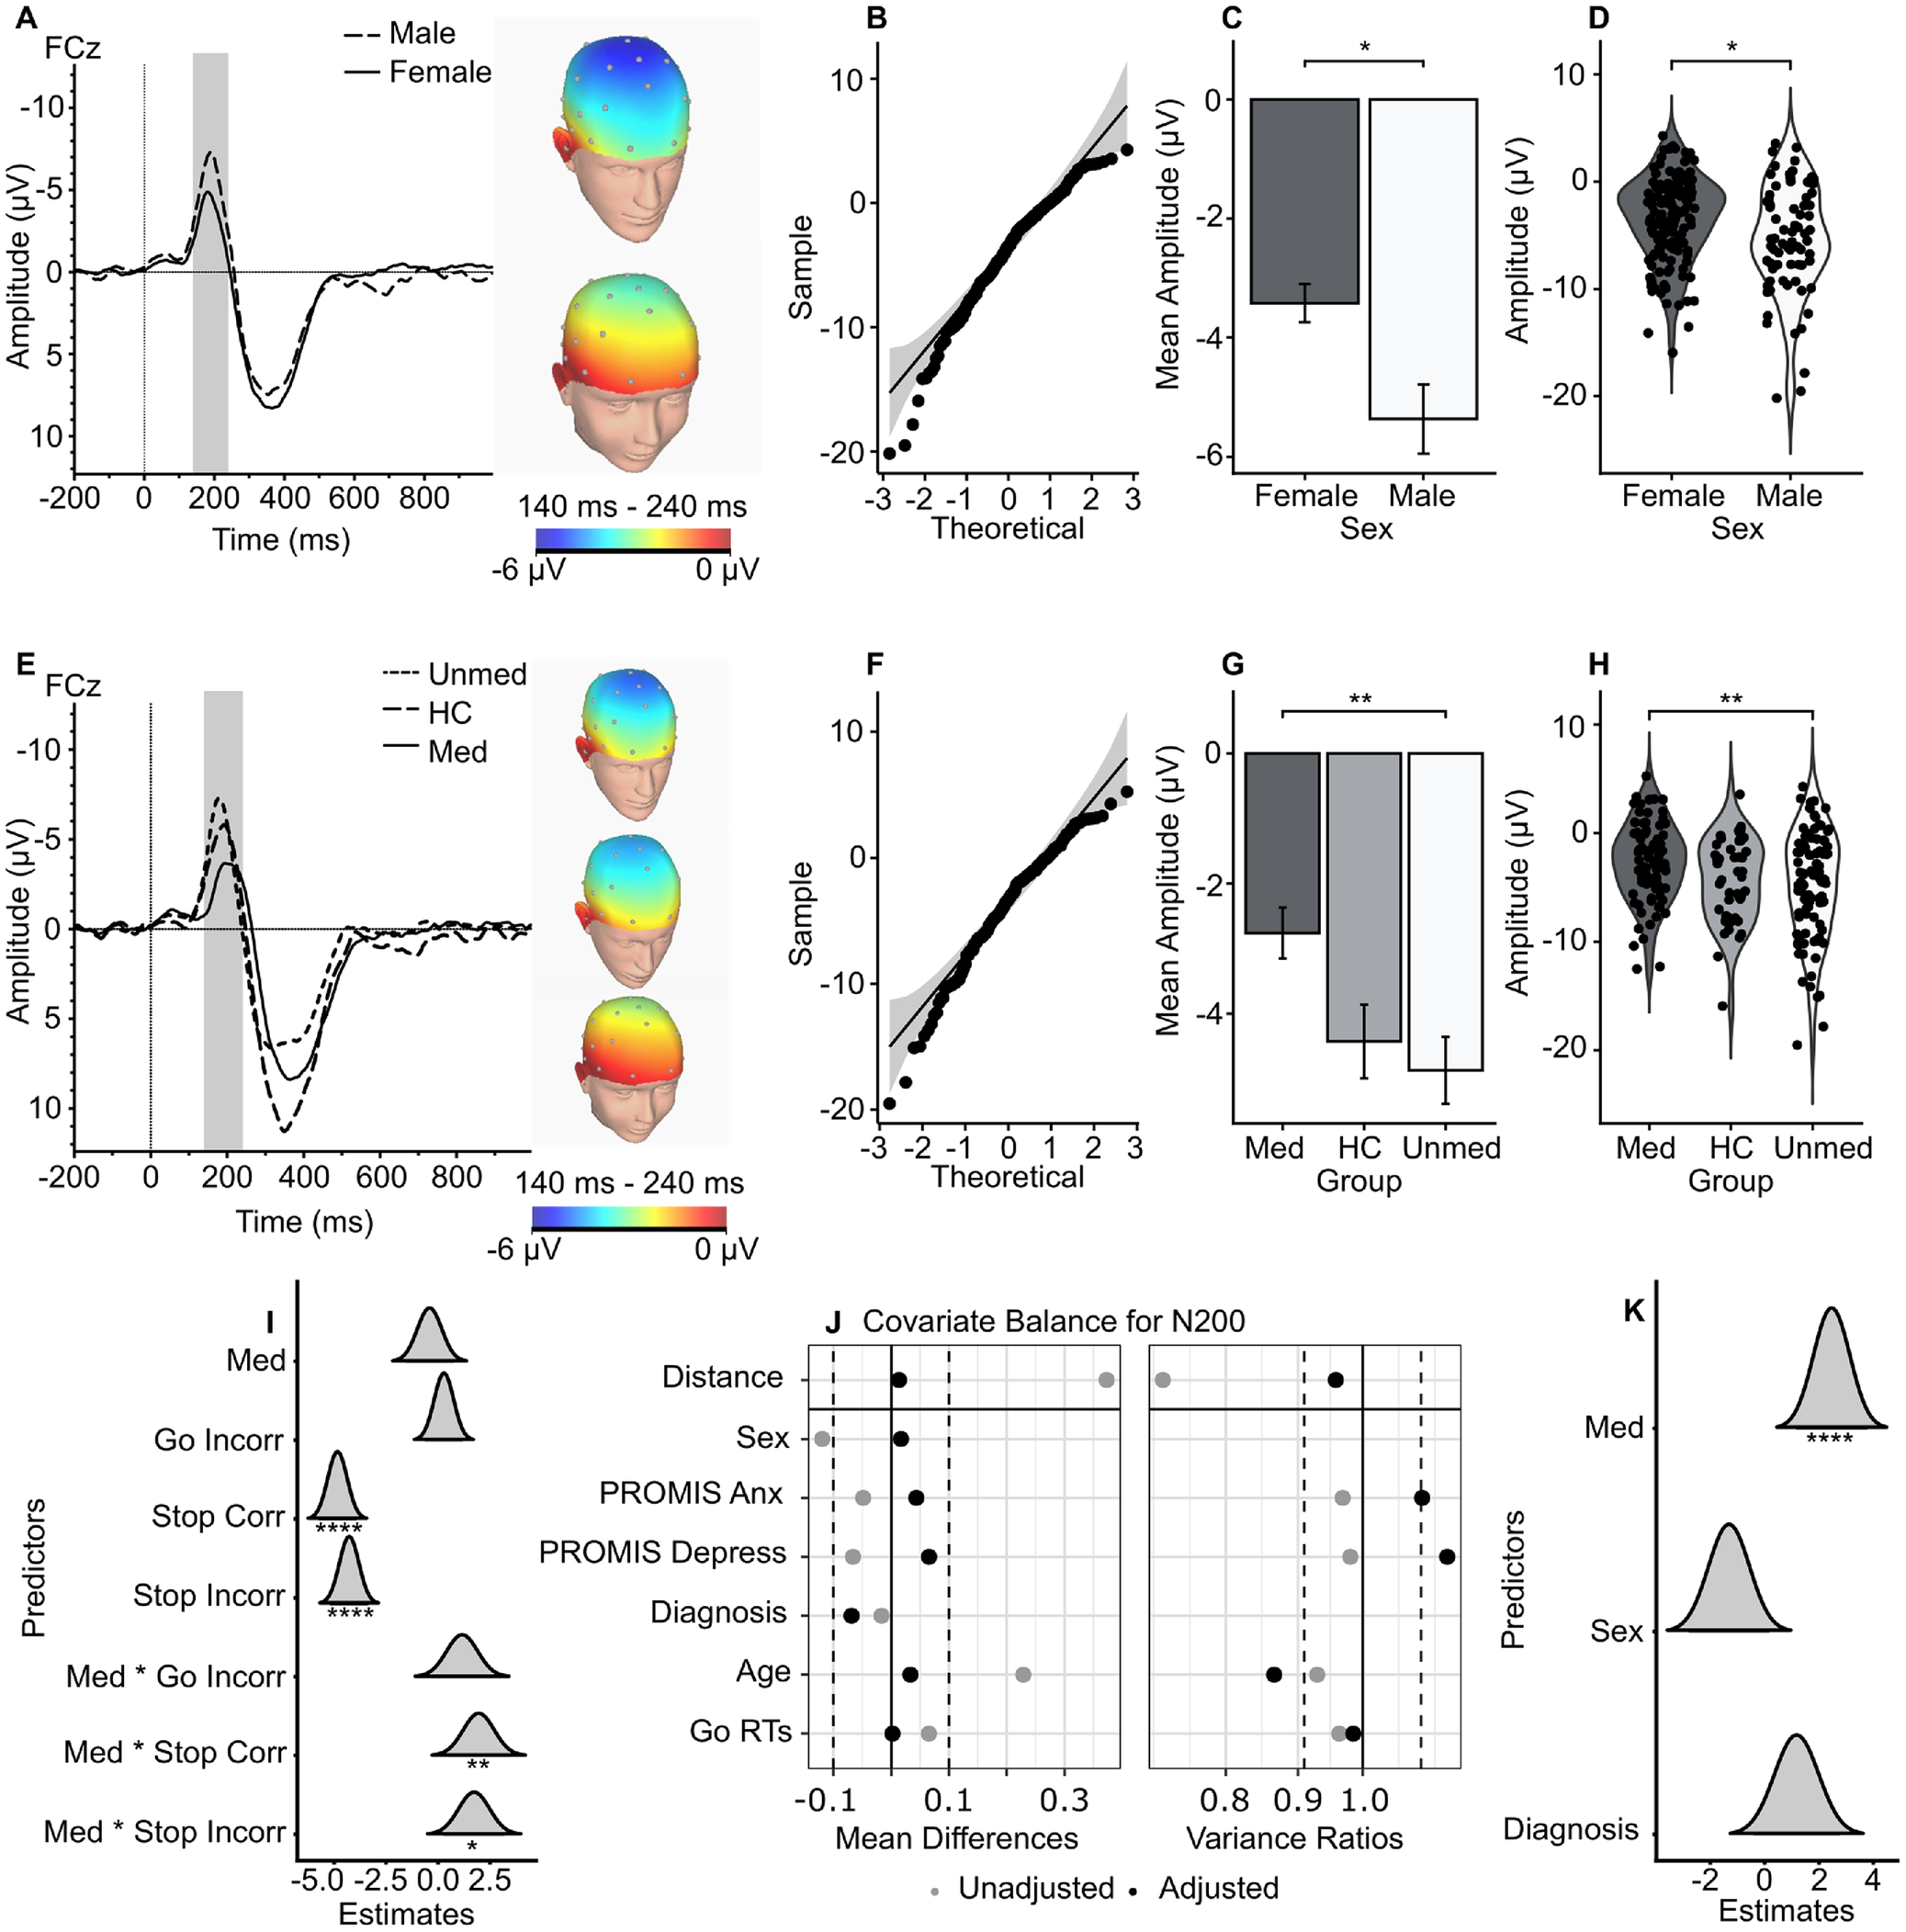
The LME for N200 amplitudes revealed main effects of Condition: correct stop trials, B = −4.845 [−5.75, −3.91], t = −10.34, p < 0.0011, and incorrect stop trials, B = −4.27 [−5.19, −3.34], t = −9.11, p < 0.001, had more negative N200 amplitudes than their go trial counterparts (Figure 3i). A significant interaction effect emerged between Condition * Medication status, such that N200 amplitudes were significantly predicted by a participants’ medication status only in their correct stop, B = 1.95 [0.50, 3.42], t = 2.618, p < 0.01 and incorrect stop trials, B = 1.73 [0.23, 3.23], t = 2.319, p = 0.02, not their go trials (Figure 3i). The two between-subject, type III ANOVAs for N200 amplitudes also revealed a main effect of Sex, F(1, 218) = 6.12, p = 0.04, η 2 = 0.027, in the ANOVA, including HC participants (Figure 3a–d) and a main effect of Medication status, F(1,170) = 7.88, p = 0.04, η 2 = 0.044, in the ANOVA excluding HC participants and considering Medication status (Figure 3e–h). Follow-up emmeans post-hoc tests revealed females (M = −3.67, SE = 0.41) had less negative N200 amplitudes than males (M = −5.29, SE = 0.51), t = 2.474, p = 0.01, and participants with MDD and taking serotonergic medications (M = −2.98, SE = 0.60) had less negative N200 amplitudes than participants with MDD and not taking these medications (M = −5.17, SE = 0.49), t = 2.81, p = 0.006. After adequate balance of covariates, there was a significant estimated ATE of serotonergic antidepressants on N200 amplitudes, B = 2.47 [1.13, 3.79], t = 3.66, p < 0.001 (Figure 3j–k).
Grand average waveforms of the N200. Note: (a) Grand average waveform of the correct stop-N200 at FCz, grouped by biological sex. (b) QQ plot of correct stop-N200 mean amplitudes at FCz. (c) Bar graph of correct stop-N200 mean amplitudes at FCz, grouped by biological sex. (d) Violin plot of correct stop-N200 mean amplitudes at FCz, grouped by biological sex. (e) Grand average waveform of the correct stop-N200 at FCz, grouped by treatment and HCs. (f) QQ plot of correct stop-N200 mean amplitudes at FCz. (g) Bar graph of correct stop-N200 mean amplitudes at FCz grouped by treatment and HCs. (h) Violin plot of correct stop-N200 mean amplitudes at FCz grouped by treatment and HCs. (i) Dot-and-whisker plot for predictors of the LME for the N200. (j) Love plot for the covariate balance of the full optimal propensity matching for the N200. (k) Dot-and-whisker plot for predictors of the weighted regression for the N200, after adequate balance from the full optimal propensity matching. Abbreviations: HC, ‘healthy controls’; MDD, ‘major depressive disorder’; FCz, ‘frontocentral electrode site’; Med, ‘MDD/COM participants who are medicated with serotonergic antidepressants’; Unmed, ‘MDD/COM participants not medicated with serotonergic antidepressants’; Corr, ‘correct go or stop trials’; Incorr, ‘incorrect go or stop trials’. *p < 0.05, **p < 0.01, ***p < 0.001.

Figure 3. Long description
The figure consists of 11 panels labeled A through K.
Row 1: Biological Sex Comparison
* Panel A: Line graph of amplitude in microvolts over time in milliseconds at F C z. Male (dashed) and Female (solid) lines show a negative peak around 200 milliseconds. Two topographic head maps show voltage distribution from 140 to 240 milliseconds.
* Panel B: Q Q plot showing sample versus theoretical quantiles for N 2 0 0 amplitudes.
* Panel C: Bar graph of mean amplitude. Males show a significantly more negative amplitude than females, marked with an asterisk.
* Panel D: Violin plot showing the distribution of individual data points for N 2 0 0 amplitude by sex.
Row 2: Treatment and Healthy Control (H C) Comparison
* Panel E: Line graph at F C z comparing Unmedicated (short dash), H C (long dash), and Medicated (solid) groups. Three topographic maps correspond to each group.
* Panel F: Q Q plot for N 2 0 0 mean amplitudes.
* Panel G: Bar graph showing mean amplitudes. Medicated participants have the least negative amplitude, while Unmedicated have the most negative. Significant differences are marked with double asterisks.
* Panel H: Violin plot showing data distribution across the three groups.
Row 3: Statistical Models
* Panel I: Dot-and-whisker plot for L M E predictors. Significant predictors include Stop Corr and Stop Incorr (negative estimates) and Med asterisk Stop Corr and Med asterisk Stop Incorr (positive estimates).
* Panel J: Love plot showing covariate balance for N 2 0 0. It compares unadjusted (grey) and adjusted (black) mean differences and variance ratios for variables like Distance, Sex, P R O M I S Anx, P R O M I S Depress, Diagnosis, Age, and Go R Ts.
* Panel K: Dot-and-whisker plot for weighted regression predictors. Medicated status shows a significant positive estimate, while Sex and Diagnosis show distributions centered near zero.
P300
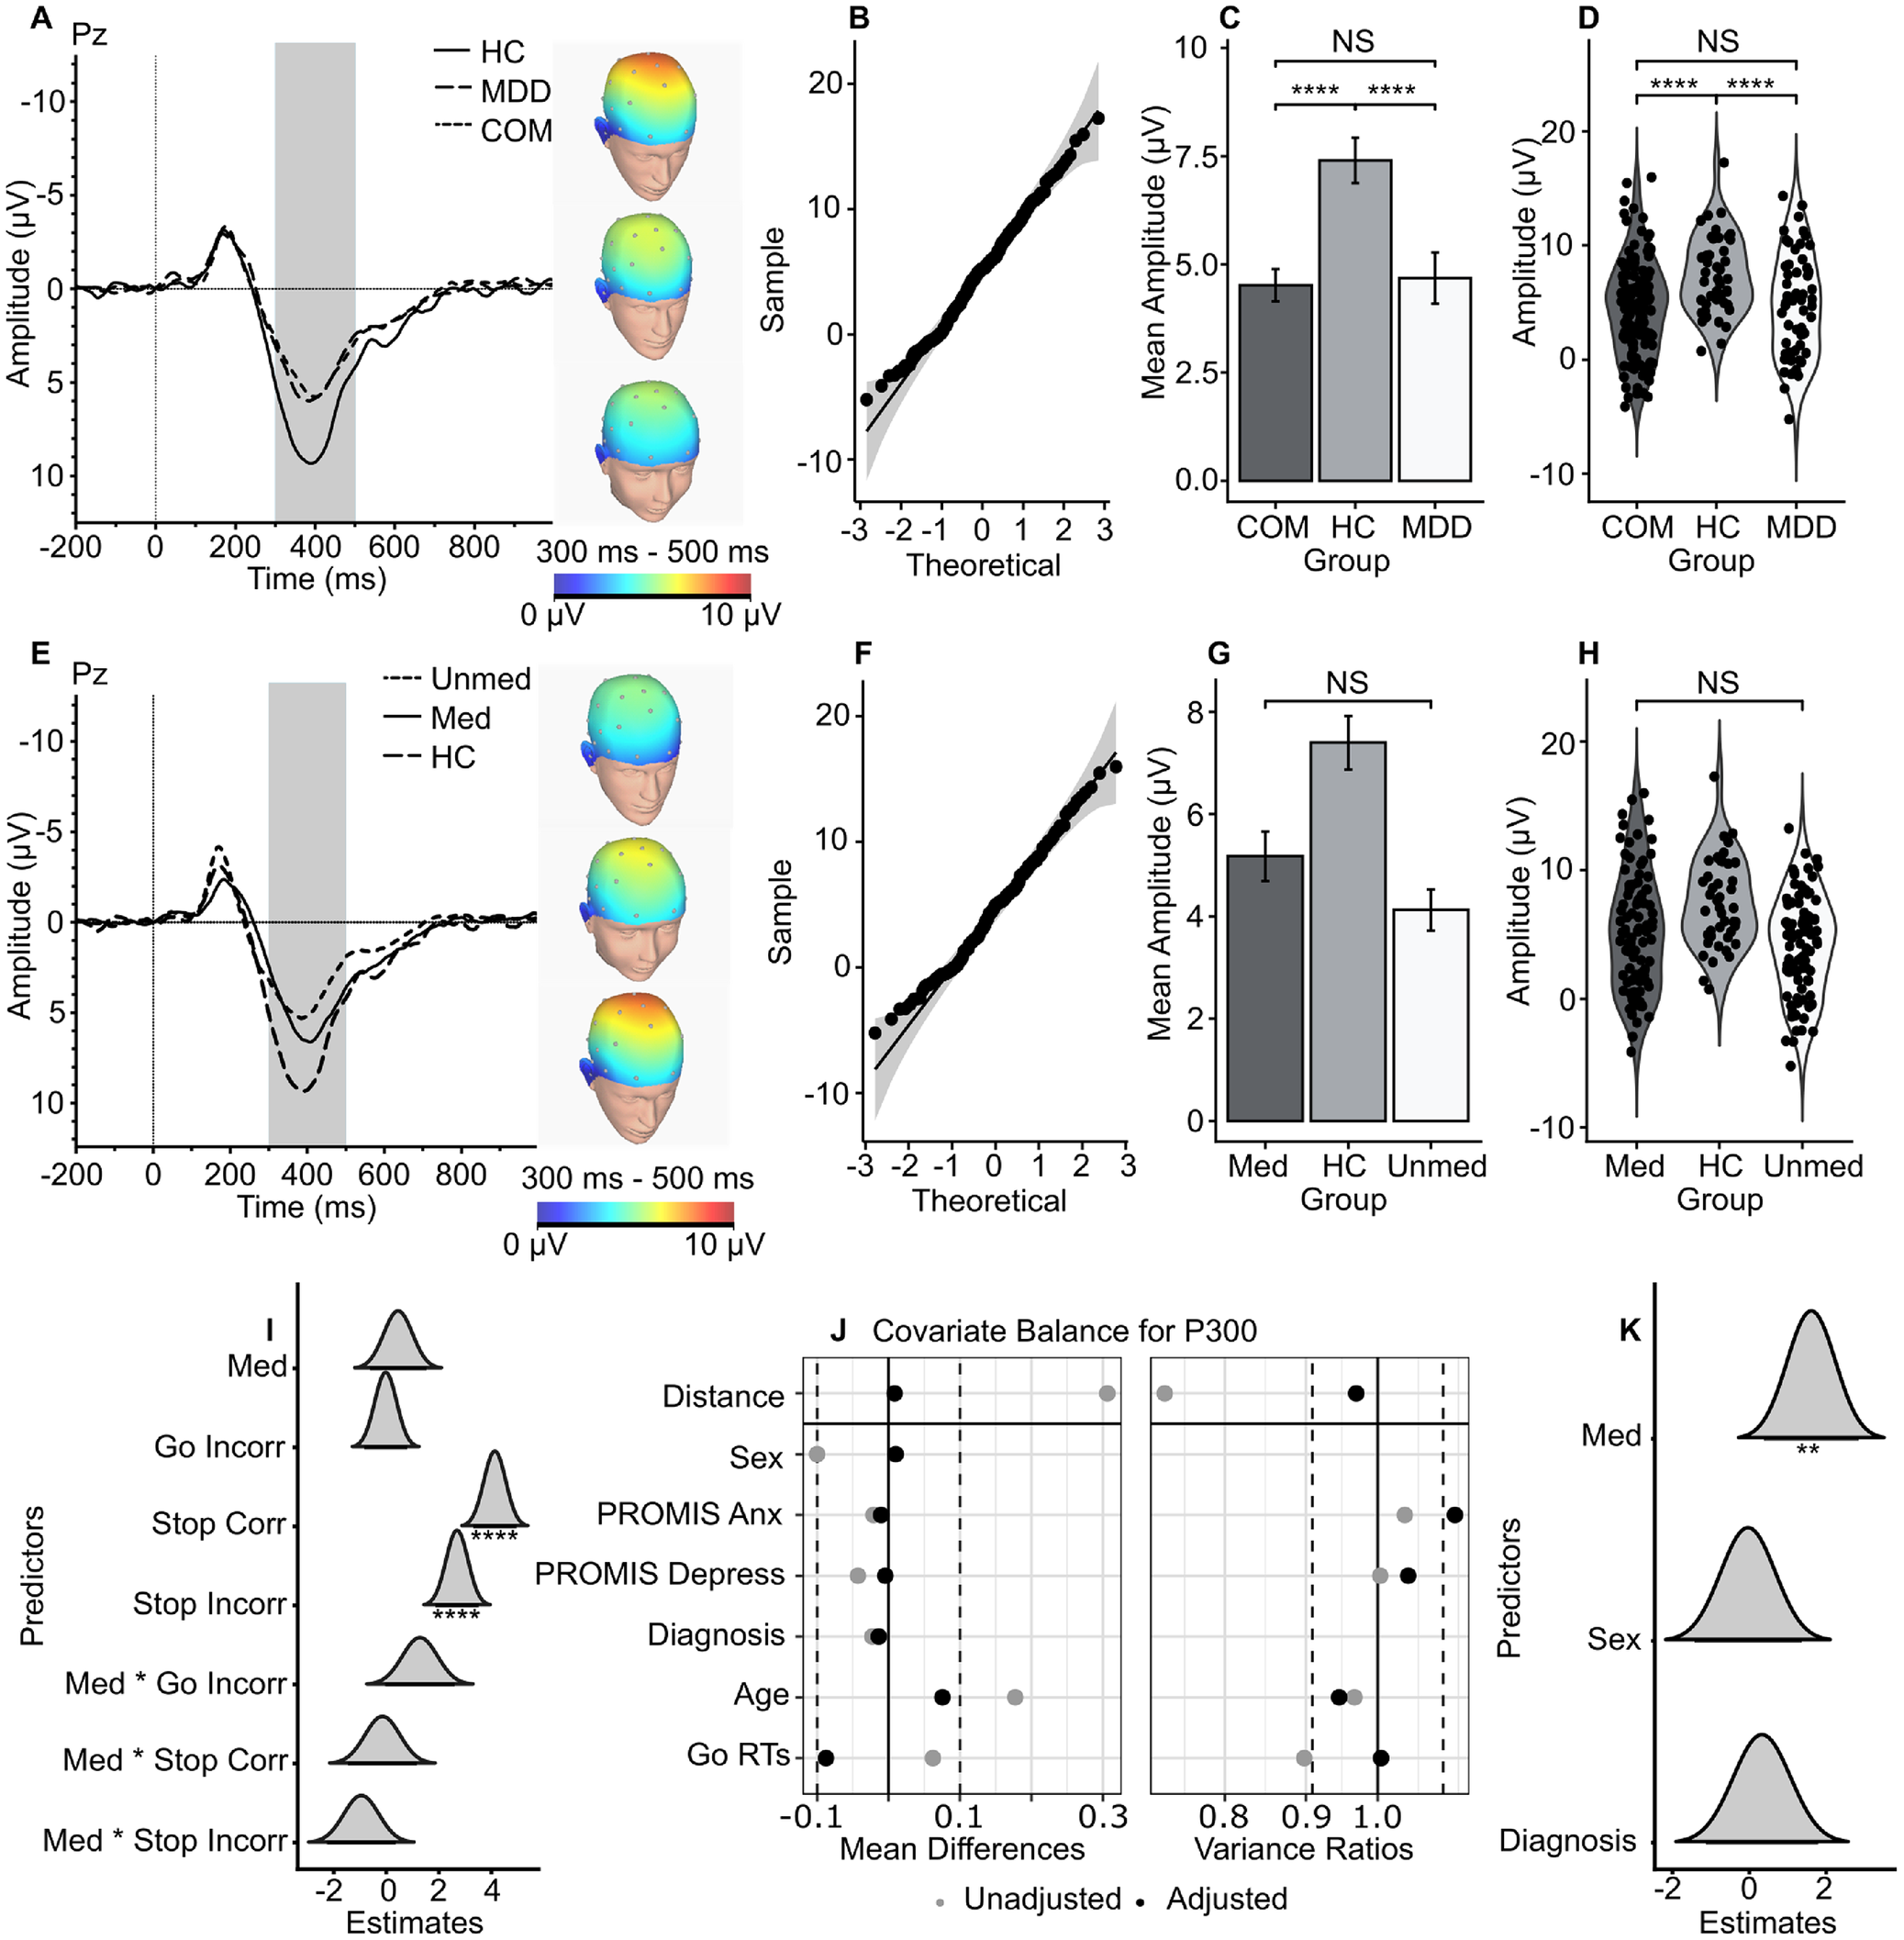
The LME for P300 amplitudes revealed main effects of Condition and age. Correct stop, B = 4.13 [3.30, 4.95], t = 9.87, p < 0.001, and incorrect stop trials, B = 2.69 [1.88, 3.51], t = 6.42, p < 0.001, had more positive P300 amplitudes (Figure 4i), and older participants had less positive P300 amplitudes, B = −0.04 [−0.07, −0.01], t = −2.62, p = 0.006. The two between-subject, type III ANOVAs for P300 amplitudes also revealed a main effect of Diagnosis, F(2, 222) = 8.16, p < 0.001, η 2 = 0.068, in the ANOVA including HC participants (Figure 4a–d) but no main effects or interactions in the ANOVA excluding HC participants and considering Medication status (Figure 4e–h). An emmeans post-hoc test revealed that HC participants (M = 7.37, SE = 0.63) had more positive P300 amplitudes than participants with COM (M = 4.41, SE = 0.41), t = 3.921, p < 0.001, and MDD (M = 4.63, SE = 0.58), t = 3.184, p < 0.01. After adequate balance of covariates, there was a significant estimated ATE of serotonergic antidepressants on P300 amplitudes, B = 1.61 [0.37, 2.85], t = 2.44, p = 0.01 (Figure 4j–k).
Grand average waveforms of the P300. Note: (a) Grand average waveform of the correct stop-P300 at Pz, grouped by diagnosis. (b) QQ plot of correct stop-P300 mean amplitudes at Pz. (c) Bar graph of correct stop-P300 mean amplitudes at Pz, grouped by diagnosis. (d) Violin plot of correct stop-P300 mean amplitudes at Pz, grouped by diagnosis. (e) Grand average waveform of the correct stop-P300 at Pz, grouped by treatment and HCs. (f) QQ plot of correct stop-P300 mean amplitudes at Pz. (g) Bar graph of correct stop-P300 mean amplitudes at Pz grouped by treatment and HCs. (h) Violin plot of correct stop-P300 mean amplitudes at Pz grouped by treatment and HCs. (i) Dot-and-whisker plot for predictors of the LME for the P300. (j) Love plot for the covariate balance of the full optimal propensity matching for the P300. (k) Dot-and-whisker plot for predictors of the weighted regression for the P300, after adequate balance from the full optimal propensity matching. Abbreviations: HC, ‘healthy controls’; MDD, ‘major depressive disorder’; COM; ‘major depressive disorder with comorbid anxiety’, Pz, ‘parietal electrode site’; Med, ‘MDD/COM participants who are medicated with serotonergic antidepressants’; Unmed, ‘MDD/COM participants not medicated with serotonergic antidepressants’; Corr, ‘correct go or stop trials’; Incorr, ‘incorrect go or stop trial’. *p < 0.05, **p < 0.01, ***p < 0.001.

Figure 4. Long description
The figure consists of eleven panels labeled A through K.
Panel A: Line graph of grand average waveforms at P z. X-axis is Time in milliseconds from minus 200 to 1000. Y-axis is Amplitude in microvolts from minus 10 to 10. Three lines represent H C (solid), M D D (dashed), and C O M (dotted). A shaded region from 300 to 500 milliseconds highlights the P 300 peak, where H C shows the highest positive amplitude. Three topographic head maps to the right show voltage distribution.
Panel B: Q Q plot showing a linear relationship between theoretical and sample quantiles for P 300 amplitudes.
Panel C: Bar graph of mean amplitudes. H C is significantly higher (approximately 7.5 microvolts) than C O M and M D D (both approximately 4.5 microvolts), indicated by four asterisks.
Panel D: Violin plot showing the distribution of individual data points for C O M, H C, and M D D, mirroring the trends in Panel C.
Panel E: Similar to Panel A, but grouped by treatment: Med (solid), Unmed (dotted), and H C (dashed). H C remains the highest peak.
Panel F: Q Q plot for the treatment-grouped data showing a linear trend.
Panel G: Bar graph showing H C has the highest mean amplitude, followed by Med and then Unmed.
Panel H: Violin plot for treatment groups showing wider distribution in the Med group compared to Unmed.
Panel I: Dot-and-whisker plot for L M E predictors. Stop Corr and Stop Incorr show significant positive estimates (four asterisks).
Panel J: Love plot for covariate balance. Two panels show Mean Differences and Variance Ratios for variables like Distance, Sex, P R O M I S Anx, P R O M I S Depress, Diagnosis, Age, and Go R Ts. Adjusted dots (black) are closer to the center line than unadjusted dots (grey).
Panel K: Dot-and-whisker plot for weighted regression. Med shows a significant positive estimate (two asterisks), while Sex and Diagnosis are centered near zero.
CRN
The LME for CRN amplitudes revealed no significant main or interaction effects (Supplementary Figure S1X–X). The two between-subject, type III ANOVAs for CRN amplitudes did not reveal main or interaction effects (Supplementary Figure S1X–X). After adequate balance of covariates, there was no significant ATE of serotonergic antidepressants on CRN amplitudes (Supplementary Figure S1A–C).
The full statistical output for the LME, ANOVA, and optimal full propensity matching models is reported in the Supplementary Materials.
Discussion
The main findings of our study were our observations of significant differences between HCs and MDD/COM participants in their stop-P300 amplitudes, between females and males in their stop-N200 amplitudes, and between participants treated with serotonergic antidepressants and participants not treated with serotonergic antidepressants in their stop-N200 amplitudes. These findings lend partial support to our three hypotheses: (H1) MDD participants had more attenuated (smaller) stop-P300 amplitudes than HC participants; (H2) female participants had smaller stop-N200 amplitudes than male participants; and (H3) MDD/COM participants treated with serotonergic antidepressants had smaller stop-N200 amplitudes than MDD/COM participants not treated with serotonergic antidepressants using LME, ANOVA, and propensity matching techniques. Notably, other findings do not support our hypotheses: (H1) MDD participants did not have more attenuated stop-P300 amplitudes than COM participants, and (H3) MDD/COM participants treated with serotonergic antidepressants had no different stop-P300 amplitudes or CRN amplitudes using LME or ANOVA techniques. Interestingly, serotonergic antidepressants had a significant ATE on stop-P300 amplitudes after optimal full matching and performing a weighted regression.
The differentiation between HC and MDD/COM in the P300 (Figure 4a–d) is consistent with previous work on inhibitory control in MDD such that anxiety/depression symptoms impair efficient functioning of attentional and inhibitory control systems (Eysenck & Derakshan, Reference Eysenck and Derakshan2011). In our study, differential symptoms between MDD and COM were not driven by inhibitory control. Our results indicated stop-P300 amplitudes were correlated with PROMIS Anxiety T-scores but not PROMIS Depression T-scores (Figure 2b), and the LME for P300 amplitudes did not reveal a significant effect of any of the PROMIS measures (Figure 4i). This is consistent with a study finding that updating and shifting, but not inhibition, was impacted by COM (Lyche et al., Reference Lyche, Jonassen, Stiles, Ulleberg and Landrø2010), and another study finding there were no differences in ERP indices during a Go/No-Go between melancholic and nonmelancholic depressed patients (Quinn et al., Reference Quinn, Harris and Kemp2012). Past work in psychophysiology has found associations between comorbidities and other task-related P300 amplitudes or inhibitory control paradigms: a previous study found oddball-P300 amplitudes to be related to PHQ-9 scores but not GAD-7 scores (X. Zhou et al., Reference Zhou, Lin, Yang, Xiang, Zhou and Zou2023), yet another study demonstrated greater activation in the cognitive control network of MDD + Anx participants than MDD and HC during a Parametric Go/No-go (Crane et al., Reference Crane, Jenkins, Dion, Meyers, Weldon, Gabriel, Walker, Hsu, Noll, Klumpp, Phan, Zubieta and Langenecker2016). These inconsistent results may be explained by nuance in task design, variation in construct validity in self-report measures, and methodology differences. While nascent work on psychophysiological distinctions between MDD and COM in inhibitory control and other domains has focused on symptoms more generally (Judah et al., Reference Judah, Hamrick, Swanson, Middlebrooks and Shields2025; Moser et al., Reference Moser, Moran, Schroder, Donnellan and Yeung2013; Swanson, Judah, & Shields, Reference Swanson, Judah and Shields2025), well-established work on these distinctions has focused on specific cognitive features of these disorders (Judah et al., Reference Judah, Hamrick, Middlebrooks, Swanson, Abid and Vaught2026). Accounting for specific cognitive features and general symptoms could provide increased resolution into how inhibitory control is impacted differently between MDD and COM.
Sex differences in our study indicated female participants had smaller stop-N200 amplitudes than male participants (Figure 3a–3d). This is consistent with previous work demonstrating that female participants have smaller incongruent-N200 amplitudes in a flanker task (Clayson et al., Reference Clayson, Clawson and Larson2011) and smaller NoGo-N200 amplitudes in a Go/No-Go task (Knežević, Reference Knežević2018) than males, but another study demonstrated that females had larger NoGo-N200 amplitudes in a Go/No-Go task than males (Ramos-Loyo et al., Reference Ramos-Loyo, Angulo-Chavira, Llamas-Alonso and González-Garrido2016). Our other results from the LME and weighted regression for N200 amplitudes did not reveal a main effect of sex, suggesting the effect of sex on the N200 may be more complex (Figure 3i–k). A systematic review of sex differences in ERP correlates of inhibitory control (Gaillard et al., Reference Gaillard, Fehring and Rossell2021) reported mixed results, such that there were no between-subject sex differences between male and female participants when studies accounted for female participants’ menstrual cycles in the experimental design. Recent work in healthy controls has provided evidence that fluctuations in hair testosterone in males (Shields, Ivory, & Telzer, Reference Shields, Ivory and Telzer2019) and serum concentrations of estradiol and progesterone in females across their menstrual cycle impact striatal dopamine turnover rates, reaction times, and ERP amplitudes and latencies during a Go/Nogo task (Colzato, Hertsig, Van Den Wildenberg, & Hommel, Reference Colzato, Hertsig, Van Den Wildenberg and Hommel2010). Considering research in molecular neuroscience and psychopharmacological studies suggesting sex steroids play a role in modulating neurotransmitter metabolism and physiology (Bendis et al., Reference Bendis, Zimmerman, Onisiforou, Zanos and Georgiou2024; Rybaczyk et al., Reference Rybaczyk, Bashaw, Pathak, Moody, Gilders and Holzschu2005; Thase, Entsuah, Cantillon, & Kornstein, Reference Thase, Entsuah, Cantillon and Kornstein2005), the observed stop-N200 sex differences could be driven by this milieu of interactions between sex steroids, psychopathology, and antidepressants. Measuring sex steroids alongside neural indices of inhibitory control, as seen in error monitoring literature (Jansen et al., Reference Jansen, Van Der Does, De Rover, De Bruijn and Hamstra2023; Louis et al., Reference Louis, Kneip, Moran, Beltz, Klump and Moser2022; Moser et al., Reference Moser, Munia, Louis, Anderson and Aviyente2024, Reference Moser, Anderson, Davis, Hayden, Sayers, Gloe and Louis2026; Mulligan et al., Reference Mulligan, Hajcak, Klawohn, Nelson and Meyer2019; Russman Block et al., Reference Russman Block, Klump, Beltz, Burt and Moser2024), could specify distinct patterns of cognitive deficits due to mood and anxiety disorders within males, females, and intersex individuals.
MDD/COM participants treated with serotonergic antidepressants had less negative stop-N200 amplitudes than MDD/COM participants not treated with these medications (Figure 3e–h), and serotonergic antidepressants had an ATE on stop-N200 amplitudes of 2.456 μV (Figure 3j–k). Past work synthesizing the psychophysiological correlates of inhibitory control, pharmacogenetics of serotonin, and psychopharmacological studies of SSRIs in HCs implicates serotonin’s involvement in response inhibition, especially the N200 (Fallgatter et al., Reference Fallgatter, Jatzke, Bartsch, Hamelbeck and Lesch1999; Fischer et al., Reference Fischer, Endrass, Goebel, Reuter, Montag, Kubisch and Ullsperger2015a; Fischer & Jocham, Reference Fischer and Jocham2020; Hughes et al., Reference Hughes, Rittman, Regenthal, Robbins and Rowe2015). While the stop-N200 is not often implicated in previous work defining inhibitory control in MDD, previous studies have handled differently how they control for medication in their recruitment strategies and statistical analysis, potentially leading to unstable conclusions regarding the N200 and depression. The finding of blunted inhibitory-related P300 amplitudes in MDD is consistent throughout the literature. However, MDD/COM participants treated with serotonergic antidepressants did not have different stop-P300 amplitudes than MDD/COM participants not treated with these medications (Figure 4e–h), but serotonergic antidepressants had an ATE on stop-P300 amplitudes of 1.611 μV (Figure 4i–k). Age-related reduction and sex differences are known to impact both the N200 and P300 (Cheng, Tsai, & Cheng, Reference Cheng, Tsai and Cheng2019), but the P300 might be more sensitive to anxiety/depression symptoms, which is addressed appropriately in optimal full matching. It does not escape the authors’ minds that this result might be a phenotype of treatment-resistant depression (TRD), considering the differences in the N200 and similarities in symptoms of depression and P300 amplitudes between the MDD participants who are taking these medications and those who are not. Despite the limitations of our findings and the promise of EEG/ERP’s integration into clinical neuroscience and precision psychopharmacology (White et al., Reference White, Nacke, Akeman, Cannon, Mayeli, Touthang, Zoubi, McDermott, Kirlic, Santiago, Kuplicki, Bodurka, Paulus, Craske, Wolitzky-Taylor, Abelson, Martell, Clausen, Stewart and Aupperle2021; L. Zhou et al., Reference Zhou, Wang and Wang2018), researchers should begin to question the utility of serotonergic antidepressants in addressing deficits in inhibitory control and other neurocognitive domains in tandem with changes in symptoms to differentiate therapeutic and treatment-resistant effects.
Limitations and future directions
Our study has several limitations. First, this is a secondary data analysis of cross-sectional data. Although our statistical analysis includes LMEs, between-subject ANOVAs, and optimal full matching, it is important to approach our finding of stop-N200 and stop-P300 amplitudes being related to treatment with serotonergic antidepressants with skepticism until longitudinal data are produced testing this premise. An unmeasured characteristic of participants treated with serotonergic antidepressants might be driving these effects. Second, these data were gathered using a simultaneous EEG/MRI procedure and preprocessing pipeline. The high-frequency noise of the magnetic field limits available trial number per trial type for each participant, in turn, decreasing our statistical power. These results need to be replicated in a solely EEG data collection context to maximize the number of trials per trial type. Third, we categorized participants by sex assigned at birth and medication treatment and used these as categorical variables when continuous variables related to these constructs – sex steroids, dose of medication, and their known interactions – or more even groups per categorical variable would sharpen the resolution of main and interaction effects. Fourth, we employed an SST to measure inhibitory control. Utilizing various tasks of inhibitory control simultaneously would enable nuanced indexing of cognitive control and how they are impacted by serotonergic antidepressants. Finally, we collapsed serotonergic antidepressants (SSRIs and SNRIs) together when each demonstrates a unique pharmacological mode of action and could alter inhibitory control and depression and anxiety symptoms differently.
Future studies should aim to question causality of serotonergic antidepressants on the stop-N200 and stop-P300 amplitudes by using a longitudinal, randomized control trial design; focus on the psychophysiological correlates of inhibitory control within a solely EEG data collection context; quantify the serum/saliva concentrations of estradiol, progesterone, and testosterone of all participants or track menstrual cycle of females assigned at birth participants; genotype the SERT gene of research participants; record dose-dependency in within-subject and between-subject levels; employ various cognitive tasks that measure inhibitory-related processes to distinguish task-specific effects from general inhibitory control mechanisms; isolate antidepressant class-specific effects on inhibitory control; and collect larger samples to increase statistical power, accounting for this complex multivariate space impacting cognitive control. Implementing various laboratory and cognitive science techniques and methodologies to characterize participants’ neurocognitive, pharmacogenetic, and hormonal/menstrual features could clarify the nuanced dynamics of how serotonergic antidepressants (and other treatments) modulate the psychophysiology of inhibitory control in MDD and question how certain doses, modes of action, and nonpharmacological treatments are distinctly helpful for some and not others.
Supplementary material
The supplementary material for this article can be found at http://doi.org/10.1017/S0033291726106394.
Acknowledgments
The authors would like to express our appreciation to all the research participants. The authors acknowledge the contributions of Tim Collins, Dara Crittenden, Amy Peterson, Megan Cole, Lisa Kinyon, Lindsey Bailey, Courtney Boone, Natosha Markham, Lisa Rillo, Angela Yakshin, and the Laureate Institute for Brain Research Assessment Team for diagnostic assessments and data collection. We also acknowledge Julie Arterbury, Leslie Walker, Amy Ginn, Bill Alden, Julie DiCarlo, and Greg Hammond for helping with EEG-MRI scanning. Finally, the authors acknowledge Jerzy Bodurka, PhD (1964–2021), for his intellectual and scientific contributions to the establishment of the EEG, structural and functional MRI that provided the foundation for the data collection, analysis, and interpretation of findings for the present work.
Author contribution
W.J.B.V.: Conceptualization (lead), data curation (lead), methodology (lead), formal analysis (lead), software (lead), writing – original draft (lead), writing – review and editing (supporting), visualization (lead). E.M.: Conceptualization (supporting), data curation (supporting). X.R.: Conceptualization (supporting), data curation (supporting), software (supporting), supervision (supporting), writing – review and editing (supporting). R.J.T.: Writing – review and editing (supporting), visualization (supporting). R.A.W.: Conceptualization (supporting), methodology (supporting), formal analysis (supporting), supervision (supporting). M.P.T.: Writing – original draft (supporting). R.L.A.: Validation (equal), investigation (equal), resources (equal), project administration (equal), funding acquisition (equal). S.G.: Validation (equal), investigation (equal), resources (equal), project administration (equal), funding acquisition (equal). J.L.S.: Validation (equal), investigation (equal), resources (equal), project administration (equal), funding acquisition (equal). M.P.P.: Validation (equal), investigation (equal), resources (equal), project administration (equal), funding acquisition (equal). E.J.W.: Conceptualization (supporting), methodology (supporting), formal analysis (supporting), writing – review and editing (lead), supervision (lead).
Funding statement
This study was funded by the William K. Warren Foundation. R.L.A reports financial support was provided by the National Institute of Mental Health (Grant No. R01MH123691), National Institute of General Medical Sciences Center (Grant No. P20GM121312), and National Institute on Alcohol Abuse and Alcoholism (Grant Nos. R34AA030688 and U01DA050989). S.G. reports financial support was provided by the National Institute for Mental Health (Grant Nos. R21MH138911 and R01MH137331). J.L.S. reports financial support was provided by the National Institute on Drug Abuse (Grant No. R01DA050677). M.P.P. reports financial support was provided by the National Institute of General Medical Science Center (Grant No. P20GM121312), National Institute on Alcohol Abuse and Alcoholism (Grant No. U01DA050989), and National Institute for Mental Health (Grant No. R01MH127225). E.J.W. reports financial support was provided by the National Institute for Mental Health Disparities (Grant No. R00MD015736) and National Institute on Drug Abuse (Grant No. DP1DA058986).
Competing interests
M.P.P. receives royalties for an article about methamphetamine published in UpToDate, advises Spring Care, Inc. – a behavioral health startup, and has a consulting agreement with and receives compensation from F. Hoffmann-La Roche Ltd. The other authors reported no biomedical financial interests or potential conflict of interest.
Ethical standards
The authors assert that all procedures contributing to this work comply with the ethical standards of the relevant national and institutional committees on human experimentation and with the Helsinki Declaration of 1975, as revised in 2008. This study was approved by the Western Institutional Review Board (#20101611).


 Open access

