




No CrossRef data available.
ON TESTS FOR DOUBLE DIFFERENCING: METHODS OF DEMEANING AND DETRENDING AND THE ROLE OF INITIAL VALUES
Published online by Cambridge University Press: 05 March 2004
Abstract
In this paper we investigate the impact that starting values have upon the double differencing tests of Hasza and Fuller (1979, Annals of Statistics 7, 1106–1120) and Sen and Dickey (1987, Journal of Business and Economic Statistics 5, 463–473), based on ordinary least squares (OLS) and simple symmetric least squares (SSLS) estimation, respectively. We demonstrate that, contrary to what is observed for conventional unit root tests, when based on data that have been demeaned, either directly or by the inclusion of a constant in the test regression, these tests are not exact similar to the starting values of the process, except where they are fixed and equal. We show that such test statistics can also fail to be asymptotically pivotal, contrary to claims made previously in the literature. We demonstrate that OLS tests based on data that have been detrended, either directly or by the inclusion of a constant and linear time trend in the test regression, do provide exact similar inference. In the context of the SSLS-based approach, we demonstrate that one obtains exact similar tests only where direct detrending is used. We highlight another error that appears in the literature, demonstrating that the two demeaned OLS-based test statistics do not coincide, even asymptotically, and that the same holds for the OLS- and SSLS-based test statistics for detrended data. We use Monte Carlo methods to quantify the finite-sample dependence of these tests on the starting values. These results suggest that the SSLS-based tests are considerably more sensitive to the nature of the starting values than are the OLS-based tests.We are grateful to Pentti Saikkonen and two anonymous referees for their helpful and constructive comments on an earlier version of this paper. We are especially grateful to one of the referees for the suggestion implemented in Remark 3.1 of the paper.
Information
- Type
- Research Article
- Information
- Copyright
- © 2004 Cambridge University Press
1. INTRODUCTION
It is well known in the standard unit root testing literature that if the data generating process (DGP) is a unit root, or I(1), process with an arbitrary starting value, the limiting distribution of the augmented Dickey and Fuller (1979, 1981) (ADF) unit root test is asymptotically, but not exact, similar with respect to the starting value, provided it is an Op(1) random variable (see, e.g., Phillips, 1987). Exact similarity with respect to the starting value is obtained by the inclusion of an intercept or an intercept and a linear time trend in the ADF regression (see, e.g., Hamilton, 1994, Sec. 17.4, pp. 486–504). In comparison, the properties of tests for double unit root, or I(2), processes remain underexplored in the time series literature. A useful anthology of existing results is provided by Haldrup (1998).
Regression-based F-tests for the null hypothesis that a process is I(2) against the alternative that it is either explosive, I(1) or I(0), have been proposed in Hasza and Fuller (1979) and Sen and Dickey (1987). These approaches are based on an identical test regression but differ in the method employed to estimate the parameters of this regression. The Hasza and Fuller (1979) approach is based on ordinary least squares (OLS) estimation, whereas that of Sen and Dickey (1987) is closely related to the simple symmetric least squares (SSLS) estimator of Fuller (1996). Recent extensions of the Hasza and Fuller and Sen and Dickey procedures, using semiparametric corrections of the type considered in Phillips (1987) and Phillips and Perron (1988), have been developed in Haldrup (1994) and Shin and Kim (1999).
In this paper we show formally that, contrary to the unit root case described previously, demeaning the data, either directly or through the inclusion of a constant in the test regression, is not sufficient to render the double unit root tests exact similar with respect to the starting values. The authors cited previously derive their results under fixed initial conditions either making no comment on this assumption or (incorrectly) arguing that this implies no loss of generality. We outline a number of possible cases for the starting values and show that it is only where these are fixed and equal that exact similar tests obtain. Moreover, we demonstrate that tests based on demeaned data are asymptotically similar only where the starting values are Op(1), thereby excluding cases, arguably of most practical relevance, where the starting values are of comparable stochastic order to the sample data points. This result invalidates the claim made by Hasza and Fuller (1979) that the limiting null distributions of test statistics using demeaned data do not depend on the initial conditions in such cases (see Hasza and Fuller, 1979, p. 1119). We also demonstrate that the two methods of demeaning are asymptotically equivalent in the case of the SSLS-based statistics but, contrary to what is claimed in Haldrup (1994, p. 113; 1998, p. 611) and to what is observed for the single unit root case, differ in the case of the OLS-based statistics.
For the double unit root tests to be exact similar we show that either the data must be detrended or a linear combination of the initial values must be subtracted from all of the sample observations. In the case of the OLS-based tests, the former may be done either directly or, as is suggested in Hasza and Fuller (1979), indirectly by including a constant and linear time trend in the test regression. The two approaches to detrending, as in the case of demeaned data discussed previously, are shown not to coincide for the OLS-based tests, even asymptotically. We demonstrate that the same is true of the SSLS-based test statistics but that here only direct detrending yields exact similar tests, whereas SSLS-based tests with indirectly detrended data are asymptotically similar only where the starting values are Op(1).
The plan of the paper is as follows. In Section 2 we review the OLS- and SSLS-based double unit root testing procedures. In Section 3 we investigate the exact dependence of the regressors from the double differencing test regressions on the starting values under the I(2) null for a range of possible assumptions on the starting values. In Section 4 we present representations for the limiting null distributions of the OLS- and SSLS-based test statistics under both methods of demeaning and detrending and appropriate to each of the various assumptions made on the starting values. In Section 5 we use Monte Carlo experimentation to quantify the finite-sample dependence of the OLS- and SSLS-based tests on the starting values. These results demonstrate that the demeaned SSLS-based tests are much more sensitive to what is assumed about the starting values than are the demeaned OLS-based tests. We also show that including a constant in the test regression is preferable to direct demeaning in the case of OLS-based tests, in that sensitivity to the starting values is somewhat smaller. Section 6 discusses semiparametric modifications of the OLS- and SSLS-based tests after Haldrup (1994) and Shin and Kim (1999), respectively. Section 7 concludes.
2. TEST PROCEDURES
Consider the univariate time series process {yt}, generated according to

where φ(z) ≡ (1 − φ1 z)(1 − φ2 z) is a second-order polynomial in the lag operator L; Lkyt ≡ yt−k, k = 0,1,2,…. We follow Haldrup (1994, p. 110) and assume that the innovations {εt} are weakly dependent and heterogeneous, satisfying the well-known strong mixing conditions of, inter alia, Phillips (1987, Assumption 2.1, p. 280) with long-run variance σ2.
As demonstrated in Hasza and Fuller (1979), (2.1) may be equivalently reparameterized as

where (γ0*, γ1*) and (γ0, γ1) form a one-to-one mapping, ρ1 = −(1 − φ1) × (1 − φ2), and ρ2 = (φ1φ2 − 1). Our interest centers on testing the null hypothesis that yt ∼ I(2), namely,

such that the process requires double differencing to attain stationarity, against the alternative that yt is either explosive, I(1) or I(0),

Consequently, a test for H0 of (2.3) against H1 of (2.4) can be based on a joint F-type test for the exclusion of both the regressors yt−1 and Δyt−1 from (2.2).
We explore the impact of the (observable) starting values of the process, y0 and y−1, on the null distributions of test statistics for double unit roots, via three important cases.
Case 1. y0 = μ0 and y−1 = μ−1, with μ0 and μ−1 fixed constants.
Case 2. y0 and y−1 are both Op(1) random variables.
Case 3. For some κ > 0,

.
Case 1 is assumed by Hasza and Fuller (1979) and Sen and Dickey (1987), the latter imposing further that μ0 = μ−1. To illustrate Case 2, two particular examples seem useful: first, the case where y0 = ε0 and y−1 = ε−1, that is, where the initial values have variances equal to that of the shocks; second, where, under H0 of (2.3), the history of the process stretches back to some point in the finite past, namely,

, where m is a strictly positive finite constant. For finite T, it is always possible to find values of m and κ such that Cases 2 and 3 coincide. However, this is not the case asymptotically because under Case 3 y0 and y−1 are both of Op(T3/2); that is, the starting values are of the same stochastic order as the data points y1,…, yT. The asymptotic distribution theory under Case 3 is therefore likely to give a better approximation to the finite-sample null behavior of the statistics of Section 2 under random starting values than is that under Case 2. In the standard unit root literature the analogue of Case 3 has also been widely adopted for related reasons (see, inter alia, Phillips and Lee, 1996; Canjels and Watson, 1997). Although other assumptions could be made concerning the mechanism generating y0 and y−1 we believe that Case 3 is of most practical relevance because here the starting values are generated by the same underlying process as {y1,…, yT}. However, our main focus here is to identify those double unit root tests that are exact similar to the initial conditions. If we then restrict ourselves to such tests, what we assume about the initial conditions (provided they are well defined) becomes irrelevant.
2.1. The Hasza and Fuller Test
Hasza and Fuller (1979) develop a test for H0 of (2.3) based on indirect detrending by using the standard OLS regression F-statistic for the exclusion of both yt−1 and Δyt−1 from (2.2), which we denote by F4OLS. Hasza and Fuller (1979) also consider the case where the linear trend term is omitted from (2.2). In what follows we will refer to this restricted test regression as (2.2a) and to the corresponding F-statistic as F2OLS.1
Notice that, by the familiar Frisch–Waugh theorem, F4OLS is numerically identical to the F-statistic obtained from a regression of Δ2yt on the variables

of (3.6) and (3.7), respectively, whereas F2OLS is numerically identical to the statistic from a regression of Δ2yt on the variables yt−1 and

of (3.2) and (3.5), respectively.
As shown in Section 3, Δ2yt ≡ Δ2yt and Δyt−1 ≡ Δyt−1. Moreover, notice that

.

where

, is yt demeaned, and compute the OLS F-type test for the exclusion of yt−1 and Δyt−1 from (2.5). This test will be denoted F1OLS in what follows. In the case where the linear trend is retained in (2.2), a similar alternative is to calculate the F-statistic from the OLS regression of

, where

is yt demeaned and detrended; we will refer to this regression as (2.5a) and to the associated F-test as F3OLS. However, contrary to what is observed for standard unit root tests, neither F1OLS and F2OLS nor F3OLS and F4OLS are equivalent, even asymptotically, as will be shown subsequently.
2.2. The Simple Symmetric Test
Considering first the no-trend case, it follows from Fuller (1996) and Sen and Dickey (1987) that the SSLS estimator

from (2.2a) is given by

, where ω = diag(½,…,½) is a 2T × 2T diagonal weight matrix, X comprises the second (with the term −μ omitted) and third columns from Table 2 of Sen and Dickey (1987, p. 465) augmented by a column of ones, and Y ≡ (Δ2y1,…, Δ2yT, Δ2yT,…, Δ2y1)′. From this we obtain that the SSLS estimators for ρ1 and ρ2 in the case of indirect demeaning are given by,
3Notice that Sen and Dickey (1987) set ω = I2T. However, the test statistics they propose will clearly yield identical critical regions, but do not possess identical distributions, to those in (2.6) and (2.7); see Remark 4.7.

Defining R = [02×1 : I2] , the F-type test for the joint significance of ρ1 and ρ2 is given by

where

is the associated SSLS estimator of σ2 (see Fuller, 1996, p. 415). Similarly, the SSLS t-statistics

for testing ρj = 0, j = 1,2, may be defined as

where R1 = (0 1 0) and R2 = (0 0 1).
For the case where direct demeaning is employed, the SSLS estimator from (2.5) is given by

, where

comprises the second and third columns from Table 2 of Sen and Dickey (1987, p. 465) with the term μ replaced by the sample mean y. As discussed in Fuller (1996, p. 416), and in contrast to the Hasza and Fuller (1979) procedure,

is asymptotically equivalent to

obtained using indirect demeaning previously. Consequently, the F-statistic

and corresponding

, are also asymptotically equivalent to those given for the case of indirect demeaning previously.
The corresponding tests that allow for a linear trend may be straightforwardly obtained from SSLS estimation of (2.2) and (2.5a). We denote these statistics by F4SSLS and F3SSLS, respectively. However, here the two approaches are not equivalent, even asymptotically. In both cases

coincides and has an expression similar to (2.6) except that the demeaned yt−1, yt−1, is replaced by demeaned and detrended yt−1,

. For

, the expression in (2.6) is obtained for the SSLS estimation of (2.2), but where the tests are obtained from SSLS estimation of (2.5a) the expression for this statistic is given by (2.6) but with

replacing Δyt. For details see the Appendix of Rodrigues and Taylor (2002).
3. DIRECT AND INDIRECT DEMEANING AND DETRENDING
Under H0 of (2.3) it is straightforward to show that

Defining t ≡ (T + 1)/2, it follows that the demeaned process yt ≡ yt − y may be written as

where

As a consequence of (3.2),

Moreover, Δ2yt = Δ2yt = εt.
It is seen from (3.2) that the demeaned process {yt} depends on the difference between the initial conditions, (y0 − y−1), with this dependence growing linearly with t. The first difference of the demeaned process {Δyt} also depends on (y0 − y−1), but here the dependence is constant over the sample. In contrast to (3.4), if we demean Δyt itself (as will be the case with the use of indirect demeaning) it is straightforward to establish that

which is invariant to the starting values.
It is clear from (3.2) and (3.4) that the F1OLS and FjSSLS, j = 1,2, tests of Section 2 will not be exact similar under either Cases 2 or 3 but only under Case 1 where μ0 = μ−1 (cf. Sen and Dickey, 1987). As regards the F2OLS test, although this too is not exact similar, we might expect it to be less affected than the F1OLS statistic by virtue of the invariance of

to the initial values; cf. (3.5). This conjecture appears to be supported by the numerical results reported in Section 5, where F2OLS is shown to be considerably less sensitive to the starting values. In the next section we show that tests based on the FjOLS and FjSSLS, j = 1,2, statistics are asymptotically similar under Cases 1 and 2 but not under Case 3. In Case 3, the limiting null distributions of the statistics are shown to depend on the history parameter κ.
Although the demeaned data yt depend on the initial values of the process, it is straightforward to show that the demeaned and detrended data,

, satisfy

where

is as defined in (3.3) and, hence, is invariant to the initial conditions, as will be

. Moreover, it is also easily demonstrated that the demeaned and detrended Δyt satisfies

which is also invariant to these parameters. Consequently, the F3OLS, F4OLS, and F3SSLS statistics of Section 2 will all yield exact similar inference. In contrast, the F4SSLS test is not exact similar with respect to y0 and y−1, as is clear from the discussion at the end of Section 2.2. Hence, one should not use indirect detrending in the context of the SSLS tests.
Remark 3.1. Notice from (3.1) that by considering the transformation

we obtain transformed data {yt*} that are exact invariant to the initial conditions under H0 of (2.3). Consequently, the F-statistics calculated from the OLS and SSLS regressions of Δ2yt* on yt−1* and Δyt−1* will yield exact similar tests with respect to y0 and y−1. We will refer to these statistics as F*OLS and F*SSLS, respectively. It is easily demonstrated that the limiting null distribution of F*OLS is as given for the

statistic in Theorem 1 of Haldrup (1994, pp. 111–112), whereas that of F*SSLS is as given for the

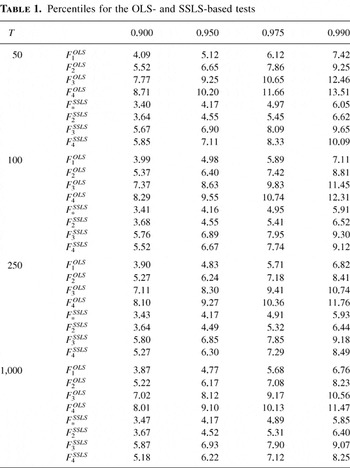
statistic in Theorem 1 of Shin and Kim (1999, p. 68). Semiparametric modifications to these statistics may be carried out in the manner outlined in Haldrup (1994, pp. 112–113) and Shin and Kim (1999). Appropriate critical values for tests based on the modified F*OLS and F*SSLS statistics are therefore as given for the statistic labeled Φ1(2) in Table 4.1 of Hasza and Fuller (1979, p. 1116) and in Table 1, which follows, respectively.
Percentiles for the OLS- and SSLS-based tests

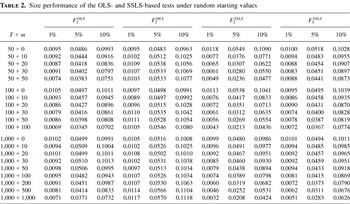
Size performance of the OLS- and SSLS-based tests under random starting values

4. ASYMPTOTIC REPRESENTATIONS
Suppose that yt is generated according to (2.1) under H0 of (2.3) with y0 and y−1 generated according to Case 3. We then have that

as T → ∞, where V(.) is a standard Brownian motion; ⇒ is used throughout this paper to denote weak convergence of the associated probability measures. Using Donsker's theorem (see Billingsley, 1968), it follows using (4.1) that

Remark 4.1. Notice that under both Case 1 and Case 2, T−3/2yj, j = 0,−1 and T−1/2(y0 − y−1) are of op(1).
Now, from (3.1) we have that

Consequently, from (4.1), (4.2), Equation (2.3) of Haldrup (1994, p. 111), and applications of the continuous mapping theorem we obtain that as T → ∞,

where [·] denotes the integer part of its argument, W(·) is a standard Brownian motion independent of V(·), and

are (independent) integrated Brownian motions. The result in (4.3) is the building block of the results that are stated subsequently. It also serves to illustrate the difference between Cases 1 and 2 and Case 3 on the asymptotic distribution theory, because under Cases 1 and 2 the first two terms of the right member of (4.3) vanish; cf. Remark 4.1.
In Lemma 4.1, we now detail the limiting behavior of the sample regression quantities used in constructing the OLS and SSLS statistics of Sections 2.1 and 2.2. The proof of Lemma 4.1 is available from the accompanying working paper, Rodrigues and Taylor (2002). We explicitly state the limiting results only for Case 3 of the initial values. However, Cases 1 and 2 obtain directly from the results that follow simply by setting κ = 0 throughout, noting that V(0) ≡ 0.
LEMMA 4.1. Let {yt} be generated by (2.1) under H0 of (2.3), with y0 and y−1 generated according to Case 3. Then as T → ∞,

where W(·), V(·), W*(·), and σ2 are as defined previously,

where

, and κ is nonnegative.
Remark 4.2. Notice from Lemma 4.1 that the directly and indirectly demeaned and detrended regression quantities used in constructing the double differencing test statistics of Section 2 have different large-sample properties under H0 of (2.3). This contrasts sharply with the standard unit root ADF statistics where the direct and indirect methods of demeaning/detrending are asymptotically equivalent. As an example, from parts (iii) and (iv) of the lemma we see that the scaled partial sum of the directly demeaned quantity Δyt weakly converges to the sum of two independent Brownian motions (one of which appears only where κ > 0), whereas the corresponding scaled partial sum of the indirectly demeaned quantity

weakly converges to a demeaned Brownian motion.
We now provide limiting null representations for the Hasza and Fuller–type statistics and simple symmetric statistics of Section 2. These results follow from Lemma 4.1 after lengthy but tedious algebra; proofs are provided in Rodrigues and Taylor (2002). Again, although results are explicitly stated only for Case 3 of the initial values, results for Cases 1 and 2 obtain by setting κ = 0 throughout.
4.1. The Hasza and Fuller Statistics
In Theorem 4.1 we provide representations for the limiting null distribution of the Hasza and Fuller (1979) F1OLS and F2OLS statistics of Section 2. Corresponding representations for the F3OLS and F4OLS statistics are subsequently discussed in Theorem 4.2.
THEOREM 4.1. Under the conditions of Lemma 4.1 the F1OLS and F2OLS statistics of Section 2.1 have the following limiting distributions:

Remark 4.3. If the initial values are generated according to either Case 1 or Case 2 of Section 2, such that κ = 0, and σ2 = σε2, as happens when εt ∼ IID(0, σ2), then the right member of (4.4) corresponding to F2OLS reduces to the equivalent

representation, formulated in terms of linear combinations of independent and identically distributed (i.i.d.) N(0,1) variates, given in Corollary 3.1 of Hasza and Fuller (1979, p. 1115). Hasza and Fuller derive this result under Case 1 with i.i.d. errors. Theorem 4.1 therefore demonstrates that their result holds under much weaker conditions on the initial values. However, although they derive their results under Case 1, Hasza and Fuller subsequently suggest (p. 1119) that these representations hold irrespective of the initial values. Theorem 4.1 demonstrates that this is not the case and that here the limiting representations of the Hasza and Fuller statistics depend on the history parameter κ.
Remark 4.4. The representations for the limiting null distributions of F1OLS and F2OLS given in Theorem 4.1 do not coincide, even for κ = 0. The former is a functional of a demeaned integrated Brownian motion and a standard Brownian motion, whereas the latter is a functional of a demeaned integrated Brownian motion and a demeaned Brownian motion that, for κ = 0, coincides with the representation given in Haldrup (1994, p. 113). This disparity is confirmed by a comparison of the percentiles given in Table 1. This disproves the claim made in Haldrup (1998, p. 611) that the two detrending procedures “are going to deliver the same results.”
THEOREM 4.2. Under the conditions of Lemma 4.1 the F3OLS and F4OLS statistics of Section 2.1 have the following limiting distributions:

Remark 4.5. As with the F1OLS and F2OLS statistics, the limiting null distributions of the F3OLS and F4OLS statistics are not equivalent, again contrary to what is claimed in Haldrup (1998, p. 611). The representation given for F4OLS coincides with that given in Haldrup (1994, p. 113). However, the limiting null distributions of F3OLS and F4OLS, unlike those of F1OLS and F2OLS, do not involve V(κ). Recall that these statistics are exact invariant to the initial values; cf. Section 3.
Remark 4.6. In light of Remarks 4.4 and 4.5, the testing strategy proposed by Haldrup (1994, p. 115) requires modification: either Haldrup's step 2 is altered to allow use of a test regression with the necessary deterministic variables included rather than “prior detrending of the series” (1994), or alternatively step 5 needs to accommodate the use of the critical values for the F1OLS and F3OLS statistics presented in Table 1. See also the discussion on semiparametric modifications of the OLS-based statistics in Section 6.
4.2. The Simple Symmetric Statistics
In Theorem 4.3 we now provide representations for the limiting null distribution of the SSLS statistics of Section 2.2 appropriate to the no-trend case. The following results are appropriate to the SSLS estimation of both (2.2a) and (2.5), that is, to the cases where demeaned data are used and where a column of ones is included in X, respectively. A formal proof of this result is provided in Remark A.3 of the Appendix to Rodrigues and Taylor (2002). Limiting null representations appropriate to the trend case are subsequently detailed in Theorem 4.4.
THEOREM 4.3. Under the conditions of Lemma 4.1, the SSLS t-statistics,

, have the following large-sample distributions:


Remark 4.7. Notice that the right members of (4.6) and (4.7) both depend on the history parameter κ. If, however, κ = 0, as happens when the initial values are generated according to either Case 1 or Case 2 of Section 3, then η2(0) coincides for the case where εt ∼ IID(0, σ2) with the limiting distributions given in Fuller (1996, Theorem 10.1.7, p. 570) for the simple symmetric studentized statistic obtained from a first-order autoregression (with no constant) under the unit root (I(1)) null. Moreover, in such cases,

is also equivalent to the corresponding distribution provided by Sen and Dickey (1987, p. 466).
From (2.7) it can be established that the scaled second moment matrix from the SSLS estimation of (2.2a) and (2.5) is asymptotically block diagonal between yt−1 and Δyt−1 (see Rodrigues and Taylor, 2002, equation (A.29)). Consequently, unlike the Hasza and Fuller (1979) F1OLS and F2OLS statistics, the limiting null distributions of the F1SSLS and F2SSLS statistics of Section 2 are identical and are simply the average of the square of the limit distributions in (4.6) and (4.7).
COROLLARY 4.1. Under the conditions of Lemma 4.1,

We now turn to the statistics derived from the SSLS estimation of (2.5a) and (2.2). We demonstrate in Theorem 4.4 that although the limiting null distributions of the test statistics on ρ1 are equivalent across these two cases, the statistics on ρ2, and hence the joint statistics, F3SSLS and F4SSLS, are not. Again, the scaled second moment matrix in both of these cases is block diagonal between the stochastic regressors.
THEORM 4.4. Under the conditions of Lemma 4.1, the

statistics obtained from SSLS estimation of (2.5a) have the following large-sample distributions:


and the corresponding statistics obtained from SSLS estimation of (2.2) satisfy


where

Remark 4.8. In accordance with their exact similar properties demonstrated in Section 3, the limiting representations in (4.9)–(4.11) of Theorem 4.4 do not depend on V(κ), regardless of what is assumed about the starting values y0 and y−1. This also holds true for

in (4.12), obtained from the SSLS estimation of (2.2). However, the limiting null distribution of the

statistic from SSLS estimation of (2.2), η3, is identical to that of the corresponding statistic from the SSLS estimation of (2.5); that is, it, and consequently the joint statistic F4SSLS, is not asymptotically pivotal, except where κ = 0.
5. SIMULATION RESULTS
In this section we use Monte Carlo methods to produce finite-sample critical values for the double differencing tests from Sections 2 and 3, under the assumption that the starting values of the process are both zero and that the error term εt ∼ NID(0,1). We then subsequently investigate how robust these finite-sample distributions are to random starting values.
5.1. Finite-Sample Critical Values
Monte Carlo simulated finite-sample critical values for the Hasza and Fuller (1979) FiOLS, i = 1,…,4, and the SSLS FjSSLS, j = 2,3,4, statistics of Section 2, together with the F*SSLS statistic of Remark 3.1, are reported in Table 1.4
Critical values are not given for F1SSLS because this statistic is asymptotically equivalent to F2SSLS. Moreover, critical values for the associated t-ratios are not reported here. All are available from the authors on request.
The simulations computed in this section were based on the DGP

with yj = εj = 0, j ≤ 0, and were programmed using the RNDN function of GAUSS 3.1 on a Pentium 233 MHz microcomputer using 50,000 replications for each simulation. We report results for the sample sizes T = 50, 100, 250, 1,000. The reported critical values for the F2OLS and F4OLS statistics correspond closely with the tabulations in Hasza and Fuller (1979, Table 4.1, p. 1116).5
Hasza and Fuller (1979) label these tests Φ2(2) and Φ3(2), respectively.
5.2. The Impact of Starting Values
To investigate the impact of random starting values on the test statistics of Section 2, we first generate T + m observations according to (2.1s) with εt ∼ NID(0,1), of which the first m are discarded. The appropriate test regression from Section 2 is then estimated, either by OLS or SSLS, using the remaining T observations. For example, if we generate T + m = 80 observations with T = 50 and m = 30, we would then discard the first 30 and apply the tests to the remaining 50. This approach is repeated for different values of m and T, in each case using 50,000 replications.6
We also experimented with fixed starting values. Our results showed that for all of the tests size distortions were related to the quantity σ−1|y0 − y−1| with each test showing qualitatively similar behavior to the results reported in Table 2 for cases where m is kept fixed as T increases. Full results for the case of fixed starting values are reported in Rodrigues and Taylor (2002).
Consider first the case where m is kept fixed as T increases. Here we see from Table 2 that the F1OLS test tends to be slightly undersized for the smaller values of T, this effect worsening as m increases, whereas the F2OLS test appears much less sensitive to m throughout. Although the distortions observed for the F2OLS test are small they are generally of significant magnitude, because for a given entry in Table 2, a, say, its Monte Carlo standard error is approximately

. Turning to the SSLS tests, the F4SSLS test behaves quite similarly to the F1OLS test, whereas the F2SSLS test displays somewhat worse size distortions. For a given value of T, size distortions in all of the tests worsen as m is increased, but holding m fixed the observed distortions rapidly reduce as T is increased. The latter is of course predicted by the limiting distribution theory, because κ = 0 applies in the limit if we hold m fixed.
Consider now what happens as we allow m and T to increase in proportion with one another. Here we see that the empirical size of the tests does not revert to the correct nominal level; again this is predicted by the limiting distribution theory in Section 4, because here κ > 0.7
For example, as T → ∞, cases where m = T correspond to κ = 1.
Tests that are exact similar with respect to the starting values are, of course, preferred. In Section 3 we identified the F3OLS, F4OLS, and F3SSLS tests, together with the F*OLS and F*SSLS tests of Remark 3.1, as exact similar. Overall, the results presented in this section suggest that the impact of random starting values on the nonsimilar FjOLS and FjSSLS, j = 1,2, tests of Section 2 are, fortunately, not too great although they do appear to be of significant magnitude. The results also suggest that, in the OLS case, the F2OLS test is marginally preferable to the F1OLS test and that overall the OLS-based tests appear far less sensitive to the initial values than do the SSLS-based tests.
6. SEMIPARAMETRIC TESTS
It is clear from Theorems 4.1–4.4 that the limiting null distributions of the OLS and SSLS statistics depend on the nuisance parameters σ2 and σε2. Following Haldrup (1994) and Shin and Kim (1999) we can modify these statistics to obtain statistics with limiting null distributions that correspond to those in Theorems 4.1–4.4 appropriate to those where εt ∼ IID(0, σ2) and, hence, σ2 = σε2. Consequently, the critical values provided in Table 1 can then be used for the modified statistics (where the tests are similar with respect to the starting values) with these remaining asymptotically valid under a wide class of weakly dependent and heterogeneously distributed errors, {εt}.
Consider first the Hasza and Fuller–type statistic based on directly demeaned data, F1OLS. Following Haldrup (1994, p. 112) we define the following directly demeaned quantities:

Following Haldrup (1994, pp. 112–113) consider now the transformed statistic

where

is the long-run variance estimator of Haldrup (1994, equation (3.2), p. 112) with

the OLS residuals from estimating (2.5),

. Then, under the conditions on {εt} given in Phillips (1987) and Phillips and Perron (1998) to ensure that the estimators

are consistent under the null, it follows exactly as in Haldrup (1994, Theorem 2, p. 112) that Z(F1OLS) will have the limiting null distribution given by that of F1OLS in Theorem 4.1 with σ2 = σε2. The transformed F1SSLS statistic of Shin and Kim (1999),

where

, will similarly obtain the null distribution for F1SSLS in Corollary 4.1 with σ2 = σε2. Notice that these representations will still involve the limiting process V(κ) arising from the initial conditions under Case 3.
In the case of the F2OLS statistic where we indirectly demean the data through estimating (2.2a), the directly demeaned quantities Δyt−j, j = 0,1, and Δ2yt in the expressions in (6.1) must be replaced by the indirectly demeaned quantities

, respectively. We denote these indirectly demeaned quantities by, for example,

, and so on. The variance estimators

are correspondingly constructed from the OLS residuals from (2.2a). The resulting modified statistic Z(F2OLS), constructed as in (6.2) but using the preceding quantities to modify F2OLS, will then have the limiting null distribution given by that of F2OLS in Theorem 4.1 with σ2 = σε2. The modified F2SSLS statistic, Z(F2SSLS), constructed as for Z(F1SSLS) previously but from the indirectly demeaned data and using the estimators

as for Z(F2OLS), similarly obtains the null distribution for F2SSLS in Corollary 4.1 with σ2 = σε2. Again these representations involve V(κ) under Case 3.
For the case where detrending, either direct or indirect, is used, the preceding procedures are modified in an entirely obvious way with the resulting modified statistics denoted Z(FjOLS) and Z(FjSSLS), j = 3,4, although it should be noted that Z(F4SSLS), like F4SSLS, will still depend on κ under Case 3. At this point it is crucial to stress that the directly and indirectly demeaned quantities used in the construction of Z(F1OLS) and Z(F2OLS) respectively, must not be interchanged, contrary to what is outlined in Haldrup (1994, p. 113). That is, the directly demeaned quantities in (6.1) must not be used in constructing the Z(F2OLS) statistic, nor should the indirectly demeaned quantities be used in constructing Z(F1OLS). This is clear from the results in Lemma 4.1, where it was seen that the directly and indirectly demeaned quantities do not converge to the same limiting distributions. The same comment clearly also applies to the Z(F3OLS) and Z(F4OLS) statistics.
7. CONCLUSIONS
In this paper we have studied the impact that starting values have upon the double differencing tests of Hasza and Fuller (1979) and Sen and Dickey (1987), the former based on OLS estimation and the latter on SSLS estimation. We have shown that, unlike conventional unit root tests, these tests when based on data that have been demeaned, either directly or indirectly, by the inclusion of a constant in the test regression are not exact similar to the starting values of the process, unless the starting values are fixed and equal. Moreover, we have demonstrated that here the statistics can also fail to be asymptotically pivotal, contrary to claims made previously in the literature. OLS-based statistics employing data that have been detrended, either directly or by the inclusion of a constant and linear time trend in the test regression, were shown to yield exact similar tests. We have demonstrated that, in the context of the SSLS-based approach, exact similar tests obtain only where direct detrending is used. For both the OLS- and SSLS-based approaches we have also shown that tests based on data where a linear combination of the initial values has been subtracted from all of the sample observations are also exactly similar. We have further shown that the two demeaned OLS-based statistics do not coincide, even asymptotically, nor indeed do the OLS- or SSLS-based statistics for detrended data, again invalidating claims made previously in the literature. Monte Carlo methods were used to quantify the finite-sample impact that the starting values have on the foregoing tests. These results were generally suggestive that the SSLS-based tests are rather more sensitive to the nature of the starting values than the OLS-based tests. Semiparametric modifications of the tests were also proposed after Haldrup (1994) and Shin and Kim (1999).
References
REFERENCES
Billingsley, P.
(1968)
Convergence of Probability Measures.
Wiley.
Canjels, E. &
M. Watson
(1997)
Estimating deterministic trends in presence of serially correlated
errors.
Review of Economics and Statistics
79,
184–200.Google Scholar
Dickey, D.A. &
W.A. Fuller
(1979)
Distribution of the estimators for autoregressive time series with
a unit root.
Journal of the American Statistical Association
74,
427–431.Google Scholar
Dickey, D.A. &
W.A. Fuller
(1981)
Likelihood ratio statistics for autoregressive time series with a
unit root.
Econometrica
49,
1057–1072.Google Scholar
Fuller, W.A.
(1996)
Introduction to Statistical Time Series,
2nd ed.
Wiley.
Haldrup, N.
(1994)
Semi-parametric tests for double unit roots.
Journal of Business and Economic Statistics
12,
109–122.Google Scholar
Haldrup, N.
(1998)
A review of the econometric analysis of I(2) variables.
Journal of Economic Surveys
12,
595–650.Google Scholar
Hamilton, J.D.
(1994)
Time Series Analysis.
Princeton University Press.
Hasza, D.P. &
W.A. Fuller
(1979)
Estimation of autoregressive processes with unit roots.
The Annals of Statistics
7,
1106–1120.Google Scholar
Phillips, P.C.B.
(1987)
Time series regression with a unit root.
Econometrica
55,
277–301.Google Scholar
Phillips, P.C.B. &
C.C. Lee
(1996)
Efficiency gains from quasi-differencing under nonstationarity. In
P.M. Robinson and
M. Rosenblatt (eds.),
Athens Conference, Applied Probability and Time Series: Essays in
Memory of E.J. Hannan.
Springer-Verlag.
Phillips, P.C.B. &
P. Perron
(1988)
Testing for a unit root in time series regression.
Biometrika
75,
335–346.Google Scholar
Rodrigues, P.M.M. &
A.M.R. Taylor
(2002)
On Tests for Double Differencing: Some Extensions and the Role of Initial
Values,
Discussion paper 02-05,
Department of Economics, University of Birmingham.
Sen, D.L. &
D.A. Dickey
(1987)
Symmetric test for second differencing in univariate time series.
Journal of Business and Economic Statistics
5,
463–473.Google Scholar
Shin, D.W. &
H.J. Kim
(1999)
Semiparametric tests for double unit roots based on symmetric
estimators.
Journal of Business and Economic Statistics
17,
67–73.Google Scholar
Percentiles for the OLS- and SSLS-based tests
Size performance of the OLS- and SSLS-based tests under random starting values
 You have
Access