INTRODUCTION
Changes in the mean and the variability of climatic parameters will have an essential influence on agricultural cropping systems, especially under water-limited production conditions, such as in the dry region of north-eastern Austria. For example, Dubrovsky et al. (Reference Dubrovsky, Svoboda, Trnka, Hayes, Wilhite, Zalud and Hlavinka2008) and Trnka et al. (Reference Trnka, Eitzinger, Dubrovsky, Semeradova, Stepanek, Hlavinka, Balek, Skalak, Farda, Formayer and Zalud2010a , Reference Trnka, Eitzinger, Semerádová, Hlavinka, Balek, Dubrovský, Kubu, Štepánek, Thaler, Možný and Žalud2011a , Reference Trnka, Olesen, Kersebaum, Skjelvag, Eitzinger, Seguin, Peltonen-Sainio, Rötter, Iglesias, Orlandini, Dubrowsky, Hlavinka, Balek, Eckersten, Cloppet, Calanca, Gobin, Vucetic, Nejedlik, Kumar, Lalic, Mestre, Rossi, Kozyra, Alexandrov, Semerádová and Žalud b ) indicated that in dry agricultural areas of Central Europe, drought and periods of heat stress at particularly sensitive stages of development are expected to increase and will be limiting factors in crop production under future climate scenarios. Heat stress in plants is a complex function of the temperature level and duration as well as the rate of temperature increase. The critical thresholds of temperature vary greatly with the developmental stages of crops and plants (Hall Reference Hall2001). Water stress is often associated with (i) heat stress, as leaf temperature usually increases during stomata closure and (ii) a reduced transpirational cooling effect (Hathfield Reference Hathfield1979). At the same time, the ongoing enrichment of atmospheric CO2, which is expected to rise from a current 390 μmol/mol to c. 550 μmol/mol by the middle of the century (Solomon et al. Reference Solomon, Qin, Manning, Chen, Marquis, Averyt, Tignor and Miller2007), enhances the photosynthetic rate and biomass accumulation. However, higher temperatures can provoke a notable shortening of the growth period, especially for annual crops, such as cereals with determinate growth, providing less time for carbon fixation and a reduction in biomass accumulation (Morison & Lawlor Reference Morison and Lawlor1999). Therefore, the combination of increased CO2 concentration with higher temperature does not necessarily result in a higher crop yield (Kristensen et al. Reference Kristensen, Schelde and Olesen2011). Specific agricultural practices such as selecting earlier sowing dates or cultivars with a longer growth cycle contribute to preventing yield reductions and reducing water demand (Trnka et al. Reference Trnka, Dubrovsky and Zalud2004a ; Olesen et al. Reference Olesen, Carter, Diaz-Ambrona, Fronzek, Heidmann, Hickler, Holt, Minguez, Morales, Palutikov, Quemada, Ruiz-Ramos, Rubæk, Sau, Smith and Sykes2007, Reference Olesen, Trnka, Kersebaum, Skjelvåg, Seguin, Peltonen-Sainio, Rossi, Kozyra and Micale2011; Kaukoranta & Hakala Reference Kaukoranta and Hakala2008). Additionally, limitations by other factors, such as water availability and the associated uptake of mineral nutrients, is expected to become increasingly important (Amthor Reference Amthor2001; Linke et al. Reference Linke, Pfundtner, Bolhar-Nordenkampf, Dersch and Meister2005).
Several short- and long-term agronomic adaptation strategies are recommended to avoid or reduce the negative impact of climate change on the crop yield potential and develop eventual positive effects. Short-term adjustments at the farm level involve production techniques, such as changes in crop rotation and crop cultivars, changes in soil cultivation and tillage practices, a shift of sowing dates, adapted fertilization and crop protection measures (Tubiello et al. Reference Tubiello, Donatelli, Rosenzweig and Stockle2000; Chen & McCarl Reference Chen and McCARL2001; Alexandrov et al. Reference Alexandrov, Eitzinger, Cajic and Oberforster2002; Ghaffari et al. Reference Ghaffari, Cook and Lee2002; Trnka et al. Reference Trnka, Dubrovsky, Semerádová and Zalud2004b ; Patil et al. Reference Patil, Laegdsmand, Olesen and Porter2010; Davies et al. Reference Davies, Zhang, Yang and Dodd2011; Seo Reference Seo2011). These adjustments aim to optimize crop production without major system changes and can be developed and implemented independently at the farm level. Long-term adaptations, on the contrary, include major structural changes of farm production systems and need careful agro-economic planning and realization at a society level; these adaptations also involve a set of sectors and stakeholders, such as policy, research, water and land planning (Eitzinger et al. Reference Eitzinger, Orlandini, Stefanski and Naylor2010; Olesen et al. Reference Olesen, Trnka, Kersebaum, Skjelvåg, Seguin, Peltonen-Sainio, Rossi, Kozyra and Micale2011; Shahabfar & Eitzinger Reference Shahabfar and Eitzinger2011). Some examples of long-term adjustments are changes in land use and landscape structure, breeding and biotechnology applications, crop substitution and changes in the farm production type (Alexandrov et al. Reference Alexandrov, Eitzinger, Cajic and Oberforster2002).
Various potential adaptations in farm practices for crop production aim to reduce the negative impacts of crop growth-limiting factors, such as water stress or heat, through changes in management aimed at more efficient use and/or decrease in the unproductive losses of production resources (e.g. water and soil). Both conservation and efficiency gains improve the local sustainability of production, reduce production risks and may concomitantly improve the resilience of the production system. A change in soil cultivation or tillage practices, for example, can have multiple effects, such as on the soil water storage and soil erosion caused by water and wind (Falloon & Betts Reference Falloon and Betts2010; Klik & Eitzinger Reference Klik and Eitzinger2010). Conservation tillage practices have several advantages over conventional tillage systems (i.e. based on ploughing) under various soil, climate and management conditions (Martínez et al. Reference Martínez, Fuentes, Silva, Valle and Acevedo2008), which among others include the preservation of soil and water resources, a reduction of energy input and costs and, therefore, an increase or stabilization of crop production (Osunbitan et al. Reference Osunbitan, Oyedele and Adekalu2005).
Hedges (hedgerows, windbreaks or shelterbelts) consist of trees or bushes forming elongated structures in the agricultural landscape. Their introduction in the landscape represents another important adaptation strategy in regions with water-limiting crop-growing conditions (Kuemmel Reference Kuemmel2003). Hedges reduce wind speed and, therefore, unproductive evaporative losses from the crop stand by a reduction in the advection of dry air. However, growing hedges may create a disadvantage to nearby crops by introducing competition for growth-limiting factors, such as water or light (Brenner et al. Reference Brenner, Jarvis and Van Den Beldt1995; Cleugh et al. Reference Cleugh, Miller and Bohm1998). Increased snow retention near hedges may augment soil water storage, but it can also affect the soil nitrogen (N) balance (Rowe et al. Reference Rowe, Van Noordwijk, Suprayogo and Cadisch2005), delay field operations in spring time (Nuberg Reference Nuberg1998), and cause fungal crop diseases (Brenner Reference Brenner, Ong and Huxley1996; Nuberg Reference Nuberg1998).
For the assessment and interpretation of the behaviour of agronomic systems under diverse environmental conditions, such as climate change and management options, mechanistic crop simulation models are suitable tools (Tsuji et al. Reference Tsuji, Hoogenboom and Thornton1998; Orlandini et al. Reference Orlandini, Nejedlik, Eitzinger, Alexandrov, Toulios, Calanca, Trnka and Olesen2008; Challinor Reference Challinor2011; Rötter et al. Reference Rötter, Carter, Olesen and Porter2011). With the help of extensive spatial databases and analysis techniques supported by geographical information systems, the model outputs can be scaled up for regional planning (Uhlir & Carter Reference Uhlir and Carter1994). Additionally, crop simulation models can help to find adequate adaptation strategies to avoid or reduce negative climate change effects on crop yield and exploit possible beneficial options (Alexandrov et al. Reference Alexandrov, Eitzinger, Cajic and Oberforster2002; Trnka et al. Reference Trnka, Dubrovsky and Zalud2004a ; Thaler et al. Reference Thaler, Eitzinger, Rischbeck, Dubrovsky and Trnka2010; Iqbal et al. Reference Iqbal, Eitzinger, Formayer, Hassan and Heng2011). However, crop models are only a simplification of the complex soil-crop-atmosphere system. Uncertainties are thus abundant, such as the model representation of the involved processes and model inputs (Eitzinger et al. Reference Eitzinger, Formayer, Thaler, Trnka, Zdenek and Alexandrov2008; Challinor Reference Challinor2011; Rötter et al. Reference Rötter, Carter, Olesen and Porter2011).
The present study contributes to the assessment of the regional-specific and multiple effects of farm-level climate change adaptation strategies in dry crop production regions of Central Europe for winter wheat production by use of crop simulation. Specifically, the main objectives of the paper include: (i) a determination of the impact of climate change and (ii) an evaluation of the possible adaptation strategies for current winter wheat production in north-eastern Austria under a changing climate. For this purpose, detailed input data were collected for the parameterization and validation of the crop growth model CERES-Wheat. The impact of different regionalized climate change and management scenarios for the period 2021–50 on simulated winter wheat phenology and yields was studied. Particular emphasis was put on the assessment of: (i) the range of potential future crop development and yields under different climate change scenarios and (ii) the effects of soil cultivation and hedges on crop yield-limiting factors (i.e., soil water and N balance) as adaptation options.
MATERIALS AND METHODS
Study region
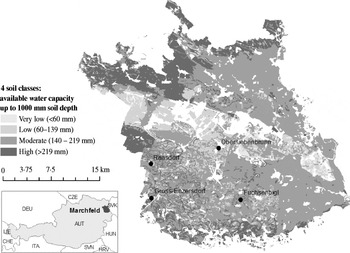
The Marchfeld region (Fig. 1; 48°17′N, 16°38′E), located in the north-eastern part of Austria, is not only one of the major crop production areas but also one of the driest regions in the country. It is a plain of c. 900 km2 with minor variations in elevation, ranging from 143 to 178 m a.s.l. The region is in the transition zone between the semi-humid Western-European climate and continental East-European one. Conditions are usually cold, with frequent hard frosts and limited snow cover in winter, and hot and periodically dry in summer (Müller Reference Müller1993). According to the phytogeographical and climatological aspect Marchfeld is part of the Pannonicum, with high levels of sunshine, high average temperature during the growing period and low precipitation. The growing period (mean temperature >5°C) lasts from the middle of March until middle of November, which means a growing period of c. 240 days (Cepuder & Schlederer Reference Cepuder and Schlederer2002). Total precipitation of 550 mm and temperature of 9·9°C characterize this semi-arid area (annual mean values 1961–90 weather station Groß-Enzersdorf 48°12′N, 16°33′E, 157 m a.s.l.). The mean annual potential evapotranspiration is 615 mm (1965–74 weather station Obersiebenbrunn 48°16′N, 16°41′E, 150 m a.s.l.) and was calculated with the Penman equation (Penman Reference Penman1948, Reference Penman1963). The annual water balance (precipitation – evapotranspiration according to Penman) is negative, with a value of −350 mm (Obersiebenbrunn 1969–74) (Müller Reference Müller1993).
The available water capacity of mineral soil classes in Marchfeld, Austria.

The main rain-fed crops are cereals in Marchfeld and other important crops, such as maize, vegetables, sugar beet or potatoes, need to be irrigated most years.
Model and data processing
The CERES-Wheat crop model (DSSAT 4.0.2.0) was selected for the present study. Palosuo et al. (Reference Palosuo, Kersebaum, Angulo, Hlavinka, Moriondo, Olesen, Patil, Ruget, Rumbaur, Takac, Trnka, Bindi, Caldag, Ewert, Ferrise, Mirschel, Saylan, Siska and Rötter2011) showed that CERES-Wheat performed well in comparison with real data and other models. It is a process-based, management-oriented model that simulates the daily time-step effects of the cultivar, crop management, weather, soil, water and N on crop growth, phenology and yield (Jones et al. Reference Jones, Keating and Porter2001, Reference Jones, Hoogenboom, Porter, Boote, Batchelor, Hunt, Wilkens, Singh, Gijsman and Ritchie2003). The input requirements for CERES-Wheat include weather and soil conditions, plant characteristics and crop management (Hunt et al. Reference Hunt, White and Hoogenboom2001).
Weather data
The minimum weather input requests of the model are daily solar radiation, the maximum and minimum air temperature and precipitation (Singh et al. Reference Singh, Tripathy and Chopra2008). Since the target area is a flat, small region, the variability of climate due to topography is marginal and can be neglected, as the daily variability of the weather equates to the climatological mean. Therefore, a representative weather station at Groß-Enzersdorf was selected for the entire region.
Soil data
Soil inputs include the drainage and runoff coefficients, first-stage evaporation and soil albedo, water-holding capacity, soil texture, bulk density, organic carbon (C) content for each individual soil layer and the rooting preference coefficients at several depth increments. For the first simulated day, the model also requires information about the saturated and initial soil water and N contents (Singh et al. Reference Singh, Tripathy and Chopra2008). In the model, the FAO-56 Penman–Monteith equation (Allen et al. Reference Allen, Pereira, Raes and Smith1998) was used to calculate the evapotranspiration and effect of wind speed reductions. The CERES soil model was selected as the soil organic N sub-model (Godwin & Jones Reference Godwin, Jones, Hanks and Ritchie1991; Godwin & Singh Reference Godwin, Singh, Tsuji, Hoogenboom and Thornton1998), which among others has been evaluated in a wide range of studies (Kovács et al. Reference KovácS, Németh and Ritchie1995; Timsina et al. Reference Timsina, Singh, Badaruddin and Meisner1998; Singh et al. Reference Singh, Tripathy and Chopra2008).
The overall soil conditions in Marchfeld are characterized by high spatial variability, including soils with low to moderate water-storage capacity. The arable soils in this region have a humus-rich A-horizon with high variability in depth (from c. 300 to >1000 mm) and a sandy C-horizon underneath, followed by fluvial gravel from the former river bed of the Danube. The groundwater table is in this gravel body, 6 m below the surface. Gravels avoid capillary rise, therefore there is no groundwater impact in the rooting zone of the crops (Eitzinger et al. Reference Eitzinger, Stastná, Zalud and Dubrovsky2003). Four soil classes (termed herein as soil 1, soil 2, soil 3 and soil 4, respectively) were defined according to the total available water capacity from the digital Austrian Soil Map 1:25 000 (BFW 2007); they were calculated with the area-weighed mean values of physical and chemical soil properties (i.e. texture and organic C content; Fig. 1) (Rischbeck Reference Rischbeck2007). The first two soil classes have an available water capacity of up to 140 mm for a 1000-mm soil depth. They are mostly Parachernozems, which are characterized as loamy sand or sandy loam soils, comprising c. 0·17 of the target area. Soils 3 and 4 are Chernozems and Fluvisols, respectively, with an available water capacity >140 mm for a 1000-mm soil depth (soil 3: sandy loam, 0·61 of the Marchfeld area; soil 4: loamy silt, 0·22 of the area).
Crop characteristics of winter wheat
The genetic coefficients used in the model depict the specific growth and development of the relevant crop cultivar (Tsuji et al. Reference Tsuji, Hoogenboom and Thornton1998; Alexandrov & Hoogenboom Reference Alexandrov and Hoogenboom2000). Coefficients related to photoperiod sensitivity, duration of grain filling, conversion of mass to grain number, grain-filling rates, vernalization requirements, stem size and cold hardiness are essential information to run the model (Hunt et al. Reference Hunt, Pararajasingham, Jones, Hoogenboom, Imamura and Ogoshi1993).
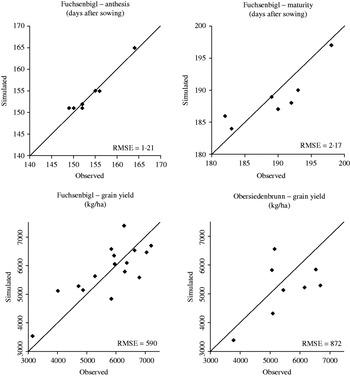
For the calibration of the genetic coefficients, the experimental site at Fuchsenbigl in Marchfeld was chosen (48°11′N, 17°00′E, 149 m asl) using 17 years (1989–2005) of phenological and yield data of the crop cultivar Capo (Fig. 2). It is a well-established cultivar, which is adapted to relatively dry and warm regions such as those found in eastern Austria (Oberforster & Werteker Reference Oberforster, Werteker, von Jochen Mayer, Alföldi, Leiber, Dubois, Fried, Heckendorn, Hillmann, Klocke, Lüscher, Riedel, Stolze, Strasser, van der Heijden and Willer2009). Nine years of observed winter wheat yield data from Obersiebenbrunn in the Marchfeld region were used for the model validation (Fig. 2) (Rischbeck Reference Rischbeck2007). The estimated genetic coefficients of the validated wheat used in the model simulations are presented in Table 1.
Comparison between simulated and observed phenological and yield data of winter wheat cultivar CAPO in Fuchsenbigl and Obersiebenbrunn, Marchfeld.

Estimated genetic coefficients of winter wheat (cultivar Capo) used in the crop model simulation

P1D, photoperiod sensitivity coefficient (% reduction/h near threshold); P1V, vernalization sensitivity coefficient (%/day of unfulfilled vernalization); P5, thermal time from the onset of linear fill to maturity (8°C day); G1, Kernel number per unit stem and/spike weight at anthesis (#/g); G2, potential kernel growth rate (mg/(kernel day)); G3, Tiller death coefficient. Standard stem and/spike weight when elongation ceases (g); PHINT, thermal time between the appearance of leaf tips (8°C day) Jones et al. (Reference Jones, Hoogenboom, Porter, Boote, Batchelor, Hunt, Wilkens, Singh, Gijsman and Ritchie2003).
Crop management
The winter wheat simulations depending on the management scenarios (see below) were conducted for rain-fed farming, including N fertilization, automatically adapted sowing dates, with and without the enrichment of CO2 according to the emission scenario, ploughed soil and minimum tillage, wind speed reduction due to hedges, additional soil moisture owing to snow banks on hedgerows and automatic irrigation without considering the potential yield losses caused by pest or diseases. Fertilization at 3×40 kg N/ha, the amount that farmers presently use in this area, at tillering, stem elongation or jointing and booting was simulated.
The effects of CO2 on photosynthesis and water use were added to the CERES Wheat simulations. Internally in the model, the daily potential transpiration calculations were modified by the CO2 concentration, due to the effects of CO2 on stomatal conductivity (Peart et al. Reference Peart, Jones, Curry, Boote, Allen, Smith and Tirpak1989). A multiplicative modification was made to daily canopy photosynthesis as described by Curry et al. (Reference Curry, Peart, Jones, Boote and Allen1990). An atmospheric CO2 level of 350 μmol/mol was set for the baseline. The future conditions were simulated with and without any CO2 enrichment (458 μmol/mol according to the emission scenario) to obtain a range of possible impacts.
The automatic adapted sowing date was defined for a given day. This day was considered suitable for sowing from the model when the soil water content in the top layer of soil (the top 150 mm) was between 0·05 and 0·85 of the maximum soil water-holding capacity, while the soil temperature was between 8 and 15°C. The automatic irrigation option implemented irrigation as a function of threshold parameters. These included the depth of the profile (300 mm), where soil moisture and threshold at which irrigation was triggered (defined 0·5 of max available) were controlled everyday. Once the soil water content at the top of the profile drops below this defined threshold, the automatic irrigation system adds water to raise the soil profile to the drained upper limit (Nijbroeka et al. Reference Nijbroeka, Hoogenboomb and Jonesa2003).
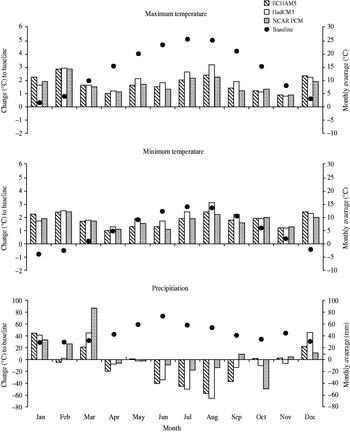
A 100-year daily weather series used as an input to the crop model was produced by the stochastic weather generator (WG) M&Rfi, which was developed from the earlier Met&Roll WG (Dubrovsky Reference Dubrovsky1997; Dubrovsky et al. Reference Dubrovsky, Zalud and Stastna2000, Reference Dubrovsky, Buchtele and Zalud2004). The weather series for the representative site were generated for the baseline period (1961–90) and 2021–50 (termed herein as the future scenario). When generating the weather series for the future climate, the WG parameters were modified according to the climate change scenarios. The climate change scenarios were constructed using a pattern scaling method (Dubrovsky et al. Reference Dubrovsky, Nemesova and Kalvova2005), in which the scenario for a given future (specific climate sensitivity and emission scenario) was defined as a product of the change in global mean temperature by the standardized (accounting for 1°C rise in global mean temperature) climate change scenarios. The standardized scenarios were based on the outputs from ECHAM5, HadCM3 and NCAR PCM global circulation models (GCMs). The change in global mean temperature was determined by simple climate model MAGICC 5·3 (Harvey et al. Reference Harvey, Gregory, Hoffert, Jain, Lal, Leemans, Raper, Wigley, De Wolde, Houghton, Meira Filho, Griggs and Noguer1997; Hulme et al. Reference Hulme, Wigley, Barrow, Raper, Centella, Smith and Chipanshi2000). The climate scenarios were based on the Special Report on Emission Scenarios A1B (Nakicenovic & Swart Reference Nakicenovic and Swart2000) and moderate climate sensitivity (3°C), which implies a change in global mean temperature of 1·28°C (according to the MAGICC model). By comparing the results from three different GCMs it was possible to reduce uncertainties in the climate change scenarios. Maximum and minimum temperature as well as precipitation at baseline, and the changes with respect to the baseline period, are presented in Fig. 3. The final datasets that were used do not explicitly consider changes in the diurnal variability under future climate change conditions and assume that the variability under future climate is the same as under the baseline conditions.
Y (1): Changes of temperature (°C) and precipitation (%) for the three GCMs in the future scenario (2021–50), with respect to the baseline period. Y (2): Monthly average of the maximum and minimum temperature in °C as well as the precipitation in mm for the baseline period (1961–90).

The alternative management practices studied as selected adaptation strategies are described below.
Soil cultivation
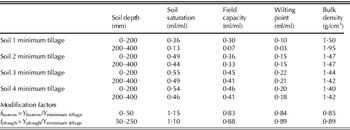
Mouldboard plough with a ploughing depth of 250 mm was replaced by minimum tillage. The impacts on the soil physical properties: plant growth and yield were estimated in a 3-year field experiment comparing both conventional and minimum tillage in Raasdorf (48°15′N, 16°34′E, 156 m a.s.l.) from 2002 to 2004. Soil input data for ploughed and minimum tillage-scenarios were estimated by the model, where undisturbed soil or minimum tillage condition were determined from the values of the Austrian Soil Map (BFW 2007). For the ploughed soil, the first 250 mm soil layer was modified according to laboratory analyses of soil samples, as depicted in Table 2 (Rischbeck Reference Rischbeck2007). This two-tillage practice in the target area with CERES-Wheat was validated by Hlavinka et al. (Reference Hlavinka, Eitzinger, Smutny, Thaler, Zhalud, Rischbeck and Kren2010), who showed that the model is capable, to a certain extent, of mimicking the differences between conventional and minimum tillage.
Soil properties for the four soil classes under minimum tillage (400 mm soil depth) and modification factors of the first 250 mm layer of the soil data for the harrowed (0–50 mm) and ploughed (0–250 mm) soil in the DSSAT soil module (Rischbeck Reference Rischbeck2007)

Hedgerows
Winter wheat yields at various distances from a hedge were compared with unsheltered mid-field yield. Among other benefits, shelters reduce wind speed; therefore, wind speed reductions of 0·25, 0·50 and 0·75 were simulated, based on the study of Gerersdorfer et al. (Reference Gerersdorfer, Eitzinger, Rischbeck and Utset2009).
Snow retention near hedges
The effect of windbreaks on snow near the hedgerows (snow banks) was considered in the simulation. Increased snow retention near hedges enhances the soil moisture after melting in the spring. Based on the snowMAUS model (Trnka et al. Reference Trnka, Kocmankova, Balek, Eitzinger, Ruget, Formayer, Hlavinka, Schaumberger, Horakova, Mozny and Zalud2010b ), information about the duration of snow cover and the snow-water equivalent (in mm) per year was available. During a field trial in Raasdorf in spring 2005, melting water equivalent to c. 158 mm was measured near a representative hedgerow (Gerersdorfer et al. Reference Gerersdorfer, Eitzinger, Rischbeck and Utset2009), a value that was 3·6 times higher than the one predicted by snowMAUS for the same year for unsheltered mid-field conditions. To simulate this additional soil moisture, the snow-water equivalent was added to the precipitation input at the beginning of the vegetation period, where the value of the ‘volume of precipitation in term of snow melt per year’ (snowMAUS) × 3·6/10 was used for the subsequent 10 days. The study region experiences prevailing winds from the north to the west (in more than 0·65 of cases per year), so that the accumulation of snow near hedgerows that are oriented from north to south is common.
Irrigation
To study the crop water demand under climate change scenarios, the automatic irrigation option of the crop model was selected.
The baseline period was simulated with rain-fed farming, including N fertilization and ploughed soil on unsheltered conditions. The reference management in the future scenario also included the CO2 enrichment. For the evaluation and comparison of the model results of the different climate and management scenarios, the following outputs were used: yield (kg/ha), sowing, anthesis and maturity dates, nitrate (N) leached (kg/ha), applied irrigation (mm) and the water use efficiency (WUE) of the crops (WUEplant) and cropping systems (WUEfield), which were calculated between two sowing dates as follows:


RESULTS
Impacts of climate change on winter wheat phenology
According to Alexandrov & Hoogenboom (Reference Alexandrov and Hoogenboom2000) and Trnka et al. (Reference Trnka, Dubrovsky, Semerádová and Zalud2004b ), the projected increases in temperature are expected to lead to shorter growing and reproductive seasons. The duration of the regular crop-growing season of winter wheat (the interval from sowing until physiological maturity area-weighted average) in the simulated future scenario was 17 (NCAR PCM), 18 (ECAM5) and 20 (HadCM3) days shorter than in the baseline period.
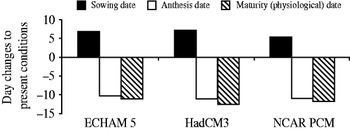
The analysis of these simulated future scenarios also suggested a delay to the sowing date of winter wheat by a maximum of 7 days (ECHAM5 and HadCM3), from 6 to 13 October. Anthesis would occur c. 10 (ECHAM5) to 11 days earlier (HadCM3 and NCAR PCM) and maturity between 11 (ECHAM5) and 13 days earlier (HadCM3) than in the baseline period (Fig. 4).
Changes (in days) of the dates of sowing, anthesis and maturity of winter wheat (area-weighted average) in the future scenario, with respect to baseline conditions.

Impact of climate change on wheat production with unmodified management
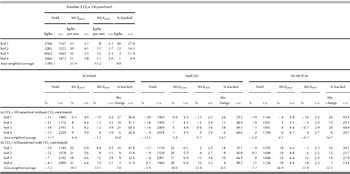
Simulation of changes to future weather conditions without any associated CO2 enrichment using the three GCMs would lead to a yield depression of winter wheat (except for soil 4 – NCAR PCM), especially for soil 1 and 2 in Marchfeld (Table 3 a). A CO2 level of 350 μmol/mol in future would account for a yield change of −18% using ECHAM5, −14% using HadCM3 and −3% using NCAR PCM (area-weighted average), whereas the WUEplant would increase by between 4 and 6% and the WUEfield between −1 and 1% (area-weighted average) with respect to the baseline period. The interannual yield variability of winter wheat would increase for almost all soils (exception soil 1 – ECHAM5 and HadCM3). The yield decreases were caused by a shortened growing season and reductions in the precipitation during the crop-growing season.
Winter wheat yield mean (kg/ha) and s.d., WUE of crops (WUEplant), cropping systems (WUEfield) (kg/ha per mm+s.d.) as well as nitrogen leached (kg/ha+s.d.) for the baseline and changes of winter wheat yield (%), WUE (%) and N leached (abs.) as well as s.d. (absolute value) (a) without and (b) with CO2 enrichment in the future scenario v. the baseline

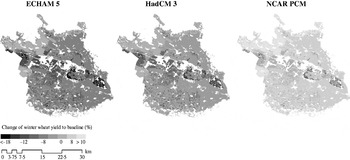
For a CO2 level of 458 μmol/mol, the future scenario simulations predicted lower yield losses or even yield increases in comparison with the ones without any CO2 enrichment (c. +11% by area-weighted average), especially for soil 1 and 2. Yield losses (area-weighted average) of 7 and 4% were predicted by ECHAM5 and HadCM3 respectively, in comparison with the baseline period. The simulated CO2-fertilizing effect could not offset the yield drop. On the contrary, an increase of +7% (area-weighted average) in winter wheat yield was predicted by NCAR PCM (Fig. 5 and Table 3 b). This last GCM also forecasted an annual temperature increase of 2°C and 3% additional precipitation for the region compared to the baseline period. This is the only scenario that showed higher precipitation than for the baseline period (Fig. 3).
Relative change (%) of winter wheat yield to baseline conditions for different GCMs with CO2 enrichment on ploughed soil.

The enhanced levels of atmospheric CO2 were predicted to increase the WUEplant by increasing the growth rates and decreasing the transpiration per leaf area unit (up to 19% area-weighted average), especially for soils with a low available water capacity. These soils showed the highest N leaching rates, which would be even higher without the CO2 enrichment effect due to lower biomass accumulation and N uptake. At the same time WUEfield raised, especially in soils 3 and 4 (Table 3 b).
In the last few decades, the N concentration in the groundwater at Marchfeld has increased to a critical level due to the intensive agricultural crop production practices. Agricultural fertilization is reported to be the main cause for the high concentration of N in the groundwater (Cepuder Reference Cepuder1999). Depending on the amount and intensity of precipitation, the part of N that is not absorbed by the plants remains in the soil or is leached below the crop root zone. It stays in the soil during years with low precipitation and is leached downwards during years with heavy rainfall events.
A field trial, which included the winter wheat cultivar Capo, was carried out in Fuchsenbigl from 1999 to 2001 with conventional crop rotation, to investigate the groundwater quality in the pannonic region in Austria (Cepuder & Schlederer Reference Cepuder and Schlederer2002). The lysimeter N leaching rates ranged from 2·2 to 16·8 kg/ha among three soils. The available water capacity of these soils was between 115 and 138 mm for a 900-mm soil depth, which is in the range of soils 2 and 3 in the present study.
Effects of management adaptation strategies on the winter wheat growth conditions (with CO2 enrichment)
Replacement of ploughing by minimum tillage
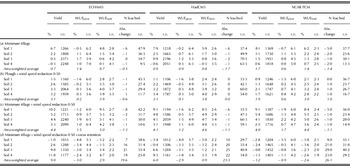
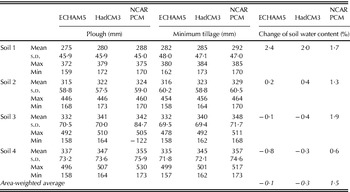
In the climate change modelled scenario, the replacement of ploughing (reference management) by minimum tillage led to an increase in the mean yield for winter wheat of up to 2% (area-weighted average, NCAR PCM). Minimum tillage would potentially enhance the yield up to 8%, particularly for soil 1 (Table 4 a). This positive effect mainly resulted from both improved water supply for the crops and a decrease of unproductive water losses. The relative change of soil water content would increase in soil 1 and 2 in ECHAM5 and HadCM3 and for all soil classes in NCAR PCM (Table 5). Additionally, minimum tillage induced lower N leaching potential in all soil classes (Table 4 a).
Changes of winter wheat yield (relative), WUE (relative) and N leaching (absolute) for the different climate and management change scenarios v. the reference management (=ploughed soil on unsheltered conditions) with CO2 enrichment as well as s.d. (absolute value)

Soil water content (=precipitation–runoff−drainage) on ploughed and minimum tillage soil (mean, s.d., max, min) in the future scenario as well as relative change (%) of soil water content if ploughing were to be replaced by minimum tillage, from sowing until harvest

Effects of hedges on winter wheat yield
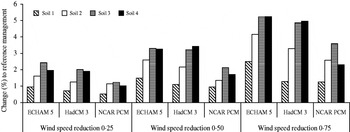
The results of the previous simulation are representative of unsheltered conditions. The effects on the landscape of hedgerows that lie at right angles to the prevailing winds are as follows. The effects of wind speed reductions of 0·25, 0·50 and 0·75 under ploughed soil cultivation were simulated for the applied climate scenarios. As the results show (see Fig. 6 and Table 4 b for wind reduction 0·50), wind speed reductions would raise winter wheat yield. For all cases, the ECHAM5 scenario showed the highest increases, and the NCAR PCM scenario showed the lowest ones. Furthermore, the highest yield raises were found on soils 3 and 4; whereas only minor effects for the two other soil classes.
Relative changes (%) of winter wheat yield in the future scenario with wind speed reductions of 0·25, 0·50 and 0·75 due to hedges on ploughed fields v. the reference management.

In contrast to plough cultivation practices, a combination of minimum tillage with hedgerows (the results are shown only for a wind speed reduction of 0·50) would have the highest impact on soils 1 and 2. An increase in yield of between 4% (NCAR PCM) and 4·4% (ECHAM5) was predicted (for the area-weighted average) compared to the reference management. In addition, a lower N leaching rate and higher WUEplant and WUEfield as well as s.d. was simulated (Table 4 c).
The simulated yield effect of additional snow accumulation near hedgerows for the case of minimum tillage associated with a wind speed reduction of 0·50 is shown in Table 4 d. Additional water input at the beginning of the vegetation period after the snow-melting period was considered in this scenario. The results showed a yield increase of 9% using ECHAM5 and 6% using HadCM3 (area-weighted average) with respect to the reference management. However, NCAR PCM projected a yield loss of 1% under these conditions. The results also show that the highest yield increase (and the lowest decrease, in the case of NCAR PCM) was simulated for soils 3 and 4. The WUEplant and s.d. is lower, the WUEfield is between 3% and −3% and the N leaching would be c. 20–26 kg/ha (area-weighted average) higher than for the reference management.
Changing water demand for potential yields
To answer the question of water demand in the future and stabilize winter wheat yields in the studied area, the simulation option ‘automatic when required’ for irrigation and water management was activated in the model. Baseline conditions, and different climate and management scenarios were simulated with this new option.
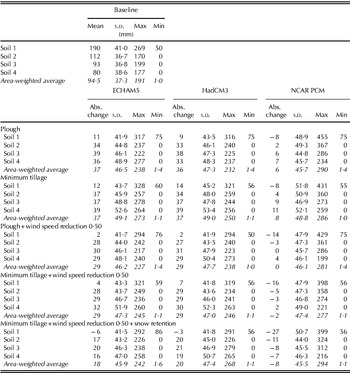
The ECHAM5 and HadCM3 scenarios led to similar results concerning any additional water demand to maintain the potential winter wheat yield level. The highest extra amount of water due to climate change (up to 39 mm more water during the growing season) was required for soils 3 and 4 (Table 6). In the baseline scenario, soil 1 already showed relatively low potential yields and a high water demand, while any additional irrigation would not help to obtain better results. Under the applied climate scenarios, the soils with very low water-storage capacity only need slightly more or rather less water to achieve a similar yield than the currently one; thus, water is not predicted be a strong limiting factor in the climate scenarios considered in the present paper for these soils in the case of a winter wheat crop.
Simulated winter wheat water demand (mm) for the baseline period (mean, s.d., max, min), changes of water demand (absolute) under the different climate and management scenarios v. baseline as well as s.d., max and min

An additional amount of 37 mm of water (area-weighted average) during the growing season would be required for the maintenance of the potential yield level according to ECHAM5 and HadCM3 in both tillage scenarios. As the growing season of winter wheat would be >10 days shorter due to higher temperatures and c. 7–8 months long, a mean value of up to 37 mm more water required is a significant amount. The range of maximum and minimum water demand is higher under minimum tillage. NCAR PCM, the wettest scenario, predicted the lowest water requirement in the future: 6 mm more for ploughed conditions and 8 mm more for minimum tillage. At the same time, soils 1 and 2 both showed the maximum range with this GCM: this was >100 mm higher than with ECHAM5 or HadCM3. Hedges helped to reduce the water demand, when a wind speed reduction of 0·50 was assumed. ECHAM5 and HadCM3 predicted an additional 29 mm, while NCAR PCM predicted 0 mm under ploughed conditions and −2 mm under minimum tillage (the area-weighted average). Changes of +18 mm using ECHAM5, +20 mm using HadCM3 and −8 mm using NCAR PCM (the area-weighted average) were simulated by minimum tillage, a wind speed reduction of 0·50 and additional water input from melted snow banks. The s.d. was higher than for the baseline for all climate and management scenarios.
DISCUSSION
Climate change is predicted to lead to an increase of 2°C in the mean air temperature with respect to the baseline period in north-eastern Austria (Fig. 3). The GCMs used in the present study forecast a change of annual precipitation of −15% using ECHAM5, −12% using HadCM3 and +3% using NCAR PCM; these methods predict a strong reduction in rainfall, particularly for the summer months. For the critical spring winter wheat growing period (April–June), ECHAM5 and HadCM3 show a significant reduction in rainfall for June, more than 30% in the scenarios considered in the present paper. Higher annual temperatures will extend the vegetation period, increase CO2 concentrations, enhance plant growth and consequentially improve the vegetative cover. These advantages might be offset by the increased water stress experienced by specific annual crops, such as winter wheat, during summer and shorter growing periods. A high winter wheat yield loss under future conditions was simulated by ECHAM5 and HadCM3 due to additional crop water stress. However, under the NCAR PCM scenario a yield increase would be expected due to additional precipitation during the spring growing period of winter wheat. At the same time, the interannual yield variability of winter wheat would increase, which would lead to higher economic risks for farmers. The most vulnerable areas, where yield losses can be expected for drier spring conditions, are the regions with low soil water-storage capacity. In this particular case, the additional annual precipitation predicted by NCAR PCM or any additional irrigation would not help to increase the yield in the future.
A common uncertainty in climate change impact-simulation studies for crops is the CO2-fertilizing effect, which can vary widely under different environmental conditions. For this reason, the simulations took into account the impact of climate change both with and without CO2 enrichment. The CERES model uses constant multipliers for the daily total crop biomass under elevated CO2, which are equally applied to both stressed and unstressed growth conditions (Tubiello et al. Reference Tubiello, Amthor, Boote, Donatelli, Easterling, Fischer, Gifford, Howden, Reilly and Rosenzweig2007). Free-air CO2 enrichment experiments have shown a more complex picture. In fact, it is impossible to simulate in detail the high variability due to cultivars and environmental conditions, considering that many processes related to them are still unknown (Kartschall et al. Reference Kartschall, Grossman, Pinter, Garcia, Kimball, Wall, Hunsaker and Lamorte1995; Fuhrer Reference Fuhrer2003; Kersebaum et al. Reference Kersebaum, Nendel, Mirschel, Manderscheid, Weigel, Wenkel, Sivertsen, Skjelvåg, Orlandini, Sivakumar, Eitzinger, Nejedlik, Alexandrov, Toulios, Calanca, Stefanski, Motha, Gamedze, Trnka, Smith and Netland2008). The present simulations without and with CO2 enrichment show a high variation in the winter wheat yield, where the yield differences amount to c. 10% of the area-weighted average. Related to the interaction between the CO2 effect and an improved WUE, higher N leaching was simulated in all scenarios, when no CO2 enrichment was considered.
The only set of adaptations that does not consider irrigation and would lead to higher yields under any GCM (with CO2 enrichment) compared to the baseline period (area-weighted average), were a combination of minimum tillage and hedgerows, inducing a wind reduction of 0·50 and snow retention. To maintain the baseline yield level, the minimum adaptation to implement is the combination of either minimum tillage and hedgerows (using HadCM3) or minimum tillage, hedgerows and snow retention (using ECHAM5). According to NCAR PCM, any CO2 enrichment would increase the yield, and no adaptation would be necessary to maintain the baseline yield. Without any CO2 enrichment, none of the adaptation sets could improve the baseline yield using ECHAM5 or HadCM3, whereas minimum tillage could maintain the yield level using NCAR PCM. The set of adaptation applied in the first two GCMs can only help to reduce negative climate change effects.
The simulated multiple effects of potential adaptation options under climate scenarios, simulated for the next few decades for winter wheat, clarified several aspects that may be useful for decision makers to increase the resilience of winter wheat-dominated cropping systems in the semi-arid Marchfeld region. These aspects are summarized as follows. The introduction of minimum tillage improved crop water supply and decreased unproductive water losses due to a higher plant-available water-storage capacity in the soil, in particular for soils 1 and 2 where a change in tillage practices could help reduce yield losses in the near future. Additionally, higher soil water contents and WUE and reduced N leaching rates could be expected.
A change in the landscape structure, such as the introduction of windbreaks or hedges, influenced the microclimate of crops in neighbouring fields, mainly by slowing down the wind speed. Further effects were: an increased dew formation and leaf-wetness duration and a reduction of dry air advection, evapotranspiration, unproductive water loss and wind erosion (Cleugh et al. Reference Cleugh, Miller and Bohm1998; Mayus et al. Reference Mayus, Van Keulen and Stroosnijder1999). All these effects are expected to result in an increase of crop yields under semi-arid climate. However, increased leaf-wetness duration may cause a higher incidence of crop diseases, an effect, which was not considered in the model.
The present simulations, which include different wind speed-reduction effects, confirm these often-reported positive effects. This is especially true for soils 3 and 4, which are the prevailing soil conditions in Marchfeld. Higher winter wheat yield and soil water content associated with lower N leaching, were simulated here.
A combination of different adaptation options could further increase the positive effects on the winter wheat yield. For example, a yield increase of up to 4% (area-weighted average) and a lower N leaching rate (compared to the reference management) were simulated under the combination of minimum tillage with hedgerows considering a wind speed reduction of 0·50.
An additional effect of windbreaks could also have a positive impact on the crop yield through an improved soil water budget in the spring (Kuemmel Reference Kuemmel2003). In particular, this positive yield effect was due to an additional water input at the beginning of the vegetation period under the ECHAM5 and HadCM3 scenarios with reduced spring precipitation. Even though a higher yield was simulated in this case, negative side effects such as a higher N leaching rate and a lower WUE were also found. This demonstrates that a combination of several adaptation options does not necessarily provide positive effects but can also result in negative effects that need to be carefully evaluated under the specific local conditions (Olesen et al. Reference Olesen, Trnka, Kersebaum, Skjelvåg, Seguin, Peltonen-Sainio, Rossi, Kozyra and Micale2011).
The water demand was projected to increase (under most of the future climate scenarios) in order to maintain similar yield levels compared to actual conditions. However, the present study has shown that the additional water demand could also be effectively reduced with adaptation strategies other than irrigation. Negative side effects should also be taken into account. This includes the N leaching rate, which could increase up to 300% on soil 4, with regard to the baseline conditions with optimum irrigation.
Transferring into practice the findings of this study requires further research and scientific efforts, and should be addressed especially in the field of crop and climate change modelling.
The contribution by Dr Trnka was supported by the Research Plan No. MSM6215648905, ‘Biological and technological aspects of sustainability of controlled ecosystems and their adaptability to climate change’ and KONTAKT project no. LH11010. The development of the climate-change scenarios (by M. Dubrovsky) were funded by the project IAA300420806, sponsored by the Grant Agency of Academy of Sciences of CR.