


Introduction
The areal distribution of δ18O (multi-year mean value of 18O/16O relative to standard mean ocean water (SMOW), in ‰) in Antarctica has been discussed, among others, by Reference MorganMorgan (1982), Reference Lorius and RubinLorius (1983), and Reference Dahe, Petit, Jouzel and StievenardQin and others (1994). In general, most of the studies concentrate on the strong correlation between δ18O and T (multi-year mean surface temperature, in K), but other variables and parameters are considered (e.g. Reference Fisher and AltFisher and Alt, 1985; Reference Jouzel, Russell, Suozzo, Koster, White and BroeckerJouzel and others, 1987). This study presents multivariate models in which δ 18O is the dependent variable; the independent variables include T, L (latitude in degrees south), H (surface elevation in m), and D (multi-year mean shortest distance to open ocean denoted by the 20% sea-ice concentration boundary in km). There is no significant change in the statistics if a different concentration is used (e.g. 10%).
Stepwise regression analysis is used as a model-building procedure that is sensitive to covariation between independent variables (e.g. Reference CochranCochran, 1957; Reference Davis and SampsonDavis and Sampson, 1973). At each step the variable that contributes most to increasing R 2 (the coefficient of determination) enters a model on the basis of statistical rather than physical criteria Inversions of these models are applied to a database for 1351 gridpoint locations 100 km apart to produce distributions of δ18O for grounded-iee and ice-shelf areas.
In the following sections, all statistics are significant at the 99.99% confidence level (F sialistic under the null hypothesis show ing a probability P ≤ 0.0001) unless stated otherwise. The exceptions to this are some listings of R (correlation coefficient) in correlation matrices as well as R p (partial correlation coefficient entries in the stepwise procedures in which some R, R p values ≪0.5 would correspond to P ≫0.0001. These ancillary statistics are separate from (i) the confidence level selected to perform a particular analysis and determine which variables contribute at that level (or better) to the explanation of variation, and (ii) the P value attained by the model (e.g. Reference Tabachnick and FidellTabachnick and Fidell, 1989).
Sample Site Database
The location of 443 sites in Antarctica for which δ18O values have been reported are shown in Figure 1. The base map was not corrected following major calving events of the last two decades; otherwise some sites would appear to lie on the ocean. The compilation for this study includes data for 189 siles from 22 sources as listed by Reference MorganMorgan (1982), which includes a site on sea ice. and for another 251 sites as reported by Reference Clausen, Dansgaard, Nielsen and CloughClausen and others (1979), Reference AristarainAristarain (1980), Reference Lorius and RubinLorius 1983 . Reference Bromwich and WeaverPoller and others :1984, Reference Reinwarth, Graf and KohnenReinwarth and Graf (1985), Reference Reinwarth, Graf, Stichler, Moser and OerterReinwarth and others (1985), Reference Mosley-Thompson, Bradley and JonesMosley-Thompson (1992), Reference Peel, Bradley and JonesPeel (1992), Reference GrafGraf and others (1994), Reference Isaksson and KarlénIsaksson and Karlén (1994). Reference Dahe, Petit, Jouzel and StievenardQin and others (1994) and Reference RenRen and others (1995). Of these, data for 33 sites in Graham Land and eastern Palmer Land regions (grounded ice, ice shelf and island areas) will be analyzed in a separate study. Notices of δ18O data for a total of approximately 20 other sites were received after the completion of the analyses (separate personal communications from M. Graven, E. Isaksson, and V. Morgan, August 1996).
Antarctica, showing the location of 443 sites for which δ18O values have been reported (full squares). Site locations are correct relative to coordinates; the base map in plotting software is not up to date. Named in the text: EA, WA (East and West Antarctica), GL, PL (Graham and Palmer lands), FRIS, AIS, RIS (Filchner–Ronne, Amery, and Ross Ice Shelves), and BI, RI (Berkner and Ross Islands)

Data on three independent variables (L, H, T) were obtained from the original sources for approximately three-quarters of the sites. Missing H and T data were obtained by interpolation from maps of surface contour lines (Reference Drewry and DrewryDrewry, 1983) and surface isotherms (Reference Giovinetto and ZwallyGiovinetto and others, 1990). Missing T and/or H data for four sites could not be reliably obtained by interpolation and were removed from the database. The δ 18 O, L, H, and T data thus assembled in a dataset called N406; (N denotes the number of sites in the set) and were complemented with a determination of D from a sea-ice distribution compilation (United States Navy, 1985) using a method described in an earlier study (Reference Giovinetto and ZwallyGiovinetto and Zwally, 1996).
Two aspects of the sample site database should be noted. The first is that no attempt was made to reconcile discrepancies in the spatial location of approximately 20 sites sampled by two or more parties at different times. Thus, a site may appear as two or more in Figure 1, and/or may be entered in the database with two or more different values of a particular variable.
The second aspect is that δ18O values for many sites were obtained by conversion of δD (2 H/1 H relative to SMOW in ‰). In the compilation of Reference MorganMorgan (1982), the δ 18O values for 35 sites as reported by Reference Lorius, Merlivat and HagemannLorius and others (1969) were obtained using

The δD values reported by Reference Mosley-Thompson, Bradley and JonesMosley-Thompson (1992) for the South Pole, and Reference GrafGraf and others (1994) for 28 sites on the Filchne–Ronne Ice Shelf, are compiled for this study using

which in the Iormat of Equation (1) converts to

derived by us from (δ 18 O δD data for 103 of 104 sites as reported in Reference Dahe, Petit, Jouzel and StievenardQin and others (1994) (R = 0.999 and the root mean square (rms) residual is 2.58).
Gridpoint Database
The origin lines to determine the 1351 gridpoint locations are meridians 0° − 180°, and 90° W−90° E. The perimeter of the grid was determined using an updated map (Reference Drewry and DrewryDrewry, 1983), uncorrected for major calving events as staled for Figure 1. The data for each Iocationvvcre obtained by interpolation: L 1 (latitude in degrees south) from a polar stereographic projection with standard parallel at 71° S, H i (surface elevation in m) from the compilation of Drowry (1983), T i (multi-year mean surface temperature in K) from the compilation of Reference Giovinetto, Waters and BentleyGiovinetto and others (1990), and D i multi-year mean shortest distance to the open ocean denoted by the 20% sea-ice concentration boundary in km) obtained from the same source and by the same method as described above for D in the sample site database.
There is a strong correlation between H i and the surface elevation obtained for 1072 of the 1351 gridpoint locations that lie in areas of ERS-1 radar altimeter coverage (R is 0.985; rms is 203). The large scatter indicates a large error in the H i data, which is in part due to round-off (to 0.1°) L i and longitude values entered in the database. This implies potential errors in location by several km north to south, and in most areas of at least 1km east to west, whereas the ERS-1 data resolution is 500 m (Reference WinghamWingham, 1995). Moreover, the rms is largely determined by the disparity noted in approximately 80 gridpoint locations that lie in regions of steep-surface gradient near mountain ranges, ice termini or grounding lines. In these regions, visual interpolation from contour lines to obtain H i is not as reliable as in the interior, and the bilinear interpolation from the ERS-1 database may be biased by inclusion of ice shelf or exposed rock areas (satellite altimeters “illuminate” areas with a radius of approximately 10 km (Reference WinghamWingham, 1995)). Substituting satellite altimetry data for those locations improved the correlation between H i and ERS-1 data (R is 0.995; rms is 116). The bulk of the H i data are not updated for this study.
There is also a strong correlation and large scatter (R is 0.978; rms is 2.3) between T i and mean annual surface temperature obtained by bilinear interpolation for all gridpoint locations from Nimbus-7 Temperature Humidity Infrared Radiometer (THIR) data for 1979 (Reference ComisoComiso, 1994). The largest discrepancies between the two temperature sets are found, as discussed above in reference to elevation data, in regions of steep-surface gradient. In these regions, the visual interpolation from isotherms to obtain T i, is not as reliable as in the interior, and the bilinear interpolation from the THIR database with a resolution of about 30 × 30 km (Reference ComisoComiso, 1994) may be biased by inclusion of ice shelf, sea ice, or exposed rock areas. However, no part of the T i data were updated for this study because the point-data, on which the isotherms pattern is based, are mostly means for periods of diverse duration lapsing a few decades (Giovinotto and others, 1990), whereas the THIR data are the mean for a single year. Preliminary studies indicate that use of THIR data to derive δ18O would not produce large differences in most of the area of the ice sheet, but could be large (±4‰) in parts of some drainage basins.
Analyses
Sample site dataset (N406)
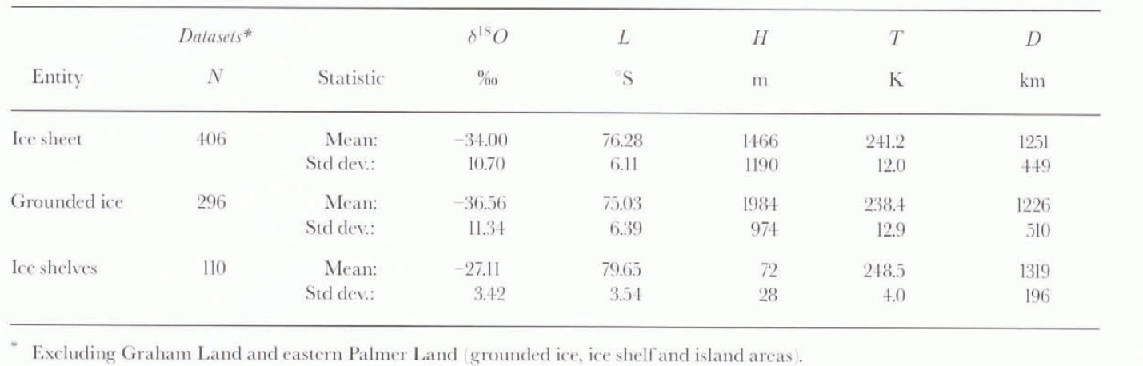
The descriptive statistics for the sample site dataset are summarized in Table 1, and the correlation matrix is shown in Table 2. As expected, there is a strong correlation between δ 18O and T (R is 0.959); the mean value of R for the four primary regressions (i.e. between δ O and each of the four independent variables is (1.725. The covariation between any two independent variables is, at best, moderate. However, the mean R value for T = f(L), T = f(H), and D = f(L), D = f(T) is 0.675, (i.e. only 0.050 smaller than the mean for the primary regressions). The lack of correlation between T and L (R is 0.366) should be expected because approximately one-quarter of the data correspond to sites on the Ross and Filchner–Ronne Ice Shelves, where temperature is relatively high in low elevation areas that lie at high latitude. The expected correlation between T and L is found in the analyses of sub-sets discussed later.
Descriptive statistics
Correlation matrices

Stepwise analysis of δ 18O = f(L, H, T, D) show that all variables enter the model, with T, D, and H contributing noticeable improvements in correlation: L enters last contributing a negligible improvement in rms (Table 3). The robust model (R is 0.976; rms is 2.33)

is applied to the grid database to produce the distribution of δ 18O shown in Figure 2. This distribution shows general agreement with the range of values and pattern of isopleths drawn by Reference MorganMorgan 1982 in increments of 10‰. The agreement on the range of values falters toward the barrier on the Filehner–Ronne and Ross Ice Shelves. The agreement in pattern is better on East Antarctica than on West Antarctica. The larger dataset and multivariate approach used in this study suppports a more detailed pattern. Nevertheless, it should be noted that the contour increment in Figure 2 (2‰) is smaller than the error of prediction.
Distribution δ18O = f(Ti, Di, Hi, Li). Model based on N406 dataset applied to database for 1351 gridpoint locations 100 km apart. Graham Land and eastern Palmer Land regions are omitted. Dotted lines depict grounding lines (the grounding line on the western boundary of the Ross Ice Shelf is roughly coincident with the −30 isopleth). Dashed lines show δ18O contours in increments of 1‰ Ross Island and the northern zone of the Ross Ice Shelf are excluded by the coarse-grid sampling method (the map boundary lies 10 km beyond outer gridpoints)

Summary of Stepwise regression analyses (δ 18O as the dependent variable)

Grounded ice sub-set (N296)
The descriptive statistics and correlation matrix for the data obtained from sites that lie on the conterminous grounded ice sheet are listed in Tables 1 and 2. There are strong correlations between δ18O and T, and between δ 18O and H (R values of 0.959 and 0.876, respectively). The mean value of R for the four primary regressions is 0.815. Covariation between independent variables is strong in the cases of D and L, and T and H (R values of 0.926 and 0.897, respectively); the mean R value for T = f(L), T = f(H) and D = f(L), D = f(T) is 0.764 i.e. only 0.051 smaller than the mean for the primary regressions). In this sub-set, covariation between L and the other independent variables renders its contribution as not significant.
Stepwise analysis show that only three variables enter the model (T, D, H, in this order; seeTable 3); L would enter at the 90% confidence level contributing negligible improvements (of t he order of 10−4) in R and rms values. The robust model (R is 0.976; rms is 2.49)

is applied to the N1351 database to produce the distribution Of δ 18O for the grounded ice sheet shown in Figure 3. It is similar to the distribution obtained using Equation (3), except for smoother contours close to the grounding lines, particularly south of the Filchner–Ronne Ice Shelf and east of the Ross Ice Shelf.
Ice-shelves sub-set (N 110)
The descriptive statistics and correlation matrix for the data obtained from sites on ice-shelf areas (including ice rises and islands connected by ice) are also listed in Tables 1 and 2. There is a moderate Correlation between δ 18O and L (R is 0.834); it is the largest R value in the matrix, as well as the largest obtained for the relationship in either the N406 set or the N296 sub-set. The mean value of R for the three primary regressions (excluding δ 18O = f(H)) is 0.784. The mean value of R for T = f(L), and D = f(L), D = f(T) is 0.729 (i.e. 0.055 smaller than the mean for the primary regressions). In this sub-set. covariation between H and the other independent variables, as well as a weak correlation with (δ 18O, renders its contribution as not significant.
The stepwise analysis shows that only three variables enter the model (L, D and T, in this order; see Table 3); H would not enter the model even if run at the 90% confidence level. The robust model (R is 0.868, rms is 1.72)

is applied to the N1351 database to produce the distribution of δ 18O shown in the area of the Filchner–Ronne and Ross Ice Shelves (Fig. 3). Only a few gridpoints lie on the Amery Ice Shelf; a smaller grid mesh (e.g. 25 km) would be required to produce reliable contours on this, and smaller, ice shelves.
The isopleth values on the Filchner–Ronne and Ross Ice Shelves obtained using Equation (3) show approximately the same range as those that would be obtained using Equations (4) or (5), except in relatively small regions in the northwest of the Filchner–Ronne Ice Shelfand in the north-cast of the Ross Iee Shelf. In most of the area of each ice shelf, the largest difference in δ 18O values obtained for any gridpoint location using any two models is smaller than the summation of the two smallest predictive errors (square root of the sum of rms2 is 2.90). Differences in (δ 18O values >2.9‰ are noted between isopleths on the northwestern areas of both ice shelves and isopleths on the grounded ice because of contouring procedures. The general orientation of the isopleths produced by the three models is approximately the same; in the case of Equations (3) and (4) in response to the dominance of the temperature and distance terms, and in the case of Equation (5), due to the strength of the covariation between latitude, temperature, and distance, described above.
Distribution of δ18O = f (Ti, Di, Hi) on the conterminous grounded ice area based on the N 296 data sub-set, and of δ18O = f(Li, Di, Ti) on the Filchner–Ronne and Ross Ice Shelves based on the N110 data subset (dashed lines in contour increments of 1‰). Contours on smaller ice shelves are not valid. Produced from the same grid database used for Figure 2

The distribution produced using Equation (5) on the Filchner–Ronne Ice Shelf shoves good agreement with the detailed distribution presented by Reference GrafGraf and others (1994) in the area west of Berkuer Island, both in δ 18O values and in the orientation of the isopleths. However, the distribution on the Ross Ice Shelf shows little agreement with the detailed distribution of δ 18O contoured by Reference Clausen, Dansgaard, Nielsen and CloughClausen and others (1979). There is agreement in the short segments of the −31‰ and −30‰ isopleths drawn in the south, and on the isopleth pattern drawn on the northeast, although the modeled δ 18O values are isotopically cooler by up to ~5‰ in the small region northeast of Roosevelt Island. The main difference between the two distributions shows in the central and northwestern areas of the ice shelf. There, the isopleths drawn by Reference Clausen, Dansgaard, Nielsen and CloughClausen and others (1979) show a definite northwest to southeast orientation rather than the east to west orientation shown in Fig. 3), and the modeled δ 18O values are isotopically warmer by up to ~4‰. It is evident that the modeled distribution in the Ross Ice Shelf has short-comings which, in part, may be reduced by changes in the contouring algorithm and/or by increasing the grid density (from 100 km to fid km, thus approaching the sample site “grid” of approximately 55 km used by Reference Clausen, Dansgaard, Nielsen and CloughClausen and others (1979). Another possible way to improve the model’s reliability would be to force the stepwise procedure entering temperature first and obtain partial correlations for distance and latitude, to continue the run, or to run these as a set i.e. use a setwise regression procedure: Reference Tabachnick and FidellTabachnick and Fidell (1989)).
Discussion and Conclusions
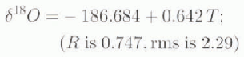
In general, inversions of well-documented simple linear regression models δ 18O = f(T) are used to infer temperature variations from δ 18O series obtained in shallow-pit and intermediate-depth ice-core samples. In Table 3 it is shown that such a model, which corresponds to step 1 in the analysis of the N406 set, is robust:

However, adoption of a multivariate model as defined in step 4 of the procedure and described by Equation 3 shows only a minor increase in R (0.017) but a significant reduction in rms (0.71). These differences are an assessment of the gain in model reliability attained by the inclusion of distance, elevation and latitude.
The use of stepwise regression analyses to define models and produce contoured areal distributions δ 18O have the attribute of excluding variables that would not add to the explanation of variation. The negative aspect, namely that variables enter a model at particular confidence levels based on statistical rather than physical criteria, should not present a problem if the limitation is clearly understood. Examples of this are found in the analyses ofthe sub-sets for grounded ice (N296) and ice shelves (N110):
-
(i) The analysis of sub-set N296 shows that alter the run δ 18 O = f(T), The residual variation of δ 18O is best explained by D rather than H, and second, that L does not contribute to the explanation of variation except at the 90% confidence level (and minimally if the procedure is run at that level). The gain in model reliability attained by the inclusion of D and H is assessed comparing Equation (4), and the bivariate version
(7)
It shows a minor increase in R (0.023) but a significant reduction in rms (0.71).
-
(ii) The analysis of sub-set N110 shows that due to the strength of the covariation between L, D and T, these enter the model in the reverse order than would be suggested on the basis of physical criteria. The relevant aspect is that inversion of Equation (5) produces a more reliable pattern depicting the distribution of δ 18O on the basis of temperature alone:
(8)The gain in model reliability is assessed by an increase in R (0.121) and a reduction in rms (0.57).

The distribution of δ 18O produced using Equation (3) (Fig. 2), and that produced using Equation (4) and (5) (Fig. 3), show that the isopleth patterns derived from the sub-sets are less intricate in the zones upwind and downwind from the grounding lines, particularly in the southeastern area of the Filchner–Ronne Ice Shelf. This is a tangible attribute of the combined pattern because the largest differences between (δ 18O values generated for the ice-shelf areas using Equations (3), (4) or (5) are relatively small, as was discussed in a preceding section.
Caution should be exercised either to define a model using dala collected from, or use results of its inversion applied to, locaiions that lie at <100 km upwind or downwind from grounding lines, or on terminal slopes where the surface gradient is >l%. In these zones the proportion of drilling snow mixed with “local” precipitation would be different from a “normal” mix for outlying areas. In the context of this study, inclusion of data from sites to define a model would also affect the reliability ofthe distributions produced from inversions applied to grid data. The problem can be minimized by removal of data for sites that lie in those zones. To assess this, data for 72 sites that lie in zones as described above were removed from the dataset. Stepwise analysis of the reduced set (N321) showed a robust model (R is 0.977, rms is 2.22)

in which the partial correlations were similar through every step; thus, and relative to Equation (3), the variables entered the model in the same order. Nevertheless, there is a reduction in rms of 0.11, and most importantly, changes in the coefficients for D and L of 26% and 67%, respectively. This suggests that if a much larger number of data sites are complied in the future, analysis of sub-sets for grounded-ice and ice-shelf areas screened following the criteria described above, could provide improved definitions of Equations (4) and (5), and therefore a more reliable pattern than that shown in Figure 4. The same screening criteria applied to regional datasets (e.g. on die Ross Ice Shelf) showed a relatively greater improvement in R and rms values; however, reports for other areas suggest that variations in the proportion of drifting snow do not affect δ 18O values (e.g. Reference Bromwich and WeaverBromwich and Weaver, 1983).
The basic models presented (Equations (3), (4) and (5)) show two distributions of δ 18O (Fig. 2),3)) over a continental-scale area with a relatively large range in latitude, elevation, temperature and distance from source. These are considered in detailed studies of advection (e.g. Reference Robin, Johnsen and RobinRobin and Johnsen, 1983; Reference FisherFisher, 1990) as well as the derivation of ice-flow adjustments for δ 18O series obtained from deep ice-core or ablation-zone samples (e.g. Reference Dansgaard, Johnsen, Clausen and GundestrupDansgaard and others, 1973; Reference Budd, Young and RobinBudd and Young, 1983).
Overall, it should be noted that D enters all models at the second step, contributing increases in R values of 0.013 for the grounded-ice model, and of 0.021 for ice-shelf model, as well as decreases in rms of 0.51 and 0.11, respectively. The response of δ 18O, as well as T in the context of δ 18O distributions, to distance to open ocean has been noted, among others, by Reference KatoKato (1979), Reference KoernerKoerner (1979), and Reference Bromwich and WeaverBromwich and Weaver (1983). The findings from the stepwise models substantiate those described in the earlier studies based on regional datasets.
Acknowledgements
The authors gratefully acknowledge the contributions of A. J. Aristarain, E. Isaksson. V. I. Morgan, H. Oerter and E. Tull in locating data, of S. Fiegles, S. E. Gammell, D. Phillips, R. E. Poitras, and T. Seiss in data processing, and of V. I. Morgan, E. J. Steig, and N. M. Waters for reviewing the manuscript.



