Left Ventricular mass has been used to predict cardiovascular risk in adults,Reference Bluemke, Kronmal and Lima 1 and it probably has similar predictive value in children. With increasing severity of left ventricular mass defined as mild to moderate to severe based on the recommendations by the American Society of Echocardiography and European Association of Echocardiography, there was a 1.3-fold increased risk for death and cardiovascular disease events for each category in an adult cohort of 2545 patients.Reference Barbieri, Bursi and Mantovani 2 The Fourth Report on the Diagnosis, Evaluation, and Treatment of High Blood Pressure in Children and Adolescents therefore recommended intensification of antihypertensive management in the presence of left ventricular hypertrophy. 3 It is a challenge, however, to differentiate the component of left ventricular mass that is adaptive or physiologic secondary to increase in body size, physical training, and growth from the component resulting from a pathological process. A simple and uniform left ventricular mass measure is needed for tracking transitions from youth to adults, for understanding its predictive values and long-term significance in children.
A variety of methods have been used to differentiate growth-related contribution to left ventricular mass. These include normalising left ventricular mass as an index by dividing left ventricular mass by body weight, height, or body surface area. These traditional indices had limited success owing to the non-linear relationship between body size and left ventricular mass. Consequently, allometric approaches with different powers are estimated and generated with the help of computer software designed to output the highest correlations between the observed and predicted left ventricular mass values. These are then studied and verified in the appropriate populations. The allometric approaches such as left ventricular mass/height2.7 have been applied and validated in adults as one of the more sensitive indicators for future cardiovascular events than the traditional body surface area.Reference de Simone, Kizer and Chinali 4 In children and adolescents, left ventricular mass/height2.7 was reported to reduce the variability related to age, gender, and race,Reference de Simone, Daniels and Devereux 5 although there was an inverse relationship with height during the first 10 years of life. For children, left ventricular mass-for-height percentile curves (Z scores) were found to be superior to left ventricular mass/height2.7 in children.Reference Foster, Mackie, Mitsnefes, Ali, Mamber and Colan 6 With the use of Z scores in children, however, it is unclear how values change or evolve from children and adolescents to adults.
A recent report points out that the traditional use of left ventricular mass indexing with body surface area and height2.7 did not take into account the contributions of gender-related differences. In addition, left ventricular mass indexing with body surface area and height2.7 tends to overcorrect for height by artificially increasing left ventricular mass index in short individuals and by lowering left ventricular mass index in tall individuals.Reference Chirinos, Segers and De Buyzere 7 With the inclusion of gender-related differences, these authors make a compelling argument that indexing with height1.7 is superior in predicting future cardiovascular outcomes.Reference Chirinos, Segers and De Buyzere 7 In addition, they also validated indexing with height1.7 when left ventricular mass was measured by magnetic resonance imaging, opening the door for its broader use beyond echocardiography. The use of left ventricular mass/height1.7 has not been reported in children and adolescents. In the absence of long-term cardiovascular outcome studies in children, obesity, as measured by body mass index, has traditionally been used, although a poor surrogate, as one of the potential cardiovascular risk factors.
This investigation sought to answer four basic questions:
-
• Does body mass index correlate with echocardiographic measures of left ventricular mass/height1.7 in children and adolescents, and how does it compare with left ventricular mass/body surface area and left ventricular mass/height2.7 in children and adolescents?
-
• How do left ventricular mass/height1.7 values change or evolve from children and adolescents to adults?
-
• Do left ventricular mass/height2.7, left ventricular mass/body surface area, and left ventricular mass/height1.7 show any gender-related differences?
-
• How do left ventricular mass/height2.7, left ventricular mass/body surface area, and left ventricular mass/height1.7 compare in their ability to detect left ventricular hypertrophy associated with increasing body mass index in overweight and obese children?
Methods
A total of 787 patients were each evaluated by a paediatric cardiologist of a community hospital between January, 1996 and June, 2011. Referral diagnoses in most studied patients included heart murmur in 640, chest pain in 126, palpitations in 79, and dizziness in 25 patients. After evaluation, all of the presenting symptoms were found to be non-cardiac – non-cardiac chest pain, non-paroxysmal caffeine-related palpitations and neurocirculatory dizziness. Heart murmurs were innocent murmurs. Children who had documented hypertension, syncope, and suspected or documented cardiac pathology based on history, clinical evaluation, electrocardiograms, and two-dimensional and Doppler echocardiography were excluded. Every effort was made to include only patients with normal hearts.
To assess the first three objectives, 692 out of 787 clinically normal patients with normal heart, 1 day to 18 years of age, were studied. Children who were 2 years of age and older in this group were non-obese – body mass index <95th percentile for age and gender.Reference Kuczmarski, Ogden and Guo 8 Children who were 2 years of age and older and who were obese – body mass index ≥95th percentile for age and gender – or had hypertension were excluded from this group of 692 children. In addition, Z scores for the left ventricular mass to further verify that the enrolled population was representative of normal population were also calculated.
To assess the fourth objective, the remaining 95 patients – out of 787 patients – who were 2 to 18 years of age who were obese (body mass index ≥95th percentile for age and gender) were studied. Their data were compared with 95 control patients from the above pool of 692 patients – randomly assigned by the software to match for age and gender – who had a body mass index <85th percentile for age and gender. Patients with a body mass index of ≥85th percentile but <95th percentile for age and gender were excluded from this comparison analysis between the two groups as these patients are considered “at risk of being overweight”.Reference Himes and Dietz 9 Of the 95 patients in the obese group, 46% were obese (44/95, with a body mass index ≥95th but <97th percentile), and 54% were extremely obese (51/95, with a body mass index ≥97th percentile). Overall, 50 of the 95 obese patients had normal (<90th percentile) systolic and diastolic blood pressure.Reference Kuczmarski, Ogden and Guo 8 Of the remaining 45 patients, 32 had a high systolic blood pressure only (≥90th percentile), six patients had a high diastolic blood pressure only (≥90th percentile), and seven patients had both high systolic and diastolic pressures. These blood pressures were noted at the time of their initial visit and may not necessarily imply the presence of hypertension. The study was approved by the Institutional Review Board.
Subject measures
All patients had their body weight measured in kilograms, height in centimetres, heart rate in beats per minute, respiratory rate in breaths per minute, and blood pressure in millimetres of mercury by a cardiac nurse. Each subject underwent clinical evaluation by a single paediatric cardiologist. Resting blood pressures were taken with a sphygmomanometer in the right arm with the subject comfortably seated, their legs hanging, and their right arm at heart level with the appropriate size cuff as described by The Fourth Report on the Diagnosis, Evaluation, and Treatment of High Blood Pressure in Children and Adolescents. 3 Patients were allowed 5–15 min to settle down before blood pressure measurements were taken. Diastolic blood pressures were measured at phase five of the Korotkoff sound. In 13 of the 692 patients, reliable blood pressures could not be obtained (10/13 were ≤2 years old). In an additional four patients, diastolic blood pressures could not be defined clearly beyond the phase five Korotkoff sound. For correlations, body surface area was calculated by the HaycockReference Haycock, Schwartz and Wisotsky 10 method as it has been shown to be the most appropriate method.Reference Sluysmans and Colan 11
Echocardiographic measures
Echocardiograms included standard two-dimensional and Doppler studies of the left-sided heart structures. All studies were performed with a commercially available ultrasound system (Sonos 5500 or IEE 33 Philips Medical System, Andover, MA and Bothell, Washington, United States of America) with the patients in the supine and in the left lateral decubitus position. All patients underwent a complete two-dimensional, colour flow Doppler, and spectral Doppler examination, and all measurements were taken according to the standard recommended laboratory protocol. Two-dimensionally guided Motion-mode measurements were made for the interventricular septum in end diastole and end systole, the left ventricular posterior wall in end diastole and end systole, and the left ventricular dimension in end diastole and end systole from a parasternal long-axis view at the level of the tips of the papillary muscles using the leading edge to leading edge technique.
Although left ventricular mass can be measured by two-dimensional methods, in the current study it was calculated by Motion-mode measurements. Left ventricular mass was indexed to body surface area, height in metres raised to the 2.7 power, and height in metres raised to the 1.7 power. Z scores, based on left ventricular mass-for-height percentile curves, were calculated according to the data published by Foster et al.Reference Foster, Mackie, Mitsnefes, Ali, Mamber and Colan 6 Absolute left ventricular mass was calculated during diastole (left ventricular mass = 0.8 × {1.04[(left ventricular internal diameter + posterior wall thickness + septal thickness)3 − (left ventricular internal diameter)3]} + 0.6 g) based on the recommendations for chamber quantification: as reported by the American Society of Echocardiography's Guidelines and Standards Committee and the Chamber Quantification Writing Group, developed in conjunction with the European Association of Echocardiography, a branch of the European Society of Cardiology (December, 2005).Reference Lang, Bierig and Devereux 12
Statistical analysis
The dependent variables in this study were left ventricular mass/height2.7, left ventricular mass/body surface area, and left ventricular mass/height1.7 from echocardiographic measures. The primary independent variable was body mass index. Age, systolic blood pressure, diastolic blood pressure, heart rate, and body surface area were considered as potential confounders of the associations of interest. Simple linear regression was used to assess associations with body mass index and left ventricular mass index. To assess gender influence, dependent variables were compared across the two groups using Student's t-tests. Gender-specific data on left ventricular mass/height1.7 were analysed in quantile distribution for 50th and 90th percentiles to assess transitional values to adult age. Statistical significance was defined a priori as a p < 0.05. The data are presented as means and standard deviation.
Results
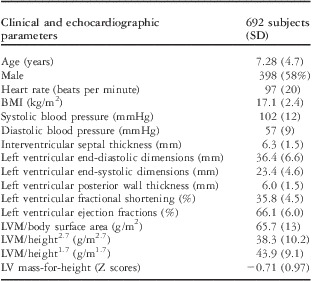
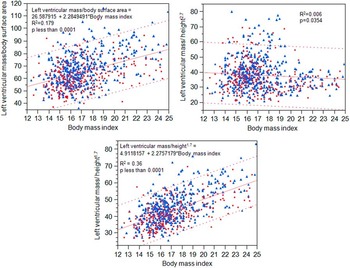
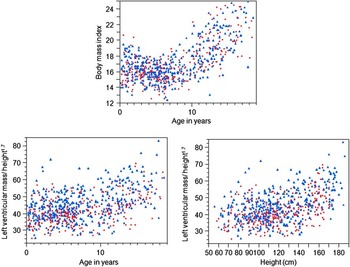
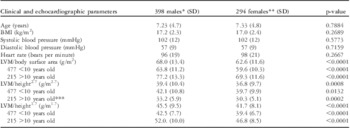
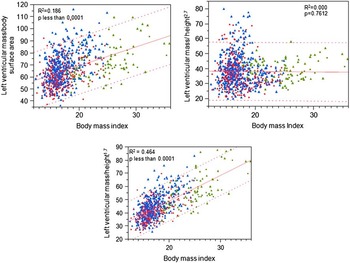
Patient demographics and four left ventricular mass index parameters as measured by echocardiography are listed in Table 1. Z scores of the left ventricular mass in the enrolled 692 normal non-obese patients were on the conservative side – below the expected zero – and they had normal Gaussian distribution with an expected standard deviation of 1 (0.97). A correlation with age, height, and body mass index showed that Z scores were well adjusted for height (p = 0.36566) and age (p = 0.1290) but increased slightly with increasing body mass index (R2 = 0.154; p <0.0001). Figure 1 shows correlations data between body mass index and three different left ventricular mass index measures in children and adolescents. Body mass index correlated with left ventricular mass/height1.7 better (R2 = 0.36) than left ventricular mass/body surface area and left ventricular mass/height2.7, although all three dependent variables show a significant correlation. In addition, left ventricular mass/height2.7 had a negative correlation with body mass index. To address at what age left ventricular mass/height1.7 values in children and adolescents become similar to normal adult values, age-related graphs of left ventricular mass/height1.7 values from children and adolescents were studied. Although they were not the original objectives of the current study, these less-known age-related graphs in Figure 2 and 3 were felt to be relevant.
Patient demographics and LVM index parameters as measured by echocardiography.

BMI = body mass index; LV = left ventricle; LVM = left ventricular mass; SD = standard deviation
Body mass index and left ventricular mass correlations with left ventricular mass/body surface area, left ventricular mass/height2.7, and left ventricular mass/height1.7 in 692 normal non-obese children (● = females; ▴ = males).

Increasing body mass index was primarily noted after 10 years of age in 692 normal non-obese children. A similar pattern with age and height was observed with left ventricular mass/height1.7 (● = females; ▴ = males).

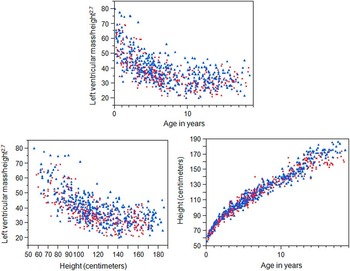
Left ventricular mass/height2.7 had an inverse relationship with age in 692 normal non-obese children, and most of it was related to patients who were younger than 10 years (height = 104, SD = 19 cm; R2 = 0.44, p < 0.0001) and not in those more than 10 years (height = 156, SD = 13 cm; R2 = 0.001, p = 0.614). A similar pattern was observed with height only (decline cut off ∼120 cm) despite continuing increase in height with age (● = females; ▴ = males).

Not shown in Figures 2 and 3 are the correlations separated by age. No significant correlations (p > 0.05) were observed between age and body mass index, and age and left ventricular mass/height1.7 before 10 years of age (Fig 2). In children younger than 10 years, left ventricular mass/height1.7 correlated poorly with height (R2 = 0.014) but showed a fair correlation with body mass index (R2 = 0.16; p < 0.0001, most patients with a body mass index <19.5 kg/m2, Fig 1). Increasing body mass index was noted primarily after 10 years of age (R2 = 0.26; p < 0.0001, Fig 2); a similar trend with age was noted with left ventricular mass/height1.7 (R2 = 0.14; p < 0.0001, Fig 2). Left ventricular mass/height1.7also increased with height (R2 = 0.18; p < 0.0001, at height ≥128 cm, Fig 2). In contrast, during the first 10 years of life, left ventricular mass/height2.7 had an inverse relationship with age and height (below 120 cm of height), despite continuing increase in height with age (Fig 3). Left ventricular mass/height2.7 measurements were higher in 20 patients who were under 10 years of age and who were short (height ≤5th percentile for age and gender) compared with 33 taller patients (height ≥95th percentile for age and gender), but this difference was not statistically significant (43.7 ± 13.2 versus 40.5 ± 10.8 g/m2.7, respectively; p = 0.3750). Correlations with age for the entire group of 692 patients for left ventricular mass/body surface area (R2 = 0.25) and left ventricular mass/height1.7 (R2 = 0.21, Fig 2) were significant (p < 0.0001) but inversely related (R2 = 0.36, Fig 3) with left ventricular mass/height2.7 (p < 0.0001).
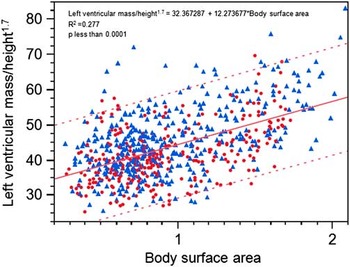
The change or evolution from paediatric levels to adult levels for left ventricular mass/height1.7 in females occurred at an average age 13.5 ± 2.2 years (body mass index = 19.5 ± 2.4 kg/m2) with 50th and 90th percentile values at 46 and 58 g/m1.7; in males, it occurred at an average age 16.4 ± 0.9 years (body mass index = 21.4 ± 2.2 kg/m2) with 50th and 90th percentile values at 56 and 75 g/m1.7. These data would permit monitoring of transitional values of left ventricular mass from childhood to adulthood for longitudinal studies or during clinical follow-up. Figure 4 shows correlations between left ventricular mass/height1.7 and body surface area.
Correlations between left ventricular mass/height1.7 and body surface area in 692 non-obese children (● = females; ▴ = males).

Gender-related differences of left ventricular mass indices, the study's third objective, are listed in Table 2. Significant age-related changes in body mass index were noted at ≥10 years of age. Therefore, data for patients <10 years and ≥10 years were reported separately.
Gender-related differences and LVM index parameters as measured by echocardiography.

BMI = body mass index; LVM = left ventricular mass; SD = standard deviation
*For LVM index subgroups <10 years, male:female = 275:202
**For LVM index subgroups >10 years, male:female = 123:92
***95th percentile for male:female = 45:40 g/m2.7
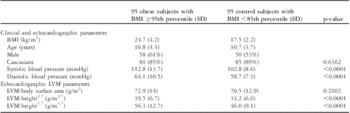
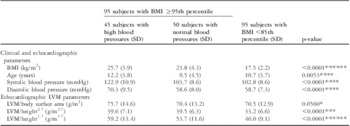
In addressing the fourth objective of this study, Table 3 summarises the selected demographic and left ventricular mass/height2.7, left ventricular mass/body surface area, and left ventricular mass/height1.7 measurements in 190 patients. There were 95 obese children whose data were compared with 95 age-matched controls. Obese children had significantly higher left ventricular mass/height2.7 and left ventricular mass/height1.7 in addition to higher systolic and diastolic blood pressures. Obese children, therefore, were further separated as obese with high blood pressure (blood pressure ≥90th percentile) and obese with normal blood pressure (blood pressure <90th percentile), as seen in Table 4. These were compared separately again with the above mentioned 95 age-matched controls.
Selected patient demographics and three different methods of calculating LVM in 95 obese children with a BMI ≥95th percentile versus 95 age- and gender-matched control children with a BMI <85th percentile.

BMI = body mass index; LVM = left ventricular mass; SD = standard deviation
Selected patient demographics and three different methods of calculating LVM in 95 obese children (BMI ≥95th percentile): 45/95 with blood pressures ≥90th percentile for age and gender, and 50/95 with blood pressures <90th percentile for age and gender versus 95 age- and gender-matched control children with a BMI <85th percentile.

BMI = body mass index; LVM = left ventricular mass; SD = standard deviation
*Significant difference between 45 obese children with high blood pressure and 95 control children with a BMI <85th percentile
**Significant difference between 50 obese children with normal blood pressures versus BMI <85th percentile
***Significant difference among 95 obese children: 45 of whom with high blood pressures versus 50 children with normal blood pressures
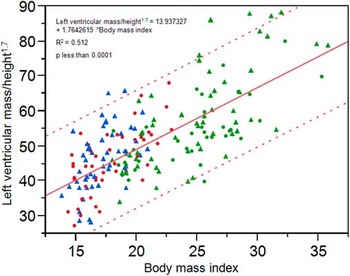
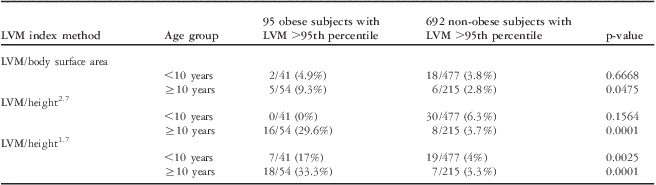
In all, 45 patients who were overweight and had higher blood pressure were significantly older than 50 children who did not have higher blood pressure or 95 children who were not overweight. Left ventricular mass/height1.7 data were significantly different among the three groups, which was not the case with the other two methods (Table 4). Although all three left ventricular mass indices correlated significantly (p < 0.0001) with body mass index in this group of 190 patients, the correlations (R2) were strongest with left ventricular mass/height1.7 (R2 = 0.512, Fig 5) versus left ventricular mass/height2.7 (R2 = 0.129) or left ventricular mass/body surface area (R2 = 0.139). These correlations did not change significantly for left ventricular mass/height1.7 and left ventricular mass/body surface area, but did not reach significant levels for left ventricular mass/height2.7 (Fig 6) when left ventricular mass measurements from 95 obese patients were added to the initial group of 692 normal children with body mass index ≤95. In addition, a higher percentage of obese patients were noted to have high left ventricular mass (>95th percentile for age and gender) as measured by left ventricular mass/height1.7 than the other two methods (Table 5).
Correlations between body mass index and left ventricular mass/height1.7 in 190 patients; 95 in Obese group (● = females, ▴ = males) and age matched 95 in Control group (● = females; ▴ = males).

Body mass index and left ventricular mass correlations (787 children) with left ventricular mass/body surface area, left ventricular mass/height2.7, and left ventricular mass/height1.7 in 692 normal non-obese children (● = females; ▴ = males) with an additional 95 obese children (● = females; ▴ = males).

Using three different methods of LVM measurements, the number of subjects having LVM values >95th percentile in 95 obese children with BMI ≥95th percentile versus a larger control sample of 692 non-obese children with a BMI <95th percentile.

BMI = body mass index; LVM = left ventricular mass
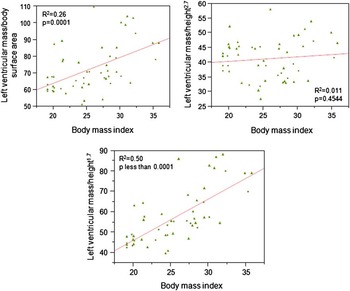
There was a relative lack of proportional rise in left ventricular mass/height2.7 with increasing body mass index in 51 extremely obese children who are much more likely to have left ventricular hypertrophy (Fig 7). In contrast, there was a high correlation with body mass index and left ventricular mass/height1.7 (R2 = 0.5, Fig 7) in these same children.
Body mass index and left ventricular mass correlations with left ventricular mass/body surface area, left ventricular mass/height2.7, and left ventricular mass/height1.7 in 51 extremely obese children – body mass index ≥97th percentile for age and gender – ● = females; ▴ = males).

Discussion
The reported findings in children and adolescents in the current study indicate that among the three indices (left ventricular mass/height1.7, left ventricular mass/body surface area, and left ventricular mass/height2.7) left ventricular mass/height1.7 correlates most strongly with obesity. In addition, a higher percentage of obese patients were noted to have elevated left ventricular mass as measured by left ventricular mass/height1.7 than the other two methods (Table 5). All three left ventricular mass index derivatives showed significant gender-related differences. The transition of left ventricular mass/height1.7 from paediatric to adult values occurs at a mean age of 13.5 years in females and at a mean age of 16.4 years in males. Left ventricular mass/height1.7 appears to be a useful index across the continuum of age from childhood to adulthood.
Although indexing left ventricular mass with body surface area is traditional, previous studies have shown that it resulted in errors in estimating the impact of being overweight – as defined by body mass index – as the premise behind the correction with body surface area incorrectly assumes its relationship with left ventricular mass to be linear with zero intercepts.Reference de Simone, Daniels and Devereux 5 Therefore, an argument has been made for an allometric approach such as left ventricular mass/height2.7 as a better marker for detection of ventricular hypertrophy in children and adults.Reference de Simone, Kizer and Chinali 4
Daniels et alReference Daniels, Kimball, Morrison, Khoury, Witt and Meyer 13 have shown that lean body mass accounts for 75% of the variance of left ventricular mass, whereas fat mass and systolic blood pressure explained only 2% of the variance. The body mass index of the present study of 692 patients who were non-obese with relatively more lean body mass and less fat mass was expected to correlate strongly with left ventricular mass. With the two allometric approaches, this was the case with both left ventricular mass/height1.7 and left ventricular mass/height2.7. Body mass index, however, had a stronger correlation with left ventricular mass/height1.7 (R2 = 0.36) than left ventricular mass/height2.7 (R2 = 0.006). In children <10 years of age, left ventricular mass/height2.7 declined with increasing age and height (Fig 3). This initial decline at younger age most likely resulted in the overall lower correlations for left ventricular mass/height2.7 with body mass index. Owing to a larger sample size of the current study compared with the previously reported study,Reference de Simone, Daniels and Devereux 5 the inverse relationship between left ventricular mass/height2.7 and increasing height in children <10 years of age becomes much more evident (Fig 3).
Similar to the reported observations of the current study, Khoury et alReference Khoury, Mitsnefes, Daniels and Kimball 14 reported that left ventricular mass/height2.7 declined in children <9 years with age, height, and body mass index. These authors provided the appropriate normative data for this younger age group. Studies on left ventricular mass/height2.7 have been very helpful in evaluating left ventricular mass in patients who are >9 years where values of left ventricular mass/height2.7 >40 g/m2.7 in girls and >45 g/m2.7 in boys were defined as abnormal, being >95th percentile.Reference Khoury, Mitsnefes, Daniels and Kimball 14 The reported values in the current study, including the gender-related differences, are very similar to the values for left ventricular mass/height2.7 reported by these authors (Table 2). However, re-analysis of data from the Multi-Ethnic Study of Atherosclerosis that enrolled 6814 White, Black, Hispanic, and Chinese adults aged 45 to 84 years from six United States communities showed that the measurements of left ventricular mass index with the use of left ventricular mass/height2.7 resulted in overestimations of left ventricular hypertrophy in individuals with shorter body height and underestimations of left ventricular hypertrophy in individuals with greater body height.Reference Chirinos, Segers and De Buyzere 7
The normal reference values for left ventricular mass/height1.7 have been reported primarily in adults (35–84 years). The reported 50th and 90th percentile for females were 45–46 and 57 g/m1.7, and for males were 56–60 and 75 g/m1.7, respectively.Reference Chirinos, Segers and De Buyzere 7 Similar values were obtained in older children in the current study. Left ventricular mass/height1.7 in girls at an average age of 13.5 years was 46 and 58 g/m1.7 at 50th and 90th percentile respectively; in boys at an average age of 16.4 years, left ventricular mass/height1.7 was 56 and 75 g/m1.7 at 50th and 90th percentile, respectively. It is likely that this gender-related delay in transition from paediatric to adult values is related to normal pubertal changes where growth spurt – peak height velocity – varies by gender, occurring ∼2 years earlier in girls than in boys (11–12 years versus 13–14 years, respectively).Reference Tanner and Davies 15 Pubertal changes at this age strongly influence lean body mass, thus resulting in appropriate changes in left ventricular mass. Future studies, along with Tanner staging, may confirm this hypothesis.
The major concern of this study, despite aggressive efforts to exclude patients with any cardiac pathology, is whether they represent “normal children” as they were referred to a subspecialist. Despite normal clinical examinations and echocardiograms, additional steps were taken to evaluate their Z scores of left ventricular mass as an initial step. Z scores of left ventricular mass in 692 reported patients, if at all, were on the conservative side – below expected level of zero. In addition, they had normal Gaussian distribution and an expected standard deviation of 1 (0.97). A comparison with published values of normal left ventricular mass/height2.7 was further attestation that the current study population represented “normal children and adolescents” as the values were remarkably similar.Reference Khoury, Mitsnefes, Daniels and Kimball 14 A word of skepticism is also appropriate with regard to the presence of higher left ventricular mass reported by the three different methods (Table 5), as the study shows only the association and is unable to address the issue of cause and effect relationship. As mentioned above, the presence of higher blood pressures during single observation alone in older children (Table 4) does not necessarily imply the presence of hypertension. Despite adequate sample size, this study also suffers from limitations inherent to any retrospective analysis.
Although body mass index correlations with left ventricular mass/height2.7 can be used in older children and adults, the use of left ventricular mass/height2.7 in children <10 years is limited unless normative data reported by Khoury et alReference Khoury, Mitsnefes, Daniels and Kimball 14 are used routinely. A lack of difference in left ventricular mass/height2.7 between obese patients with high blood pressure who were older than patients without high blood pressure (Table 4) could have been related to how left ventricular mass/height2.7 correlations switch from its inverse relationship in <10-year-old children to the older age group (Fig 3). Prospective studies are needed to address this challenge. In contrast, left ventricular mass/height1.7 offers the opportunity to use this index at any age with easy transition from adolescence to adults. The gender-related differences in left ventricular mass probably represent lean body mass and requires further studies and confirmation.
With higher correlations, left ventricular mass/height1.7 deserves further studies to determine its clinical applicability. In contrast to higher cardiovascular risk with increasing left ventricular mass, a low cardiovascular risk is associated with a lower left ventricular mass.Reference Gidding, Carnethon and Daniels 16 As these abnormalities are reversible by weight loss, early detection of these abnormalities has important therapeutic and preventive implications.Reference Ippisch, Inge and Daniels 17 Until more information is available by large-scale prospective studies regarding the relative contribution of body mass index and left ventricular mass on coronary artery risk factors among children and adolescents, the reported observations of the current study support recommendation to include left ventricular mass/height1.7 for research and clinical evaluations.
Acknowledgement
I am deeply indebted to Irwin Jacobs, MD, and Marshall Jacobs, MD, for providing their valuable criticisms and suggestions to improve the manuscript.