1 Introduction
Flow past a flexibly mounted circular cylinder has been studied extensively (e.g. Bearman Reference Bearman1984; Blevins Reference Blevins1990; Sarpkaya Reference Sarpkaya2004; Williamson & Govardhan Reference Williamson and Govardhan2004; Vandiver Reference Vandiver2012). Typically, a flexibly mounted rigid circular cylinder is placed in water or air flow and when the frequency of vortex shedding locks in with the system’s natural frequency as a result of increasing flow velocity, a region of relatively large-amplitude oscillations, called the lock-in region, is observed. This is called vortex-induced vibration (VIV). A circular cylinder allowed to oscillate perpendicular to the flow direction constitutes a geometrically symmetric system. Several studies exist on flow-induced oscillations of bluff bodies where the structure’s symmetry is broken. Once the structure is asymmetric, the angle of attack plays a major role in the response of the system and besides the VIV-type responses, galloping-type responses can be observed. Galloping is the term normally used for oscillations with a large amplitude and a low frequency (Parkinson & Smith Reference Parkinson and Smith1964; Païdoussis, Price & De Langre Reference Païdoussis, Price and De Langre2010). Prisms with square, rectangular, triangular or D-shaped cross-sections are among the asymmetric structures prone to galloping instability. A complete review of the previous studies on galloping can be found in a book by Païdoussis et al. (Reference Païdoussis, Price and De Langre2010).
Prisms with square cross-sections have fixed separation points and the geometry of the afterbody makes the prism susceptible to both VIV and galloping. Interactions between the flow forces and solid body of the prism with square cross-section have been widely studied using both experimental results and numerical simulations (e.g. Parkinson & Wawzonek Reference Parkinson and Wawzonek1981; Obasaju, Ermshaus & Naudascher Reference Obasaju, Ermshaus and Naudascher1990; Naudascher & Wang Reference Naudascher and Wang1993; Deniz & Staubli Reference Deniz and Staubli1997; Su et al.
Reference Su, Yu, Hongjun and Dongfei2007; Nemes et al.
Reference Nemes, Zhao, Lo Jacono and Sheridan2012; Zhao, Cheng & Zhou Reference Zhao, Cheng and Zhou2013). Early studies by Parkinson & Smith (Reference Parkinson and Smith1964) showed the existence of galloping instability in a square cross-section at zero angle of attack (
 $\unicode[STIX]{x1D6FC}=0^{\circ }$
, which corresponds to the case where the flat face of the square cross-section is placed perpendicular to the flow). Later on, in an experimental study, Bokaian & Geoola (Reference Bokaian and Geoola1984) discussed the existence of mixed modes of VIV and galloping in such structures. Recently, in a comprehensive experimental study by Nemes et al. (Reference Nemes, Zhao, Lo Jacono and Sheridan2012) on a flexibly mounted square prism, it has been shown that, depending on the angle of attack, the prism can undergo either VIV or galloping. They showed that for angles of attack smaller than
 $\unicode[STIX]{x1D6FC}=7.5^{\circ }$
, the square prism experiences galloping. Also, it was observed that the transition from VIV to galloping occurs in a narrow range of angles of attack,
 $\unicode[STIX]{x1D6FC}=7.5^{\circ }{-}10^{\circ }$
, mainly due to a jump in the location of the separation point. In continuation of this work, Zhao et al. (Reference Zhao, Leontini, Lo Jacono and Sheridan2014) studied the three different flow-induced vibration (FIV) mechanisms observed in a square prism to shed light on the synchronization between the body oscillation and the flow forces. They showed that at angle of attack
 $\unicode[STIX]{x1D6FC}=0^{\circ }$
, where galloping occurs, there were regions where the vortex shedding frequency was synchronized to integer multiples of the oscillation frequency. They also discussed that only odd-integer multiple synchronization should occur for such a system, with symmetric orientation with respect to the incoming flow. Distinct regimes with multiple synchronization and different wake modes were also identified for
 $\unicode[STIX]{x1D6FC}=45^{\circ }$
, where the response was dominated by VIV.
In studies on a rectangular prism, in addition to the effect of the angle of attack, the aspect ratio of the cross-section also plays an important role in galloping instability of the structure. In a recent work, Cui et al. (Reference Cui, Zhao, Teng and Cheng2015) studied the response of a rectangular prism with an aspect ratio of 0.5 through two-dimensional numerical simulations. The response of the rectangular prism was found to be generally dominated by galloping at angles of attack of
 $\unicode[STIX]{x1D6FC}=0^{\circ }$
and
 $\unicode[STIX]{x1D6FC}=90^{\circ }$
(where
 $0^{\circ }$
corresponds to the case where the long side is perpendicular to the incoming flow). A combination of galloping and VIV was observed for
 $\unicode[STIX]{x1D6FC}=0^{\circ }$
in the range of reduced velocity of
 $U^{\ast }=7{-}11$
, where the reduced velocity is defined as
 $U^{\ast }=U/f_{nw}D$
, with
 $U$
,
 $f_{nw}$
and
 $D$
being the fluid velocity, the natural frequency of the system in otherwise still fluid and the width of the prism in the direction perpendicular to the flow, respectively. At
 $\unicode[STIX]{x1D6FC}=90^{\circ }$
, the galloping response of the rectangular prism did not occur until the reduced velocity exceeded
 $U^{\ast }=22.5$
.
In the present study, we consider the flow-induced response of a triangular prism. Most studies on flow past a triangular prism have focused on a fixed cylinder. Mainly the effects of flow direction as well as the cross-sectional shape have been studied (Kumar, De & Dalal Reference Kumar De and Dalal2006; De & Dalal Reference De and Dalal2007; Bao, Zhou & Zhao Reference Bao, Zhou and Zhao2010). In a recent study by Tu et al. (Reference Tu, Zhou, Bao, Han and Li2014), two-dimensional flow past a stationary cylinder was studied numerically for the range of angles of attack of
 $\unicode[STIX]{x1D6FC}=0^{\circ }{-}60^{\circ }$
and Reynolds-number range of
 $\mathit{Re}=50{-}160$
. It was concluded that, depending on the angle of attack, the location of the separation point changes: for angles of
 $\unicode[STIX]{x1D6FC}<30^{\circ }$
, the location of the separation point changes with the Reynolds number, while at higher angles, the separation point is located at the rear corner, independent of the Reynolds number. A topological map of flow patterns was also summarized in their work for the observed patterns in the wake of a stationary triangular prism.
Srigrarom & Koh (Reference Srigrarom and Koh2008) experimentally studied the self-excited rotations of a triangular prism in water flow at a constant incoming flow velocity. Dye flow visualizations as well as particle image velocimetry (PIV) measurements were conducted to discuss the observed rotating oscillations. In a numerical study, Tu et al. (Reference Tu, Zhou, Bao, Han and Li2014) observed both 2S (two single vortices shed during one period of oscillations) and
 $\text{P+S}$
(one pair of vortices and a single vortex shed during one period of oscillations) flow patterns in the wake of a triangular prism forced to rotate about its centre, at
 $\mathit{Re}=50$
, 100 and 150. Wang et al. (Reference Wang, Zhu, Zhang and He2011) studied the interaction of two freely rotating triangular prisms placed in tandem at a Reynolds number of
 $\mathit{Re}=200$
. They conducted a series of numerical simulations to study the effect of the spacing between the two prisms and found that, depending on the spacing ratio
 $d/D$
(where
 $d$
is the distance between the circumcentres of the two prisms and
 $D$
is the diameter of the circumcircle of the triangular prism), different responses were observed: periodic rotations at
 $d/D=2.0$
, quasi-periodic autorotations at
 $d/D=3.0$
, and more complicated irregular autorotations at
 $d/D=4.0$
and
 $5.0$
.
Studies conducted on the transverse oscillations of a triangular prism are based on either wind tunnel experiments for low-aspect-ratio prisms, or two-dimensional numerical simulations of laminar flow past a prism forced to oscillate in the transverse direction (Alonso, Meseguer & Pérez-Grande Reference Alonso, Meseguer and Pérez-Grande2005; Alawadhi Reference Alawadhi2013). In an experimental study conducted by Alonso et al. (Reference Alonso, Meseguer and Pérez-Grande2005), transverse oscillations of a triangular prism with a low aspect ratio of
 $L/h=1.45$
(where
 $L$
is the spanwise length of the prism and
 $h$
is the height of the triangular cross-section) placed in a wind tunnel were studied at different angles of attack varying from
 $0^{\circ }$
to
 $180^{\circ }$
, at wind velocities of
 $7$
–
 $26~\text{m}~\text{s}^{-1}$
. The set-up was designed such that the triangular prism was attached to a beam that was hinged at its end and the rotation of the beam allowed a pendulum-like motion of the prism. Galloping instability zones were identified with respect to the angles of attack for six different triangular cross-sections with varying main vertex angles. They showed that the galloping instability is dependent on both the angle of attack and the main vertex angle of the prism. Alonso & Meseguer (Reference Alonso and Meseguer2006) also conducted a parametric study on a similar triangular prism and investigated the effects of varying angles of attack and main vertex angles through static wind tunnel experiments at a constant flow velocity of
 $20~\text{m}~\text{s}^{-1}$
. The transition to galloping instability was studied based on the Glauert–Den Harton criterion in which the galloping instability is assumed to be closely related to the sign of the slope of the lift coefficient versus the angle of attack (Parkinson & Smith Reference Parkinson and Smith1964). A map of potential instability zones was provided showing the regions in which the body could experience instability based on the variation of the two influencing parameters studied. Also, Alonso, Sanz-Lobera & Meseguer (Reference Alonso, Sanz-Lobera and Meseguer2012) showed that hysteresis exists at angles of attack where there are inflection points in the lift coefficient curve.
In a numerical simulation of laminar flow (
 $\mathit{Re}=100$
) past a triangular prism forced to oscillate in the transverse direction, the influence of different frequencies and amplitudes of oscillations on the lift and drag forces acting on a triangular prism were studied (Alawadhi Reference Alawadhi2013). It was concluded that when the frequency of oscillations is close to the Strouhal number of a stationary triangular prism, the lift coefficient reaches its maximum value.
In the present work, we experimentally investigate the influence of different angles of attack and varying flow velocities on the pure translational oscillations of a triangular prism placed in water flow. We use a prism with a relatively large aspect ratio, equipped with an endplate to minimize the end effects. The goal of this study is to obtain an overall view of how a triangular prism placed at different angles of attack responds to flow forces, and to investigate the existence and the possible interactions of the VIV-type and galloping-type responses in this system.
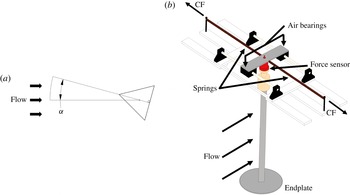
(a) The definition of the angle of attack with respect to the incoming flow direction, as well as (b) a schematic of the experimental set-up.

2 Experimental set-up and method
2.1 The set-up
An equilateral triangular prism with sides of
 $D=16$
mm and a length of
 $L=292$
mm (
 $L/D=18.25$
) was tested for angles of attack of
 $\unicode[STIX]{x1D6FC}=0^{\circ }$
–
 $60^{\circ }$
with increments of
 $5^{\circ }$
(figure 1
a). The prism was made of aluminium and each side was ground, yielding a smooth surface. Attached to the bottom of the prism was a
 $115$
mm diameter circular endplate with a thickness of approximately
 $2$
mm and tapered edges to reduce end effects. The prism was attached to an air bearing set-up, allowed to oscillate in the transverse (cross-flow) direction. The air bearing set-up had two air bearings to reduce the damping and to constrain the oscillations of the prism to one degree of freedom in the cross-flow (CF) direction (figure 1
b). Springs were attached from the air bearing set-up to a fixed housing. This set-up was used previously by Seyed-Aghazadeh, Carlson & Modarres-Sadeghi (Reference Seyed-Aghazadeh, Carlson and Modarres-Sadeghi2015b
) to study VIV of tapered cylinders where the response of a uniform circular cylinder was shown to be in agreement with the results of Khalak & Williamson (Reference Khalak and Williamson1999).
For comparison, a circular cylinder made of aluminium with diameter
 $D=16$
mm, and the same length,
 $L=292$
mm, was considered as well. A 200 g dummy mass was used to adjust the mass ratio of the circular cylinder to that of the triangular prism,
 $m^{\ast }=9.24$
(
 $m^{\ast }=m/\unicode[STIX]{x1D70C}AL$
, where
 $m$
is the total moving mass,
 $\unicode[STIX]{x1D70C}$
the fluid density,
 $A$
the cross-sectional area and
 $L$
the length). All moving parts were accounted for in this calculation, including the dummy mass, air bearings, mounting bracket, force sensor and various cabling.
2.2 Flow quality
The recirculating water tunnel used featured a test section with the dimensions
 $1.27~\text{m}\times 0.5~\text{m}\times 0.38~\text{m}$
. The flow profiles were measured using bubble image velocimetry (BIV). The cathode to generate hydrogen bubbles was a platinum wire
 $50~\unicode[STIX]{x03BC}\text{m}$
in diameter, held taut in pure cross-flow via streamlined mounting plates affixed to the test section walls. At 35 mm downstream of the cathode, a carbon plate was submerged at the midpoint of the test section, oriented parallel to flow, and served as the anode. By completing the anode–cathode circuit with a 50 V, 0.25 A DC power source, the voltage passing from the cathode separated hydrogen from the water. Hydrogen bubbles accumulated on the trailing face of the wire until they surpass the wire diameter, at which point they were shed downstream. Thus, a uniform bubble sheet was generated across the width of the test section with a bubble size of approximately
 $50~\unicode[STIX]{x03BC}\text{m}$
. For viewing purposes, light-emitting diode (LED) lighting banks were mounted at a
 $45^{\circ }$
angle to the bubble plane to ensure uniform lighting conditions. A high-speed camera facing perpendicular to the cross-flow–streamwise plane captured frames at 120 frames per second. The entire platinum array was traversed vertically to several different horizontal planes to capture the vertical nature of the flow profile.
Velocimetry analysis was done via open-source PIV software, PIVlab (Thielicke & Stamhuis Reference Thielicke and Stamhuis2014). The field was interrogated with two passes:
 $64\times 64$
pixel down to
 $32\times 32$
pixel areas with 50 % overlap. The resultant vector field was restricted to values less than three standard deviations above the mean to mitigate numerical error. The flow velocity was measured using the time-averaged values for the vector space directly near the platinum wire. For calculating flow uniformity of the cross-section, 30 mm was cropped from either end where the wire was connected to the wall to exclude the boundary layer effects from this calculation. Measurements were conducted at
 $30$
,
 $76$
,
 $120$
and
 $170~\text{mm}~\text{s}^{-1}$
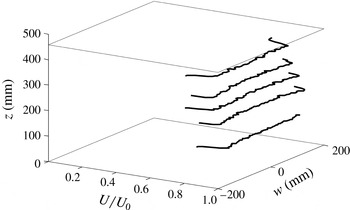
, and at each flow velocity at four different heights. Figure 2 shows a sample case of the measurements at a flow velocity of
 $76~\text{mm}~\text{s}^{-1}$
, based on these measurements, the flow uniformity across the test section was calculated and it was found to be within 2–8 % for the range of flow velocities used in the current experiments.
The flow profile measured along the width of the test section (the
 $w$
-direction) at different heights (the
 $z$
-direction) for a sample flow velocity of
 $U_{0}=76~\text{mm}~\text{s}^{-1}$
.

2.3 Data collection method
Data were recorded for this experiment via two different sensors. A Micro-Epsilon ILD 1402-600 non-contacting displacement sensor recorded the transverse displacements. This sensor ran in tandem with an ATI-Nano17/IP68 six-axis force sensor that was attached to the upper end of the oscillating prism and measured the total flow forces acting on the prism in three perpendicular directions. This set-up enabled a complete measurement of the lift and drag forces acting on the prism. Decay tests were conducted in both air and water, by giving the prism an initial displacement and then recording the amplitude of oscillations for over 15 cycles of oscillations. Decay tests in water yielded a natural frequency of
 $f_{nw,T}=0.466\pm 0.007$
Hz and
 $f_{nw,C}=0.383$
Hz for the triangular prism and circular cylinder, respectively. Decay tests in air resulted in a natural frequency of
 $f_{na,T}=0.503$
Hz and
 $f_{na,C}=0.397$
Hz, and a structural damping ratio of
 $\unicode[STIX]{x1D701}=0.0057$
. The structural damping ratio was measured for different initial displacements of the prism, and resulted in the same value with a standard deviation of order
 $5\times 10^{-4}$
.
During these experiments, the water level was held constant and the flow velocity was increased from zero in small steps up to a Reynolds number of
 $Re=2700$
. At each step, the amplitude and frequency of oscillations as well as the flow forces acting on the prism were measured. Experimental runs were recorded over a 60 s duration at each flow velocity and angle of attack. This duration covered over 100 periods of oscillation of the prism.
2.4 Flow force measurements
The force sensor attached to the upper end of the prism measured the total flow forces acting on the prism in both the cross-flow and inline directions. The measured force in the cross-flow direction comprised both the hydrodynamic flow forces and the inertia force due to the motion of the force sensor. Therefore, the inertia force was removed from the total measured transverse force by post-processing the experimental data.
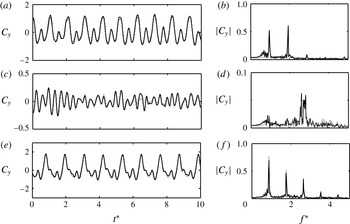
Flow forces and their corresponding frequency contents measured directly using the force sensors (solid line) and reconstructed using the method discussed in the text (dotted line) for (a,b)
 $\unicode[STIX]{x1D6FC}=55^{\circ }$
and
 $U^{\ast }=10.7$
(moderate-amplitude response), (c,d)
 $\unicode[STIX]{x1D6FC}=35^{\circ }$
and
 $U^{\ast }=16.7$
(low-amplitude response), and (e,f)
 $\unicode[STIX]{x1D6FC}=55^{\circ }$
and
 $U^{\ast }=20.7$
(large-amplitude response). In the plots,
 $C_{y}=2F/\unicode[STIX]{x1D70C}DU^{2}L$
and
 $t^{\ast }=tf_{nw}$
.

An alternative method was also used here to obtain the flow forces. Given the time series of the prism’s cross-flow displacement, the cross-flow force can be calculated as
 $$\begin{eqnarray}F/m=\ddot{y} +2\unicode[STIX]{x1D701}\unicode[STIX]{x1D714}_{n}{\dot{y}}+\unicode[STIX]{x1D714}_{n}^{2}y,\end{eqnarray}$$
where
 $F$
is the cross-flow force,
 $m$
the system’s mass (only the structure, with no added mass contribution),
 $\unicode[STIX]{x1D714}_{n}$
the natural frequency in air,
 $\unicode[STIX]{x1D701}$
the damping coefficient measured in air (0.0057 for the present experiments) and
 $y$
the displacement data recorded using the non-contacting laser sensor. This force reconstruction method was previously used by Seyed-Aghazadeh et al. (Reference Seyed-Aghazadeh, Carlson and Modarres-Sadeghi2015b
) to measure the flow forces acting on a tapered cylinder. In that work, the results were shown to match very well the results of the direct measurements using a force sensor and also those of Khalak & Williamson (Reference Khalak and Williamson1999) for a uniform cylinder with a similar mass-damping coefficient.
Here sample cases are given to show how this method works for measurements from a triangular prism. Figure 3 shows a comparison between the flow forces measured directly by the force sensor and those reconstructed using (2.1), for three sample cases with low, moderate and large amplitudes of oscillations. It is observed that the force reconstruction method is capable of reproducing very fine details of the flow forces, as shown both in the time history and in fast Fourier transform (FFT) plots of all three cases. The flow forces reported in this work are the reconstructed values.
3 A fixed triangular prism in flow
Before considering the flow-induced oscillations of triangular prisms, we conducted a brief series of experiments on a fixed triangular prism in flow placed at different angles of attack, varying from
 $0^{\circ }$
to
 $60^{\circ }$
with increments of
 $5^{\circ }$
. For these tests, the prism was clamped at its upper end and attached to the six-axis force sensor discussed in § 2. This set-up has been used previously by Benitz et al. (Reference Benitz, Carlson, Seyed-Aghazadeh, Modarres-Sadeghi, Lackner and Schmidt2016) to study the flow past free-surface piercing, finite-length cylinders. In the current tests, the lift and drag forces were measured in the Reynolds-number range of
 $Re=490{-}2700$
.
In an experimental study, Iungo & Buresti (Reference Iungo and Buresti2009) investigated the aerodynamic loads on a low-aspect-ratio (
 $L/D=1{-}3$
) fixed triangular prism placed in wind at different angles of attack. Flow visualizations were also conducted to characterize the flow patterns in the wake of the triangular prism. It was concluded that the cross-flow forces fluctuate significantly by varying the angle of attack, which was found to correspond mainly to the changes in the wake flow features. Also, their results from varying-aspect-ratio prisms showed an increase in the vortex shedding frequency with decreasing aspect ratio.
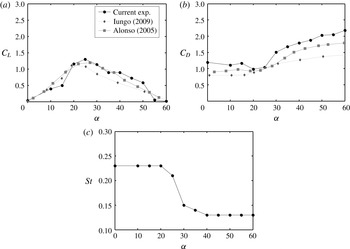
Figure 4(a,b) shows the variation of mean drag and lift coefficients acting on the prism at
 $Re=2000$
in the experiments conducted here, and calculated as
 $C_{L}=2F_{L}/\unicode[STIX]{x1D70C}DU^{2}L$
at different angles of attack. Also, results from previous studies on aerodynamic loads acting on low-aspect-ratio triangular prisms with
 $L/D=3$
(Iungo & Buresti Reference Iungo and Buresti2009) and
 $L/D=1.45$
(Alonso et al.
Reference Alonso, Meseguer and Pérez-Grande2005) are plotted for comparison. The mean lift coefficients from the current experiments match very well with the results of the low-aspect-ratio prisms. The mean drag coefficients, however, take larger values in the current experiments, but still qualitatively follow the same trend as those observed for the low-aspect-ratio prisms. As also suggested by Iungo & Buresti (Reference Iungo and Buresti2009), the decrease in magnitude of flow forces at lower aspect ratios of the prism can be associated with the flow three-dimensionality generated by the models with small aspect ratios used in those two studies (
 $L/D=3$
and
 $L/D=1.45$
).
(a) Lift and (b) drag coefficients, as well as (c) the Strouhal number for a fixed triangular prism placed at different angles of attack.

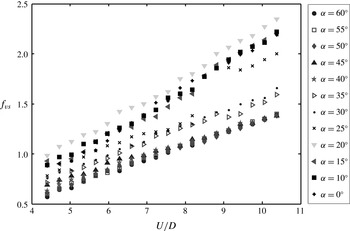
Figure 5 shows how the frequency of fluctuating lift varies with flow velocity. The frequencies of the flow forces in the cross-flow (lift) direction were obtained using the FFTs of flow forces. Linear regression was used to fit a line to those shedding frequencies obtained experimentally to find the Strouhal number, which is a dimensionless frequency of shedding off a fixed triangular prism, defined as
 $St=f_{vs}D/U$
, in which
 $f_{vs}$
is the shedding frequency,
 $D$
is the triangle’s side and
 $U$
is the incoming flow velocity.
Frequency of the fluctuating lift versus flow velocity for a fixed triangular prism placed at different angles of attack.

Figure 4(c) summarizes the Strouhal numbers that are calculated based on the measurements of figure 5 as they vary with the angle of attack. For smaller angles of attack, the Strouhal number stays around a value of 0.23. At an angle of attack of
 $25^{\circ }$
, there is a decrease in the Strouhal number, followed by a sudden drop to values close to 0.15 for
 $30^{\circ }$
, and then around 0.13 for angles of attack larger than
 $40^{\circ }$
. It is noted that the drop in the Strouhal number occurs at the same angle of attack where the magnitude of the fluctuating lift force reaches its maximum.
4 The overall view of the response
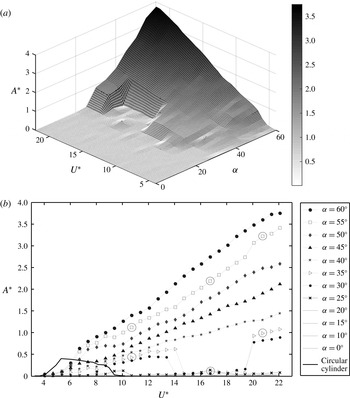
In this section, an overall view of the response is given for the main experimental campaign discussed in the present work, where the structure is allowed to oscillate in the transverse degree of freedom. Figure 6 shows the amplitudes of oscillations versus reduced velocity for a triangular prism at varying angles of attack. The amplitudes of oscillations for a uniform circular cylinder, allowed to oscillate in the cross-flow direction with the same mass ratio as the triangular prism, are plotted in figure 6 as well for comparison. The lock-in region observed for the circular cylinder is within a reduced velocity range of
 $4<U^{\ast }<9.2$
and with a maximum amplitude of
 $A^{\ast }\sim 0.5$
. The reduced velocity range and the amplitudes of oscillations observed here are comparable to those reported in previous VIV studies on circular cylinders (Seyed-Aghazadeh & Modarres-Sadeghi Reference Seyed-Aghazadeh and Modarres-Sadeghi2015).
(a) Three-dimensional and (b) projected plots of the dimensionless amplitude of the cross-flow oscillations,
 $A^{\ast }=A/D$
, versus the reduced velocity,
 $U^{\ast }$
, and the angle of attack,
 $\unicode[STIX]{x1D6FC}$
.

Three distinct trends of response are observed for the triangular prism placed at different angles of attack: the first trend with zero amplitude for all reduced velocities; the second trend with two regions of non-zero amplitudes; and the third trend with only one wider region of non-zero amplitudes.
For angles of attack smaller than
 $\unicode[STIX]{x1D6FC}=25^{\circ }$
, no oscillation is observed in the entire reduced velocity range tested. At an angle of attack of
 $\unicode[STIX]{x1D6FC}=25^{\circ }$
, oscillations with very small amplitudes (
 $A^{\ast }<0.1$
) are observed for a reduced velocity range of
 $8.7<U^{\ast }<10.7$
.
At slightly larger angles of attack,
 $\unicode[STIX]{x1D6FC}=30^{\circ }$
and
 $\unicode[STIX]{x1D6FC}=35^{\circ }$
, there exists a range of reduced velocities,
 $7<U^{\ast }<14.5$
, where the prism oscillates with amplitudes that reach a maximum value of
 $A^{\ast }\sim 0.6$
. These oscillations within a range of reduced velocities resemble the lock-in region observed in the VIV response of a circular cylinder. In the reduced velocity range of
 $14.5<U^{\ast }<19.5$
, oscillations with very small amplitudes, close to zero, are observed. At higher reduced velocities, in the range of
 $19.5<U^{\ast }<22$
, the prism starts to oscillate again and the amplitude of oscillations increases with increasing reduced velocity. This branch resembles the galloping-type response where the amplitude of oscillations increases unboundedly with
 $U^{\ast }$
. We call this trend a ‘distinct VIV–galloping’ trend for future reference.
At angles of attack larger than
 $\unicode[STIX]{x1D6FC}=35^{\circ }$
, once the oscillations start, their amplitude increases continuously with increasing reduced velocity up to the maximum values tested, without any sign of the lock-in region. This continuous increase of amplitudes resembles that seen during a galloping response of asymmetric structures. The maximum amplitude of these oscillations reaches a value of
 $A^{\ast }\sim 3.7$
for the case where the base plane of the cross-section is completely perpendicular to the incoming flow direction (
 $\unicode[STIX]{x1D6FC}=60^{\circ }$
). We call this trend a ‘combined VIV–galloping’ trend. Similar large-amplitude oscillations have been observed in a prism with a square cross-section when placed in flow at square orientation, i.e. when the face of the cross-section is completely perpendicular to the incoming flow direction (Nemes et al.
Reference Nemes, Zhao, Lo Jacono and Sheridan2012). In that case, the amplitude of oscillations increases continuously with increasing flow velocity, reaching values of around
 $A^{\ast }=1.6$
for a mass ratio close to
 $m^{\ast }=2.2$
and a structural damping ratio of
 $\unicode[STIX]{x1D701}=2.95\times 10^{-3}$
. Cui et al. (Reference Cui, Zhao, Teng and Cheng2015) also observed a similar behaviour for a square prism placed in flow, in which the oscillation amplitude increased monotonically with increasing reduced velocities when the side of the square prism was facing the flow.
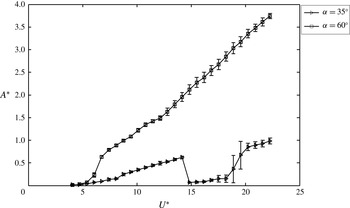
The dimensionless amplitude of the cross-flow oscillations,
 $A^{\ast }=A/D$
, together with their corresponding error bars versus the reduced velocity,
 $U^{\ast }$
, for angles of attack of
 $\unicode[STIX]{x1D6FC}=35^{\circ }$
and
 $\unicode[STIX]{x1D6FC}=60^{\circ }$
.

Tests were repeated several times to quantify the repeatability of the results. The
 $\unicode[STIX]{x1D6FC}=35^{\circ }$
and
 $\unicode[STIX]{x1D6FC}=60^{\circ }$
cases were chosen as archetypes of the distinct VIV–galloping type response and combined VIV–galloping type response, respectively. First, the natural frequency of the system was found via decay tests in still fluid with large (approximately 5 cm) initial displacements, and it was found that the values of the natural frequencies stayed within the same error-bar range as observed before (§ 2.3). The displacements were recorded at each flow velocity for the entire reduced velocity range. The tests were repeated five times, and each time the flow velocity was increased from a value close to zero to the maximum value considered here. At each velocity, the oscillations were recorded after reaching steady state. The error bars of figure 7 were calculated using the standard deviation about the mean amplitude of oscillations at each reduced velocity. It is observed in figure 7 that, overall, the error bars stay small (less than
 $D/4$
), except for a small region around reduced velocities corresponding to the onset of the second non-zero-amplitude range at
 $\unicode[STIX]{x1D6FC}=35^{\circ }$
. These large error bars are due to the fact that the onset of the second non-zero-amplitude range fluctuated between the values of
 $U^{\ast }=19$
and
 $U^{\ast }=20$
. The error bars are relatively small for all the other reduced velocities and for both angles of attack, especially at lower reduced velocities, where the error bars are smaller than the symbol size used to plot the experimental data points. At an angle of attack of
 $\unicode[STIX]{x1D6FC}=60^{\circ }$
, the error bars grow as the reduced velocity and the amplitude of oscillations increase; however, the largest error stays below
 $D/4$
.
The dominant frequency of oscillations,
 $f_{osc}$
, stays below the natural frequency of the system in air,
 $f_{na,T}$
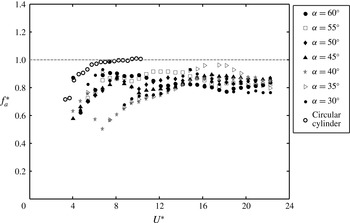
, for all angles of attack and for both VIV and galloping-type oscillations (figure 8). This behaviour is different from the VIV response of a circular cylinder (also shown in figure 8) in which the frequency of oscillations exceeds the natural frequency within the lock-in region (Khalak & Williamson Reference Khalak and Williamson1999). The fact that
 $f_{osc}/f_{na,T}$
stays at values smaller than one means that the jump from
 $0^{\circ }$
to
 $180^{\circ }$
in phasing between flow forces and the structure’s displacement that is observed for a circular cylinder does not occur for triangular prisms. This will be discussed with some details later in § 6.3
Dimensionless frequency of the cross-flow oscillations,
 $f^{\ast }=f_{osc}/f_{na}$
, versus the reduced velocity,
 $U^{\ast }=U/f_{nw,T}D$
, at different angles of attack,
 $\unicode[STIX]{x1D6FC}$
.

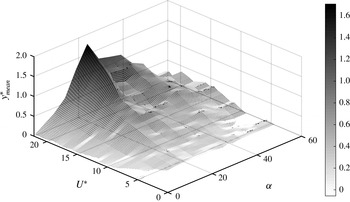
At each angle of attack, the prism’s mean displacement increases with increasing reduced velocity (figure 9). The maximum value of these mean displacements is
 $y_{mean,max}^{\ast }=1.7$
and occurs at an angle of attack for which the prism does not oscillate, i.e.
 $\unicode[STIX]{x1D6FC}\sim 25^{\circ }$
. The mean value at
 $30^{\circ }$
is still large,
 $y_{mean}^{\ast }=1.2$
, but it is accompanied by oscillations with a comparable amplitude,
 $A^{\ast }\sim 0.9$
(figure 6). At higher angles of attack, while the maximum mean displacement decreases, the amplitude of oscillations increases and becomes much larger than the mean value.
Dimensionless mean amplitude of the cross-flow oscillations,
 $y_{mean}^{\ast }=y_{mean}/D$
, versus the reduced velocity,
 $U^{\ast }=U/f_{nw,T}D$
, at different angles of attack,
 $\unicode[STIX]{x1D6FC}$
.

5 Sample cases of the response
To shed light on the three different types of response observed in figure 6, we have selected six representative points at three reduced velocities of
 $U^{\ast }=10.7$
,
 $16.7$
and
 $20.7$
for two angles of attack,
 $\unicode[STIX]{x1D6FC}=35^{\circ }$
and
 $55^{\circ }$
(shown with circles around the symbols in figure 6).
5.1 Angle of attack
 $\unicode[STIX]{x1D6FC}=35^{\circ }$

Figure 10 shows the dimensionless displacement time histories (
 $y/D$
, where
 $D$
is the side of the triangular cross-section), the cross-flow force coefficients,
 $C_{y}$
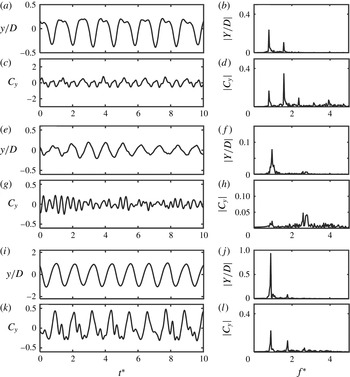
, and their corresponding frequency contents (FFT plots) for these sample points. The FFT plots exhibit distinct frequency contents: while the main peak in all of these FFT plots corresponds to a frequency close to the natural frequency of the system in water, small contributions of the second and third harmonics, i.e. with twice and three times the frequency of oscillations, are observed in some cases.
Sample time histories and FFT plots of the prism’s dimensionless displacement in the cross-flow direction as well as the cross-flow force coefficient together with their corresponding frequency contents for
 $\unicode[STIX]{x1D6FC}=35^{\circ }$
at three reduced velocities: (a–d)
 $U^{\ast }=10.7$
, (e–h)
 $U^{\ast }=16.7$
, and (i–l)
 $U^{\ast }=20.7$
.

At a reduced velocity of
 $U^{\ast }=10.7$
(figure 10
a–d), the cross-flow force consists of the main harmonic (at a frequency close to the natural frequency of the system) as well as the second harmonic (twice the natural frequency of the system). This is a sample point in which the amplitude and frequency of oscillations correspond to a VIV response. The first peak in the FFT plot corresponds to the main frequency of oscillations, and the second peak at the second harmonic is due to the asymmetry of the system. Du, Jing & Sun (Reference Du, Jing and Sun2014) showed that, even for a circular cylinder, with a symmetric cross-section, undergoing VIV, two peaks can be observed in the FFT plot of the cross-flow forces, due to the asymmetry in the shedding. For a triangular prism, due to the added geometrical asymmetry with respect to the incoming flow at
 $\unicode[STIX]{x1D6FC}=35^{\circ }$
, the second peak at a frequency twice the main frequency of oscillations has an even larger contribution, comparable with the first harmonic frequency. This is in fact due to the contribution of the fluctuating drag force at a frequency twice the fundamental frequency.
For the reduced velocity of
 $U^{\ast }=16.7$
, the cross-flow force has a very small value (figure 10
e–h). The amplitude of oscillations is also very small at this reduced velocity. Two small peaks are observed in the FFT plot of this reduced velocity: the first peak corresponds to the main frequency of oscillations and the second peak corresponds to the Strouhal frequency. The synchronization between the two frequencies is lost in this region, and therefore no large-amplitude oscillations are observed.
For a larger reduced velocity of
 $U^{\ast }=20.7$
, the cross-flow force consists of the main harmonic as well as contributions from higher harmonics, i.e. the second, third and fourth harmonics (figure 10
i–l). This sample point falls within the reduced velocity range in which the amplitude of oscillations resembles a galloping-type response.
5.2 Angle of attack
$\unicode[STIX]{x1D6FC}=55^{\circ }$

For an angle of attack of
 $\unicode[STIX]{x1D6FC}=55^{\circ }$
, at a reduced velocity of
 $U^{\ast }=10.7$
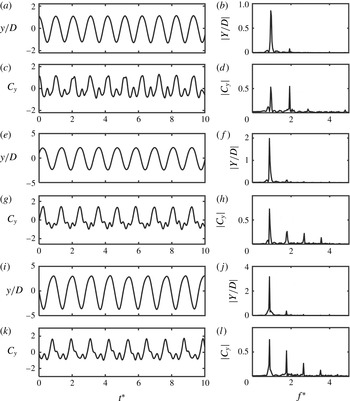
, the cross-flow force mainly consists of the first and the second harmonics, and a slight contribution of the third harmonic is also observed (figure 11
a–d). These peaks correspond to the
 $\text{T}+\text{P}$
vortex shedding pattern observed at this point, as discussed later in § 7.2. At higher reduced velocities of
 $U^{\ast }=16.7$
(figure 11
e–h) and
 $U^{\ast }=20.7$
(figure 11
i–l), large higher harmonic contributions (up to the fifth) in the cross-flow force are observed, which correspond to the high-frequency wake modes observed at these reduced velocities: 2T and
 $5\text{S}+4\text{S}$
, respectively, again as discussed later in § 7.2. This suggests that the shedding of vortices is independent of the oscillation frequency at these reduced velocities. Both of these reduced velocities correspond to the range of large-amplitude galloping-type response of the system.
Sample time histories and FFT plots of the prism’s dimensionless displacement in the cross-flow direction as well as the cross-flow force coefficient together with their corresponding frequency contents for
 $\unicode[STIX]{x1D6FC}=55^{\circ }$
at three reduced velocities: (a–d)
 $U^{\ast }=10.7$
, (e–h)
 $U^{\ast }=16.7$
, and (i–l)
 $U^{\ast }=20.7$
.

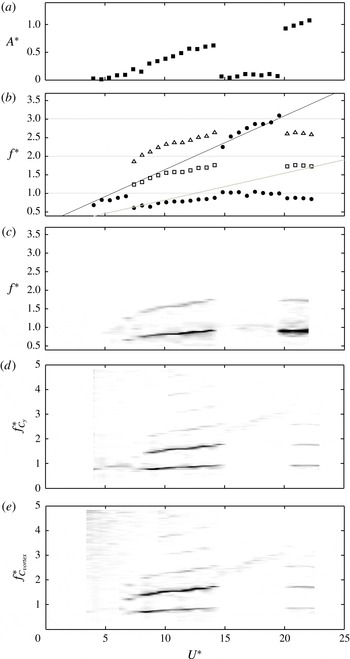
(a) The dimensionless amplitude of the cross-flow oscillations,
 $A^{\ast }$
, and (b) the dimensionless frequency (circles,
 $f_{1}$
; squares,
 $f_{2}$
; triangles,
 $f_{3}$
) of the cross-flow oscillations,
 $f^{\ast }=f_{osc}/f_{na,T}$
, versus the reduced velocity,
 $U^{\ast }=U/f_{nw,T}D$
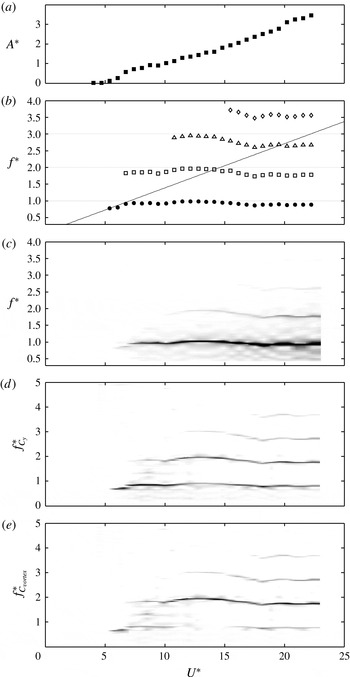
. Contour plots of the dimensionless frequency of (c) the cross-flow oscillations, (d) the total transverse force, and (e) the transverse vortex force. All are measured at an angle of attack of
 $\unicode[STIX]{x1D6FC}=35^{\circ }$
.

(a) The dimensionless amplitude of the cross-flow oscillations,
 $A^{\ast }$
, and (b) the dimensionless frequency (circles,
 $f_{1}$
; squares,
 $f_{2}$
; triangles,
 $f_{3}$
; diamonds,
 $f_{4}$
) of the cross-flow oscillations,
 $f^{\ast }=f_{osc}/f_{na,T}$
versus the reduced velocity,
 $U^{\ast }=U/f_{nw,T}D$
. Contour plots of the dimensionless frequency of (c) the cross-flow oscillations, (d) the total transverse force, and (e) the transverse vortex force. All are measured at an angle of attack of
 $\unicode[STIX]{x1D6FC}=55^{\circ }$
.

6 The response at different reduced velocities for
$\unicode[STIX]{x1D6FC}=35^{\circ }$
and
$\unicode[STIX]{x1D6FC}=55^{\circ }$


To study how the frequency content of the response changes with reduced velocity, for the ‘distinct VIV–galloping’ trend versus the ‘combined VIV–galloping’ trend, we consider two representative angles of attack of
 $\unicode[STIX]{x1D6FC}=35^{\circ }$
and
 $55^{\circ }$
for each trend. The plots in the first two rows of figures 12 and 13 show the dimensionless amplitudes of oscillations and the frequency contents of the response, respectively. In the frequency plots, a line with a slope of
 $St$
is plotted, corresponding to the vortex shedding frequencies for a fixed triangular prism,
 $f_{vs}$
, at the same angle of attack based on the results of § 3. A second line with a slope half of the
 $St$
line is also plotted for comparison. The plots in the third row of figures 12 and 13 are contour plots of frequency contents for the cross-flow oscillations as a function of frequency normalized by the natural frequency of the system in water and the reduced velocity,
 $U^{\ast }$
. These contours are formed by taking the FFTs of displacement time series at every given value of
 $U^{\ast }$
, normalizing them by their maximum value, and placing them next to each other. This method of presenting the frequency content of the response over a range of reduced velocities has been employed extensively in the past (e.g. by Zhao et al.
Reference Zhao, Leontini, Lo Jacono and Sheridan2014). The plots in the fourth and the fifth rows of figures 12 and 13 show similar contours for the total transverse force and a component of the total transverse force, i.e. the ‘transverse vortex force’, respectively. This component is found after subtracting the potential flow added mass contribution from the total transverse force, following the method used originally by Lighthill (Reference Lighthill1986), and employed afterwards extensively, e.g. by Zhao et al. (Reference Zhao, Leontini, Lo Jacono and Sheridan2014).
6.1 Angle of attack
$\unicode[STIX]{x1D6FC}=35^{\circ }$

At
 $\unicode[STIX]{x1D6FC}=35^{\circ }$
(figure 12), representative of a ‘distinct VIV–galloping’ trend, all three types of response, i.e. VIV type, galloping type and no oscillation, have been observed. Besides the dominant frequencies of oscillations,
 $f_{1}$
, the higher frequencies at twice and three times the dominant frequency,
 $f_{2}$
and
 $f_{3}$
, are also observed. For this angle, the frequency of oscillations (figure 12
b) follows the Strouhal line (
 $St$
line in figure 12) for the lower reduced velocities (
 $U^{\ast }\sim 4.0{-}4.7$
), and then locks into the natural frequency of the system at
 $U^{\ast }\sim 4.7$
and stays close to the natural frequency up to
 $U^{\ast }=7.4$
. In this range of reduced velocities, the response is very similar to a classic VIV response when a
 $1:1$
ratio between the shedding frequency and the oscillation frequency triggers VIV. At
 $U^{\ast }=7.4$
, there is a slight decrease in the amplitude of oscillations, which is accompanied by a drop in the frequency of oscillations from
 $f^{\ast }=0.93$
to
 $f^{\ast }=0.63$
. Then for the reduced velocity range of
 $U^{\ast }=7.4{-}14.2$
, the frequency of oscillations initially follows the line corresponding to half the Strouhal frequency (
 $St$
/2 line in figure 12) for
 $U^{\ast }\sim 7.4{-}10.1$
until it reaches a value close to the natural frequency of the system again at
 $U^{\ast }\sim 10.1$
. In this range, the synchronization occurs between the system’s natural frequency and half the shedding frequency calculated based on
 $St$
. At this point, the frequency once again locks into the natural frequency of the system. The dimensionless frequency stays around unity up to a reduced velocity of
 $U^{\ast }\sim 14.2$
, beyond which the prism can no longer stay locked into the natural frequency of the system and the amplitude of oscillations decreases suddenly. Higher harmonics at twice and three times the dominant frequency of oscillations are also observed in this range of reduced velocities (
 $U^{\ast }=7.4{-}14.2$
).
Overall, the response of the system in the frequency domain in the reduced velocity range of
 $U^{\ast }=4.0{-}14.2$
resembles that observed in the lock-in response of a VIV case, in the sense that non-zero-amplitude responses are observed over a range of reduced velocities, being preceded and followed by zero-amplitude responses. In the case of a triangular prism, however, the frequency of oscillations locks into the natural frequency twice: once approaching from the Strouhal frequencies and once from half the Strouhal frequencies. Another difference compared with the classic VIV response is that the dimensionless frequency never crosses one (figure 8), thus resulting in no jump in the phase difference between the structure’s displacement and flow forces.
In the reduced velocity range of
 $U^{\ast }=14.7{-}19.4$
, where the dimensionless amplitudes of oscillations stay at small values of less than
 $A^{\ast }=0.1$
, the frequency content has a contribution from the natural frequency of the system and a contribution from the shedding frequency at a value following the Strouhal frequency of a fixed prism at the same angle of attack (
 $St$
line in figure 12). The shedding frequency increases linearly with reduced velocity, as expected, but the contribution from the natural frequency of the system stays constant. A range of broad-band, low-power frequencies, following the Strouhal line, is also observed in the transverse vortex forces of figure 12(e).
At a reduced velocity of
 $U^{\ast }=19.6$
, where the frequency component from the Strouhal line gets close to three times the natural frequency of the system, the prism starts to oscillate again. It seems that the matching of the shedding frequency and three times the natural frequency acts as a trigger for the system to restart its oscillations at this reduced velocity. The dominant frequency of oscillations is close to the natural frequency of the system. Higher harmonic components at twice and three times the dominant frequency also exist in this range. The second harmonic does exist due to the asymmetry in shedding as discussed before in § 5.1. The third harmonic component is mainly due to the relative angle of the lift and drag force with respect to the direction of the prism’s oscillation. Owing to this relative angle, the flow force in the direction of oscillation comprises components of lift and drag forces, at the first and second harmonics, which give rise to forces at three times the fundamental frequency. Seyed-Aghazadeh, Budz & Modarres-Sadeghi (Reference Seyed-Aghazadeh, Budz and Modarres-Sadeghi2015a
) discuss more details of the third harmonic’s contribution. In the frequency contents of the transverse vortex force of figure 12(e), peaks at the first, second and third harmonic components are observed, but the second harmonic is the dominant frequency.
6.2 Angle of attack
$\unicode[STIX]{x1D6FC}=55^{\circ }$

Figure 13 shows the same plots as figure 12, but for an angle of attack
 $\unicode[STIX]{x1D6FC}=55^{\circ }$
. The oscillations start at a frequency close to the Strouhal frequency at a reduced velocity of
 $U^{\ast }=5.4$
. The frequency of oscillations follows the Strouhal line (the continuous line in figure 13
b) and, as the shedding frequency gets closer to the natural frequency of the system, it locks into the natural frequency. The frequency of transverse vortex force (figure 13
e) stays close to the frequency of oscillations for a range of reduced velocities, resulting in a
 $1:1$
synchronization in this range, similar to what was observed for the VIV range of the response for
 $\unicode[STIX]{x1D6FC}=35^{\circ }$
. The reduced velocity of
 $U^{\ast }=5.4$
, therefore, can be considered as the onset of the VIV response for the
 $\unicode[STIX]{x1D6FC}=55^{\circ }$
case, for which the frequency of vortex shedding gets locked into the frequency of oscillations.
The ‘lock-in’ region seems to be extending up to around
 $U^{\ast }\sim 10$
, where a sudden change in the slope of the amplitude plot is observed. This ‘kink’ corresponds to the reduced velocity at which the dominant frequency of the transverse vortex force shifts from a value equal to that of the oscillation frequency to twice the oscillation frequency. This jump in the dominant frequency implies that the vortex shedding frequency is no longer ‘locked into’ the oscillation frequency of the prism, and therefore the reduced velocity at which this jump occurs (i.e.
 $U^{\ast }\sim 10$
) can be considered as the end of the lock-in range and therefore the end of the VIV response. At reduced velocities following this range, the vortex shedding is synchronized to twice the oscillation frequency, resulting in a
 $1:2$
synchronization.
For
 $U^{\ast }\sim 10{-}15$
, the dominant dimensionless frequency of oscillations stays around unity, while the transverse vortex force is dominated by a frequency twice the oscillation frequency. The higher harmonic components of the oscillation frequency also exist at twice, three times and four times the dominant frequency. The amplitude of oscillations increases monotonically by increasing the reduced velocity in this range. At
 $U^{\ast }\sim 15$
, another sudden change in the slope of the amplitude plot is observed (a ‘kink’). This change occurs at a reduced velocity for which the first harmonic of the transverse vortex force becomes large again and its values become comparable to its higher harmonics.
For
 $U^{\ast }\sim 15{-}20$
, the amplitude of oscillations increases monotonically with increasing reduced velocity and the second harmonic of the transverse vortex force remains the dominant frequency. At
 $U^{\ast }\sim 20$
, where the third harmonic frequency matches the vortex shedding frequency of a fixed prism, the third ‘kink’ in the amplitude of oscillations is observed. Beyond this reduced velocity, the second and the third harmonic transverse vortex forces become broad-band and the amplitude of oscillations increases with increasing
 $U^{\ast }$
. The values of the third harmonic vortex lift force become comparable with the dominant second harmonic frequency, resulting in a combined
 $1:2$
and
 $1:3$
synchronization.
Zhao et al. (Reference Zhao, Leontini, Lo Jacono and Sheridan2014) observed similar behaviour for a low-mass-ratio square prism at an angle of attack of
 $\unicode[STIX]{x1D6FC}=0^{\circ }$
, where the flat face of the square was placed perpendicular to the flow. Different synchronization regimes have been reported in their work, where vortex shedding was being locked into multiple integers of the body oscillation frequencies. The observed synchronization at
 $\unicode[STIX]{x1D6FC}=0^{\circ }$
was only at odd multiple integers of the vortex shedding cycles, referred to as ‘odd’ synchronization. No ‘even’ synchronization was observed for the square prism at
 $\unicode[STIX]{x1D6FC}=0^{\circ }$
. It was concluded by the authors that for a square prism placed in flow in a symmetric orientation, such as
 $\unicode[STIX]{x1D6FC}=0^{\circ }$
, even vortex shedding produces a mean lift force of zero, which cannot lead to a significant transverse galloping response. Based on the findings of the present study, however, it seems that we do not necessarily observe an odd synchronization if the body is not placed symmetrically in the flow. The body’s asymmetric orientation can cause asymmetric vortex shedding (in terms of the size and strength of the vortices) from each side of the prism, thus resulting in a non-zero mean lift. Since the number of shed vortices from each side is the same, this results in an ‘even’ synchronization, but because the vortices are not necessarily of the same size and strength, they could produce non-zero mean lift. This matches the behaviour that was observed in the two angles of attack considered here, where for both
 $\unicode[STIX]{x1D6FC}=35^{\circ }$
and
 $\unicode[STIX]{x1D6FC}=55^{\circ }$
the prism was oriented asymmetrically with respect to the incoming flow, and therefore both odd and even synchronizations were observed in these two cases.
To investigate if we observe only ‘odd’ synchronization in a symmetrically oriented triangular prism, the angle of attack of
 $\unicode[STIX]{x1D6FC}=60^{\circ }$
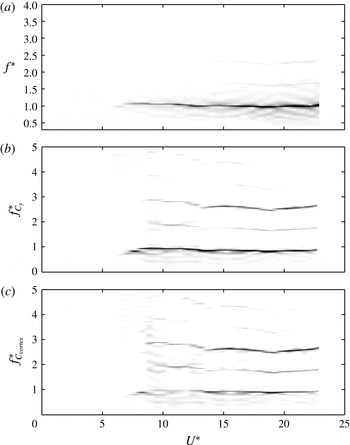
was considered. Figure 14 shows the contour plots of dimensionless frequency of oscillations, total transverse force and vortex transverse force frequencies for the angle of attack of
 $\unicode[STIX]{x1D6FC}=60^{\circ }$
, where the triangular prism is placed symmetrically with respect to the incoming flow. In this case, the dimensionless frequency of oscillations stays around unity for the entire range of reduced velocities tested. However, in addition to the main harmonic frequency, there is a large contribution from the third harmonic in the total transverse force contour. Considering only the vortex shedding component of the transverse force, the third harmonic is the dominant frequency, and the contribution from the second harmonic is minimal, implying a
 $1:3$
synchronization. This ‘odd’ synchronization, as a consequence of symmetric vortex shedding in the wake of a triangular prism placed symmetrically with respect to the flow, agrees with the results observed by Zhao et al. (Reference Zhao, Leontini, Lo Jacono and Sheridan2014), where they did not observe any contribution from even harmonics in the flow-induced oscillations of a square prism placed symmetrically in flow.
Contour plots of the dimensionless frequency of (a) the cross-flow oscillations, (b) the total transverse force, and (c) the transverse vortex force. All are measured at an angle of attack of
 $\unicode[STIX]{x1D6FC}=60^{\circ }$
.

6.3 Phase differences
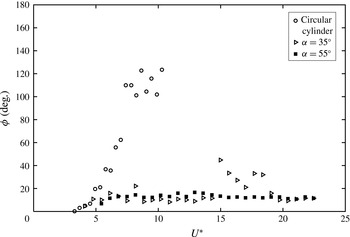
Figure 15 shows how the phase difference between the first harmonic displacement and the first harmonic cross-flow force,
 $\unicode[STIX]{x1D719}$
, changes with the reduced velocity for two angles of attack
 $\unicode[STIX]{x1D6FC}=35^{\circ }$
and
 $55^{\circ }$
. The phase difference for both cases stays around
 $10^{\circ }$
for all reduced velocities, except for a small range of higher reduced velocities for
 $\unicode[STIX]{x1D6FC}=35^{\circ }$
, where the phase difference increases to values close to
 $30^{\circ }$
. In all these cases, the phase difference never increases to values larger than
 $90^{\circ }$
. This behaviour is different from what is observed in the VIV response of a circular cylinder, for which there is a jump from
 $0^{\circ }$
to
 $180^{\circ }$
in phasing between flow forces and the cylinder displacement (Khalak & Williamson Reference Khalak and Williamson1999). This phase jump is also observed in the present results for the uniform circular cylinder at a reduced velocity of
 $U^{\ast }\sim 7$
(circles in figure 15). The maximum value of the phase difference at larger reduced velocities in the current experiment is approximately
 $130^{\circ }$
, instead of
 $180^{\circ }$
. This is due to the fact that, with a non-zero structural damping, the phase jump to
 $180^{\circ }$
occurs only if the frequency ratio (
 $f_{osc}/f_{na,C}$
) gets far from unity. In the current experiments, however, the frequency ratio stayed close to unity, resulting in a phase difference of less than
 $180^{\circ }$
. At any rate, there is a phase change from small values to values larger than
 $90^{\circ }$
for the circular cylinder tested here, which means that the flow forces start opposing the displacement at a certain reduced velocity. This phase jump does not occur for the triangular prism. The fact that
 $f_{osc}/f_{na,T}$
stays at values smaller than one in figure 8 also confirms the monotonic phase change observed here for the triangular prism, whereas the frequency ratio passed unity for the circular cylinder at a reduced velocity of
 $U^{\ast }\sim 7$
in figure 8.
The phase difference between the cross-flow amplitude and the cross-flow force.

7 The wake
We conducted dye flow visualizations to investigate how the shedding pattern of the triangular prism changes at different angles of attack and different reduced velocities, and also to measure the shedding frequency and compare that with the oscillation frequency in the hope of understanding the differences of the VIV-type and galloping-type responses. The fluorescent dye, injected upstream of the prism through a tiny dye tube, was exposed to ultraviolet (UV) light, giving rise to the distinct colour of the dye. The wake of the prism was studied at eight different reduced velocities of
 $U^{\ast }=6.7$
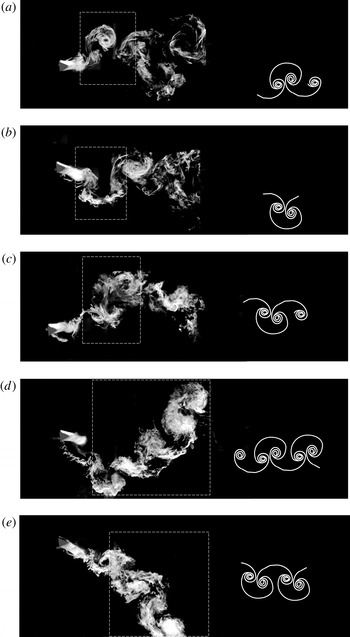
, 8.7, 10.7, 12.7, 14.7, 16.7, 18.7 and 20.7 for all angles of attack tested here to cover a full map of all possible wake patterns in all three types of response: no oscillation, VIV type and galloping type. In the following, the wake of the prism is discussed at the same sample points for which the time histories and their frequency contents were studied earlier in § 5.
7.1 The wake at sample points for
$\unicode[STIX]{x1D6FC}=35^{\circ }$

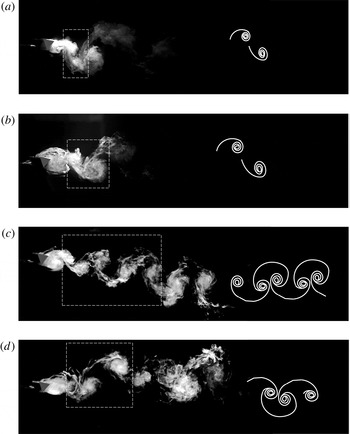
Figure 16 shows the vortex shedding patterns in the wake of the prism at the maxima of one oscillation cycle at sample reduced velocities of
 $U^{\ast }=10.7$
, 16.7 and 20.7. The snapshots on the left are directly from the dye flow visualization images and the schematics on the right specify the observed patterns (also seen inside the boxes drawn around the shed vortices). At the reduced velocity of
 $U^{\ast }=10.7$
(figure 16
a), two single vortices are shed in each cycle of oscillations (2S pattern). The vortex shedding frequency at this point is equal to the frequency of oscillations (
 $f_{vs}\sim f_{os}=0.35$
Hz at
 $U^{\ast }=10.7$
), which is a feature of a VIV response.
Vortex shedding patterns in the wake of the triangular prism at an angle of attack of
 $\unicode[STIX]{x1D6FC}=35^{\circ }$
at reduced velocities of (a)
 $U^{\ast }=10.7$
, (b)
 $U^{\ast }=16.7$
and (c–d)
 $U^{\ast }=20.7$
.

At
 $U^{\ast }=16.7$
, the 2S vortex shedding persists (figure 16
b) but the shedding frequency (
 $f_{vs}\sim 1.25$
Hz) no longer follows the natural frequency of the system (
 $f_{nw,T}=0.466$
Hz), but is equal to the Strouhal frequency for a stationary triangular prism (
 $f_{st}=1.28$
Hz) based on the results of figure 5. This was expected, since the amplitude of oscillations in this range is very small (close to zero) and the triangular prism is practically stationary.
At
 $U^{\ast }=20.7$
, the response is of a galloping type as we discussed in § 4. As shown in figure 16(c,d), at this point five vortices are shed from one side when the prism is moving up and three vortices are shed from the other side of the prism when it is moving down. We call this pattern a
 $\text{5S+3S}$
pattern, for five single vortices shed in one half-cycle and three single vortices shed in the other half-cycle. Clearly the shedding is asymmetric and its frequency is much higher than the oscillation frequency. The fact that the shedding frequency is much higher than the oscillation frequency suggests that the oscillations are low-frequency and the shedding is a consequence of the presence of the bluff body in the flow and not the forcing that causes the oscillations.
In summary, for this angle of attack, a branch of VIV-type response is followed by a range of almost-zero-amplitude response, and then a branch of galloping-type response at higher reduced velocities. In the VIV-type range of the response, 2S shedding, typical of a VIV response, is observed, while in the galloping-type range of the response, the shedding is asymmetric with a higher frequency compared with the oscillation frequency.
7.2 The wake at sample points for
$\unicode[STIX]{x1D6FC}=55^{\circ }$

The second series of wake visualizations discussed here were conducted at the same three reduced velocities of
 $U^{\ast }=10.7$
, 16.7 and 20.7, but at a larger angle of attack of
 $\unicode[STIX]{x1D6FC}=55^{\circ }$
(figure 17). At
 $U^{\ast }=10.7$
, a
 $\text{T}+\text{P}$
pattern is observed in which a triplet of vortices is shed when the prism moves up and a pair of vortices is shed when the prism moves down (figure 17
a,b). At
 $U^{\ast }=16.7$
, a 2T pattern (two triplets of vortices shed in each cycle of oscillations) is observed (figure 17
c). The
 $\text{T}+\text{P}$
and 2T modes have been observed in the VIV response of a circular cylinder as well (Williamson & Govardhan Reference Williamson and Govardhan2004), and, since they have been observed previously, we use symbols T and P for them. With the nomenclature used in this paper, we could call the
 $\text{T}+\text{P}$
pattern a
 $3\text{S}+2\text{S}$
pattern, and the 2T pattern a
 $3\text{S}+3\text{S}$
pattern, as well. At
 $U^{\ast }=20.7$
, a
 $5\text{S}+4\text{S}$
pattern is observed (figure 17
d,e) in which five vortices are shed from one side when the prism is moving up and four vortices are shed from the other side of the prism when it is moving down. The
 $5\text{S}+4\text{S}$
could also be called a 2P,
 $\text{S}+\text{P}$
, and so on for all the high-frequency multiple shedding patterns. However, to keep the nomenclature simpler, we use
 $n\text{S}+m\text{S}$
in referring to these shedding patterns, with the understanding that in fact all we do is to count the number of vortices shed from each side of the prism in each cycle of oscillations.
Vortex shedding patterns in the wake of the triangular prism at an angle of attack of
 $\unicode[STIX]{x1D6FC}=55^{\circ }$
and at reduced velocities of (a–b)
 $U^{\ast }=10.7$
, (c)
 $U^{\ast }=16.7$
and (d–e)
 $U^{\ast }=20.7$
.

It can be argued that, for this angle of attack, at some reduced velocity, the shedding frequency is so much larger than the oscillation frequency that the response can be considered to be a galloping type as opposed to a VIV type. That would be a galloping-type response as a low-frequency response, where ‘low’ is in comparison with the shedding frequency, which implies that the shedding is the result of the presence of the bluff body in flow and not the cause of its oscillations. The low-frequency oscillations combined with the large-amplitude oscillations (much larger than the typical one-diameter amplitude observed in the VIV response of bluff bodies) indicates a galloping-type response at higher reduced velocities. Overall, for this angle of attack, the initial VIV-type response gives way to a galloping-type response at higher reduced velocities, without any intermediate, almost-zero-amplitude response, which we observed for the angle of attack of
 $\unicode[STIX]{x1D6FC}=35^{\circ }$
.
7.3 An overall view of the wake
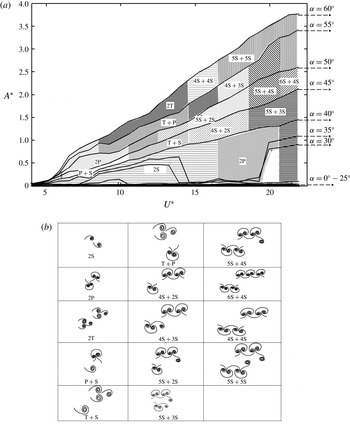
A summary of the shedding patterns observed in the wake of the triangular prism is given in figure 18. The predominant shedding patterns at lower reduced velocities are 2S,
 $\text{P}+\text{S}$
, 2P,
 $\text{T}+\text{S}$
,
 $\text{T}+\text{P}$
and 2T, which have been observed previously for the VIV response of a circular cylinder with various mass-damping parameters. For the cases with a ‘combined VIV–galloping’ trend, at reduced velocities of higher than
 $U^{\ast }=15$
the shedding frequency becomes much larger than the oscillation frequency, a sign of the onset of galloping. These high-frequency shedding patterns (shown as
 $n\text{S}+m\text{S}$
in figure 18) are asymmetric (
 $n\neq m$
) for all angles of attack, except for
 $\unicode[STIX]{x1D6FC}=60^{\circ }$
. This suggests that the asymmetry in the number of shed vortices from each side is only due to the geometric asymmetry of the structure in these angles of attack. In figure 18, the shedding patterns are identified for each angle of attack, and based on the flow visualizations conducted at selected reduced velocities only. Therefore the vertical lines in the plot should not be interpreted as a sudden change of the shedding pattern.
(a) A map of the vortex patterns in the wake of the triangular prism at varying angles of attack and at different reduced velocities, together with (b) schematics of the shedding patterns.

8 Conclusions
Flow-induced oscillations of a prism with a triangular cross-section placed in water flow and at different angles of attack are studied experimentally. The prism had one degree of freedom and was allowed to oscillate in the cross-flow direction. The experiments were conducted at varying angles of attack in the range of
 $\unicode[STIX]{x1D6FC}=0^{\circ }{-}60^{\circ }$
for every
 $5^{\circ }$
, and for a reduced velocity range of
 $U^{\ast }=4{-}22$
, corresponding to a Reynolds-number range of
 $\mathit{Re}=490{-}2700$
.
Depending on the angle of attack and the reduced velocity, the triangular prism experiences both VIV and galloping-type response. For small angles of attack of
 $\unicode[STIX]{x1D6FC}<30^{\circ }$
, the prism does not oscillate for the range of reduced velocities tested. For larger angles of attack, two patterns in the response are observed. For
 $\unicode[STIX]{x1D6FC}=30^{\circ }$
and
 $35^{\circ }$
, two independent regions of non-zero-amplitude response are observed: one corresponding to the VIV-type response and the other to the galloping-type response. For
 $\unicode[STIX]{x1D6FC}>35^{\circ }$
, only one region of non-zero-amplitude response, spread over a wide range of reduced velocities, is observed covering both the VIV-type and galloping-type responses.
For angles of attack of
 $\unicode[STIX]{x1D6FC}=30^{\circ }$
and
 $35^{\circ }$
, the prism undergoes large-amplitude oscillations in a limited range of reduced velocities,
 $U^{\ast }=7{-}14.5$
. The frequency response of the system in this range of reduced velocities resembles those observed in the lock-in region of a circular cylinder underdoing VIV. However, for a triangular prism, the frequency of oscillations locks into the natural frequency twice: once approaching from the Strouhal line and once from the half-Strouhal line. The conducted dye flow visualization as well as the measured flow forces confirmed that the lock-in occurs in this range of reduced velocities and the triangular prism undergoes VIV. At the same angles of attack and for a range of larger reduced velocities,
 $U^{\ast }=14.5{-}19.5$
, no oscillation is observed. This is then followed by large-amplitude oscillations again at higher reduced velocities,
 $U^{\ast }=19.5{-}22$
. In this reduced velocity range, the amplitude of oscillations increases with increasing reduced velocity. These large-amplitude oscillations are accompanied by high-frequency asymmetric shedding, which suggests a galloping-type response (oscillations with large amplitude compared with VIV and low frequency compared with the shedding frequency) in this region. Therefore, for these angles of attack, the prism experiences VIV at smaller reduced velocities and galloping at higher values with a distinct gap of almost-zero-amplitude response in between.
For larger angles of attack of
 $\unicode[STIX]{x1D6FC}>35^{\circ }$
, when the oscillations start at a reduced velocity, their amplitude increases monotonically with increasing reduced velocity, until it reaches a maximum dimensionless value of
 $A^{\ast }\sim 3.7$
at high reduced velocities for
 $\unicode[STIX]{x1D6FC}=60^{\circ }$
. For this range of angles of attack, the response is initially a VIV type, but later on it becomes a galloping-type response. There is a range of reduced velocities for which the shedding frequency is synchronized with the oscillation frequency. This range is where a VIV-type response is observed for these angles of attack. At higher values of reduced velocities, the
 $1:1$
synchronization is replaced by a combined
 $1:2$
and
 $1:3$
synchronization in asymmetric orientations, and a
 $1:3$
synchronization in the symmetric case of
 $\unicode[STIX]{x1D6FC}=60^{\circ }$
. This range of large-amplitude oscillations where the oscillation frequency is smaller than the shedding frequency corresponds to the galloping-type response of the system.