1 Introduction
In Canada, registered retirement savings plans (RRSPs) are a tax-preferred savings vehicle that individuals set up and maintain through financial institutions, which was designed primarily to promote saving for retirement. Contributions to RRSPs are made on a pre-tax basis, the income taxes being owed when funds are withdrawn from the accounts, so that the tax advantage of an RRSP is largely determined by the marginal tax rate of the contributor (Veall, Reference Veall2001). In contrast with the tax treatment of comparable savings plans in Canada and other countries, no regulations exist which discourage account holders from withdrawing funds from these accounts before retirement. For example, contributions to employer-sponsored pension plans in Canada lock in after a short vesting period notwithstanding special cases of financial hardship (Morissette and Drolet, Reference Morissette and Drolet2000), and an explicit surtax of 10% is levied on withdrawals before age 59.5 from individual retirement accounts (IRAs) and 401(k)s in the USA. As a result, RRSPs are often used for precautionary saving and income-smoothing (Mawani and Paquette, Reference Mawani and Paquette2011). On balance, $1 is withdrawn from RRSPs before retirement for every $5 contributed in the same year (Akyeampong, Reference Akyeampong1998; Giles and Maser, Reference Giles and Maser2004).
While there is no surtax on RRSP withdrawals before retirement, lump-sum distributions are subject to tax withholding. Withholding refers to a source deduction of a fraction of an RRSP withdrawal by the plan administrator, who then remits those funds to a central tax authority on the account holder's behalf as a partial payment of the final income taxes owed. This process both facilitates administration – the tax authority benefits from the economy of scale of dealing with a small number of financial institutions with sophisticated accounting systems rather than a large number of individual tax filers – and it mitigates tax evasion (Slemrod and Gillitzer, Reference Slemrod and Gillitzer2014). In particular, tax withholding in Canada is levied at a progressive rate depending on the size of the RRSP withdrawal, and variation exists across jurisdictions depending on the rate structures set by provincial tax authorities.
Since tax withholding is not a final tax or penalty on withdrawing, how this feature should affect savings withdrawals is theoretically unclear. An implication of the life-cycle theory is that consumption and savings do not respond to predictable changes in income (Souleles, Reference Souleles1999). Withholding simply leads to a small difference in the timing of taxation of less than a year and has negligible effects on lifetime wealth and tax liabilities, and is therefore expected to have little effect on withdrawals in the absence of liquidity concerns, fiscal illusion, or present bias. In addition, any change in the withholding rate over time would be offset by borrowing or dissaving from taxable accounts.
However, a growing literature in behavioral economics finds that predictable changes in income caused by tax rebates, refunds, the timing of paycheck receipt, and tax withholding all have large effects on labor supply, household consumption, and savings decisions (Shapiro and Slemrod, Reference Shapiro and Slemrod1995; Souleles, Reference Souleles1999; Johnson et al., Reference Johnson, Parker and Souleles2006; Stephens, Reference Stephens2006; Feldman, Reference Feldman2010; Jones, Reference Jones2012; LaLumia, Reference LaLumia2013). Tax withholding likely has a significant effect on individuals who are financially constrained and withdraw from RRSPs to smooth income following a negative income shock; for example, a person who needs $1,000 in cash for immediate use must withdraw $2,000 if the withholding rate is 50%, but only $1,250 if this rate is 20%. In contrast, present bias or fiscal illusion (Laibson, Reference Laibson1997; Gul and Pesendorfer, Reference Gul and Pesendorfer2001; Chetty et al., Reference Chetty, Looney and Kroft2009) would induce individuals to overvalue the disutility of withholding or misinterpret it as an explicit penalty, such that a decrease in the tax withholding rate could actually prompt individuals to withdraw more from their RRSPs as the perceived cost of doing so declines.
The objective of this study is to assess whether tax withholding of pre-retirement RRSP withdrawals implicitly discourages such behavior and serves as a de facto form of savings commitment device. Specifically, the elasticity of withdrawals to the net-of-tax withholding rate is estimated in an experimental design framework. The identification exploits an exogenous policy reform of the tax withholding schedule in the province of Quebec enacted January 1, 2005, whereby the rate applied to RRSP withdrawals exceeding $5,000 was reduced by 4% points. The effect of this reform is estimated in a difference-in-differences (DD) framework by comparing the trend in large withdrawals in Quebec around the time of the reform to the equivalent trend among other Canadian provinces as the control group. Responsiveness is also assessed using bunching at notch points in the tax schedule (Saez, Reference Saez2010; Kleven and Waseem, Reference Kleven and Waseem2013).
Using a 20% sample of administrative records on tax filers aged 30–54, from 2001 to 2008, the results indicate that tax withholding meaningfully influences savings withdrawal behavior. Among individuals who do not appear to withdraw for reasons of income smoothing or financial distress, the withdrawal elasticity to the net-of-tax withholding rate is significantly estimated to be approximately 0.40, a finding that holds up to various robustness checks and placebo tests. Thus, tax withholding implicitly discourages pre-retirement savings withdrawals; the size of this response is larger than a rational model would predict, and theories of present bias, temptation or fiscal illusion are favored as an explanation for why individuals respond to a decrease in the tax withholding rate by withdrawing more from their RRSPs. The large elasticity implies a non-trivial deadweight loss component of tax withholding but also a potentially significant welfare gain from reduced costs of self-control. However, for individuals who likely withdraw to smooth income, the elasticity was estimated to be −1.10 (approximately a negative unit-elastic response), consistent with the notion that these withdrawers are primarily concerned with the amount of cash available for immediate consumption.
In addition to the studies cited above, this study contributes to several related literatures. There is a large body of research that examines whether preferential tax treatment for contributions made to designated accounts boosts private savings and wealth accumulation (see Bernheim (Reference Bernheim, Auerbach and Feldstein2002) for a survey). Yet less is known about the role of the tax code in helping individuals overcome myopia so as to keep their savings intact to retirement. Models of time-inconsistency and rational temptation (Laibson, Reference Laibson1997; Gul and Pesendorfer, Reference Gul and Pesendorfer2001) are often used in the economic analysis of savings, optimal taxation, labor supply, and the welfare effects of default options (Laibson et al., Reference Laibson, Repetto and Tobacman1998; Krusell et al., Reference Krusell, Kuruşçu and Smith2010; Bernheim et al., Reference Bernheim, Fradkin and Popov2015; Fahri and Gabaix, Reference Fahri and Gabaix2015; Kaplow, Reference Kaplow2015). An implication of these models is that sophisticated present-biased agents demand commitment devices to help them overcome such behavioral limitations, but little work has been done empirically on this issue (Thaler and Benartzi (Reference Thaler and Benartzi2004) is a notable exception).Footnote 1 Finally, the result that withdrawers bunch at discontinuities in the tax withholding schedule adds to a growing literature on the prevalence of such behavior (Blundell and Hoynes, Reference Blundell, Hoynes, Card, Blundell and Freeman2004; Chetty et al., Reference Chetty, Looney and Kroft2009; Saez, Reference Saez2010; Kleven and Waseem, Reference Kleven and Waseem2013).
The paper proceeds as follows. In Section 2, the tax regulations governing RRSP withdrawals are discussed and summary statistics on savings and withdrawal behavior are briefly presented. Section 3 reviews the data and empirical methods, Section 4 presents the analytical results, and Section 5 concludes.
2 Withdrawals from RRSPs: regulations and trends
This section begins with a discussion of tax regulations governing RRSP withdrawals, followed by a review of withdrawal trends and factors influencing such behavior.
2.1 Tax regulations of RRSP withdrawals
In many cases, tax-preferred savings account regulations explicitly discourage or prevent account holders from accessing funds before retirement. For example, IRAs and 401(k)s both impose a 10% penalty on early withdrawals before age 59.5. In Canada, contributions to employer-sponsored pension plans lock in after a short vesting period (2 years in many provinces) so that funds cannot be accessed before retirement notwithstanding special cases of financial hardship. In contrast, no disincentives exist for RRSPs aside from the benefit of withdrawing more when income is low, as contributions to these plans are made on a pre-tax basis.
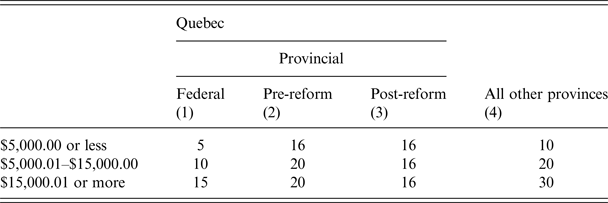
When an RRSP withdrawal is made, a fraction of the income tax owed on this income is collected immediately by the plan administrator or managing institution and withheld from payment. The magnitude of the deduction at source is determined by the tax withholding schedule, which varies by the amount withdrawn, jurisdiction, and year as shown in Table A1 of the Appendix. The remainder of the taxes owed is paid when the withdrawer's taxes are filed; if the tax withholding rate exceeds the final marginal tax rate then a fraction of the source deduction is returned to the withdrawer as a tax refund. Notice that Quebec is the only province with its own tax withholding schedule, and the federal rate applied in this province is reduced as a result. In addition, Table A1 shows that Quebec standardized its tax withholding rate effective January 1, 2005, a reform to be exploited in the upcoming empirical analysis.
RRSP regulations provide two channels through which account holders may borrow from their plans on a tax-free basis: to invest in home equity or education. In 1992, the Home Buyer's Plan (HBP) was established to allow RRSP holders to use these assets to buy or build a home in Canada for themselves or a related person with a disability. Over the relevant time period for this study, the maximum amount that could be borrowed was $20,000. The provisions stipulate that loans must be repaid in full within 15 years and repayment defaults are treated as withdrawals subject to income taxes. Given the maximum borrowing amount and the time allowed to fully repay the loan, the largest annual repayment that could result in default is approximately $20,000 ÷ 15 ≈ $1,333, a fact that will become relevant, below.
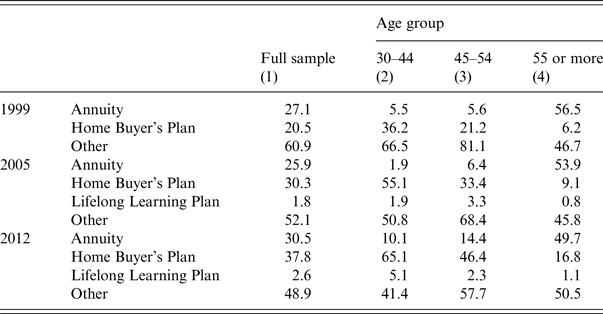
In addition, individuals may borrow from their RRSPs under the Lifelong Learning Plan (LLP) – a program established in 1999 to assist with post-secondary enrollment – or transfer funds into other registered accounts, registered retirement income funds (RRIFs), or to purchase annuities for retirement. Table 1 shows the fractions of individuals who withdrew from RRSPs for these reasons. While RRIFs are uncommon for young and middle-aged individuals and LLP usage is low, the HBP is utilized regularly by account holders.
Reasons for withdrawing from an RRSP

Notes: The percent of individuals who withdrew from an registered retirement savings plans (RRSP) for the following reasons are estimated: (1) to purchase an annuity or registered retirement income fund (RRIF); due to the Home Buyer's Plan (HBP); due to the Lifelong Learning Plan (LLP); and for other reasons. The LLP was introduced in 1999 but data on its usage were not yet available. The unit of observation in this survey is the household, and the data on respondents’ age pertains to the head of household. The full sample refers to age 30 or more.
Source: Author's calculations from the Survey of Financial Security, Statistics Canada.
2.2 RRSP contribution and withdrawal trends
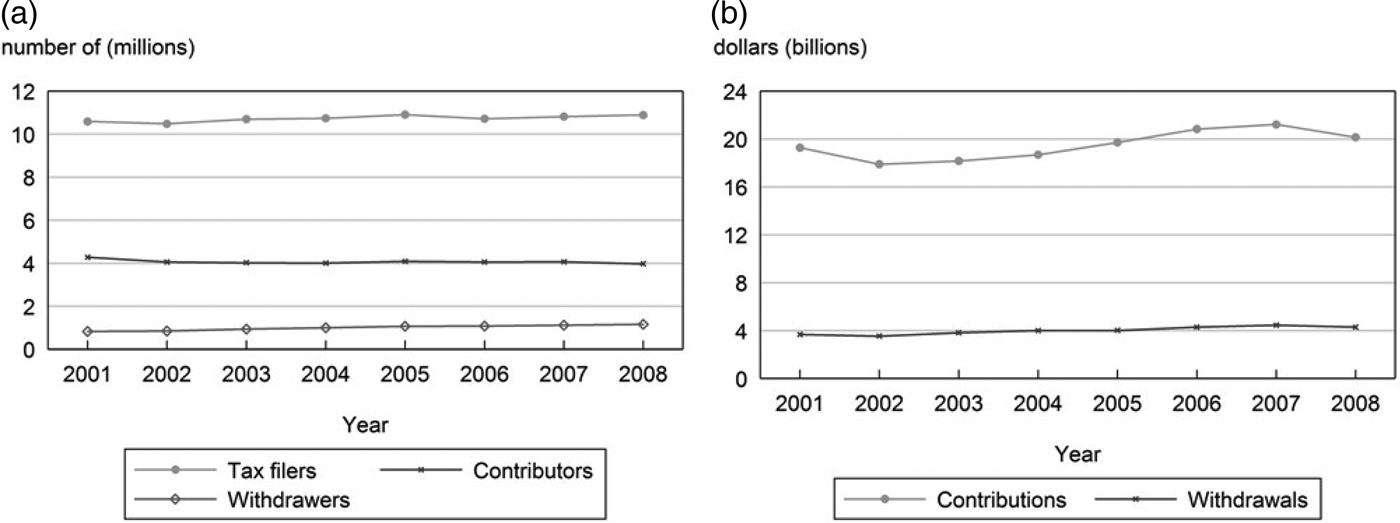
Figure 1 shows RRSP contribution and withdrawal trends from 2001 to 2008. The annual ratio of contributors to tax filers, in Panel A, has stayed relatively constant over this time period at around 35–40%. However, the ratio of withdrawers to contributors is large, ranging from around 20 to 30% and increasing over time. While eligible tax filers use RRSPs frequently to save, as evidenced by the high propensity to contribute, they also withdraw regularly from these plans. Panel B shows the aggregate magnitude of RRSP contributions and withdrawals in nominal dollars: consistent with previous findings (Akyeampong, Reference Akyeampong1998), $1 is withdrawn from RRSPs for every $5 contributed in the same tax year, in aggregate. Therefore, a better understanding of the causes and consequences of pre-retirement withdrawals has implications for the optimal design of tax policies that would ultimately affect a wide segment of Canadians.
Trends in RRSP contribution and withdrawal behavior, 2001–2008. PANEL A: Tax filers, RRSP contributors and RRSP withdrawers. Panel B: RRSP contributions and withdrawals. Notes: The data presented here are estimates based on CANSIM and LAD data, where efforts were made to ensure comparability. The samples are restricted to tax filers aged 25–54 and residing in a Canadian province (residents of the territories are excluded). For RRSP withdrawers and withdrawals, since the LAD is a 20% representative sample, the LAD estimates were multiplied by five to obtain the national aggregates. Sources: Author's calculations based on the Canadian Socioeconomic Information Management (CANSIM), Tables #111-0039 and #111-0041 (tax filer and RRSP contributor and contributions), and the Longitudinal Administrative Databank (RRSP withdrawers and withdrawals), Statistics Canada.

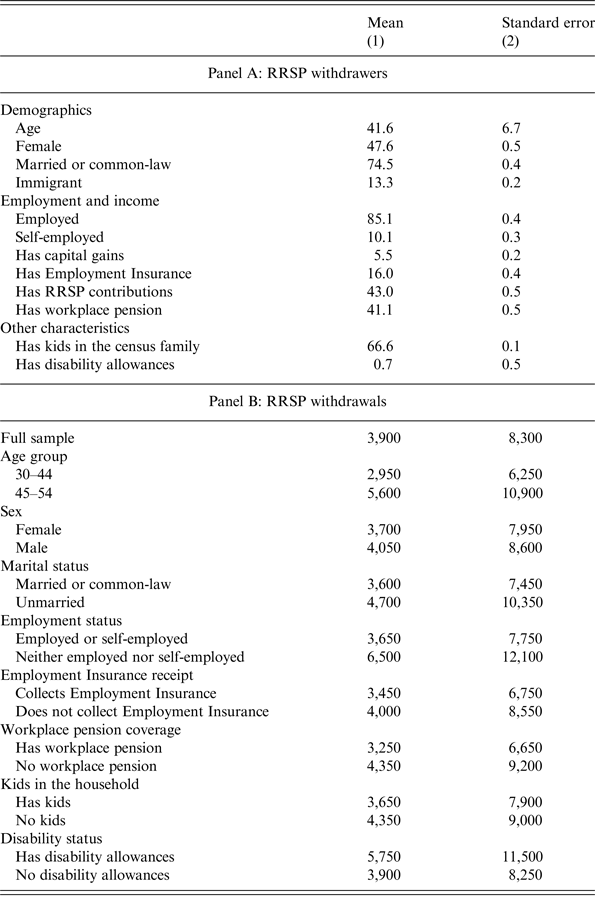
To explore the characteristics of RRSP withdrawers, Table A2 gives summary statistics for the relevant sample. Most withdrawers are married, employed or self-employed, and have children in the census family. Yet withdrawals tend to be larger among those who are older, unmarried, unemployed, or disabled, consistent with Mawani and Paquette (Reference Mawani and Paquette2011) who show that RRSPs are used for income smoothing. The empirical analysis will, therefore, delineate financially ‘constrained’ individuals (defined as those with Employment Insurance (EI), social assistance or disability allowances) from ‘unconstrained’ individuals.
3 Data and empirical methodology
This section begins by describing the data set and sample selections used in the upcoming empirical analysis. Then the empirical methodology is discussed, including a background of the tax code reform exploited for identification.
3.1 Data and sample selection
The primary data set used in this study is the Longitudinal Administrative Databank (LAD) of Statistics Canada. The LAD is a panel data file that comprise a 20% sample of tax records from the T1 Family File (T1FF) deriving from the central tax authorities. In addition, the sample is augmented annually to ensure accurate cross-sectional representation. The data set contains a wide range of information on demographics, income, taxes, allowances, receipts, transfers, and savings characteristics of the individuals represented and their census families.
The selection conditions are as follows. First, the sample is restricted to individuals aged 30–54 so as to ensure that the individuals under investigation have had sufficient time to work and save in RRSPs such that analyzing withdrawal behavior is warranted, but who have not yet approached the age of retirement. Second, individuals who are observed collecting private pension income are excluded, although the vast majority of individuals who meet the age requirements have zero pension income. The time period from 2001 to 2008 was chosen to center the data on the reform date, as well as to provide a wide enough time interval to control for trends in withdrawal behavior.
3.2 Empirical methodology
The general class of problems is to estimate the elasticity of RRSP withdrawals to the net-of-tax withholding rate in the following statistical model:
 $$x_{ijt} = \alpha + \beta \left( {1 - \rho _{ijt}} \right) + Z_{ijt}^{\prime} \theta + {\epsilon}_{ijt}$$
where x ijt is the withdrawal by individual i in province j at time t, which depends on the tax withholding rate (ρ ijt, a vector of individual characteristics Z ijt, and the residual ε ijt. Estimating this equation in logs means β is the withdrawal elasticity to the net-of-tax withholding rate.Footnote 2
The ordinary least squares (OLS) estimator is confounded by the fact that RRSP tax withholding schedules in Canada are increasing nonlinear functions of the amount withdrawn,  $\rho _{ijt} = \tilde \rho _{jt}(x_{ijt})$ as shown in Table A1, which biases the results upward. A method of overcoming this problem empirically is to exploit policy-induced variation in tax rates over time, as in the related literature (see Saez et al. (Reference Saez, Slemrod and Giertz2012) for a survey).
3.2.1 The tax withholding reform
In May, 2004, the provincial government of Quebec announced a plan to change the tax withholding rates levied on RRSP withdrawals and annuity payments. On annuity income, a 16% provincial tax withholding was proposed (no source deductions were previously required on annuities). In addition, a small modification to the withholding schedule of lump-sum distributions was proposed to standardize the provincial rate, shown in Table A1. Ultimately, the rate change on annuity payments was not implemented but the reform on lump sum distributions was enacted on January 1, 2005.
The reform to lump-sum distributions was enacted simply to harmonize the provincial regulations governing RRSP withdrawals (Finances Québec, 2004), so the reform is a plausibly exogenous shock to withholding rates with which to identify how such regulations affects withdrawal behavior. Moreover, except for the modification to replace the applicable rate on single RRSP withdrawals to a standard rate of 16%, no other modifications were made to the existing tax regulations in Quebec in respect of single amounts (Finances Québec, 2004). The federal tax withholding rates have not changed over this study's period of analysis, as shown in Table A1, hence withdrawal behavior in provinces outside of Quebec is a reasonable control group for the empirical analysis. Finally, Milligan (Reference Milligan2010) notes that the Canadian retirement income system has seen a remarkably stable policy environment in recent years, so any response to the tax withholding reform is not likely confounded by other factors.
3.2.2 Identification strategy
A DD methodology is used to compare the trends in withdrawals in Quebec before and after the reform relative to the analogous trend in large withdrawals within the remaining provinces. A regression-based analysis controls for individual characteristics as well as geographic and time effects so as to remove from the treatment effect any influence from other variables that likely affect withdrawal behavior that may be different across groups. The statistical estimating equation is:
 $${ X_{ijt} = \mu + \gamma \left\{ {Q_{ijt} \times T_{ijt}} \right\} + P_{ijt}^{\prime} \pi + Y_{ijt}^{\prime} {\rm \;} \lambda + Z_{ijt}^{\prime} \delta + \left\{ {P_{ijt} \times t} \right\} + \omega _{ijt}} $$
where Q ijt is an indicator variable that individual i in jurisdiction j resided in the province of Quebec at the time t of making the withdrawal, which is equal to ‘1’ if the person was a Quebec resident and ‘0’ otherwise. The term P ijt is a vector of province-specific indicators, Y ijt is a vector of year indicators, and T ijt is a post-treatment time indicator. Hence, {Q ijt × T ijt} is the DD interaction and the parameter γ, the effect of interest, measures any change in the trend in average withdrawals within Quebec relative to the other provinces at the time of the tax withholding reform. Lastly, the vector {P ijt × t} controls for differential time trends by province to relax the ‘common trends’ assumption of the DD estimator.
3.2.3 Extensive-margin versus intensive-margin responses
Equation (2) can be used to estimate both extensive-margin and intensive-margin effects of the tax withholding reform. In both cases, the sample remains restricted to individuals residing in the ten provinces who are observed withdrawing from an RRSP at least once from 2001 to 2008.
Given that the reform only affected withdrawals exceeding $5,000 in the province of Quebec, for the purpose of this analysis the ‘extensive margin’ is defined as whether the withdrawal exceeded the first notch in the tax withholding schedule,  $X_{ijt} = 1(x_{ijt} \ge \$ 5,\!000)$ where 1( · ) is an indicator function and x ijt is defined above. Non-withdrawers are omitted from this analysis because the reform did not affect tax withholding levied on withdrawals close to zero and, therefore, individuals’ participation decisions should not have been affected. In contrast, X ijt = ln(x ijt) is set in the intensive-margin analysis, the log nominal dollar value of the amount withdrawn, and the sample is initially restricted to individuals who withdrew $5,000 or more from their RRSPs unless stated otherwise.
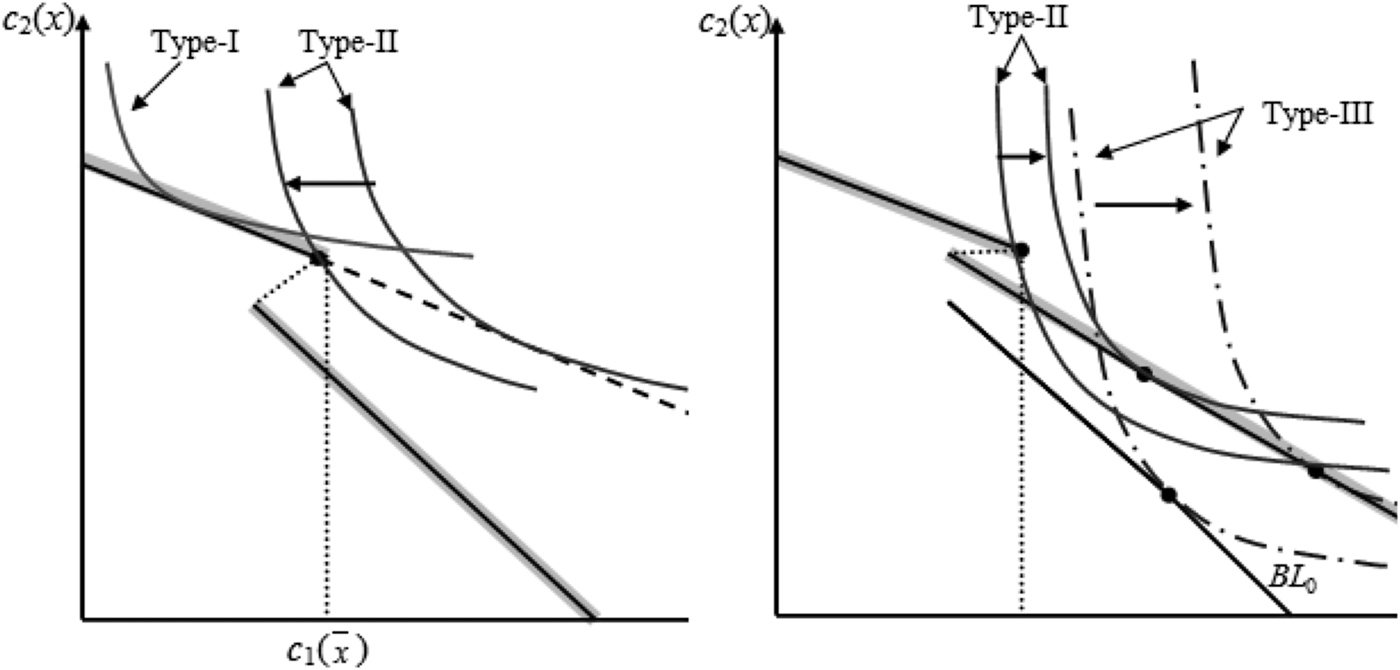
Figure A1 illustrates how tax withholding reform is expected to affect withdrawal behavior along the extensive margin. In particular, the tax notch should induce a bunching response at the notch point if individuals sufficiently regard the tax withholding as a final tax or penalty on withdrawing, shown in Panel A.
In addition, Panel B illustrates that the tax withholding reform could induce some individuals who were bunching before the reform to withdraw strictly above this threshold after the reform. Such behavior would introduce attenuation bias in the intensive-margin elasticity estimates if the analysis were to condition on individuals who withdrew strictly above $5,000. This effect occurs given that the representative individual in Quebec who withdrew more than $5,000 changes with treatment because different types of individuals move into the treatment group in the post-treatment period. To control for this issue, the intensive-margin benchmark regressions will include individuals who withdrew at the $5,000 threshold even though the reform only affected withdrawals exceeding this amount. The analysis is also repeated using progressively lower threshold values  $K \in [\$ 1,\!500,\; \$ 5,\!000]$ to check whether the treatment on the treated estimate is robust to the possibility that some individuals withdrawing strictly less than $5,000 were affected in some way by the reform. The lower limit of $1,500 is used to ensure the results are not influenced by withdrawals occurring as a result of defaulted HBP repayments, discussed above.
The elasticity of withdrawals to the net-of-tax withholding rate is computed from equation (2) using the parameter effect of interest,  $\hat \gamma $, as follows:
 $$\hat \beta = \displaystyle{{d{\rm ln(}x_{ijt}{\rm )}} \over {d{\rm ln(}1 - \rho _{ijt}{\rm )}}} = \displaystyle{{\hat \gamma} \over {d{\rm ln(}1 - {\tilde \rho} _{\,jt}{\rm )}}}$$
where  $d{\rm ln(}1 - \tilde \rho _{jt}{\rm )}$ is known, calculated from the values in Table A1, and the caret is used to denote an estimated value.
4 Results
This section begins by considering whether bunching at notch points in the tax withholding schedule occurs in practice. Then a graphical inspection and regression-based DD analysis of the effect of the provincial tax withholding reform are presented.
4.1 Bunching analysis
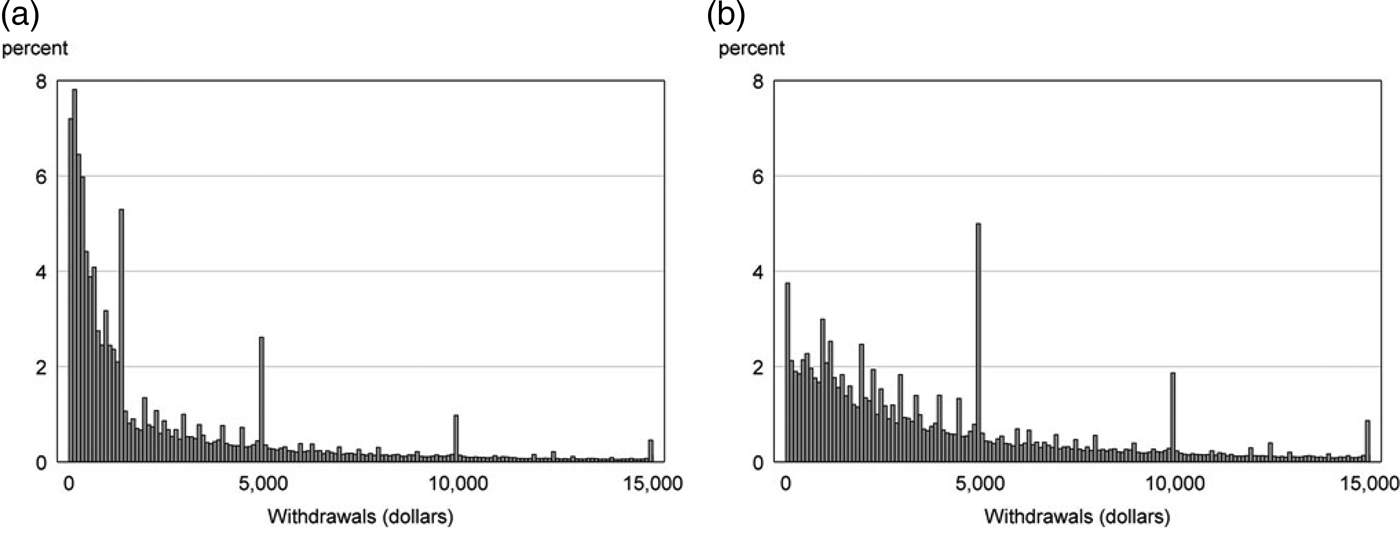
Figure 2 shows the RRSP withdrawal distributions over the interval from $1 to $15,000. In particular, Panel A shows the distribution of total withdrawals and Panel B shows withdrawals net of defaults on HBP repayments.
Distributions of RRSP withdrawals, total and direct. Panel A: Total withdrawals. Panel B: Direct withdrawals. Notes: Panel A shows the distribution of total (gross) RRSP withdrawals over the range from $1 to $15,000 in $100 increments. The figure shows a large mass of withdrawers below $15,000 with a high degree of bunching at approximately $1,350 due to defaults on Home Buyers Plan (HBP) repayments, at $5,000, $10,000, and $15,000 due to the tax notches, and to a lesser extent at other round numbers. Panel B shows the distribution of direct withdrawals, defined as the difference between total withdrawals and the amounts that occur indirectly due to the HBP defaults. Source: Author's calculations from the Longitudinal Administrative Databank, Statistics Canada.

The figure provides two insights for the empirical analysis. First, bunching is prevalent and so extensive-margin responses to the reform may also be significant. Note that the bunching observed at $10,000 – despite the fact that no notch exists at this point – may arise from individuals strategically making two withdrawals of $5,000 from separate accounts in the same year. While bunching at other thresholds occurs due to round-number bias, this effect is small. Second, a large proportion of small withdrawals occurs due to HBP defaults, and controlling for such behavior in the empirical analysis is important. The large spike in the density between $1,300 and $1,400 in Panel A exists because the maximum amount that individuals could default on their HBP repayments over this time period was typically $1,333 as discussed above; the spike subsequently disappears in Panel B when these defaults are omitted.
4.2 Primary regression results
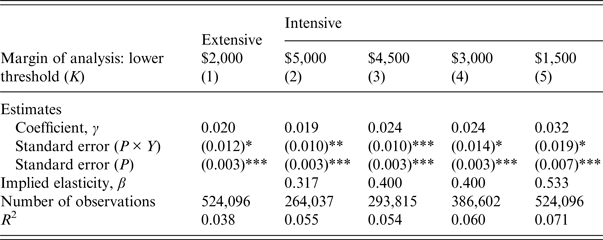
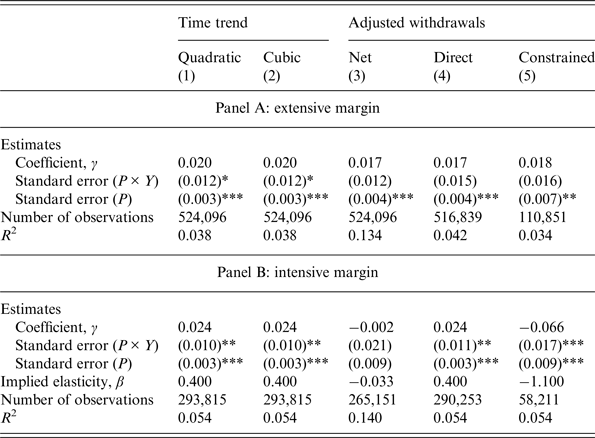
Table 2 shows regression-based DD estimates of withdrawers’ responsiveness to the tax withholding reform along both the extensive margin and the intensive margin for varying threshold values of K. The regressions include a wide set of covariates to control linearly for observed factors that vary across individuals and over time that may affect RRSP withdrawal behavior. These covariates include: indicators for sex, marital status, and immigrant status; age; and values (in logs, see footnote 2) for employment income, self-employment income, capital gains, EI income, RRSP contributions, workplace pension contributions, disability allowances and medical expense allowances. Importantly, based on prior evidence that withdrawing can occur due to income smoothing, this sample is restricted to ‘unconstrained’ withdrawers, defined as those who are not observed with EI, social assistance or disability allowances, who are most likely to be withdrawing because of myopia or temptation. The effect of the reform on constrained withdrawers is subsequently examined in the robustness checks. Standard errors are calculated based on: (1) clustering by province; and (2) clustering by province and year. While the findings of several robustness checks and tests of heterogeneity depend qualitatively on the approach taken to calculate the standard errors, ultimately the primary results are robust to either method.
Primary regression-based estimates of the withdrawal elasticity

Notes: ***p < 0.01; **p < 0.05; *p < 0.10. The following additional control variables are included in each regression: indicators for sex, marital status, and immigrant status; age; values (in logs) for employment income, self-employment income, capital gains, RRSP contributions, workplace pension contributions, and medical expense allowances; fixed effects for province and year; and province-specific linear time trends. The extensive-margin analysis estimates the likelihood of withdrawing strictly above the notch point of $5,000 in the tax withholding schedule. The lower threshold indicates the smallest RRSP withdrawal such that the observation is still included in the sample, for methodological reasons discussed in the text.
Source: Author's calculations from the Longitudinal Administrative Databank, Statistics Canada.
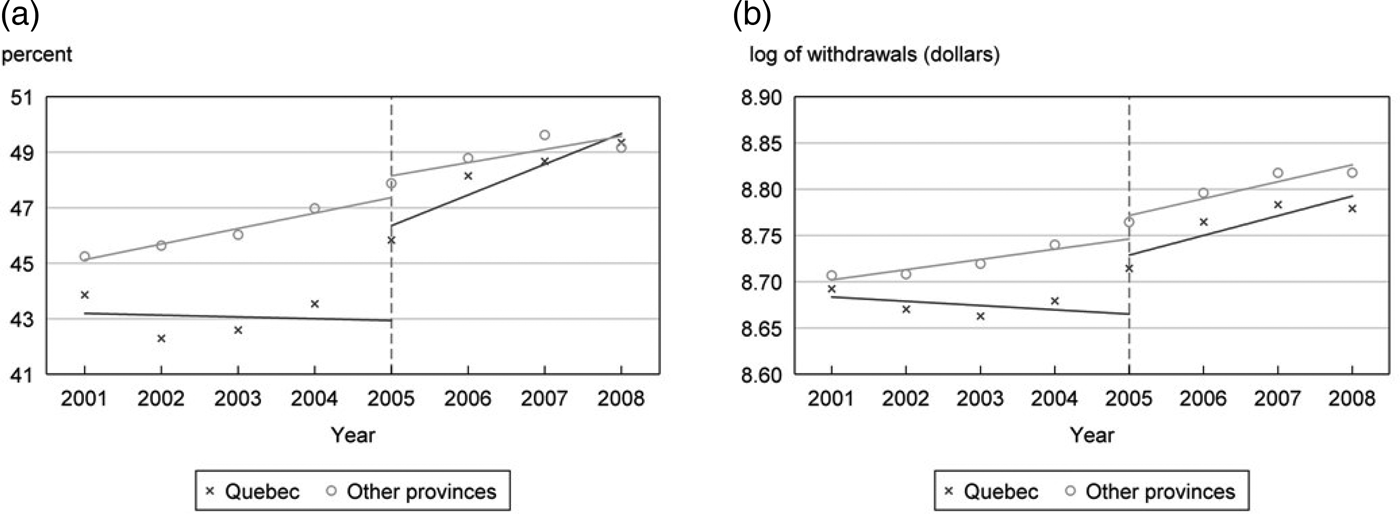
Column (1) of Table 2 shows the extensive-margin effect of the reform on sorting behavior around the notch point in the tax withholding schedule. Consistent with predictions, individuals were more likely to withdraw strictly above $5,000 after the reform. This effect is statistically significant and economically meaningful: the decrease in the tax withholding rate by 4% points (i.e., the increase in the net-of-tax withholding rate of approximately 6%) raised the likelihood of a withdrawal above the notch point by 2% points ( $\hat \gamma = 0.020$ based on the extensive-margin specification of equation (2), above). This effect is also well-illustrated in Panel A of Figure 3, which shows a discernible response to the tax withholding reform. This finding highlights the importance of controlling for attrition in the intensive-margin analysis.
Graphical inspection of the difference-in-differences results, extensive and intensive margins. Panel A: Extensive margin. Panel B: Intensive margin. Notes: In both panels, the sample is restricted to individuals withdrawing $1,500 or more from their RRSPs. The extensive-margin trends in Panel A show the changes in the incidence of withdrawing strictly above $5,000 following the reform. The intensive-margin trends in Panel B show the changes in the log of RRSP withdrawals following the reform. These figures were produced using the ‘binscatter’ Stata command of Stepner (Reference Stepner2013). Source: Author's calculations from the Longitudinal Administrative Databank, Statistics Canada.

The intensive-margin results are shown in columns (2)–(5) of Table 2, conditional on the withdrawals exceeding various thresholds K so as to control for sorting. A discernible effect of the reform on large withdrawals is observed. In particular, the withdrawal elasticity to the net-of-tax withholding rate is estimated at approximately 0.40 among this sample of prime-aged withdrawers ( $\hat \gamma = 0.024$ based on the intensive-margin specification of equation (2), above, hence
 $\hat \beta = 0.400$ using equation (3)). As discussed above, the sign of this estimate is larger than what rational agency would predict, and suggests the tax withholding acts as a commitment device in practice. Interestingly, the fact that the point estimate of the treatment effect increases slightly as the threshold K is lowered from $5,000 to $4,500 suggests there may be some withdrawers slightly below the notch point who are weakly affected in some way by the reform. This intensive-margin effect is also visible in the graphical inspection of Figure 3 using
 $K = \$ 1,\!500$.
4.3 Robustness checks
This section explores the robustness of the primary regression results along several dimensions. Columns (1) and (2) of Table 3 show that the results do not change when the estimating equation is augmented to control flexibly for non-linear province-specific time trends, further suggesting that the effect of interest is well-identified and not inadvertently biased by mean-reversion. Second, columns (3) and (4) estimate the model using net withdrawals and direct withdrawals as the dependent variable, respectively. Net withdrawals are defined as withdrawals less contributions made in the same fiscal year, and direct withdrawals are defined as total withdrawals less defaults on HBP repayments, which are treated as withdrawals for the purpose of calculating taxable income and appear as such in the administrative data. Controlling for HBP defaults is important because individuals are not subjected to tax withholding in this case. These results demonstrate that the primary findings do not change when HBP defaults are accounted for. Using net withdrawals as the dependent variable dilutes the DD estimates significantly, although this effect is not surprising since the reform should only affect gross withdrawals in practice.
Robustness checks of the withdrawal elasticity estimates

Notes: ***P < 0.01; **P < 0.05; *P < 0.10. The extensive-margin analysis sets  $K = \$ 5,\!000$ and the extensive-margin analysis sets
 $K = \$ 1,\!500$. The dependent variable and threshold measure in column (3) is net withdrawals, defined as RRSP withdrawals less contributions in the same fiscal year. The dependent variable and threshold measure in column (4) is direct withdrawals, defined as withdrawals less defaults on HBP repayments occurring in the same fiscal year. Constrained withdrawers are individuals observed with EI, social assistance or disability benefits. See Table 2 for more information.
Source: Author's calculations from the Longitudinal Administrative Databank, Statistics Canada.
Column (5) of Table 3 shows how the results vary for individuals who likely withdraw to smoothen consumption. As discussed above, withdrawers in need of a fixed sum of cash for immediate consumption should decrease the amount withdrawn in response to a decline in the tax withholding rate ( $\hat \beta \lt 0$); the empirical results are consistent with this hypothesis. Thus, while tax withholding may benefit some savers by mitigating problems of myopia or temptation, there can be adverse effects when withdrawals occur for reasons of financial hardship; in the latter case, the tax withholding can be costly to individuals in need of liquidity and whose effective marginal tax rates are likely to fall below the withholding rate.
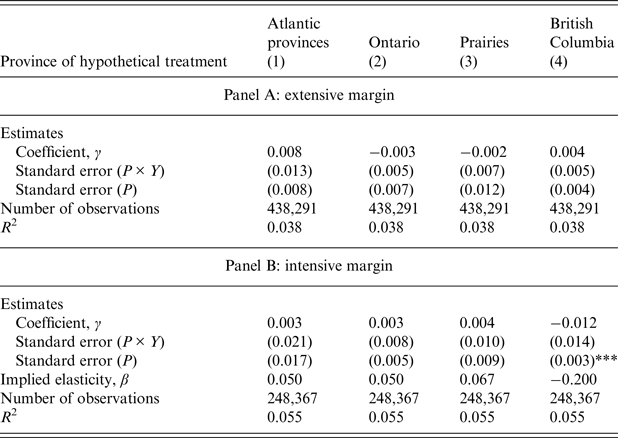
Lastly, Table 4 performs a placebo test in order to assess the validity of the empirical strategy. This analysis considers whether similar DD estimates can be obtained by supposing that the reform had occurred in another jurisdiction where the tax withholding schedule did not actually change over the time period in question. Excluding Quebec for this analysis, the table shows DD estimates assuming that a reform did occur in: (1) Atlantic provinces (New Brunswick, Newfoundland, Nova Scotia, and Prince Edward Island); (2) Ontario; (3) the prairies (Manitoba, Saskatchewan, and Alberta); and (4) British Columbia. These results show that treatment effects are very small and generally insignificant, as expected.
Placebo tests of the withdrawal elasticity estimates

Notes: *** p < 0.01; ** p < 0.05; * p < 0.10. Individuals from Quebec are excluded from this analysis given that a reform was known to occur in this province, to ensure the control group of each placebo test is not biased. See Tables 2 and 3 for more information.
Source: Author's calculations from the Longitudinal Administrative Databank, Statistics Canada.
4.4 Heterogeneity
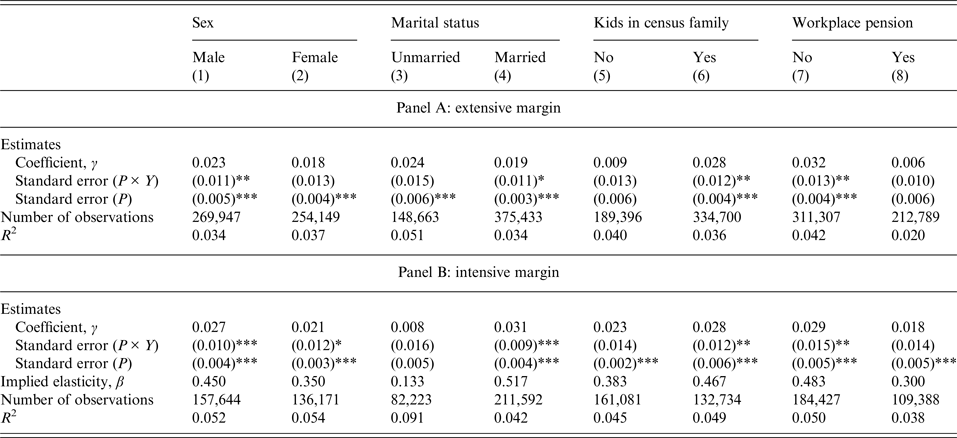
An analysis of how the withdrawal elasticity varies across types of individuals is given in Table 5. The following groups are considered: (1) male versus female; (2) married or common-law versus unmarried; (3) had versus did not have kids living in the census family as observed on tax records; and (4) by workplace pension plan coverage. On balance, individuals who are male, are married, and have kids are more responsive to tax withholding. In addition, withdrawers who do not (at the time of withdrawing) belong to a workplace pension plan are also significantly more responsive to tax withholding, indicating that source deductions are a viable commitment device especially among those who may otherwise be at risk of under-preparing for retirement.
Heterogeneous responses to the tax withholding rate reform

Notes: *** p < 0.01; ** p < 0.05; * p < 0.10. Individuals who are deemed to be married include those in common-law relationships. The indicator of having workplace pension plan coverage is based on whether a contribution to the plan is observed in the reference year. See Tables 2 and 3 for more information.
Source: Author's calculations from the Longitudinal Administrative Databank, Statistics Canada.
5 Conclusion
This study assessed the effect of tax withholding on pre-retirement withdrawals from a tax-preferred savings vehicle in Canada. By exploiting policy-induced variation in the provincial tax withholding schedules over time in a DD experimental design, the withdrawal elasticity to the net-of-tax withholding rate was estimated at approximately 0.40 for financially unconstrained withdrawers.
The sign and significance of this result is not well-explained by rational agency assuming that individuals withdraw early from retirement savings accounts in order to smooth consumption over time. Present-biased theories and fiscal illusion are favored as better explanations for why many individuals respond to a decrease in the tax withholding rate by withdrawing more from their retirement savings accounts, and the results of this study serve as prima facie evidence of such behavior. Taken together, tax withholding serves as a savings commitment device and likely raises consumer welfare to the extent that myopia or temptation is effectively mitigated, although such a distortion may also be welfare-diminishing for individuals who withdraw before retirement due to legitimate financial hardship.
It is important to note that RRSPs are a commonly-used retirement savings vehicle for Canadian tax filers of all income levels (Frenken, Reference Frenken1997), which likely occurs because funds held in these accounts are so accessible. Therefore, although building commitment devices into the design of retirement savings plans can help individuals hold onto their existing assets leading up to retirement, doing so may also have inadvertent effects on savers’ willingness to contribute to these plans in the first place. As Frenken (Reference Frenken1997) notes, while not all RRSP contributions are saved until retirement, most of tax filers’ deposits will likely remain until this time, which should mean reduced dependency on the government safety net. An optimal system is one that provides a mix of savings options with different degrees of commitment to allow savers to self-select based on their demand for lock-in versus liquidity. Tax withholding is an especially attractive form of commitment device given that it both discourages myopic withdrawal behavior and has little overall effect on lifetime wealth accumulation.
Appendix
Predicted effect of the tax withholding rate discontinuity and reform on withdrawal behavior. Panel A: Illustration of sorting. Panel B: Sorting and the tax withholding reform. Notes-1: Denote c 1 as immediate consumption from withdrawal x and c 2 as future consumption net of the remaining tax liability from the withdrawal (total tax liability less any amount withheld). Panel A depicts the RRSP withdrawal ‘bunching’ that is predicted when a notch exists in the tax withholding schedule (in the spirit of Saez (Reference Saez2010)). If agents regard the tax withholding as a distortion in consumption over time for a given x, the shaded line shows agents’ budget set when the average tax withholding rate increases at  $\bar x$. Type-I agents that withdraw below the notch are not affected by the discontinuity. However, Type-II agents who would find it optimal withdraw above the notch point in the case of uniform tax withholding rate may instead bunch at
 $\bar x$ due to the discontinuity. Notes-2: Panel B illustrates how agents are predicted to respond to a decrease in the average tax withholding rate on withdrawals above
 $\bar x$. This reform is given by a shift in the budget line from BL 0 to BL 1. Type-III agents may increase their withdrawals due to the reform. Type-II agents who bunched may find it optimal after the reform to withdraw strictly above the notch. Source: Author's calculations.

Tax withholding schedules for RRSP withdrawals

Descriptive statistics of RRSP withdrawers and withdrawals