


INTRODUCTION
Intuitively, economic development should increase confidence in government. Development reduces poverty, and governments should be rewarded for doing so. Classic economic voting theory, which articulates that citizens reward the incumbent for good times and punish the incumbent for bad, has received substantial empirical support (Lewis-Beck and Nadeau Reference Lewis-Beck and Nadeau2011). But economic development has at times coincided with exactly the opposite outcome: dissatisfaction with government. Modern China is an example; the number of protest incidents in China increased only modestly from 1997 to 1999, when economic growth was relatively slow. As China’s economy began booming again in 2001, the number and scale of protests rose sharply (Keidel Reference Keidel2005). The French Revolution, which started in the most prosperous parts of France, provides another case. As Tocqueville observes (Reference Tocqueville and Bonner1856, 156), “the parts of France that were to become the principal center of that revolution were precisely those where progress was most evident.” To reconcile this paradox, he raises the possibility that the arrival of some limited opportunity may throw into sharp relief the gap between what citizens feel they should have and what they actually have—a concept that has been termed the “aspirations gap” (Ray Reference Ray, Banerjee, Benabou and Mookherjee2006). Here, we formally capture and experimentally test Tocqueville’s verbal theory that economic development can coincide with political unrest.
This phenomenon has been dubbed the “Tocqueville Effect”; it conveys “the idea that subjective discontent (and hence the likelihood of revolution or rebellion) and objective grounds for discontent can be inversely related to each other” (Goldhammer and Elster Reference Goldhammer and Elster2011, 162–163). The theory posits that radical change often arises not during economic hardship but rather when conditions increase expectations. For those individuals who develop aspirations that are not met, their confidence in government may actually decrease when mobility increases. Recently, researchers have taken an interest in exploring Tocqueville’s ideas about how unmet aspirations can result in civil unrest. For example, Acemoglu, Egorov, and Sonin (Reference Acemoglu, Egorov and Sonin2015) present a formal model, capturing additional conditions under which economic mobility and political stability may conflict, at least for some citizens. They describe how high mobility can decrease stability if the median voter expects to move up the income distribution and thus prefers to decrease the voice given to poorer social groups.Footnote 1
Political theorists have often referred to American democracy to illustrate how economic opportunity can instead increase the strength of political institutions. In contrast to his later work about the potential for rising aspirations to generate discontent under certain circumstances, Tocqueville (Reference Tocqueville and Reeve1835) famously argued in Democracy in America that mobility increased political stability. Lipset (Reference Lipset1960), Moore (Reference Moore1966), and Blau and Duncan (Reference Blau and Duncan1967), among others, make similar points. For example, Blau and Duncan (Reference Blau and Duncan1967, 439) conclude that “the stability of American democracy is undoubtedly related to the superior chances of upward mobility in this country.” In the American case, however, mobility may have corresponded with increased political stability because economic conditions kept pace with increased expectations; this pattern contrasts with many other cases, such as those of France on the eve of the French Revolution. These counterexamples point to the fact that economic opportunity does not necessarily increase political stability, as Tocqueville suggested in his later work.
Here, we develop a formal model with two testable propositions capturing the logic of the “Tocqueville Effect.” We then test these propositions using an experiment that we carried out in Pakistan. The experiment utilizes standard treatments to subtly manipulate either a participant’s perceptions of her own economic well-being or her perceptions of possibilities for upward mobility in Pakistan, employing a 2 (poverty prime, no poverty prime) × 2 (mobility prime, no mobility prime) research design. We then assess how these primes individually and jointly affect confidence in government. We find substantial empirical support for the model’s predictions.
While the implications of our model apply more broadly, Pakistan is an interesting context for several reasons. First, it is a lower middle-income country with the world’s sixth-largest population (Central Intelligence Agency 2015), lending Pakistan a great degree of geopolitical significance. Second, Pakistan is a young democracy, which has made genuine democratic progress over the last few years.Footnote 2 Third, Pakistan has a fragile security situation. A number of militant organizations operate in Pakistan, threatening further domestic progress and international stability (Lamb Reference Lamb2008; Ghani and Lockhart Reference Ghani and Lockhart2009; Blair, Neumann, and Olson Reference Blair, Neumann and Olson2014). Lessons from Pakistan may be useful for understanding peace and stability in other similar contexts. Finally, Pakistan is a relatively mobile country; Corak (Reference Corak2012) found that Pakistan has the same level of intergenerational mobility found in Switzerland, and higher mobility than many of the 22 other countries studied, including the United States, the United Kingdom, Italy, and China.Footnote 3 Pakistan is thus a setting in which confidence in government has particularly important implications and where it is interesting to observe whether the “Tocqueville Effect” operates.
This article is organized as follows. We first describe the logic of Tocqueville’s theory that economic development and mobility may generate dissatisfaction with government if expectations outpace actual living standards. We then formalize Tocqueville’s verbal theory and generate predictions for the conditions under which confidence in government and mobility will be inversely related. Next, we test these ideas in an experimental setting, finding that if high aspirers feel relatively poor and experience a sense of economic mobility that makes advancement to a better economic condition seem possible, support for government tends to erode, and this leads to political discontent. We conclude by discussing the implications for our understanding of the relationship between economic development and democratic institutions.
THEORY OF MOBILITY, POVERTY, AND ASPIRATIONS
To formalize Tocqueville’s verbal theory, we consider two distinct and related concepts: relative poverty and mobility. The former describes one’s current economic position, while the latter describes the potential for change in one’s conditions. As predicted by classic economic voting theory, citizens should prefer governments that improve their living conditions, all else equal (Lewis-Beck and Nadeau Reference Lewis-Beck and Nadeau2011). However, Tocqueville (Reference Tocqueville and Bonner1856) raises additional considerations, challenging classic economic voting theory; he devotes considerable attention to the implications of mobility and economic development for political discontent. A sense of mobility and economic opportunity may paradoxically increase political discontent if expectations increase more rapidly than do improvements in one’s actual or perceived current position. If generally true, this would suggest that the relationship between economic condition, as well as changes in those conditions, and confidence in the political system is more nuanced than most theory and empirical evidence would suggest.
The “tunnel” effect of Hirschman and Rothschild (Reference Hirschman and Rothschild1973) helps clarify Tocqueville’s idea. They pose a scenario in which a person is stuck in a traffic jam in a multilane tunnel and, suddenly, the lane next to that person starts to move while she remains stuck. This person will at first feel happy, as this is a signal that their lane will soon begin moving as well. As time passes, however, seeing that the next lane is continuing to move while she remains stationary leads to frustration. Tocqueville’s thesis posits that for some individuals, the arrival of a sense of mobility (e.g., opportunity for economic advancement) may lead them to develop aspirations that are not met, thus actually decreasing confidence in government.
Ray (Reference Ray, Banerjee, Benabou and Mookherjee2006, 5–6) provides additional insight and clarity on the logic of Tocqueville’s thesis:
Tocqueville’s argument is clear: iniquities and oppressions that are cloaked with implacable inevitability can be borne. Once this sense of inevitable oppression is removed by increased mobility and increased economic development (at least in aggregate terms), the aspirations window must widen. This, in turn, will increase the aspirations gap—the difference between the standard of living that’s aspired for and the standard of living that one currently has—unless all actual standards of living can keep pace with changing aspirations. The result may very well be increased conflict, rather than less.Footnote 4
Following Ray’s interpretation of Tocqueville, an increase in aspirations due to a greater sense of mobility coupled with a perception that one’s status quo is lower would increase the aspirations gap and thus unambiguously generate dissatisfaction with the government. However, if expectations decline or do not change, and perceived or actual economic positions improve, then the gap should shrink. The predictions of classic economic voting theory should then hold—with citizens rewarding government for economic improvements (Lewis-Beck Reference Lewis-Beck1988).
In addition, increases in poverty and mobility may have heterogeneous impacts across individuals according to their initial aspirations. As Tocqueville (Reference Tocqueville and Bonner1856, 217) wrote of the improving living standards before the French Revolution, economic hardship “appeared intolerable to those who, thirty years before, might have borne them without complaint. . .capitalists, merchants, manufacturers, and other businessmen. . .were now more impatient and more resolutely bent on reform than any other section of the people.” Having greater exposure to potential increases in their own living standards, the middle class actually experienced the largest increase in discontent, as opposed to the poor who had little reason to aspire for more. It is thus important not only to consider the impacts of perceived relative poverty and mobility on support for government but also to understand how they impact high aspirers in particular.
Formal Model
We formalize Tocqueville’s ideas in an intertemporal model capturing confidence in government institutions as a function of economic conditions (i.e., poverty or perceived poverty) and opportunity (i.e., mobility), allowing perceived opportunity to vary across individuals. This exercise allows us to map out the logic of his verbal theory.
Define an individual i’s confidence in government, C i , to be a function of the aspirations gap between her current income, y i , and where she would like to be—her goal, g i . By assumption, g i is always greater than or equal to y i , so the individual never aspires to less than she already has. This assumption is based on two considerations. First, even in a society where income is falling, individuals will generally set goals to achieve income above their current level. Distinct from expectations, goals capture preferences and thus are unlikely to be lower than one’s current position. Second, Tocqueville’s verbal theory and our empirical situation refer to an environment of economic growth where goals are particularly likely to either equal or exceed current levels.
To simplify, we consider a simple quadratic functional form where confidence decreases as the aspirations gap (g i − y i , or the difference between the goal and current income) increases. This specification is similar to many models in the spatial voting literature where citizens’ utilities depend on the distance between a policy outcome and their personal ideal point (e.g., Persson and Tabellini Reference Persson and Tabellini2002). The main results still hold if we use a more general functional form.
 $$\begin{equation}
C_i= -(g_i-y_i)^2
\end{equation}$$
We suppose that income is a function of a baseline income level, y 0. Changes from that baseline are influenced by the level of mobility in society, m. Again, following the type of societies that could be subject to Tocqueville’s paradox, we assume mobility to be upward rather than downward so that m ≥ 0. We also allow for an idiosyncratic income shock, u i , of mean zero. Greater opportunity captures both a higher average change in income and a greater possibility for change in one’s place in the income distribution. As in our experimental treatment, mobility thus represents not only a higher variance in that distribution but also a greater overall potential for advancement. In a society with zero mobility, the income distribution is assumed to be static.
 $$\begin{equation}
y = y_0+m(1+u_i)
\end{equation}$$
Goals are determined by an individual’s baseline level of goals, g
0, changes in an individual’s own income relative to the baseline (y − y
0), and changes in mean income relative to baseline across all other individuals in the economy (
 $\bar{y}-\bar{y_0}$
). We assume that the number of individuals is large so that the idiosyncratic income shocks sum to zero across the economy.
 $$\begin{equation}
g = g_0+\alpha (y-y_0)+\beta (\bar{y}-\bar{y_0})
\end{equation}$$
We assume that goals are sticky, so that when personal or society-wide income increases, goals adjust by α and β, respectively. However, this adjustment is not as quick as the change in income. Conversely, if income falls, goals adjust downward, but not as far as the fall in income. This is summarized by Assumption 1.
Assumption 1: Goals adjust when income changes, but not fully.
 $$\begin{equation*}
0<\alpha <1 \nonumber
\end{equation*}$$
 $$\begin{equation*}
0<\beta <1 \nonumber
\end{equation*}$$
Assumption 1 leads to our first proposition:
Proposition 1: Under Assumption 1, an increase in an individual’s idiosyncratic income shock increases a citizen’s confidence in government.
Proof. Using the definition of y in Equation (2) to substitute into Equation (3), we have
 $$\begin{equation*}
g = g_0+\alpha (m(1+u_i))+\beta (m(1+\bar{u_i})). \nonumber
\end{equation*}$$
Because the idiosyncratic income shock averages to zero across the population,
 $$\begin{equation*}
g = g_0+\alpha (m(1+u_i))+\beta m. \nonumber
\end{equation*}$$
Substituting this into Equation (1) and taking the derivative of confidence with respect to the individual’s idiosyncratic income shock, we find
 $$\begin{eqnarray*}
\frac{\partial C}{\partial u_i}&=& -2(g-y)\bigg (\frac{\partial g}{\partial u_i}-\frac{\partial y}{\partial u_i}\bigg ) = -2(g-y)(\alpha m - m)\nonumber \\
&=& 2m(g-y)(1-\alpha ).
\end{eqnarray*}$$
Under Assumption 1, α < 1. Since g i is always greater than or equal to y i , we have
 $$\begin{equation*}
\frac{\partial C}{\partial u_i}>0. \nonumber
\end{equation*}$$
 $\Box$
The intuition behind Proposition 1 is that when an individual experiences a positive shock to her economic well-being, her confidence in government increases. Conversely, if she experiences a negative shock, confidence decreases. Empirically, we predict that a more positive income shock leads to more confidence in government. We can similarly find how confidence changes in response to a change in mobility, m, in the economy. In Proposition 2, we conclude that mobility by itself has an ambiguous effect on confidence in government.
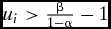
Proposition 2: Confidence is increasing in mobility if and only if
 $u_i>\frac{\beta }{1-\alpha }-1$
.
Proof.
 $$\begin{eqnarray*}
\frac{\partial C}{\partial m}&=&-2(g-y)\bigg (\frac{\partial g}{\partial m} -\frac{\partial y}{\partial m}\bigg ) \nonumber\\
&=&-2(g-y)(\alpha (1+u_i) + \beta - (1+u_i) ) \nonumber\\
&=&-2(g-y)((\alpha -1)u_i + \beta + (\alpha -1)) \nonumber\\
&=& 2(g-y)((1-\alpha )u_i - \beta + (1-\alpha )).
\end{eqnarray*}$$
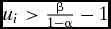
This expression shows that confidence is increasing in mobility if
 $u_i>\frac{\beta }{1-\alpha }-1$
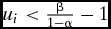
and decreasing in mobility if
 $u_i<\frac{\beta }{1-\alpha }-1$
.
 $\Box$
Intuitively, mobility will increase confidence for citizens experiencing sufficiently large positive idiosyncratic income shocks, but not for others. Citizens who have sufficiently large boosts to their economic well-being will advance closer to their goals and thus respond positively to mobility. But for other citizens with less luck individually, greater mobility pushes their goal higher without a sufficient increase in income to compensate. Confidence for the relatively less fortunate can thus decrease as mobility rises.
Empirically, Proposition 2 predicts that increasing mobility has an ambiguous effect on confidence. One subtle point is that it does not say that, starting from current conditions, the cross derivative with respect to mobility and income is positive. In fact, that nuanced relationship has an ambiguous sign as we show below in Proposition 3. The takeaway from Proposition 2 is simply that higher mobility increases confidence in government if the level of the income shock is high and decreases it if the level is low.
In Proposition 3, we consider how confidence in government changes when both mobility and the income shock change at the same time. We also consider how those changes interact with an individual’s aspirations, a key component of Tocqueville’s theory. While his theory could be taken to predict an interaction between mobility and income without reference to aspirations, it was actually based largely on his observations of certain classes of citizens who in our model would be called the high aspirers. These are the capitalists, merchants, manufacturers, and other businessmen Tocqueville described, whose relatively high aspirations meant that their confidence in government was eroded more than that of “any other section of the people” (Tocqueville Reference Tocqueville and Bonner1856, 217).
In keeping with these ideas, Proposition 3 describes how one’s initial aspirations mediate the subtle interaction between income, mobility, and confidence. Specifically, citizens with the highest aspirations, identified below as those with higher values of g 0 − y 0, are the ones who feel loss more acutely when their income falls short in a mobile society.Footnote 5
Proposition 3: Confidence is unambiguously decreasing in the initial aspirations gap, g 0 − y 0, for individuals in high-mobility societies who experience decreases in income.
Proof.
 $$\begin{eqnarray*}
\frac{\partial }{\partial u_i}\bigg (\frac{\partial C}{\partial m}\bigg )&=&2\bigg (\frac{\partial g}{\partial u_i}-\frac{\partial y}{\partial u_i}\bigg )((1-\alpha )u_i \nonumber\\
&&-\, \beta +(1-\alpha ))+2(g-y)(1-\alpha )\\
&=&2(\alpha m-m)((1-\alpha )u_i - \beta +(1-\alpha )) \nonumber\\
&&+\,2(g-y)(1-\alpha )\\
&=&2(\alpha -1)m((1-\alpha )u_i - \beta +(1-\alpha ))\nonumber\\
&&+\,2(1-\alpha )(g-y)\\
&=&2(1-\alpha )((g-y)-(1-\alpha )mu_i\\
&& +\, \beta m-(1-\alpha )m). \nonumber\\
\end{eqnarray*}$$
Using the definition of g and y, we have
 $$\begin{eqnarray*}
g-y=g_0-y_0-(1-\alpha )m(1+u_i)+\beta m. \nonumber
\end{eqnarray*}$$
So the above derivative becomes
 $$\begin{eqnarray*}
\frac{\partial }{\partial u_i}\bigg (\frac{\partial C}{\partial m}\bigg )&=&2(1-\alpha )(g_0-y_0-(1-\alpha )m(1+u_i)\\\nonumber
&&+\,\beta m-(1-\alpha )mu_i + \beta m-(1-\alpha )m) \nonumber\\
&=&2(1-\alpha )(g_0-y_0-2(1-\alpha )m\nonumber\\
&&-\,2(1-\alpha )mu_i+2\beta m).
\end{eqnarray*}$$
The above expression may be positive or negative, depending on the sign of the term inside the second set of parentheses, but it is strictly increasing in the initial aspirations gap, g
0 − y
0. Therefore, when mobility increases and income falls, the expression is strictly decreasing in the initial aspirations gap.
 $\Box$
Proposition 3 states that while income and mobility changes interact in a nuanced way that has an ambiguous prediction overall, what is unambiguous is that a negative income shock combines with rising mobility to hit particularly those citizens who aspire the most. When income falls short in a high-mobility environment, confidence in government is eroded the most for those with large initial aspirations gaps. If this theory is correct empirically, citizens with high aspirations at the outset should be the ones who respond particularly strongly to feeling poor when mobility is high. Specifically, the interaction between increased perceptions of mobility, a heightened perception that one’s income is relatively low, and a high aspirations gap at the outset should have a negative effect on confidence in government.
In the following sections, we test the predictions of the propositions generating unambiguous predictions—namely, Propositions 1 and 3. We do so using data from a survey experiment conducted in Pakistan.
DATA
Our results come from an original survey conducted in rural Pakistan in March–April 2012 (Round 1) and April–May 2013 (Round 2). In Round 1, we collected all demographic variables and carried out a large module on individuals’ aspirations, attitudes, and cognitive processes. In Round 2, the data collection included the experimental treatment, as well as a governance module.Footnote 6 In other words, aside from our outcome measures, all data were collected prior to the experiment. The 1-year time lag between the measurement of both our moderating variables and demographic characteristics, and all outcome variables is advantageous, as we can rule out the possibility that our experimental treatments impacted our moderating and demographic variables.
The survey covered 2,090 households in 76 villages in Punjab, Sindh, and Khyber-Pakhtunkhwa (KPK) provinces.Footnote 7 The head of each household and his/her spouse completed household surveys. We included a module on aspirations in Round 1 of the survey, informed by the survey questions on aspirations carried out by Bernard and Taffesse (Reference Bernard and Taffesse2012) and Bernard and Taffesse (Reference Bernard and Taffesse2014). The governance module carried out in Round 2 began with an experiment, described in the next section, followed by a series of political attitude questions. A detailed description of each measure is provided in the Measurement section below. To ensure that variation in results is not due to using different samples, we restrict our estimation sample to the 1,540 individuals with complete responses on all questions.Footnote 8
RESEARCH DESIGN
We employ a 2 (poverty prime, no poverty prime) × 2 (mobility prime, no mobility prime) research design to exogenously manipulate individual perceptions of their own poverty level and possibilities for upward mobility in Pakistan.Footnote 9 We then observe how these primes individually and jointly affect confidence in government, and how their impacts vary according to an individual’s initial aspirations gap.
Question ordering is as follows: (1) the poverty prime (or no poverty prime); (2) three miscellaneous questions about labor; (3) the mobility prime (or no mobility prime); (4) five questions about perceptions of economic mobility in Pakistan, which includes a manipulation check question for the mobility prime (Mutz and Pemantle Reference Mutz and Pemantle2015); and (5) our outcome measures related to confidence in government.Footnote 10 Measures of demographic characteristics and respondents’ aspirations gaps were all asked one year before the experiment.
In this section, we first explain the experimental treatments. We then outline our outcome measures and how we measure the aspirations gap given that our theory predicts that the effects of poverty and mobility are impacted by one’s initial aspirations gap. Finally, we describe the empirical strategy to test our model’s propositions.
The Poverty Prime Treatment
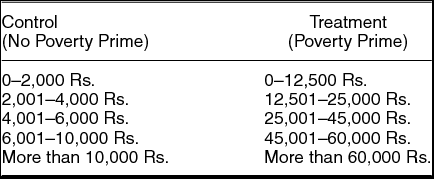
Study participants were either induced to feel relatively poor, which we refer to as receiving a poverty prime, or were assigned to a control condition designed to frame their income neutrally. The half assigned to the relatively poor condition were primed to feel that their income was in the bottom part of the income distribution. The half assigned to the control condition were made to feel that their income was more typical (e.g., the median income level). Specifically, we asked respondents the following question: “Income is the amount of cash income you earn from all agricultural and nonagricultural activities, and money from the Benazir Income Support Programme (BISP) or other programs. How much income did your family earn last month?” We then randomly assigned them to one of two sets of response options with differing income bracket reference points, which are noted in Table 1.
Poverty Prime Treatment Response Options

This research design is a variation of the prime used in Haisley, Mostafa, and Loewenstein (Reference Haisley, Mostafa and Loewenstein2008) to study the decision to participate in lotteries. Mo (Reference Mo2012; Reference Mo2017) introduced the design to political science as a way to experimentally manipulate feelings of relative poverty in her study of the effects of relative deprivation on vulnerability, and Fair, Littman, Malhotra, and Shapiro (Reference Fair, Littman, Malhotra and Shapiro2015) replicated this design in Pakistan. The logic of this prime is based on previous research showing that response options to ordinal or interval questions can send cues—in those experiments, unintended cues—to respondents about what responses are normal (e.g., Courneya, Jones, Rhodes, and Blanchard Reference Courneya, Jones, Rhodes and Blanchard2003; Menon, Raghubir, and Schwarz Reference Menon, Raghubir and Schwarz1997; Rockwood, Sangster, and Dillman Reference Rockwood, Sangster and Dillman1997; Shwarz, Hipper, Deutsch, and Strack Reference Shwarz, Hipper, Deutsch and Strack1985). Research has shown that respondents frequently assume that the ranges offered by a question were purposely selected so that the middle response is the modal or most customary response. The midpoint response changes the reference point on which respondents focus, and their sense of economic well-being is then assessed in relation to this reference point. Research in decision making, economics, and psychology has repeatedly found that people do not simply evaluate the absolute value of income, performance, achievements, status, and so on (Crosby Reference Crosby1976; Festinger Reference Festinger1954; Suls and Wheeler Reference Suls and Wheeler2000; Walker and Smith Reference Walker and Smith2001). Rather, these evaluations are heavily influenced by comparisons with others, and reference points can significantly impact how people feel and make decisions (Heath, Larrick, and Wu Reference Heath, Larrick and Wu1999; Kahneman and Tversky Reference Kahneman and Tversky1979).
As such, the different income brackets offered in the treatment (primed to feel relatively poor) versus control group provide respondents with a different set of expectations on what the typical person should have. This acts as a subtle prime to induce those in the treatment group to feel relatively deprived and that their economic status quo is particularly low, and induces those in the control group to feel that their economic status is typical, as they answer questions. The middle income bracket in the control group is only 4,001–6,000 Rs., whereas the middle income bracket in the treatment group is much higher, at 25,001–45,000 Rs. In other words, respondents in the treatment group are more likely, compared to the control group, to place themselves in the lowest income bracket. This is indeed what we see; 73.7% of study participants primed to feel poor assigned themselves to the bottom income bracket, compared to only 34.1% of participants in the control group (p < 0.001). Actual income measured pretreatment—whether measured in terms of monthly household income or monthly household expenditures—is almost identical regardless of treatment assignment (p = 0.15 and p = 0.83, respectively; see the last column of rows (2) and (3) in Table A.2 in Online Appendix A). In the Analysis of Prime Effectiveness and Manipulation Checks section, we conduct a manipulation check and verify that the prime had its intended effect.
The Mobility Prime Treatment
In a multitude of laboratory and survey contexts, a range of subtle interventions have been shown to activate hypothesized attitude changes and behaviors. We draw on extant research on primes (e.g., Berger, Meredith, and Wheeler Reference Berger, Meredith and Wheeler2008; DeMarree, Wheeler, and Petty Reference DeMarree, Wheeler and Petty2005; Lodge and Taber Reference Lodge and Taber2005) to assess the impact of perceived mobility on confidence in government. To exogenously change how study participants felt about whether Pakistan offers high levels of economic mobility, respondents were randomly assigned to be read the following statement about economic mobility in Pakistan, based upon findings reported by Corak (Reference Corak2012): “A 2012 study of 22 countries conducted by the Organisation for Economic Co-operation and Development has found that Pakistan offers higher mobility – the ability of an individual or family to improve their economic and social status – than the United States, the United Kingdom, Italy, China, and 5 other countries.”Footnote 11 In other words, half of the study's respondents received this mobility priming information to increase their perception that it is possible to increase their economic and social status in Pakistan, and the other half received no such information before being asked about their political attitudes.
In the Results section, we implement a manipulation check and show that this prime was successful. The measure we use to conduct this test is described in the Measurement section below.
Empirical Analyses
To assess whether being made to feel relatively poor (Proposition 1) and more mobile (Proposition 2) increased or decreased confidence in government, we estimate the following ordinary least squares (OLS) regression model:
 $$\begin{equation}
G_{i}= \alpha _{i} +\beta _{1}M_{i}+\beta _{2}P_{i}+\beta _{3}MP_{i} +\gamma _{i}{\bf X}_{i}+\epsilon _{i},
\end{equation}$$
where M i is a dummy variable coded as “1” if respondent i is assigned to the mobility condition, P i is a dummy variable coded as “1” if respondent i is assigned to the relatively poor condition, MP i is a dummy variable coded as “1” if a respondent received both the relatively poverty prime and the mobility prime, G i is an individual’s confidence in government, and X i is a vector of individual and household demographic characteristics, described in detail below. β2 and β1 are the parameters of interest for Propositions 1 and 2, respectively. According to Proposition 1, β2 should be negative. According to Proposition 2, the sign and statistical significance of β1 is ambiguous, as the sign depends on the extent to which an individual’s goals adjust when personal income (α from Assumption 1 in the formal model) and the income of others in the economy (β from Assumption 1 in the our formal model) change. Standard errors are clustered at the household level because key factors influencing political attitudes vary at this level.
In order to test whether simultaneous increases in mobility and poverty have a more adverse effect on confidence in government for citizens with high aspirations (Proposition 3), we include an interaction term between each treatment condition and one’s aspiration level, controlling for one’s status quo endowment to capture the concept of an aspirations gap. In other words, we estimate the following regression model:
 $$\begin{eqnarray}
G_{i}&=& \pi _{i} +\theta _{1}M_{i}+\theta _{2}P_{i}+\theta _{3}MP_{i} +\theta _{4}A_{i} +\theta _{5}P_{i} \times A_{i} \nonumber\\
&&+\,\theta _{6}M_{i} \times A_{i}+\theta _{7}MP_{i} \times A_{i}+\Gamma _{i}{\bf X}_{i}+e_{i},
\end{eqnarray}$$
where A i is individual i’s aspiration level pretreatment and captures the level of income, asset wealth, education, and social status—typical areas in which individuals have aspirations—that individuals would like to obtain; the Measurement section describes its construction. θ7 is the parameter of interest for Proposition 3; it should be negative and statistically significant. To remain consistent with our formal model in which we measure the aspirations gap as the difference between one’s goal and the status quo, our control vector X i includes status quo measures of the components comprising our aspiration measure. When we assess the effect of A i , we thus capture the aspirations gap, or the distance between what individuals already have and what they aspire to have. π i and e i are the constant term and the error term, respectively. Again, standard errors are clustered at the household level.Footnote 12
Measurement
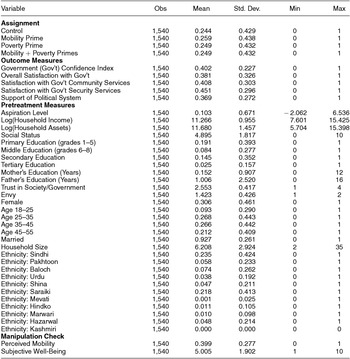
Table 2 summarizes our measures of government confidence, aspirations, pretreatment demographic controls, and measures employed for our manipulation checks. Households are nearly evenly divided between our four study arms: control, poverty prime, mobility prime, and both primes (see rows (2)–(5) of Table 2). About 70% of the sample is male, reflecting a higher response rate for men, more willingness to freely articulate opinions and beliefs among men in Pakistan, as well as lower rates of attrition for men between rounds.Footnote 13 Of the respondents, 93% are married and 45% have received some formal education. The average household has 6.2 members.
Summary Statistics

Outcome Measure: Confidence in Government
We measure confidence in government using the answers to four questions aimed at eliciting individuals’ degree of support for the political system and efforts of government actors. The first question asks, “In your opinion, to what extent do you think that one should support the political system of Pakistan?” Individuals were asked to select either not at all (0), a little (1), somewhat (2), a lot (3), or a great deal (4). We rescaled this to be a 0–1 variable by dividing the individual’s selected answer by 4. A rescaled score of 0.5, therefore, indicates a belief that one should support the political system of Pakistan somewhat. The mean of this variable is 0.37.
The second question asks, “What is your overall level of satisfaction with the government?” The third question asks, “How satisfied are you with the government’s efforts to provide your community with access to schools and health facilities?” Finally, the fourth question asks, “How satisfied are you with the government’s efforts to provide security for your community?” The response choices to all three of these latter questions are as follows: extremely dissatisfied (0), moderately dissatisfied (1), slightly dissatisfied (2), neither satisfied nor dissatisfied (3), slightly satisfied (4), moderately satisfied (5), and extremely satisfied (6). We also rescaled each of these 7-point scale questions to be 0–1 variables, in this case by dividing the individual’s selected answer by 6. A rescaled score of 0.5 indicates neither satisfaction nor dissatisfaction with the government. The means of these variables are 0.38, 0.41, and 0.45, respectively (see Table 2).
When one measures the same phenomenon in several different ways, there is a high risk of detecting some significant effects merely due to chance (Benjamini and Hochberg Reference Benjamini and Hochberg1995; Benjamini, Krieger, and Yekutieli Reference Benjamini, Krieger and Yekutieli2006). This is the problem of multiple hypothesis testing, and it carries the risk of one falsely concluding that there is a statistically significant empirical finding when there is not. We circumvent this problem by combining our four measures of satisfaction with government into a single index, computed by taking an average of the four underlying variables.Footnote 14 Moreover, the advantage of an averaged measure is that it nets out measurement error associated with any one of the index components (Ansolabehere, Rodden, and Snyder Reference Ansolabehere, Rodden and Snyder2008). Our government confidence index has a mean of 0.40 and a standard deviation of 0.23. If we detect significant changes in this index, we can be relatively confident that they reflect true changes in confidence in government, as opposed to errors in the measurement of a single dimension that yields a spurious correlation. We consider each of the four measures separately as a robustness check.
Aspiration Level
We measure an individual’s pretreatment aspiration level using an index similar to that used by Bernard and Taffesse (Reference Bernard and Taffesse2014). The index is constructed using respondents’ answers to questions about their aspirations along four dimensions: income, asset wealth, education, and social status.Footnote 15 Specifically, respondents were asked to report the level of personal income, the value of assets, the level of education (recoded as desired years of education), and the level of social status (on a 10-step ladder of possibilities) they would like to achieve. While there is a potentially infinite number of dimensions on which an individual could aspire, we argue that these four capture a large and important share of aspirations. Question wording can be found in Online Appendix B.
We combined these four aspiration levels into an index using the following methodology. First, we normalized each respondent’s aspiration level on each dimension by subtracting the average level for individuals in the same district (there are 19 districts in our sample) and then dividing this difference by the standard deviation for individuals in the same district.Footnote 16 We examine the individual’s aspirations relative to the district, as an individual’s aspiration levels are affected by a process of social comparison with others in the individual’s social environment or reference group (e.g., Festinger Reference Festinger1954; Merton and Rossi Reference Merton, Rossi, Merton and Lazarsfeld1950; Suls and Wheeler Reference Suls and Wheeler2000). We then asked each individual to allocate 20 beans across the four dimensions according to their relative importance, and weighted each dimension by the share of beans placed on it. This yields the following index:
 $$\begin{equation}
{\hbox{\it Aspiration}} \hspace{4.26773pt} Level = {{\sum _{n=1}^4}}\left(\frac{a^{i}_n-\mu ^{d}_n}{\sigma ^{d}_n}\right) w^i_{n},
\end{equation}$$
where ai n is the aspired outcome of individual i on dimension n (income, asset wealth, education, or social status), and μ d n is the average aspired outcome in district d for outcome n. The standard deviation of aspired outcomes in district d for outcome n is σ d n . Finally, wi n is the weight individual i places on dimension n, and these four weights sum to 1. Poverty and economic opportunities vary widely across districts. To the extent that the district average aspiration level represents what is typically possible to achieve in a district, our measure of aspirations captures the distance between what is generally possible and what an individual aspires to achieve.
Table 2 includes summary statistics for our aspiration level index. The average individual has an aspiration level of 0.10, with a standard deviation of 0.67. The aspiration level takes both negative and positive values given it is a normalized measure, and its mean is close to 0.Footnote 17
Demographic Characteristics
We consider several demographic controls in all analysis that consider aspiration levels; these variables are captured by our control vector, X i .Footnote 18 We aimed to control for those features of an individual that should have a direct impact on their aspiration level, as measured by our aspiration index. These include their current logged household income, logged household asset wealth, social status (on a 1 through 10 scale), and education level (no formal education, primary education, middle education, high/intermediate education, and postsecondary education).Footnote 19 Inclusion of these controls lends our aspiration index measure the interpretation of reflecting an aspirations gap, as it measures aspirations after accounting for status quo endowments.
Given our reliance on randomization of treatment in the context of an experiment, we can identify the causal impacts of our poverty and mobility primes without the need for other controls. Nonetheless, including several controls can increase the precision of our estimates, in case there are small imbalances across treatment arms. Indeed, as shown in the balance tests in Table A.2 in Online Appendix A, we have select cases of imbalance. For example, those that received the mobility prime have slightly higher incomes than do those that did not receive any prime, and those that received both primes also have slightly higher incomes than do those that received no prime. Also, those that received both primes have fathers with slightly more education than do those that did not receive any prime or those that received only the mobility prime. Nevertheless, out of 30 joint tests of imbalance, there are only two cases of imbalance between treatment groups (i.e., where p < 0.10), which suggests that random assignment was highly successful.
We control for a measure of the individual’s level of trust in others, and their degree of envy of others, given that they may be correlated with attitudes toward government and our poverty and mobility treatments.Footnote 20 We also control for key demographic characteristics that might influence political opinions. These include their father’s education level (in years), mother’s education level (in years), gender,Footnote 21 age group (18–25, 25–35, 35–45, 45–55, and over 55), ethnicity,Footnote 22 and household size. Finally, we estimate specifications with district fixed effects and village fixed effects.
RESULTS
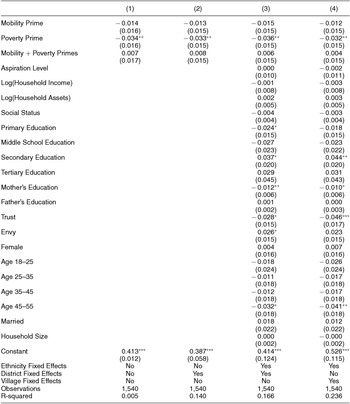
Our main regression results that test the “Tocqueville Effect” appear in Table 3, where the outcome is our government confidence index. Column (1) shows our baseline results.Footnote 23 Those randomly assigned to receive only the poverty prime, which causes individuals to feel relatively poor, report significantly lower satisfaction with government than do those who received no primes; this is consistent with Proposition 1 (p = 0.04). Receiving only the poverty prime leads to a 3.4 percentage point reduction in government satisfaction (see column (1) of Table 3); this is a sizable, 8.5% decrease relative to the mean value of the government confidence index. This effect size is especially large in light of this being a survey experiment; rather than actually making individuals relatively poorer, our treatment subtly primes them to feel this way. One might expect even larger impacts on confidence in government if we were to actually change individuals’ relative welfare. This suggests that if anything, our estimates are lower bounds on the magnitude of the impacts on confidence in government resulting from feeling relatively poor. The magnitude and significance of this result is not sensitive to the inclusion of district or village fixed effects or demographic control variables (columns (2)–(4)), which provides reassurance that the randomized experiment was implemented correctly.Footnote 24
Impact of Mobility and Relative Poverty on Government Confidence

Notes: Robust standard errors are in parentheses and clustered at the household level. *p < 0.10, **p < 0.05, ***p < 0.01.
Receiving only the mobility prime leads to no substantive change in the government confidence index (β = −0.014; p = 0.38; see column (1) of Table 3), and this effect is further statistically insignificant at conventional levels. Finally, we see no significant impact on government confidence for those who received both primes (β = 0.007; p = 0.70). The negative impact on confidence in government of being primed to feel relatively poor is, on average, neutralized when individuals are simultaneously primed to feel mobile. Again, the findings in column (1) are robust to the inclusion of district or village fixed effects and demographic controls.
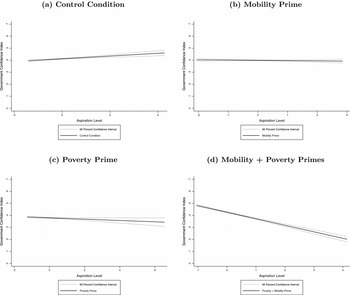
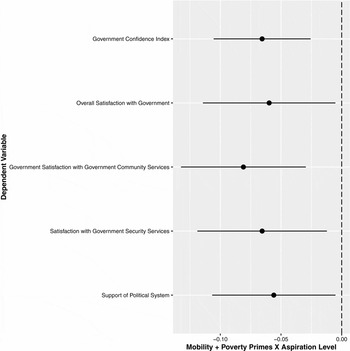
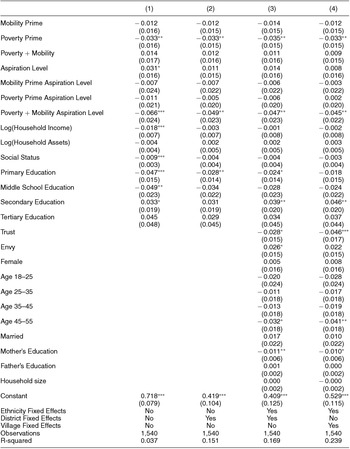
When we interact each of our three treatment arm dummies (receipt of the mobility prime, poverty prime, and both primes) with aspirations, controlling for present-day endowments, we see evidence consistent with Proposition 3, which captures the main thesis of Tocqueville (Reference Tocqueville and Bonner1856). Specifically, this thesis predicts that confidence in government among high-aspiring citizens declines when their perceived relative position decreases and perceived mobility increases, because these are the citizens that experience the greatest aspirations gap when they are made to feel both relatively poor and mobile. As shown in column (1) of Table 4 and visualized in Figure 1(d),Footnote 25 this is precisely what we find. Among those with relatively high aspiration levels (and hence large aspirations gaps), receiving both primes has a large and significant negative impact on confidence in government—specifically, a 6.6 percentage point reduction in satisfaction for every one-unit increase in aspirations (p = 0.007; see column (1) of Table 4). This is a large, 16.4% decrease in government confidence relative to the mean of the index. This negative effect is statistically significant for each of the four individual measures that make up the government confidence index as well, as Figure 2 shows.Footnote 26 Moreover, these findings are robust to the inclusion of district or village fixed effects and demographic controls. We take this as strong evidence supporting Proposition 3 and Tocqueville’s verbal hypothesis.
Effect of Aspiration Level on Government Confidence Index by Condition

Interaction Effect between Mobility + Poverty Primes and Aspiration Level on Each Government Confidence Index Measure

Impact of Mobility and Relative Poverty on Government Confidence by Aspiration Level

Notes: Robust standard errors are in parentheses and clustered at the household level. *p < 0.10, **p < 0.05, ***p < 0.01.
As in our results without interactions with the aspirations gap, receiving the mobility prime alone once again has both an economically and statistically insignificant effect on confidence in government—and this effect also does not vary with the aspirations gap (see row (4) of Table 4 and Figure 1(b)). Additionally, receiving the poverty prime alone is once again associated with lower satisfaction with government (see row (2) of Table 4), and this effect does not vary according to the individual’s aspirations gap (see Figure 1(c)).
By examining the coefficients on receiving both primes, and on receiving both primes interacted with the aspirations gap, we see that for the nearly 40% of the sample with the highest aspirations gaps,Footnote 27 receiving both primes has a negative impact on confidence in government.Footnote 28 This is a sizable and intuitive share of the sample for which Tocqueville’s thesis holds: it is those who, by virtue of having sufficiently high aspirations gaps, are able to have their sense of mobility and perceived relative poverty updated by our experiment. For the other 60% of the sample with relatively low aspirations gaps, receiving both the mobility and poverty primes has either no effect or a positive effect on government satisfaction. It may be the case that for individuals with low aspirations after controlling for status quo endowments (i.e., with large aspirations gaps), no amount of priming can alter or impact their perception that they are deprived and immobile.
While the randomization of our experiment deals with the endogeneity of perceived poverty and perceived economic mobility, one might potentially be concerned that our measure of the aspirations gap is correlated with other factors that determine confidence in government. Namely, government policies may favor some groups over others. While we address this in part by showing no sensitivity of our results to the inclusion of a battery of demographic controls including the ethnicity of the household head, one may still be concerned that high aspirations gaps are correlated with whether the household is a beneficiary of recent economic growth. To examine whether or not this is the case, Tables A.4 and A.5 in Online Appendix A examine whether our results from Tables 3 and 4, respectively, still hold when we control for whether or not the household’s economic status strictly improved during the last two years. Specifically, in Round 2 of the survey, several modules before our governance module (ensuring that responses were not affected by our primes), we asked respondents, “Compared to the present, how was your economic condition two years ago?” Potential responses to this question are: much worse (0), worse (1), no change (2), better (3), and much better (4). We then code a dummy for a respondent providing a response of 0 or 1, which would indicate that the individual’s economic condition has strictly improved in the last two years. Such individuals would appear to be the beneficiaries of recent economic growth. We find that including this control has virtually no effect on any of our key coefficients; their direction, magnitude, and statistical significance is in all cases nearly identical. This robustness check suggests that our results reveal the effect of aspirations on political discontent rather than some correlation between aspirations and being the recipient of economic growth.
It is important to consider context when interpreting our results. Our study was carried out in rural Pakistan, where even those with relatively high aspirations may have quite low aspirations when compared with those in a nondeveloping country or with those in the urban or more developed sections of a developing country like Pakistan. Thus, that Tocqueville’s thesis holds for the 40% of the sample that had the highest aspirations gaps is remarkable; it suggests that in other contexts, we might expect an even larger share of the population to have their confidence in government reduced by simultaneously being primed to feel relatively poor and mobile.
ANALYSIS OF PRIME EFFECTIVENESS AND MANIPULATION CHECKS
Our analysis of how priming individuals to feel relatively poor and/or mobile impacts their attitudes toward the government assumes that our experiment had its intended effect. That is, priming individuals to feel relatively poor made them feel poorer than they otherwise would, and priming individuals to feel mobile made them feel more mobile and able to improve on their current position than they otherwise would. Evidence from Mo (Reference Mo2012; Reference Mo2017) in Nepal, which was then replicated in Pakistan by Fair, Littman, Malhotra, and Shapiro (Reference Fair, Littman, Malhotra and Shapiro2015)—as well as the diagnostic statistics on our poverty prime that we presented in the Research Design section—suggest that our experimental method of priming individuals to feel poor had its intended effect.
We are able to gain further verification that our treatment had its intended effect by examining whether the poverty prime affected only those who did not feel poor to begin with. People that already felt relatively poor should be somewhat immune to the prime. For this exercise, we can leverage the following question collected prior to the experiment: “[Show the picture of a ladder] Please look at this ladder, which has 10 steps. Suppose we say that the top of this ladder represents the best possible life for you and the bottom step represents the worst possible life for you. Where on the ladder do you feel you personally stand at present?” The mean and median response is 5, the midpoint of the scale. We thus divided our sample into two groups: those who chose a number less than 5 and those who chose 5 or higher. These two groups represent, respectively, (A) those who already feel low on a ladder of subjective well-being, and as such, should not feel the effects of a prime designed to trigger feelings of relative poverty, and (B) those who feel well-off, and as such, have room for their subjective well-being to fall in response to the prime.
We repeat the analyses of our main results in Tables 3 and 4, which are described in the Results section above, for the two groups of interest: Columns (1)–(6) of Table A.6 in Online Appendix A consider group (A), while columns (7)–(12) consider group (B).Footnote 29 As expected, we see that the negative effect of the poverty prime (test of Proposition 1), as well as the interaction between receipt of both the poverty and mobility prime and one’s aspirations gap (test of Proposition 3) are only seen for group (B)—the group with initially high levels of subjective well-bring. When we consider the impact of receiving the poverty prime (test of Proposition 1), effect sizes for group (B) range from –4.1 to –4.8 percentage points and are statistically significant. In contrast, effect sizes for the group which had low subjective well-being before the prime (group (A)) range from –0.6 to –1.4 percentage points and are statistically insignificant. The difference between the impact on group (A) and the impact on group (B) is always highly statistically significant (p < 0.01). In short, receiving the poverty prime lowers one’s confidence in government, but this is only the case for those who we would actually expect to have their beliefs updated by the prime: those with initially high subjective well-bring. When we next consider the interaction between the aspirations gap and the dummy for receiving both the mobility and poverty primes (test of Proposition 3), we find that it is also only statistically significant for group (B). The magnitude of the interaction term for group (A) ranges from –0.001 to 0.004 and is in all cases statistically insignificant, while for group (B) it ranges from –0.094 to –0.062 and is always statistically significant. Again, the difference between these two sets of magnitudes is always highly statistically significant (p < 0.01). Proposition 3 and Tocqueville’s verbal hypothesis are supported by the data, and these effects are intuitively driven by those for whom we would expect the primes to have the greatest impact.
We do not know of any existing studies priming individuals to feel mobile. Fortunately, however, we can statistically check that the mobility prime had its intended effect, because we asked all respondents the following question related to their perceived level of mobility (after receipt of primes, if any): “In your opinion, to what extent do people in Pakistan get rewarded for their intelligence and skills?” Again, this variable is measured on a scale from 0 to 1, where 0 indicates not at all, and 0.25, 0.5, 0.75, and 1, respectively, indicate a little, somewhat, a lot, and a great deal. The mean of this measure is 0.40, reflecting that individuals tend to believe that mobility is not particularly high in Pakistan. An analysis of this question allows us to examine whether or not the mobility prime actually caused individuals to report that they feel more mobile.
Table A.7 in Online Appendix A examines the effect of being primed to feel mobile (by having been read our mobility script as part of the experiment) on an outcome variable indicating the extent to which an individual feels that people in Pakistan are rewarded for their intelligence and skills. As we see in column (1), receiving our mobility prime leads to a 3.6 percentage point increase (p = 0.01) in this outcome variable. As this variable’s mean is 0.40, a 0.036-point increase represents a 9 percent increase relative to the mean value. The size of this effect is largely unchanged when we add district fixed effects (column (2)), a battery of pretreatment control measures (column (5)), and village fixed effects (column (6)). We take this as evidence that our mobility prime had its intended effect. Moreover, we find no differential impacts of our mobility prime according to an individual’s aspiration level (and hence gap), as shown in columns (3)–(6) in Table A.7 in Online Appendix A.Footnote 30 Similarly, we find no evidence that the effect of the poverty prime on feelings of mobility varies with one’s aspirations gap.Footnote 31
CONCLUSION
Using an original experimental dataset collected in Pakistan during 2012–2013, we present strong evidence in favor of a theory articulated by Tocqueville (Reference Tocqueville and Bonner1856). That theory suggests that discontent with government can increase even when economic development creates opportunities for economic and social mobility. For many citizens, expectations increase and personal circumstances fail to keep up, creating political discontent. We formalize these insights by presenting a theoretical model of the impacts of perceived poverty and economic mobility on confidence in government. Our experimental evidence supports that model, and thus Tocqueville’s theory.
The experiment has the key advantage that it generates perceptions of higher relative poverty and higher mobility, which are exogenous to our attitudinal outcomes related to confidence in government. However, it has the disadvantage that we subtly create only the (likely temporary) perception that one is relatively poor. Perceptions of relative poverty may have a different effect than does actually falling into deeper levels of poverty. Further research is needed on how confidence in, and support for, government varies with the combination of increases in one’s actual relative poverty level and increases in one’s perceived mobility. Such research could, for example, consider a natural experiment such as the occurrence of a natural disaster that impacts relative poverty levels for some subset of a population.
Overall, our findings constitute an important theoretical and empirical contribution to the literature on drivers of support for government. They help make sense of the somewhat paradoxical claim articulated by Tocqueville (Reference Tocqueville and Bonner1856): that economic development and mobility do not always lead to increased confidence in government, and may potentially erode it, triggering greater opposition rather than support for government. They also help us understand which citizens are most likely to oppose government when made to feel both relatively poor and that society is more mobile; specifically, it is those with the highest aspiration levels to begin with, whose aspirations gaps accordingly increase the most when made to feel relatively poor when mobility is high. From an academic perspective, this helps us better understand not only when acts of opposition to the government are most likely to emerge but also which groups of citizens are most likely to join in such opposition and why. From a policy perspective, such information is useful for preventing state failure and designing responsive public policies that include citizens in the development process.
SUPPLEMENTARY MATERIAL
To view supplementary material for this article, please visit https://doi.org/10.1017/S000305541700017X.
Replication files can be found at https://doi.org/10.7910/DVN/EY2I6M.




Comments
No Comments have been published for this article.