1 Introduction
With the recent slide in US equities markets and the low rates of return on US Treasury bonds, many workers are wondering about their financial security in retirement. Many of those who have retirement savings held in defined contribution plans have been battered by financial markets and are looking longingly at traditional defined benefit plans. The promise of lifetime, inflation-adjusted benefits may be much more appealing in the current financial environment than in the equities boom of the late 1990s. On the other hand, defined pension plans experienced their own share of financial difficulties after the severe market downturn of 2001.
In this paper, we consider the security of the financial assets of defined benefit plans. Are defined benefit plans well managed? Do they follow a herd mentality? Are they reasonable in their risk exposure? With 18.5 million state and local employees enrolled and 7.3 million defined benefit (DB) pension recipients, public sector defined benefit plans are an important part of America's retirement landscape. DB plans promise employees a fixed level of retirement income, typically based on years of service and age. Employers generally absorb the consequences of the underlying risks. They will have to contribute less to their pension plans if financial rates of return are better than expected and more if rates of return are worse than anticipated. The latter was the case after 2000 and 2008, when funding ratios fell and employer contributions subsequently increased.
Pension plans may attempt to handle a drop in funding and an increase in actual or expected employer contributions in a number of ways. One of them is to seek higher returns by incurring more risk in pension assets. Such a move towards a more imprudent portfolio allocation may reflect a weak governance structure, where plan trustees fail to exercise caution thereby demonstrating ex ante moral hazard. If losses from a riskier portfolio allocation materialized, future demands on tax payers may rise. Alternatively, a strong governance structure would serve to limit moral hazard and be mirrored in a move towards a more prudent asset allocation if financial demands increase.
We are particularly interested in knowing if public sector plans responded to the underfunding that arose in 2000, by increasing their risk exposure, since those may give an indication of how public sector pension plans will respond to the financial turmoil that began in 2007. The Government Accountability Office issued a report in 2008 (GAO, 2008) that considered the exposure of public sector pension plans to risky assets. Yet, this research did not consider the asset allocation history of public sector pension plans.
We believe that this is the first empirical effort to systematically look at the determinants of asset allocations by public sector pension plans. We specifically look at the question of whether public sector plans follow prudent investment practices. Here, we consider the role asset price changes, pension plan funding status, past employer contributions, and peer performance play. By looking at the asset allocation of public sector plans, this research contributes to a discussion on how public sector plans responded to the drop in funding levels that occurred after 2000.
In general, we find that public sector plans from 1993 to 2005 tend to be prudent in their asset allocation. Public sector plans tend to rebalance their assets regularly in response to large price changes – indicating that managers are adhering to their asset allocation targets. Also, public sector plans tend to hold more risky assets when they have higher funding levels. We interpret this as evidence that principals are able to monitor agents and prevent them from taking riskier positions when funding ratios are low. Interestingly, this relationship seems to have become stronger after 2000.
The rest of the paper proceeds as follows. We provide an overview of the relevant literature in Section 2, which allows us to identify several portfolio allocation determinants. In Section 3, we provide some background on public sector plans' asset allocations over time. This is followed by a descriptive analysis of the data in Section 4 and a multivariate analysis in Section 5. We end with some concluding remarks in Section 6.
2 Literature review
The allocation of retirement portfolios towards risky assets, mainly corporate equities, is typically a systematic indicator of the rates of return earned on all assets. For instance, Coronado et al. (Reference Coronado, Engen and Knight2003) find that a one standard deviation increase in the asset allocation towards equities was associated with a rate of return that was 1.3% higher in 1998.Footnote 1 At least in the past an allocation towards corporate equity has therefore been associated with higher rates of return for public sector DB plans.
Investors' portfolio allocations are typically based on investors' risk preferences, given the available investment opportunities, and the risk–return trade off (Grossman and Stiglitz, Reference Grossman and Stiglitz1980; Merton, Reference Merton1969). The primary asset allocation model typically employed follows Merton (Reference Merton1969). The optimal allocation into risky assets, e.g. stocks, is determined by the risk–return trade-off between a risky and a risk-free asset

The optimal share of equities, w*, is equal to the ratio of the difference in the expected rate of return of equities (a) and that of risk-free short-term government bonds (r), relative to one-year variance of equity prices (σ2) weighted by an investor's risk preferences, δ.
Plans, though, often do not allocate optimal shares of their assets to specific asset classes. This deviation may be explained by a range of factors, including beneficiary demographics and plan size (or sponsor strength) (McCarthy and Miles, Reference McCarthy and Miles2007).
We focus on a number of additional factors to capture prudent investment behavior. In particular, we look at portfolio rebalancing, plan and employer conflicts of interest, and investor learning. Taken together, regular rebalancing, the nonexistence of conflicts of interest and the existence of investor learning provide evidence of prudent investment behavior. All of these measures have been recognized as important potential determinants of pension plans' asset allocations.
2.1 Indicators for prudent investment
Extraordinarily large movements in equity prices should lead investors to reallocate their portfolios. Since the volatility in investment returns has increased and assuming constant investor risk preferences, the optimal share of equities should decrease. Additionally, a large upward movement in stock prices in one period (such as the late 1990s) increases the probability of below average rates of return in the future as asset prices revert to the mean, relative to expected earnings (Campbell and Shiller, Reference Campbell and Shiller1988, Reference Campbell and Shiller2001). Lower expected rates of return on equities should result in fewer stock holdings.
A second reason why large movements in equity prices are likely to reduce equity allocations is that the funding level may impact the plan sponsor's preference for risk taking. The funding ratio – assets relative to liabilities – and the equity allocation should be positively correlated. Plan trustees may feel that they have enough of a cushion to engage in riskier investment allocations when a plan is well-funded. In comparison, underfunded plans, especially those that are well governed, may seek to stabilize their funding ratio by reducing their risk exposure.
Absent good governance, underfunded plans may seek more risk due to the prevalence of moral hazard. Plan trustees may find it opportune to increase their risk taking, assuming a bailout by the plan sponsor or taxpayers (McCarthy and Miles, Reference McCarthy and Miles2007; Papke, Reference Papke1991).
Empirically, there seems to be a positive relationship between funding ratios and allocations towards riskier assets. Well-funded DB plans in the private sector tend to be more heavily invested in equities than less well-funded plans (Rauh, Reference Rauh2007). The same is true for real estate investments (Craft, Reference Craft2005).Footnote 2
Third, DB plan sponsors may face their own conflict of interest.Footnote 3 Public sector plan sponsors may try to minimize their contributions, at a given level of current and future benefit payments, the plan's liabilities. An unexpected increase in employer contributions to their pension plans may thus result in a change towards riskier asset allocations in an effort to reduce contributions by incurring more risk (McCarthy and Miles, Reference McCarthy and Miles2007).
Fourth, plan investment officers may learn from the investment allocation of other plans. Such peer effects seem to exist in the mutual fund industry. Specifically, mutual fund managers may mimic the performance of peers, who have shown an outstanding performance (Chevallier and Ellison, Reference Chevalier and Ellison1999; Sirri and Tufano, Reference Sirri and Tufano1998).
Investors will imitate each other's behavior, given that information is naturally limited (Jegadeesh and Titman, Reference Jegadeesh and Titman1993). This may especially apply to public sector plans, where legislative and regulatory obstacles have been eliminated over time and plans have moved towards riskier asset allocations. Pomorski (Reference Pomorski2006) finds that learning from leaders can translate into higher rates of returns.
2.2 Standard determinants of asset allocation
In addition to the variables that are meant to capture prudent plan investments, there are several variables that are expected to determine a plan's equity allocation: demographics, plan size, and regulatory and legislative restrictions.Footnote 4, Footnote 5
Traditionally, equity holdings were expected to be constant with age (Merton, Reference Merton1969; Mossin, Reference Mossin1968). This is based on several assumptions: (a) returns are identically and independently distributed over time, (b) agents have utility functions that are time-invariant and additively separable over time, (c) there are no labor income and no non-tradable assets, and (d) markets are frictionless and complete.
When these assumptions are relaxed, portfolio allocations can fluctuate with age (Ameriks and Zeldes, Reference Ameriks and Zeldes2004). For instance, labor income is introduced as a certain, non-tradable asset by assuming the net worth of future income. As the share of labor wealth declines over time, households will maintain their share of risk-free wealth in their total portfolio by shifting financial assets towards risk-free assets, away from risky equities. This result can still hold, to some degree, if labor income is assumed to be risky. Furthermore, if equity returns are negatively serially correlated, investors should seek smaller exposures to risk as they age and their investment horizon shortens (Barberis, Reference Barberis2000; Campbell and Viceira, Reference Campbell and Viceira1999, Reference Campbell and Viceira2002; Kandel and Stambaugh, Reference Kandel and Stambaugh1996; and Wachter, Reference Wachter2002). Also, changes in utility imply a reduction in assets with age because consumers increasingly value certain wealth to finance a fixed amount of desired consumption (Samuelson, Reference Samuelson1989, Reference Samuelson1994) and because risk aversion may decrease with age (Bakshi and Chen, Reference Bakshi and Chen1994; Ballente and Green, Reference Ballente and Green2004, and Halek and Eisenhauer, Reference Halek and Eisenhauer2001), although the empirical results seem inconclusive (Ameriks and Zeldes, Reference Ameriks and Zeldes2004).
The allocation towards equities should decrease with the age of the plan's population. Specifically, a higher dependency ratio – beneficiaries to active participants – should translate into a less risky asset allocation.
Moreover, a plan's equity allocation may be related to the plan's size for two reasons. First, transactions costs tend to be higher for smaller plans than for larger plans. For individual investors, specifically in DC plans, transactions costs tend to be one factor that could explain the low equity investments (Haliassos and Bertaut, Reference Haliassos and Bertaut1995) and limited portfolio allocation changes (Ameriks and Zeldes, Reference Ameriks and Zeldes2004; Mitchell et al., Reference Mitchell, Mottola, Utkus and Yamaguchi2006). Fees tend to be higher for very small DB plans than for either larger DB plans or DC plans. The smallest DB plans (with 15 employees) tend to have expenses equal to 3.1% of assets, compared to 1.44% for DC plans (CII, 2006). Many of these expenses are related to investments. Consequently, it is possible that smaller DB plans are less likely to invest in equities, where transactions costs tend to be higher than in other investments.
Second, plan trustees may increase a plan's risk exposure if plan sponsors are stronger. Stronger sponsors will have more financial resources available if downside risk materializes and plans are in need of additional financial resources (McCarthy and Miles, Reference McCarthy and Miles2007). Plan size may proxy for the strength of the plan sponsor.
In addition, public sector plans may face institutional and legislative hurdles to investing more in riskier assets. Traditionally, for instance, public plans held smaller shares of their assets in stocks than private sector plans (Coronado et al., Reference Coronado, Engen and Knight2003).
Restrictions on public plans' investments have been gradually lifted. Public sector plans were allowed to allocate a growing share of their assets to corporate equities and other investments, such as international securities and alternative investments (IFI, 2007; Marois, Reference Marois2007). We include the asset allocation of private DB plans as a benchmark to capture the effects of the changing legal and institutional environment for public plans.
3 Background
We use two data sets to study the determinants of the asset allocation of public sector plans. Aggregate data for all state and local plans are available going back to 1952 from the Federal Reserve's Flow of Funds (BOG, 2007). This data set offers the longest time horizon and it includes flow variables, in particular net purchases of financial assets.
In addition, the Census' (2007) annual survey of State and Local Government Employee Systems going back to 1993 reports a range of relevant variables for state and local plans separately for each state.Footnote 6 It covers all public sector DB plans and provides relevant variables beyond plans' finances, such as demographics and benefit payments.Footnote 7 Although the goal of this data set is to provide information on DB plans, some survey respondents also included data on DC plans. This should pose a minor problem since the vast majority of public sector plans are DB plans and one of the largest component of public sector DC plans – Teachers' Insurance Annuity Association (TIAA) – is excluded.
These two data sets allow us to get an approximate sense of the determinants of the asset allocation of public sector plans. Moreover, both data sets allow for a comparison of the determinants of the asset allocation before 2001 and after 2000.
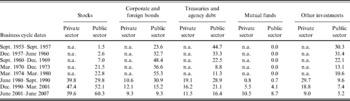
Public sector plans held slightly more stocks directly than private sector DB plans since the 1990s (Table 1). Since 2000, stocks accounted for 60.3% of all public plan assets and for 59.6% of private pension plan assets. This allocation followed sharp increases in the stock allocation of public plans, particularly in the 1970s and 1990s.
Asset allocation of public and private sector pension plans, business cycle averages

Notes: All figures are percent of total financial assets. Data on private DB plans are available only annually from 1985 onward. Authors' calculations based on BOG (2007). Business cycle dates are taken from the National Bureau of Economic Research's Business Cycle Data Base (NBER, 2008). Dates are inclusive.
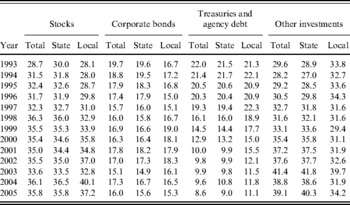
State and local government plans differ slightly in their asset allocation (Table 2). Local plans had a greater allocation to domestic stocks than state plans starting in 2000. In 2005, local plans held 37.2% in domestic stocks, compared to 35.8% of state plan assets allocated to domestic stocks.
Asset allocation of state and local government plans, by type of plan and year

Notes: Authors' calculations based on Census (2007). All calculations are based on aggregate data.
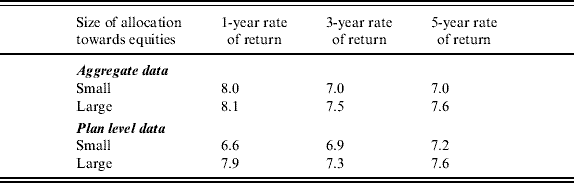
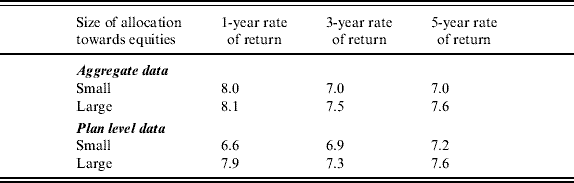
The equity allocation may be correlated with public sector plan assets' rate of return. The rate of return is defined here as investment earnings divided by the average of assets at the start and end of a period. Plans with equity allocation shares greater than the median showed a rate of return that was approximately half a percentage point higher than for plans that had allocation shares less than the median, based on aggregate data (Table 3). When we consider the available plan level data, we also find that larger equity allocations tend to go along with higher rates of return, again with a difference of about half a percentage point for longer-term investment horizons.
Rates of return over 1, 3, and 5 years, by size of assets allocated to equities
Notes: All figures are in percent. Rates of return are averages for 1, 3, and 5 years. Size classes refer to quartiles of asset shares allocated to corporate equities averaged over 1, 3, and 5 years. Aggregate data exclude system-wide observations. Authors' calculations based on Census (2007).
4 Univariate analyses
4.1 Rebalancing
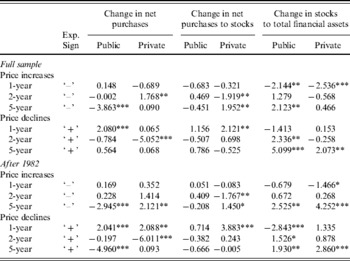
Large price changes should translate into asset reallocations. We define periods of extraordinary price increases as those quarters when equities prices in the previous year increased by more than one and a half standard deviations (see Table 4). We develop measures for two-year and five-year above trend price increases similarly. Finally, we define periods of extraordinary price declines as price drops in excess of one and a half standard deviations. We then divide the data from 1952 to 2007 into three subperiods: periods of large upward movements, periods of large downward movements, and tranquil periods. Based on these definitions, we find extraordinary one-year equity price increases preceding 9.2% of the quarters from 1952–2007, extraordinary two-year increases preceding 7.5% of the quarters, and extraordinary five-year increases preceding 6.9% of the quarters (not shown). The shares for extraordinary decreases were 8.1%, 8.1%, and 10.2%. All other periods – about 83% of all observations – are considered tranquil periods and serve as our baseline for comparisons.
Tests for portfolio changes after extraordinary price changes, 1952 to 2007

Notes: For price increases, the hypothesis is that following these periods plans rebalance by selling stock more aggressively than they did during tranquil periods, i.e. a negative sign. For down movements, the hypothesis is that periods of price declines are followed by increases in equities shares relative to tranquil periods, i.e. a positive sign. * indicates significance at the 10% level, ** indicates significance at the 5% level, and *** indicates significance at the 1% level.
Next, we test if the changes in the equity allocation immediately following extraordinary price changes were significantly different from those following tranquil periods and if the size of the differences were consistent with the hypothesis that public plans rebalanced their portfolios.Footnote 8 Pension plans should increase their stock purchases immediately following price declines and decrease them after prices have just risen. These changes should be larger than during tranquil periods.
In Table 4 we use three measures to test for the robustness of our rebalancing measures. First, we use the percent change of net stock purchases following a period of extraordinary price changes relative to the relevant preceding periods. We sum over several quarters and then calculate the percent change to reduce the inherent data volatility. Our reference periods are four, eight, and 20 quarters. Second, we use the percentage point change in the ratio of net purchases relative to stock holdings. Third, we consider the percentage point change in the ratio of stocks relative to total assets, although this variable captures both active portfolio rebalancing and price changes. In all instances, we calculate the same ratios also for private retirement plans, which include defined contribution plans.
Finally, we undertake all of our tests for the full sample and then for the period after 1982. The years after 1982 was characterized by a stock market boom that increased the need for regular rebalancing, and defined contribution plans gained in popularity with the onset of 401(k) plans, which may have influenced portfolio allocation practices.Footnote 9
In general, we find no systematic and statistically significant evidence that public plans rebalance their portfolios following price changes (Table 4). For instance, five of the 12 tests for differences in percent changes in net purchases are statistically significant. Four of these five test statistics have the expected sign. The second measure – changes in net purchases relative to total value of stocks – shows no statistically significant difference following periods of large price changes, while the third measure indicates again more statistically significant tests with the expected sign (5) than with the unexpected sign (3). There is no systematic difference between price increases or price declines, nor is there a systematic difference between the full sample and the period after 1982.
There are differences between public and private sector plans in all three measures used. With the first measure, we see several statistically significant differences with an unexpected sign, suggesting that private sector plans disproportionately increased their purchases after they got more expensive and reduced their purchases disproportionately after stock prices had declined. In the case of net stock purchases relative to the outstanding value of stocks, which showed no differences for public sector plans, we find three instances with the expected sign and two with the unexpected sign. That is, this measure does not provide any clear support for or against our hypotheses. Only changes in the ratio of stocks to financial assets indicate that stocks increased faster as a share of assets after price declines and slower after price increases than during tranquil periods.
It is difficult to conclude, based on the measures developed above, that public plans or private plans actively rebalance their portfolios in response to equity price changes. We find that public sector plans adjusted equity allocations in accordance with theory only 50% of the time, while private sector plans fared no better at 58%.Footnote 10 The best light to cast on these finding is that we find also no evidence of imprudent behavior (that is, non-rebalancing). In general the evidence in favor of active rebalancing being stronger for public sector plans than for private sector retirement savings is practically nil.
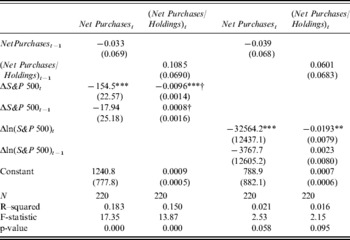
Given that the univariate analysis does not provide any clear conclusion on whether public sector pension plans rebalance their portfolios in response to price changes, we estimate a multivariate model of net stock purchases. The independent variable is net stock purchases as our primary measure of portfolio rebalancing. To test for the robustness of our results, we also estimate our regression using net purchases relative to stock holdings as explanatory variable. Rebalancing is hypothesized to be a function of price changes, assuming constant risk aversion. The explanatory variable is the change in the S&P 500. To ensure the robustness of our results, we re-estimate our regression equation with the change in the natural log of the S&P 500 as explanatory variable.
Moreover, as we discuss further below, investment restrictions have been gradually lifted for state and local government pension plans. We account for this change by including the lagged independent variable in our regression analysis as additional explanatory variable.
The full regression model that we estimate using OLS is thus defined asFootnote 11

The results in Table 5 show that public sector plans systematically and actively rebalance their portfolios in response to price changes. In particular, higher prices go along with smaller net purchases of stocks – either expressed in absolute terms or relative to existing equity holdings. The results are robust; alternate specifications that include a time trend and different periods of analysis do not alter the main findings and have only a minimal impact on the coefficient estimates. Durbin–Watson tests for serial correlation in the errors provide tests statistic very close to 2 (across specifications the minimum was 1.95 and the maximum 2.08). Consequently we reject the null of serial correlation (Table 5).
Multivariate estimates for rebalancing of public sector pension plans

Notes: *** denotes significance at 1% level, ** denotes significance at 5% level, and * denotes significance at 10% level.
† indicates coefficients multiplied by 100.
4.2 Funding ratios and equity allocation
All types of retirement benefit plans exhibited similar improvements in funding ratios during the 1990s followed by declines in funding ratios (Munnell et al., 2007). The strong stock market performance and higher interest rates contributed to funding ratios that exceeded 100% in the late 1990s. Starting in 2002, though, lower interest rates and much lower stock prices translated into lower funding ratios, which fell below 80% for private sector plans and below 90% for public sector plans on average. However, by 2006, plans had recovered some of their earlier losses (Munnell et al., 2007).
We calculate a proxy for liabilities since aggregate data only cover benefit payments (Census, 2007). We assume that the median ratio of benefit payments to liabilities that held for plans in the PENDAT data set between 1998 and 2000 holds for all plans here.Footnote 12 The median ratio of benefit payments to liabilities was 5.7% for those years.
We also assume that liabilities move in line with a plan's age profile. The ratio of beneficiaries to active participants is used as an approximation of the age profile of a plan. We index each system's ratio of beneficiaries to active participants with 1999 as the base year. Liabilities are allowed to change with the dependency ratio in addition to changes in benefit payments. Specifically, liabilities for each system are calculated as
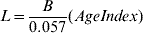
where L are the proxied liabilities, B are benefit payments, and AgeIndex is the dependency ratio indexed to 1999 for each system. The resulting funding ratios, weighted by asset size, for each year show the familiar pattern of improving funding ratios in the late 1990s, a sharp drop off after 2001 and stabilization in 2006.Footnote 13
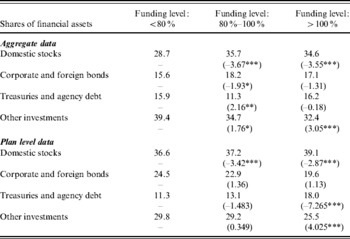
In Table 6 we separate three categories of funding ratios to facilitate evaluating our data. Specifically, funding ratios of less than 80% are considered ‘severely underfunded’, between 80% and 100% ‘mildly underfunded’, and funding ratios above 100% ‘funded’.
Asset allocation of state and local government retirement plans by funding levels

Notes: Authors' calculations based on Census (2007). Figures in parentheses are t-test statistics for testing the null hypothesis the respective shares are the same as for pension systems with severe underfunding. * indicates significance at the 10% level, ** indicates significance at the 5% level, and *** indicates significance at the 1% level. A positive sign indicates that the allocation share for systems with severe underfunding is greater than the share for other systems and a negative sign indicates that the share of systems with severe underfunding is smaller.
Less well-funded plans are correlated with lower equity allocations (Table 6).Footnote 14 Severely underfunded public sector DB plans hold fewer equities relative to their total assets than better funded plans and more in government securities. These correlations are even more pronounced, when we consider plan level data instead of aggregate data. The figures thus may indicate that underfunding goes along with smaller equity allocations.
4.3 Employer contributions and equity allocation
Plan sponsors (employers) may try to minimize their contributions in any given year, given fixed liability levels. Following an increase in employer contributions, plan sponsors may pursue a riskier allocation strategy in the short-term.
First, we identify periods when employer contributions rose unexpectedly. These are periods when percentage point changes in employer contributions relative to outflows – the sum of benefit payments and withdrawals – increased by more than half a standard deviation above the average change for that plan type. When we use aggregate data, for instance, 3.3% of quarterly observations are classified as periods with unexpected increases system wide, compared to 8.1% for state plans and 0.7% for local plans.
There is no evidence suggesting that plans seek more risk in the year following an unexpected increase in employer contributions (Table 7). These results are robust even for small samples as the Mann–Whitney ranksum test indicates.
Tests for faster stock allocation after unexpected employer contribution increases

Notes: Mann–Whitney test is a ranksum test, used here to the small sample sizes to demonstrate robustness of the results. In each case, the null hypothesis that the average change in the period after an unexpected change is the same as the average change during all other periods. A negative sign indicates that change in the stock allocation immediately following an unexpected change in employer contributions is greater than during other periods, while a positive sign indicates that the average change immediately following an unexpected increase in employer contributions is smaller than during other periods. * indicates significance at the 10% level, ** indicates significance at the 5% level, and *** indicates significance at the 1% level.
4.4 Leader investments and equity allocation
We also try to get a sense of whether pension plans follow each other's investment strategies. We first identify the best performer in each period based on a plan's rate of return. Plans that have the highest rate of return in a given year are ‘leaders’. Next, we compare the changes in asset allocation for leaders during the year, when they are leaders, with changes of asset allocations of all plans in the following year.
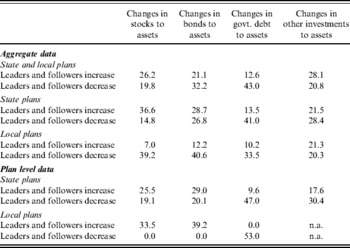
There is limited evidence that public sector plans ‘follow the leader’. Only in about 50% of the cases, regardless of the asset class and regardless of the level of aggregation, do followers follow the lead of leaders, either up or down (Table 8).
Share of allocation changes, when leaders and followers move in the same direction

Notes: All figures are in percent. Figures are shares of all allocation changes in specified asset category. Only instances are considered, where leaders and followers move in the same direction in subsequent periods.
There seems to be a difference between state and local plans with respect to equity allocations. For instance, among state plans, followers increased or decreased their equity allocation in 51.2% of the cases after leaders did the same in the preceding period, based on aggregate data. Based on fund level data, this was true for 44.6% of cases (Table 8). Among local plans, followers followed leaders in 46.2% of cases, based on aggregate data, and 33.5% of instances, based on fund level data. This suggests that state plans are somewhat more likely to follow the leader than local plans.
5 Multivariate analysis
The discussion over asset allocations is typically concerned with factors that could raise or lower the actual asset allocation above or below its optimal level. The definition of the optimal allocation towards stocks is laid out in equation (1) in the previous discussion. We assume a constant risk parameter of 5 as an indication of trustees' risk neutrality, which is consistent with other studies (McCarthy and Miles, Reference McCarthy and Miles2007). The rate of return on stocks is the annual rate of appreciation of the S&P 500 plus the average annual dividend yield. The variance of the risky asset is the variance of the total rate of return on stocks, based on data for the S&P 500, from 1953 forward to each data year.
Our interest lies in explaining the deviation of the stock allocation from its optimum. Our regression equation is thus
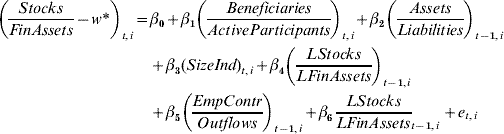
where w* denotes the optimal share of assets allocated to corporate equities, SizeInd refers to the four size groupings discussed earlier, LStocks and LFinAssets are the stock holdings and financial assets of the leader in the previous period, and PStocks and PFinAssets are the stock holdings and financial assets of private sector DB plans.
In addition to the variables used to measure prudent investment, we include plan size, dependency ratio, and the equity allocation of private sector DB plans as explanatory variables. The dependency ratio is the ratio of beneficiaries to active participants and plan size is an indicator variable that takes on values from ‘1’ to ‘4’, depending on whether the plan fell into the first, second, third, or fourth size quartile in any given year.
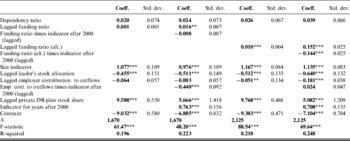
The first regression shows the baseline model for system-wide aggregate data (Table 9). All explanatory variables either have the expected sign or are statistically insignificant. Specifically, public plans' equity allocation increases with higher levels of equity allocation by leaders and by private sector DB plans in the previous period.
Regression results for determinants of equity allocation, system-wide aggregate data

Notes: All regressions include plan fixed effects.
* indicates significance at 10% level, ** indicates significance at 5% level and *** indicates significance at 1% level.
Next, we re-estimate the regression focusing our attention on whether the determinants of public sector plans' asset allocation differed systematically after 2000. Specifically, we include a dummy variable that takes on the value of one for the years after 2000 and zero otherwise. We also include two interaction terms: one for the funding ratio after 2000 and one for employer contributions after 2000 since those are the variables that capture conservative or aggressive investment strategies.
The determinants of public sector plans' asset allocations are largely robust before and after 2000, with one exception. Specifically, the asset allocation is positively correlated with the funding ratio prior to 2000, but there is no clear link after 2000 (Table 9).
We re-estimate the regression equation with a slightly altered definition of the funding ratio to show the robustness of our results. We now use the ratio of assets to (estimated) liabilities without adjusting for changes in the dependency ratio. Our previous results remain robust (Table 9). In addition, we find that plans tend to increase their equity allocation with higher funding levels and after employer contributions unexpectedly increased. Specifically, public plans' equity allocation tends to increase with higher funding levels, lower employer contributions, while also following the lead of strong performers and experienced plans. These results remain stable, when we exclude the dependency ratio from the regression, which is done to show the comparability with the regression results for state and local plans, as discussed further below. Our results suggest that public sector plans learn from performance leaders, but are not influenced by plan sponsor and trustee conflicts of interests.
When we again include the dummy variable for years after 2000 and the interaction terms, the results are generally robust, with one exception. In particular, greater employer contributions are followed by smaller equity allocations, but only after 2000 (Table 9). While this suggests that public sector plans are not influenced by employer conflicts of interests, it may indicate that plans became overly cautious in the face of quickly rising employer contributions after 2000.Footnote 15
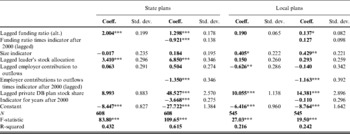
We estimate the last regression for state and local plans separately since demographic data are not available for these plans at the aggregate level. There seem to be some noticeable differences between state and local plans (Table 10). The funding ratio and the leader's previous asset allocation are significant determinants of the allocation of state plans' assets, but not of local plans'. In comparison, size and employer contributions matter for the asset allocation of local plans, but not for state plans. Both types of plans, though, seem to follow the lead of private sector DB plans. Although the exact mechanism differs, both types of plans seem to follow experience and do not seem to rely on implicit taxpayer guarantees to pursue riskier investment strategies when funding ratios decline or demands on employers increase.
Regression results for determinants of asset allocation, state and local plans, aggregate data

Notes: All regressions include plan fixed effects.
* indicates significance at 10% level, ** indicates significance at 5% level, and *** indicates significance at 1% level.
The results remain largely robust when we include a dummy for years after 2000 and interaction terms, although there are some differences with respect to two variables of particular interest to us – the funding ratio and employer contributions. Specifically, the allocation towards stocks is positively related with higher funding ratios for state and local plans. This difference is much weaker after 2000 than before for state plans, but shows no difference over time for local plans (Table 10). In addition, employer contributions in the previous period have no systematic relationship to the allocation towards stocks by state and local plans before 2000, but there is a statistically significant link after 2000. Again, this suggests no employer conflicts of interest, but it may indicate an overly cautious investment allocation after rapid changes in employer contributions.
As before, we also base our analysis on fund level data and not only on aggregate data. While the fund level data allow for more observations, they have the problem that they do not provide a consistent time series. For one, plans move in and out of the sample and, second, the Census changed the methodology to a survey design half way through our sampling period, which drastically reduced the number of annual observations. Moreover, there are substantial data limitations for local plans, which lead us to estimate our regression equation only for state plans. The estimates in Table 11 are thus largely reported here to test the robustness of our earlier results.
Regression results for determinants of equity allocation, plan level data, state plans only

Notes: All regressions include plan fixed effects.
* indicates significance at 10% level, ** indicates significance at 5% level and *** indicates significance at 1% level.
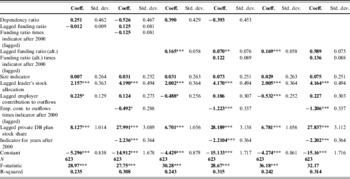
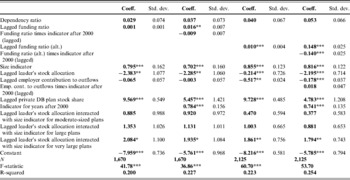
The fund level regression results are generally robust, but show two important differences from our previous results. First, we find that size consistently matters. Larger plans tend to have a larger share of their assets allocated to equities. Second, state level plans do not follow the leader, but rather seem to do the opposite of what performance leaders did in the previous period. This contradicts our earlier findings and we will return to this contradiction further below. Aside from these differences, though, equity allocations again increase with funding ratios, decrease with employer contributions, and follow the allocation pattern of private sector counterparts (Table 11) as before.
We found two contradictory results. At the aggregate level, plans seemed to follow the leader, while the opposite was the case at the fund level. It is possible, that plans of different sizes behave differently. If large plans follow the leader, but small plans do the opposite, the unweighted results based on fund level data could show a negative relationship, while the aggregate data may show a positive relationship. We consequently re-estimate our regression equation with an interactive term between plan size indicators for moderate, large, and very large plans and the leader's stock allocation as additional explanatory variables (Table 12).
Regression results for determinants of equity allocation, with size interactions, plan level data, state plans only

Notes: All regressions include plan fixed effects.
* indicates significance at 10% level, ** indicates significance at 5% level, and *** indicates significance at 1% level.
The results indicate indeed that there is a difference by size. Smaller state plans tend to move in the opposite direction from the asset allocation of performance leaders, while the equity allocation of very large plans is either not systematically connected to the equity allocation of performance leaders or may even follow it. This can explain the contradictory results, depending on the weights given to larger plans, when the data are aggregated. That is, our results suggest that in the aggregate public sector plans tend to imitate the investment behavior of performance leaders, although the opposite seems to be the case for smaller plans.
6 Conclusion
In the wake of declining funding ratios for public sector plans, their professional management has occasionally been questioned. Well-governed plans should follow prudent investment behavior. Thus, we study the determinants of public plans' equity allocations with a particular focus on the years after 2000. Our focus is on whether public sector plans regularly rebalance, avoid employer and trustee conflicts of interests, and learn from the investment experience of others.
Our descriptive statistics and multivariate analyses of public sector plan data from 1993 to 2006 indicate that public plans tend to be prudent in their asset allocation. For one, there is some indication that public sector plans rebalance their assets actively in response to stock price changes. Also, public sector plans tend to hold more risky assets when they have higher funding levels. Had this not been the case, we would interpret this as increased risk taking by trustees, implying that trustees adopted riskier equity allocations in the face of funding shortfalls. We would have been concerned that this represented a conflict of interests, and that trustees' fallback position would be a bailout by the plan sponsor or taxpayers. The fact that trustees choose lower equities exposure when funding ratios are low indicates that trustee conflicts of interests are not prevalent.
We were also encouraged to find that the equity allocations are larger in the period after we observe higher funding levels, suggesting that trustees wait to know what their financial situation is before they change the risk exposure of their portfolio. Finally, public sector plans tend to hold smaller shares of equities when demands on employers in the form of higher contributions increase. This relationship seems to have become stronger after 2000, suggesting that public sector plans not only avoided employer conflicts of interest as larger demands on employers in the previous period translate into a ‘flight from risk’, but may have become overly cautious in their asset allocation following large underfunding.