1. Introduction
1.1 Status of the transport field
Membrane transport, the vectorial movement of molecules across biological membranes, is a subject which like many other fields within the biological sciences has thrived in the latter half of the 20th century. During this period, the properties of a multitude of membrane transporters have been subjected to close study to reveal their properties such as their kinetic features, substrate specificity and the nature of the transport mechanism. This has entailed detailed investigations on the energetic basis of membrane transporters as well, be it either their status as primary active transporters supported by the chemical energy derived from the hydrolysis of ATP, or as secondary cotransport or antiport systems driven by the ion gradients and/or the membrane potential, created by the active transport systems. Dominant roles in this regard are played by the Na+, K+-ATPase in animal cells and by proton ATPases in the outer membranes of plants and yeast cells and in bacteria that provide the driving force for the concentrative uptake of nutrients and other essential cell constituents by a wealth of secondary transport systems.
Early on the physical nature of membrane transporters, with a few notable exceptions (like the Na+, K+-ATPase, the sarcoplasmic Ca2+-ATPase, the lactose permease and bacterial rhodopsin) had to be treated like a ‘black-box’, as proteinaceous entities of unknown nature that only are expressed by cells in minute amounts. Even though this situation has changed as the result of subsequent cloning and genomic analysis, the fact remains that until recently the understanding of membrane transport in structural terms has mainly been based on theoretical concepts and models. In early ideas, it was realized that membrane transporters which in their kinetic behavior and substrate specificity show many similarities with ordinary enzymes, also exhibit features such as transport-induced counter transport which suggested that the transporter is capable of literally ferrying the transported substrate molecules in a carrier–transport complex across the membrane according to the so-called mobile carrier hypothesis (Patlak, Reference Patlak1957; Wilbrandt & Rosenberg, Reference Wilbrandt and Rosenberg1961). But realizing that cellular membranes present formidable hydrophobic barriers with their protein transporters firmly anchored in a lipid environment, models of membrane transport have subsequently focused on the passage through waterfilled pores or channels in proteins, equipped with internal and external gates with allosteric properties (Jardetzky, Reference Jardetzky1966; Vidaver, Reference Vidaver1966). In many ways, these gates are, in the modern view, considered analogous to those present in channel proteins (Accardi & Miller, Reference Accardi and Miller2004; Gadsby et al. Reference Gadsby, Rakowski and De Weer1993, Reference Gadsby2009), but coordinated in such a way that they lead to the formation of ‘occluded’ and ‘alternating access’ states, making transport against electrochemical gradients feasible. On this background with information on kinetic aspects, but a lack of detailed information on the structures and mechanisms of membrane transporters, it is significant that the situation has changed significantly during the past few years, which have witnessed the clarification of the three-dimensional (3D) structure of a large number of especially procaryotic membrane transporters and channel proteins by X-ray diffraction analysis. As a result, we are now entering a new era where many of the structural underpinnings of the transport process can be identified. Primary ATPase transporters, coupled to the hydrolysis (or synthesis) of ATP, can be categorized as P-, F-, V-ATPases and ABC-transporters (Pedersen, Reference Pedersen2007). Among these, P-type ATPases comprise a family of cation transporters where the formation of an aspartylphosphorylated intermediate drives the active transport of cations. In addition to SERCA and other Ca2+-ATPases, the P-type ATPase family comprises major primary transporters like the Na+, K+-ATPase and gastric H+, K+-ATPase in animals, H+-ATPase in plants, yeasts and heavy metal (e.g. Cu+) ATPases, (Axelsen & Palmgren, Reference Axelsen and Palmgren1998; Lutsenko & Kaplan, Reference Lutsenko and Kaplan1995; Møller et al. Reference Møller, Juul and Le Maire1996). The F-type ATPases consist of a cytosolic (F1) ADP phosphorylating and a membraneous (Fo) proton transporting part, leading to a proton gradient-dependent synthesis of ATP that are present in mitochondria, chloroplasts and bacterial membranes. The structure of the cytosolic F1 part has been obtained at atomic resolution from bovine (Abrahams et al. Reference Abrahams, Leslie, Lutter and Walker1994) and yeast (Kabaleeswaran et al. Reference Kabaleeswaran, Puri, Walker, Leslie and Mueller2006) mitochondria in many different functional states which in conjunction with other biophysical investigations have led to the formulation of rotary mechanisms for the proton transport and ATP synthesis by these proteins (reviewed by Junge et al. Reference Junge, Sielaff and Engelbrecht2009). Less is known about the structure of the V-(vacuolar) ATPases; however, they are probably built on the same principles as the F-synthetases, but in contrast to these their physiological function is to hydrolyze ATP to energize the transport of protons across the plasma membranes and membranes of intracellular organelles, to assist the membrane trafficking of proteins by endo/exocytotic processes (Hinton et al. Reference Hinton, Bond and Forgac2009; Saroussi & Nelson, Reference Saroussi and Nelson2009). ABC transporters are involved in the ATP-dependent import or export of a wide range of organic substrates like cholesterol, fatty acids, carbohydrates, drugs and peptides (Hinton et al. Reference Hinton, Bond and Forgac2009; Saroussi & Nelson, Reference Saroussi and Nelson2009). Insights into their structure and function as alternating access transporters have been acquired from prokaryotic homologues such as the multidrug resistant Sav1866 transporter (Dawson & Locher, Reference Dawson and Locher2006), a putative molybdate transporter (Hollenstein et al. Reference Hollenstein, Dawson and Locher2007) and a maltose transporter (Khare et al. Reference Khare, Oldham, Orelle, Davidson and Chen2009).
Within P-type ATPases, the sarcoplasmic reticulum Ca2+-ATPase was the first transporter for which the 3D structure was clarified (Toyoshima et al. Reference Toyoshima, Nakasako, Nomura and Ogawa2000; Toyoshima & Nomura, Reference Toyoshima and Nomura2002). This Ca2+ transporter, also denoted as SERCA isoform 1a, is the subject of the present review. It is present in large amounts in skeletal muscle, especially in the longitudinal tubules of sarcoplasmic reticulum of fast twitch muscles, where the protein, as part of the excitation–contraction coupling machinery, plays a vital role in the contractile behavior of skeletal muscles. Generally, the diverse isoforms of SERCA, present in other tissues than skeletal muscle together with the plasma membrane- and Golgi (secretory pathway) Ca2+-ATPases play indispensable roles for proper cell function and for maintaining the low cytosolar concentrations of Ca2+ that are necessary for Ca2+ signaling processes, not only in the excitation–contraction coupling of the skeletal muscle, but also for a multitude of other cellular processes such as neurotransmission, neurosecretion, antibody formation, egg fertilization, etc. (Carafoli, Reference Carafoli2002). They are all structurally alike and their transport is dependent on the formation of an ‘energy rich’ aspartylphosphorylated intermediate formed by reaction with ATP that drives the transport of Ca2+ across their resident intracellular or extracellular membranes.
With respect to the sarcoplasmic Ca2+-ATPase, we have to realize at the outset that such a vast amount has been published on the properties of this particular membrane protein that it would defy any attempt to cover this subject fully in a succinct manner. Instead, our review focuses on the developments that have taken place after the appearance of the detailed X-ray-based structures published at the onset of the new millennium (Toyoshima et al. Reference Toyoshima, Nakasako, Nomura and Ogawa2000; Toyoshima & Nomura, Reference Toyoshima and Nomura2002). But before dealing with these issues, we give, by way of introduction, in the following subsections of section 1 first an updated scheme for the intermediary reactions associated with the Ca2+ transport, based mainly on kinetic and other biochemical investigations of the partial reactions of the transport cycle. This is followed by a short account of earlier studies pertaining to the spatial structure of the ATPase up to the point when crystals suitable for X-ray diffraction analysis became available. Finally, we present in the last subsection of section 1 an overview of the crystal structures deposited in the PDB database, with an account of the procedures by which they have been produced. Sections 2–4 then consider in detail our views on what has been learned from these structures, both with regard to the structure, mechanism and regulation of the sarcoplasmic reticulum Ca2+-ATPase. These aspects are considered in relation to data obtained by mutational, biochemical and other studies. Finally, in section 5 we give an overview of the reaction mechanism in connection with a discussion of the energetic aspects and briefly consider future directions for exploration.
The importance of the P-type ATPase field is reflected by a large number of both specialized and general reviews. Among the more recent ones and pertinent for the various aspects and methodologies used for the investigation of the sarcoplasmic reticulum Ca2+-ATPase, we can refer to the following: spectroscopic studies Bigelow & Inesi (Reference Bigelow and Inesi1992); mutational studies: Andersen (Reference Andersen1995a), MacLennan et al. (Reference Maclennan, Rice and Green1997); kinetics and Ca2+ binding: Mintz & Guillain (Reference Mintz and Guillain1997); structure and function: Lee & East (Reference Lee and East2001), Stokes & Green (Reference Stokes and Green2003), 3D crystals: Toyoshima & Inesi (Reference Toyoshima and Inesi2004), Møller et al. (Reference Moller, Nissen, Sorensen and Le Maire2005), Møller et al. (Reference Møller, Olesen, Jensen and Nissen2005), Toyoshima (Reference Toyoshima2008). Among general aspects of the P-type ATPase structure, function and family tree we can mention reviews by Läuger (Reference Läuger1991), Lutsenko & Kaplan (Reference Lutsenko and Kaplan1995), Møller et al. (Reference Møller, Juul and Le Maire1996), Axelsen & Palmgren (Reference Axelsen and Palmgren1998), Jørgensen et al. (Reference Jørgensen, Hakansson and Karlish2003), Kühlbrandt (Reference Kühlbrandt2004). In addition to SERCA 1a detailed X-ray-based structures of P-type ATPases are available for Na+, K+- ATPase from the pig kidney (Morth et al. Reference Morth, Pedersen, Toustrup-Jensen, Sorensen, Petersen, Andersen, Vilsen and Nissen2007) and the rectal shark gland (Shinoda et al. Reference Shinoda, Ogawa, Cornelius and Toyoshima2009) and for the Arabidopsis thaliana H+-ATPase from the yeast-expressed protein (Pedersen et al. Reference Pedersen, Buch-Pedersen, Morth, Palmgren and Nissen2007). However, it is expected that in the coming years the field will become enriched by the clarification of many new structures of other P-type ATPases that based on their individual properties will enable the unraveling of details of the P-type ATPase mechanism and regulation.
1.2 The Ca2+ transport cycle
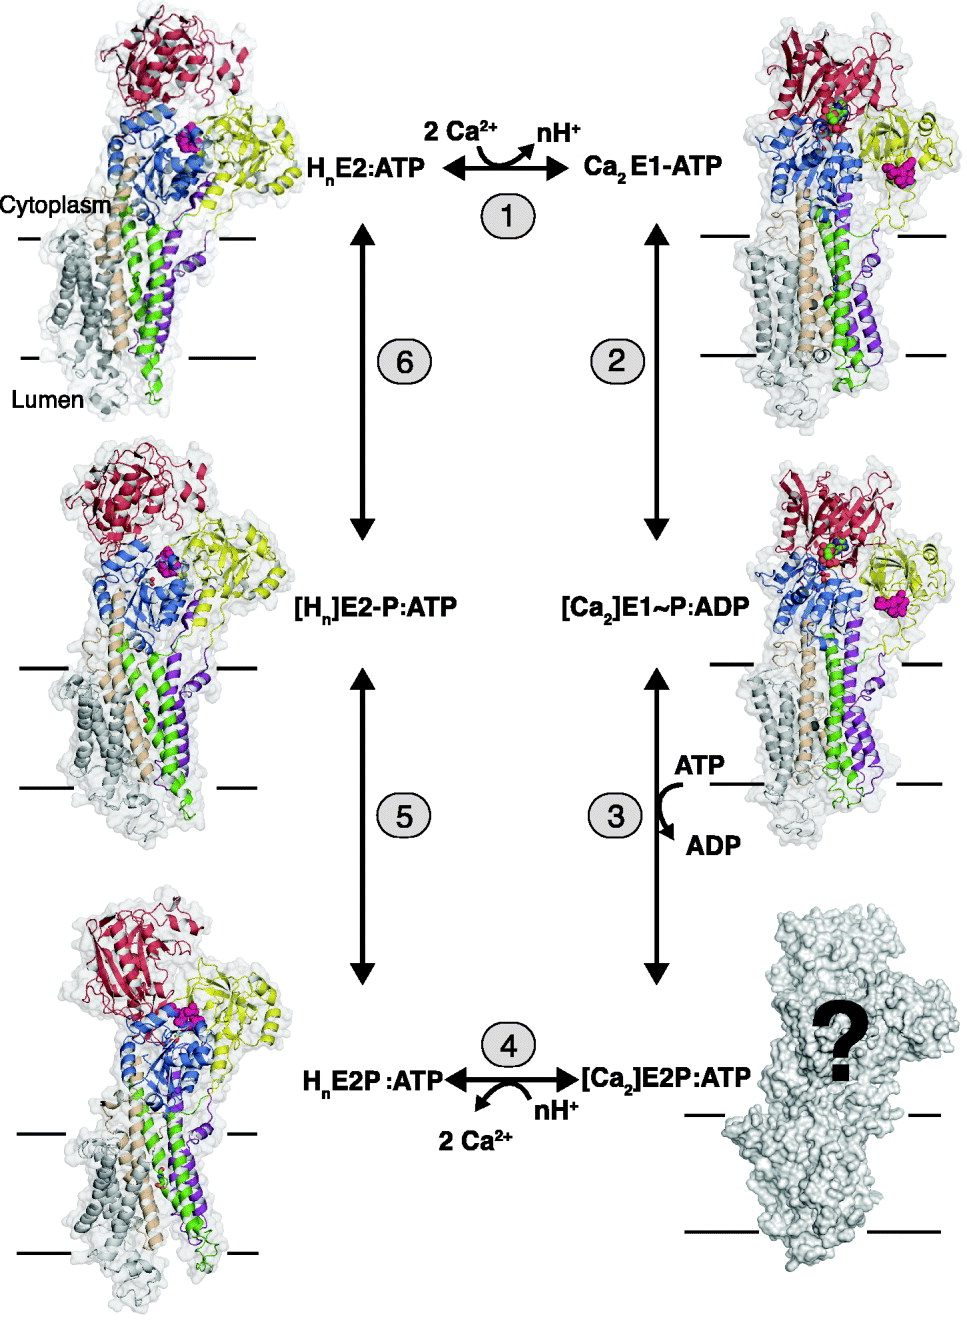
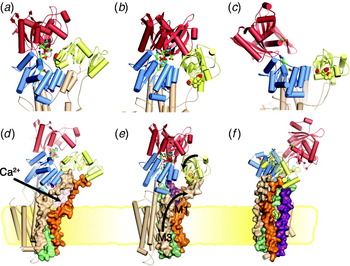
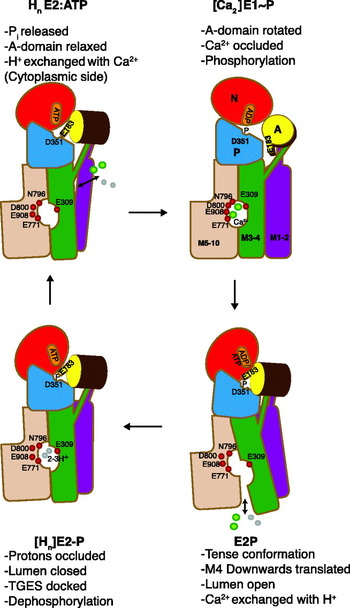
In terms of mechanism, P-type ATPases can be referred to as chemi-osmotic pumps, driving transformation of the chemical energy of an aspartylphosphorylated intermediate into an active transport of cations. In the case of SERCA, each ATP hydrolytic event results in the transport of two Ca2+ ions in antiport with 2–3 protons (Cornelius & Moller, Reference Cornelius and Moller1991; Levy et al. Reference Levy, Seigneuret, Bluzat and Rigaud1990; Yü et al. Reference Yu, Carroll, Rigaud and Inesi1993). The coupling between Ca2+ transport and ATP hydrolysis is tight, leading to high accumulation ratios, which in the case of the SERCA 1a isoform present in the skeletal muscle can attain Ca2+ concentrations 20–40 000 times higher inside the vesicles. In Fig. 1 the ATP-dependent Ca2+ transport and H+ countertransport by the sarcoplasmic reticulum Ca2+-ATPase is depicted in terms of six steps where phosphorylated and non-phosphorylated E1 and E2 intermediates alternate in a cyclical manner: in step 1, two cytosolic Ca2+ ions react with the transporter in a non-phosphorylated E2 state with bound ATP to form a Ca2E1:ATP intermediate. The binding of Ca2+ is accompanied by the release of 2–3 protons to the cytosol. The conformational change of the ATPase from the E2 to the E1 states in step 1, induced by the binding of Ca2+, is followed by the rapid autophosphorylation of Asp 351 from the bound ATP in step 2. The result is the formation of a ‘high-energy’ phosphorylated [Ca2]E1~P:ADP intermediate with occluded Ca2+. In step 3, the conformation of the ATPase is changed back to the E2 state, with the formation of a [Ca2]E2P:ATP intermediate, representing a ‘low-energy’ phosphorylated form of the ATPase, but still with occluded Ca2+ (Danko et al. Reference Danko, Daiho, Yamasaki, Liu and Suzuki2009). Simultaneously ADP, the product of the preceding autophosphorylation reaction, is exchanged by ATP. In step 4, the luminal part of the ATPase transmembrane domain opens, accompanied by deocclusion and release of Ca2+ to the luminal space. This occurs in exchange with n protons (n=2–3) and leads to the formation of the HnE2P:ATP intermediate, where the bound protons partially restore electrostatic balance inside the transmembrane domain after the debinding of Ca2+. After closure of the luminal channel, these protons are occluded inside the membrane segment in the [Hn]E2-P:ATP transition state (step 5). Finally, the latter intermediate becomes dephosphorylated step 6, and the transport cycle is completed with the formation of HnE2:ATP state.
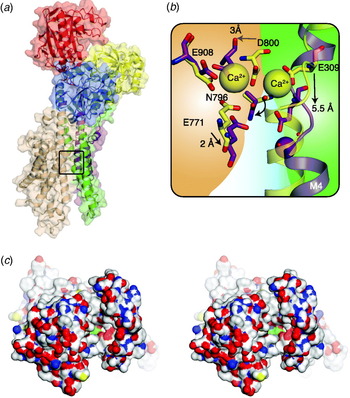
SERCA 1a structures representing key states of the transport cycle with bound nucleotide in terms of the following reactions: (1) The exchange of n protons (n=2–3) for 2 Ca2+ ions. (2) The phosphorylation reaction with ATP with the formation of the [Ca2]E1~P:ADP intermediate with occluded Ca2+. (3) The conversion of [Ca2]E1~P:ADP to [Ca2]E2P:ATP after ADP/ATP exchange with occluded Ca2+ (still unknown structure). (4) The E2P ground state after luminal opening and the exchange of Ca2+ with luminal protons. (5) The formation of the proton occluded E2P transition state. (6) Dephosphorylation of the E2P transition to the E2 state with bound protons and ATP. The structures are shown in gray transparent surface and in cartoon, with the A-domain in yellow, N-domain in red, P-domain in blue, helix M1–2 in purple, M3–4 in green, M5–6 in wheat and M7–10 in gray. The TGES motif in pink spacefilling, Ca2+ liganding residues 309, 771 and 796 in sticks and Ca2+ ions in green spacefilling. [ ] represents an occluded state.
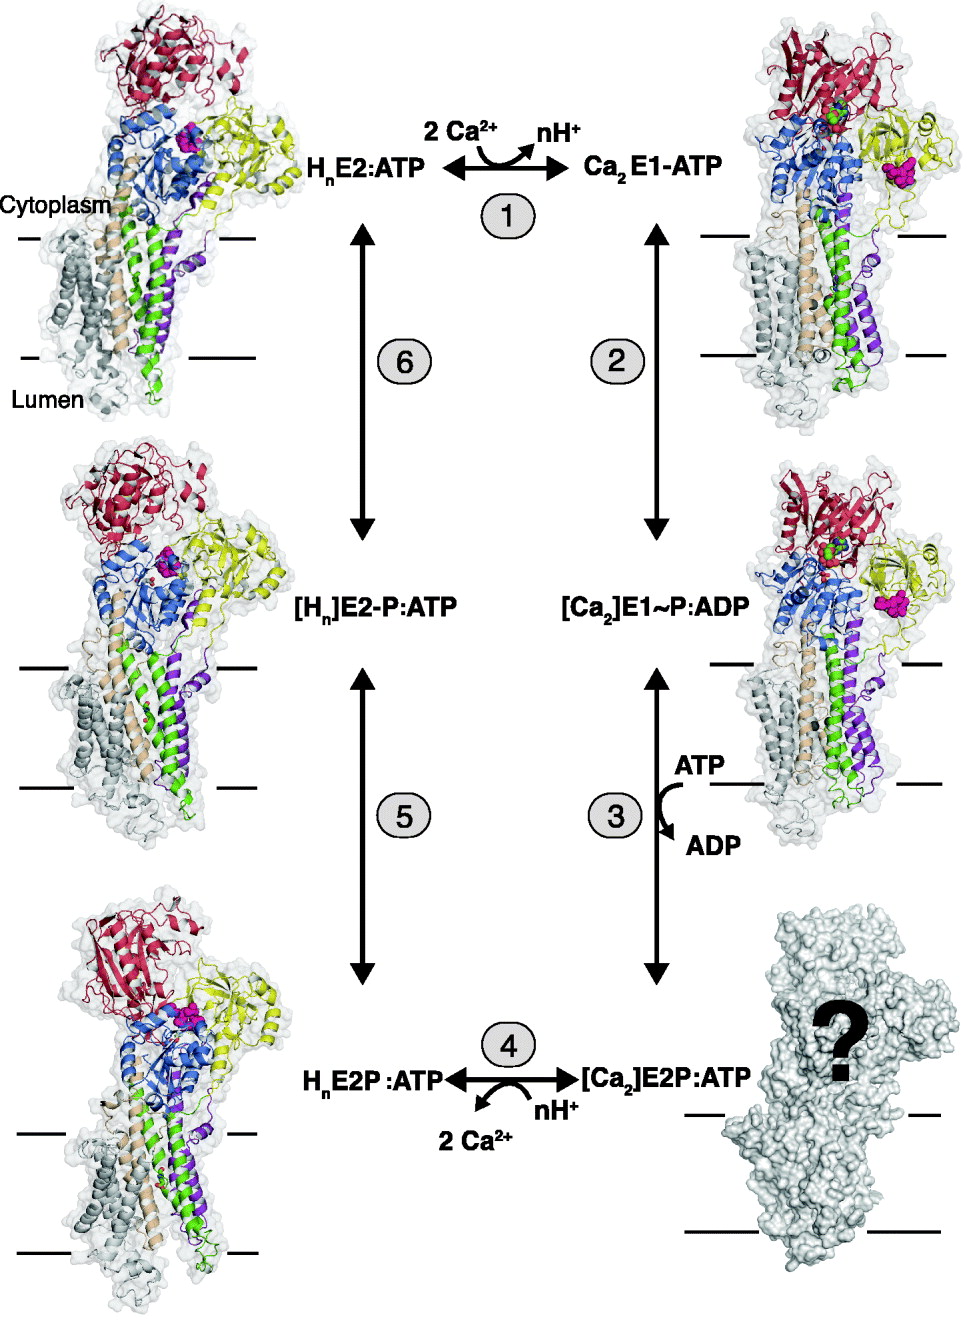
The intermediates and partial reactions assembled in Fig. 1 summarize a large body of both functional and structural studies on the Ca2+-ATPase, many of which are based on considerations that were already formulated in a concise manner by de Meis & Vianna (Reference De Meis and Vianna1979). As can be seen from the vignettes of Fig. 1, X-ray-based structures of the representative for almost all the relevant intermediates have been obtained. As we shall see from the detailed analysis in the following chapters, these give striking support to the scheme and emphasize the fundamental difference between the E1 and E2 conformations as arising from changes in the interactions among the cytosolic nucleotide binding (N-), phosphorylation (P-) and N-terminal (A- or actuator) domains, (colored red, blue and yellow, respectively, in Fig. 1). This includes events, whereby ATP-phosphorylating interactions between the N- and P-domains in the E1 state are shifted towards dephosphorylating interactions between the P- and A-domains in the E2 state. These changes are accompanied by concerted changes in the disposition of the helices in the transmembrane domain by which the intramembranous cation binding sites are changed from a configuration with high affinity for Ca2+ in the E1 state to a proton-preferring state in the E2 state with a release of the bound Ca2+. In this way, the catalytic events in the cytosolar part are coordinated with the translocation events in the transmembrane domain. As emphasized by Tanford (Reference Tanford1983), the scheme implies that Ca2+ translocation takes place on the basis of an alternating access mechanism where the intramembranous binding sites are open either towards the cytosolic space or towards the lumen, and separated by an intervening occluded state.
To sum up, Ca2+/H+ exchange is dependent on the existence of Ca2+-ATPase in two main conformational states, E1 and E2, among which E1 represents the forms that bind Ca2+ with high affinity and is phosphorylated by ATP with the formation of an ‘energy rich’ [Ca2]E1~P intermediate; whereas E2 represents the forms with a preference for the binding of protons that can be reversibly phosphorylated and dephosphorylated by inorganic phosphate. Compared to the usual schemes presented for Ca2+ transport by SERCA-type ATPase the present version emphasizes the fact that under physiological conditions the predominant form of all intermediates have nucleotide attached, either as ADP arising from the phosphorylation reaction with ATP (reaction 2) or as ATP that, although not enzymatically active, remains bound to the ATPase at the high concentration prevailing in the cell and exerts significant modulatory effects on all steps. As we shall see, this has a number of important consequences for the structural analysis of transport, but on the other hand, it should also be realized that the nucleotide bound forms are not a sine qua non for function: thus, in the test tube, the enzyme can be phosphorylated by low (μmolar) concentrations of ATP and can pass through all the subsequent intermediary steps without bound nucleotide, although with slower conversion rates. Finally, it should be noted that the terms E1 and E2 forms do not, as can be seen from Fig. 1, define the binding sites that are open towards either the cytosolic or luminal sides, a quite frequent misunderstanding; rather they refer to two distinctly different conformational states of the protein with high affinities for Ca2+ and protons, respectively.
1.3 Evolution of structural studies of Ca2+-ATPase
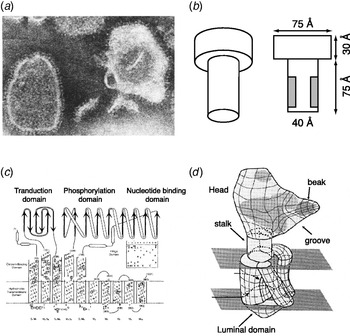
Being an important representative of a primary transporter, from the beginning it has been an important goal for investigators of the study of the sarcoplasmic Ca2+-ATPase to get hold of the detailed 3D structures of the protein as could be obtained by the X-ray diffraction analysis of well-ordered 3D crystals. In this section, we give a short account of structural studies leading up to the fulfilment of this goal. Early electron microscope (EM) pictures of the surface profile of isolated sarcoplasmic reticulum or Ca2+-ATPase purified membranes, made visible by negative staining, such as shown in Fig. 2a, revealed the presence of round and contrast-rich objects with a diameter of about 30–40 Å, connected to the membrane by a thin stalk (Greaser et al. Reference Greaser, Cassens, Hoekstra and Briskey1969; Ikemoto et al. Reference Ikemoto, Kitagawa, Nakamura and Gergely1968; Stewart & MacLennan, Reference Stewart and Maclennan1974; Thorley-Lawson & Green, Reference Thorley-Lawson and Green1973). The appearance of these objects were similar to the ‘lollipops’ that had previously been described for the ATP synthetase (Kagawa & Racker, Reference Kagawa and Racker1966a, Reference Kagawa and Rackerb); their proteinaceous nature was indicated by the fact that they could be removed by protease treatment or highlighted by labeling with Hg-phenyl azoferritin (Hasselbach & Elfvin, Reference Hasselbach and Elfvin1967). An asymmetric and preponderant cytoplasmic orientation of ATPase in the membrane was inferred from the diffraction analysis of stacked and partially ordered Ca2+-ATPase membranes by X-ray diffraction (Dupont & Hasselbach, Reference Dupont and Hasselbach1973) and by combined X-ray and neutron diffraction analysis, reviewed by Herbette et al. (Reference Herbette, Defoor, Fleischer, Pascolini, Scarpa and Blasie1985), whereas freeze fracturing of the membranes indicated that the intramembranous particles attributable to the membrane-inserted part of Ca2+-ATPase was mainly localized to the cytoplasmic bilayer leaflet (Deamer & Baskin, Reference Deamer and Baskin1969; Packer et al. Reference Packer, Mehard, Meissner, Zahler and Fleischer1974; Scales & Inesi, Reference Scales and Inesi1976). From these as well as related functional studies arose the notion of a clear segregation of catalytic and translocation events, the ATPase activity being localized in a hydrophilic head and separated from the intramembraneous Ca2+-binding sites in the membrane by an intervening stalk segment.
Various approaches towards the structural characterization of sarcoplasmic reticulum Ca2+-ATPase. (a) Vesicles of purified Ca2+-ATPase negatively stained with phosphotungstate, X217000. Reproduced from Stewart & Maclennan (Reference Stewart and Maclennan1974) Fig. 1d. (b) Model of Ca2+-ATPase based on X-ray and sedimentation equilibrium analysis of the deoxycholate solubilized monomer of Ca2+-ATPase. Reproduced from Fig. 10 of le Maire et al. (Reference Le Maire, Møller and Tardieu1981). (c) Membrane topology of Ca2+-ATPase based on predicted domain structure and hydrophobicity plots of the amino acid sequence. Reproduced from Fig. 5 of Brandl et al. (Reference Brandl, Green, Korczak and Maclennan1986). (d) 3D structure of Ca2+-ATPase, based on cryo-electron microscopy of 2D tubular crystals of Ca2+-ATPase. Reproduced with slight changes from Fig. 4 of Toyoshima et al. (Reference Toyoshima, Sasabe and Stokes1993).

In another line of investigation, the properties of the Ca2+-ATPase were investigated after isolation from the membraneous environment by solubilization with detergent. From analytical ultracentrifuge experiments, the protein molecular mass was determined to be 110–115 kDa after solubilization in a monomeric state with SDS (Rizzolo et al. Reference Rizzolo, Maire, Reynolds and Tanford1976) and deoxycholate (Jorgensen et al. Reference Jorgensen, Lind, Roigaard-Petersen and Moller1978; le Maire et al. Reference Le Maire, Jorgensen, Roigaard-Petersen and Møller1976). In conjunction with small angle X-ray scattering analysis, the structure of the deoxycholate solubilized monomer was found to have a length of 110 Å with a scattering profile, which as shown in Fig. 2b could be resolved in terms of a head and a long shaft considered to comprise both the stalk and the membrane-inserted part (le Maire et al. Reference Le Maire, Møller and Tardieu1981). Further studies on the C12E8 solubilized and enzymatically active monomer (Andersen et al. Reference Andersen, Lassen and Moller1985b) and reconstituted Ca2+-ATPase (Heegaard et al. Reference Heegaard, Le Maire, Gulik-Krzywicki and Moller1990) established the monomer as the basic Ca2+ transporting unit. However, these studies also indicated that at high protein concentrations oligomerization or aggregation of the C12E8 solubilized Ca2+-ATPase is likely to occur in detergent solubilized and consequently also membraneous Ca2+-ATPase (Andersen et al. Reference Andersen, Vilsen, Nielsen and Moller1986), a circumstance that may be the background for the nonlinear kinetics of a regulatory nature reported for the Ca2+-ATPase in the native membrane (Mahaney et al. Reference Mahaney, Albers, Waggoner, Kutchai and Froehlich2005).
A new era of EM investigation of membraneous Ca2+-ATPase was initiated with the discovery that 2D crystals of Na+, K+-ATPase could be formed in the presence of vanadate (Skriver et al. Reference Skriver, Maunsbach and Jorgensen1981), a methodology that was subsequently applied to Ca2+-ATPase where incubation of the protein in the E2 state with vanadate gave rise to tubular structures with Ca2+-ATPase assembled in dimeric helical rows (ribbons) with opposite polarity (Dux & Martonosi, Reference Dux and Martonosi1983). From the electron diffraction analysis of negatively stained specimens, it was possible to obtain a 3D low-resolution reconstruction map (Taylor et al. Reference Taylor, Dux and Martonosi1986), which showed the ATPase structure to be composed of two cytosolic domains, the larger one extending 60 Å up from the transmembrane plane, whereas the second and smaller one appeared as a lobe attached to the larger domain and separated approximately 18 Å from the membrane (Castellani et al. Reference Castellani, Hardwicke and Vibert1985; Taylor et al. Reference Taylor, Dux and Martonosi1986). Meanwhile, with the publication of the complete primary structure of Ca2+-ATPase (MacLennan et al. Reference Maclennan, Brandl, Korczak and Green1985) a topological map of the ATPase was proposed (Brandl et al. Reference Brandl, Green, Korczak and Maclennan1986) based on ten transmembrane helices and an organization of the cytoplasmic part in terms of a central phosphorylation- and a nucleotide-binding domain, flanked by an N-terminal domain, tentatively assumed to be important for coupling ATP hydrolysis to Ca2+ translocation (Fig. 2c). As shown in the schematic Fig. 2c the cytoplasmic domains were proposed to be connected to the membrane by cytosolic extensions of the five N-terminal transmembrane helices. In the following years, this model was substantiated by a number of proteolytic and immunochemical experiments, and subsequently applied to Na+, K+-ATPase where for a long time only models based on eight transmembrane segments had been considered (reviewed by Møller et al. (Reference Møller, Juul and Le Maire1996)). With respect to the ultrastructural data, a major challenge at the end of the 1980s was to find out how the incomplete spatial model that had been obtained from negatively stained specimens of E2-vanadate crystals could become integrated with the topological map, arising from the primary structure and functional data. This was first tackled, by preparing Ca2+-ATPase stacked in planar bilayers in the E1 conformation (Stokes & Green, Reference Stokes and Green1990).This was done by the relipidation of C12E8-solubilized ATPase, in the presence of a high (10 mM) concentration of Ca2+, according to a recipe that had previously been described by Pikula et al. (Reference Pikula, Mullner, Dux and Martonosi1988). In fact, the protocol for producing these preparations was basically very similar to the procedure that with subtle refinements led to the 3D crystals from which the first structure of the ATPase at atomic resolution was obtained (Toyoshima et al. Reference Toyoshima, Nakasako, Nomura and Ogawa2000). Compared to the present standards, the diffraction properties of these initial crystallization attempts were poor, but nevertheless by the electron diffraction analysis of the frozen-hydrated and non-stained specimens, a projection structure of the whole ATPase could be obtained at 6 Å resolution from which the intramembranous domain was deduced to have a half-moon-shaped structure with a sufficient trans-sectional area to accommodate ten transmembrane helices (Stokes & Green, Reference Stokes and Green1990). A subsequent analysis of tubular samples, prepared according to the usual recipe with EGTA and vanadate, but improved by the electron diffraction analysis of frozen hydrated tubular specimens, resulted in an image of the complete E2 cytoplasmic and membrane-embedded ATPase at 14 Å resolution (Toyoshima et al. Reference Toyoshima, Sasabe and Stokes1993). The structure indicated a more compact organization of the cytoplasmic part than previously computed, with a shape which now resembled the beak of a bird, and suggested a three- or four-partite construction of the transmembrane helices (Fig. 2d). More detailed images of the shape were provided in two following studies where the resolution had been reduced to 8 Å (Zhang et al. Reference Zhang, Toyoshima, Yonekura, Green and Stokes1998) and to 6 Å resolution (Xu et al. Reference Xu, Rice, He and Stokes2002) after stabilization of the E2 form of the ATPase structure with bound thapsigargin. Further attempts to produce Ca2E1-ordered specimens by C12E8 treatment and relipidation indicated a less compact cytoplasmic organization than in the tubular crystals, suggestive of a fundamentally different conformation of the ATPase in the E1 and E2 conformations (Cheong et al. Reference Cheong, Young, Ogawa, Toyoshima and Stokes1996; Ogawa et al. Reference Ogawa, Stokes, Sasabe and Toyoshima1998). Together with a wealth of data obtained during this period on the role of particular amino acid residues, provided by mutagenesis, e.g. of the Ca2+-binding and phosphorylation sites (Andersen, Reference Andersen1995a; MacLennan et al. Reference Maclennan, Rice and Green1997), chemical modification and fluorescence energy transfer (Bigelow & Inesi, Reference Bigelow and Inesi1992; Møller et al. Reference Møller, Juul and Le Maire1996) they allowed fairly accurate, although unproven ideas about the construction and function of the ATPase to be proposed, which later could be verified and elaborated at the time when X-ray structures of Ca2+-ATPase at atomic resolution took over. The most noticeable flaw of the 2D reconstructions was the absence of unambiguously identifiable landmarks in the structure. Thus, it was a complete surprise when it turned out that the beak of the cytoplasmic bird profile was occupied by the N-terminal domain rather than being the location for nucleotide binding as had been postulated from 2D reconstructions of Ca2+-ATPase with CrATP and other non-hydrolyzable ATP analogs (Yonekura et al. Reference Yonekura, Stokes, Sasabe and Toyoshima1997). The reason for this failure was that the resolution simply was not good enough to unambiguously identify neither the location of small ligands nor of helical segments and their connectivity in the 2D-reconstructed images. These problems were immediately resolved when it became possible to prepare crystals of Ca2+-ATPase suitable for X-ray diffraction analysis.
1.4 Crystals of Ca2+-ATPase
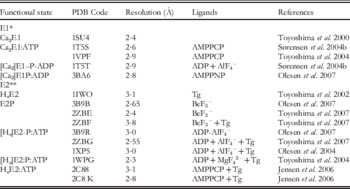
In this section, we consider some methodological aspects that are important for the preparation of well-diffracting crystals of Ca2+-ATPase. As mentioned above the approach is in principle very similar to that previously used for obtaining stacked Ca2+-ATPase specimens for the 2D analysis by electron diffraction analysis: in both cases, the embedment of the Ca2+-ATPase into a detergent-saturated phospholipid bilayer is required, and so far C12E8 has turned out to be the detergent of choice for solubilization of Ca2+-ATPase. Table 1 summarizes which we consider as the most essential among the SERCA 1a structures that have been deposited in the Brookhaven Protein Data Bank, representative of the ATPase during the various stages of transport and in combination with specific ligands and inhibitors. Most of these are present at a sufficiently high resolution (2·3–3·1 Å) such that they not only reveal the course and secondary structure of the polypeptide mainchain, but also enable the assignment of the amino acid side chains and bound ligands As can be seen from Table 1, most of the functionally relevant forms have been obtained by the use of structural analogs of ATP (AMPPCP and AMPPNP) and of phosphate (AlF4−, BeF3−, MgF42−), in a similar way as these compounds have served to characterize phosphorylated intermediates of, e.g. transducin (Antonny & Chabre, Reference Antonny and Chabre1992; Chabre, Reference Chabre1990), myosin ATPase (Park et al. Reference Park, Ajtai and Burghardt1999), G-proteins (Sondek et al. Reference Sondek, Lambright, Noel, Hamm and Sigler1994), phosphotransferases (Wang et al. Reference Wang, Cho, Kim, Jancarik, Yokota, Nguyen, Grigoriev, Wemmer and Kim2002) and ATP synthetase (Abrahams et al. Reference Abrahams, Leslie, Lutter and Walker1994). In our standard procedure, (Sørensen et al. Reference Sørensen, Olesen, Jensen, Møller and Nissen2006) the purified Ca2+-ATPase is prepared from SR vesicles by the extraction of extrinsic proteins (calsequestrin, M55 glycoprotein) with a low concentration of deoxycholate (Andersen et al. Reference Andersen, Lassen and Moller1985b). The purified membranes resulting from this treatment are used directly for crystallization after solubilization of the Ca2+-ATPase and lipids by a minimal amount of C12E8 in the presence of salt (KCl), buffer (Mops, pH 6·8) and activity preserving cryoprotectants like sucrose or glycerol. After the removal of insoluble and inactive ATPase residues by repeated centrifugation, screens are set up for crystallization by the hanging drop procedure, using polyethyleneglycol as the main precipitant (Sørensen et al. Reference Sørensen, Olesen, Jensen, Møller and Nissen2006). Three-dimensional crystals usually develop from appropriate incubations over a period of 1–10 days. Optimization of the crytallization process requires the use of additives like tert-butanol, dimethylsulfoxide or 3-methyl-5-pentanediol (MPD) and second detergents have also proven helpful (Laursen et al. Reference Laursen, Bublitz, Moncoq, Olesen, Møller, Young, Nissen and Morth2009). The crystals formed are typically very fragile and their diffractive properties upon mounting and flash cooling in liquid nitrogen are typically dependent on the slow evaporation of mother liquor until cryoprotecting conditions are reached which we regulate by the concentration of, e.g. cryoprotectant or salt in the reservoir fluid (Sørensen et al. Reference Sørensen, Møller and Nissen2004b). In a few cases, rapid soaking with cryoprotecting buffer has been possible (Laursen et al. Reference Laursen, Bublitz, Moncoq, Olesen, Møller, Young, Nissen and Morth2009). The procedure for cooling of the crystals at liquid nitrogen temperature is also important for the preservation of their structure and in certain cases has required precooling to 4°C before flash coling (Sørensen et al. Reference Sørensen, Møller and Nissen2004b).
Important 3D structures of Ca2+-ATPase representative of well defined transport intermediates

* 10 mM Ca2+. ** EGTA.
In the procedure employed by Toyoshima's group, the Ca2+-ATPase is purified in a delipidated state from the sarcoplasmic reticulum of rabbit skeletal muscle after solubilization with C12E8 and affinity chromatography on a Reactive Red column (Toyoshima et al. Reference Toyoshima, Nakasako, Nomura and Ogawa2000; Toyoshima & Nomura, Reference Toyoshima and Nomura2002). Crystallization proceeds after relipidation and dialysis against the media of appropriate composition, including the presence of ligands and stabilizers. We also in our repertoire employ affinity chromatography for the purpose of purifying Ca2+-ATPase produced by heterologous expression in yeast (Jidenko et al. Reference Jidenko, Nielsen, Sorensen, Moller, Le Maire, Nissen and Jaxel2005). In this case, the Ca2+-ATPase, with an added thrombin sensitive linker and biotin acceptor domain is bound to a streptavidin column, from which it is released by cleavage with thrombin. Then the Ca2+-ATPase, freed from its biotin acceptor domain, is further purified by high-performance liquid chromatography (HPLC), and finally relipidated after Amicon filter concentration by an addition of dioleoylphosphatidylcholine (DOPC). This procedure, by which up to two milligram quantities of Ca2+-ATPase can be purified after heterologous expression in 12-liter-yeast culture, has opened the way to study functional aspects in combination with crystallization of Ca2+-ATPase mutants (Marchand et al. Reference Marchand, Lund Winther, Holm, Olesen, Montigny, Arnou, Champeil, Clausen, Vilsen, Andersen, Nissen, Jaxel, Moller and Le Maire2008).
Following the lead of the early studies of Martonosi (Dux et al. Reference Dux, Pikula, Mullner and Martonosi1987) crystallization of E1 forms usually is performed in the presence of a high Ca2+ concentration (⩾10 mM), which is far above that required to saturate the Ca2+ transport sites, but which probably serves to stabilize nucleotide-binding (Picard et al. Reference Picard, Toyoshima and Champeil2006) or protein–protein contacts at the cytosolic domains in the crystal (Toyoshima et al. Reference Toyoshima, Nakasako, Nomura and Ogawa2000 and pdb entries 1SU4 and 2C9M); while to obtain E2 conformations thapsigargin or other transmembrane-stabilizing inhibitors such as cyclopiazonic acid (Laursen et al. Reference Laursen, Bublitz, Moncoq, Olesen, Møller, Young, Nissen and Morth2009; Moncoq et al. Reference Moncoq, Trieber and Young2007; Takahashi et al. Reference Takahashi, Kondou and Toyoshima2007) or bistertiaryhydroquinone (BHQ) (Obara et al. Reference Obara, Miyashita, Xu, Toyoshima, Sugita, Inesi and Toyoshima2005), are often present together with EGTA to complex Ca2+. To obtain well-diffracting crystals, C12E8 is the detergent of choice, aided as mentioned above by the presence of small organic molecules as additives. In all crystallizations, membrane lipid is present, added either after delipidation of the sample or as native lipids preserved with the protein in the purified Ca2+-ATPase preparation after detergent solubilization. In contrast to most membrane proteins, the presence of lipid is an absolute requirement for the crystallization of Ca2+-ATPase, as it is in the formation of 2D crystals. Thus, Ca2+-ATPase crystallizes as a type-1 membrane protein (Michel, Reference Michel1990). In all likelihood, the phospholipid and detergent form a mixed detergent/lipid bilayer phase that embeds the Ca2+-ATPase transmembrane sector (Sørensen et al. Reference Sørensen, Olesen, Jensen, Møller and Nissen2006). This results in the formation of 3D crystals by the stacking of several bilayers on top of each other. An analysis of the crystal composition has indicated the presence of about 30 phospholipid molecules and 80 molecules C12E8 per ATPase monomer, which gives a hydrocarbon content similar to that of the lipid in the native membrane (Sørensen et al. Reference Sørensen, Olesen, Jensen, Møller and Nissen2006). Usually, neighboring layers of Ca2+-ATPase molecules are present in opposite orientation, resulting in the formation of alternating head-to-head and tail-to-tail contacts between the different layers, an organization favorable for avoiding steric interference among individual ATPase molecules and neutralizing asymmetric distribution of charges. Occasionally, we have detected a dimeric unit cell with the same polarity of the ATPase molecules; these are characterized by a slight angle between the axes of each monomer in the dimeric unit cell. Evidently, this arrangement is needed to avoid a steric clash between the more bulky cytosolic domains. From the rather peripheral contacts between the ATPase molecules that are characteristic of the crystals, artefacts arising from packing constraints are not likely to be of major concern. As with many other membrane proteins most problems in modeling arise from the difficulties to obtain an ordered and isotropic arrangement of the transmembrane region, which in our case is located within a lipid/detergent bilayer with fluidic properties. Nevertheless, the outline of the transmembrane amino acid residues can usually be deduced from the electron density maps, and in some cases the resolution of this region has been excellent, e.g. for Ca2+-ATPase stabilized by thapsigargin and BHQ (Obara et al. Reference Obara, Miyashita, Xu, Toyoshima, Sugita, Inesi and Toyoshima2005) and the E2-BeF3− structure (corresponding to the E2P ground state) (Olesen et al. Reference Olesen, Picard, Winther, Gyrup, Morth, Oxvig, Møller and Nissen2007).
2. The Ca2+-ATPase domain structures
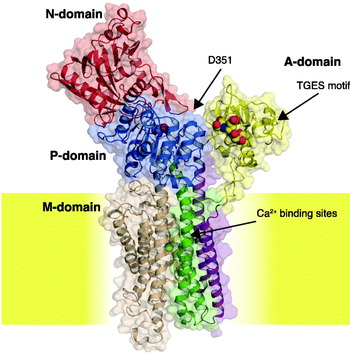
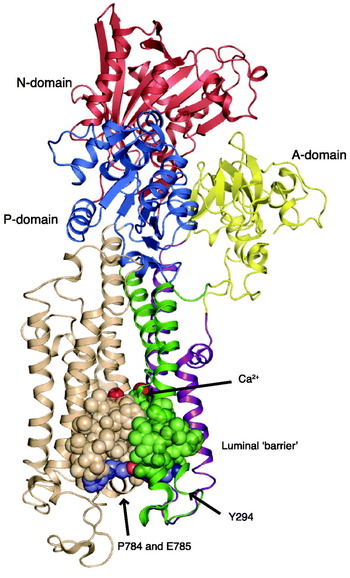
We now turn to a descripton of the Ca2+-ATPase structure as it has emerged from the X-ray diffraction analysis. This has confirmed the previous evidence for a modular composition in terms of a number of domains with precisely defined functions whose interrelationships are coordinated by linkers between the cytosolic and membranous domains (Green & Stokes, Reference Green and Stokes1992; MacLennan et al. Reference Maclennan, Brandl, Korczak and Green1985; Møller et al. Reference Møller, Juul and Le Maire1996). The cytosolic domains are constituted by the nucleotide-binding (N) domain, the phosphorylation (P) domain, and an actuator (A) transduction domain. These are most clearly depicted in the open Ca2E1 form of the Ca2+-ATPase (pdb code 1SU4, Toyoshima et al. Reference Toyoshima, Nakasako, Nomura and Ogawa2000), cf. Fig. 3. Via the S1–S6 linkers the cytosolic domains are connected with the membraneous (M-) domain, constituted by ten transmembrane segments (M1–M10) that harbor the two Ca2+ transport-binding sites.
The first atomic resolution structure of SERCA (pdb code 1SU4) by Toyoshima et al. (Reference Toyoshima, Nakasako, Nomura and Ogawa2000) in the Ca2E1 open conformation with no ATP bound. Shown in transparent surface and cartoon with the A-domain in yellow, N-domain in red, P-domain in blue, helix M1–2 in purple, M3–4 in green, M5–6 in wheat and M7–10 in gray. The TGES motif is shown in spacefilling with C atoms in yellow, N atoms in blue and O atoms in red. The Ca2+ ions are shown in green spacefilling. The approximate position of the lipid bilayer membrane, surrounding the Ca2+-ATPase, is indicated in yellow.

Considering the Ca2+-ATPase as a pumping device, our review is built up in the following way: First, we review in this section the structure and function of each of its components (i.e. the domains) of the pump. In Section 3, we examine how the components of the pump are assembled to bring about the active transport of Ca2+ across the membrane. In Section 4, we review data related to the fine tuning (regulation) of the pump within a membraneous environment. Finally, in Section 5 we consider the energetic aspects of coupling of Ca2+ transport and ATP hydrolysis by the pump.
2.1 The nucleotide-binding domain
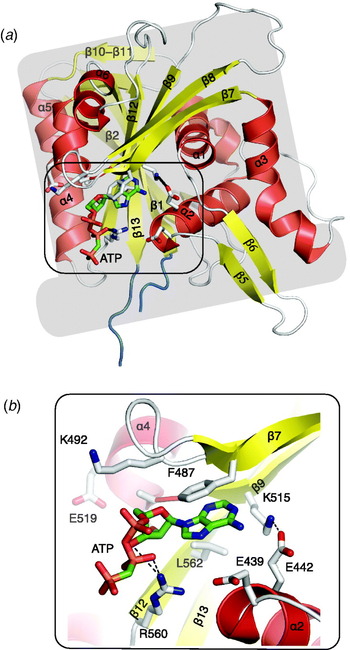
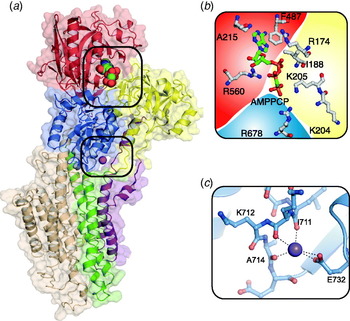
The nucleotide-binding N domain is located in the upper, cytoplasmic part of the Ca2+-ATPase molecule, further removed from the lipid membrane than the P-domain, with which it is closely connected via a hinge region, formed by residues 358–360 and 600–605 (with the DPPR motif present in the primary structure). The overall arrangement represents a Rossman fold formed by six α-helical segments and 13 antiparallel β-segments (Fig. 4a). The overall shape of the domain resembles that of a tophat, with the central portion formed by two of the helical segments (α2 and α4) and seven of the β-segments that line a halfbarrel structure, whereas the remaining helices and a number of loops and short antiparallel β-segments form a major part of the solvent exposed structure. The autonomous nature of the N-domain is indicated by the fact that it can be isolated as a watersoluble fragment by proteolytic cleavage, with the retention of both nucleotide-binding capacity (Champeil et al. Reference Champeil, Menguy, Soulie, Juul, De Gracia, Rusconi, Falson, Denoroy, Henao, Le Maire and Moller1998; Moutin et al. Reference Moutin, Rapin, Miras, Vincon, Dupont and Mcintosh1998) and, according to nuclear magnetic resonance (NMR) analysis (Abu-Abed et al. Reference Abu-Abed, Mal, Kainosho, Maclennan and Ikura2002), with a structural fold similar to that seen in the crystal structure. Similar findings have been obtained with the N-domain of Na+, K+-ATPase where the structure of the isolated fragment has been studied both by NMR (Hilge et al. Reference Hilge, Siegal, Vuister, Guntert, Gloor and Abrahams2003) and X-ray diffraction of crystals of the isolated N-domain (Håkansson, Reference Håkansson2003) or of the whole ATPase (Morth et al. Reference Morth, Pedersen, Toustrup-Jensen, Sorensen, Petersen, Andersen, Vilsen and Nissen2007; Shinoda et al. Reference Shinoda, Ogawa, Cornelius and Toyoshima2009). Despite appreciable differences in sequence and length of the solvent-exposed part, there is a surprising degree of similarity of the core structure among the N-domains of Ca2+-ATPase and Na+, K+-ATPase. The crystal structures of the N-domain of the whole ATPase molecule with bound AMPPCP (Sørensen et al. Reference Sørensen, Møller and Nissen2004b; Toyoshima & Mizutani, Reference Toyoshima and Mizutani2004), or with bound ATP by the non-phosphorylating D351A mutant (Marchand et al. Reference Marchand, Lund Winther, Holm, Olesen, Montigny, Arnou, Champeil, Clausen, Vilsen, Andersen, Nissen, Jaxel, Moller and Le Maire2008) shows that the nucleotide moiety of ATP is bound in a groove located at the lower end of the N-domain tophat, with the triphosphate part of the nucleotide located outside the groove, in the interphase between the N- and P-domains (Fig. 4b). Among the structural folds the α2 and α4-helix, together with the β7–β9 segments, are involved in the binding site of ATP which takes place by sandwiching of the adenine ring between the conserved Phe 487 and Lys 492 side chains against the Lys 515 and Thr 440/Glu 442 (α2) residues (Fig. 4b). The involvement of π–π contacts with Phe 487 is suggested by the staggered position of the phenyl ring with the adenine ring. The binding pocket is preformed and somewhat wider in the absence of bound nucleotide in the Ca2E1 form, while in the E2 form only side chain rotamers changes upon nucleotide binding, most notably Glu 439 (Jensen et al. Reference Jensen, Sorensen, Olesen, Moller and Nissen2006). Thus, only small conformational changes are required for adenosyl binding. The Lys 515 residue marks the start of a conserved KGAPE519 motif, which as a β-strand stretches from the upper part of the N-domain to the binding site; Lys 515 has been known for many years to be specifically modified by fluorescein isothiocyanate FITC (Mitchinson et al. Reference Mitchinson, Wilderspin, Trinnaman and Green1982), resulting in the disruption of nucleotide binding. Lys 515, interacts with the 6-amino group of the adenine ring and is close to Glu 442 with which it probably forms a strong ionic or hydrogen bond in the hydrophobic interior of the domain. Remarkably, all the residues involved in adenosine binding in the Ca2+-ATPase crystals are also conserved among other P-type ATPases, and their important roles in nucleotide binding and enzyme turnover is directly documented in site directed mutagenesis experiments (Clausen et al. Reference Clausen, Mcintosh, Vilsen, Woolley and Andersen2003).
The N-domain, represented by the Ca2E1-AMPPCP structure (pdb code 1T5S). (a) Overall ‘tophat’ representation in cartoon showing the central core of seven β -strands surrounded by 6 α helices, peripheral β-strands, and loops. The AMPPCP molecule is shown in sticks. (b) close-up view of the nucleotide-binding site and the interactions of AMPPCP with Arg 560 and Phe 487 ring stacking with AMPPCP, together with other residues engaged in the formation of the adenosyl binding cavity.

The triphosphate part of the bound nucleotide, located at the border of the N-domain, forms a bent conformation, different from the elongated (energy minimized) equilibrium conformation of the nucleotide in solution. The structure of the Ca2E1:AMPPCP and E2:AMPPCP (Tg) crystals suggests that the bend is dependent on electrostatic interactions with Arg 560 (β12), a conserved and functionally important residue (Clausen & Andersen, Reference Clausen and Andersen2003) exposed on the lower surface of the N-domain, assisted by Leu 562 by the formation of a hydrogen bond with the 3OH′ hydroxyl group of ribose, according to IR spectral studies (Liu & Barth, Reference Liu and Barth2004). In addition, Glu 439 (α2), which is a predilection point for oxidative Fe2+ cleavage (Hua et al. Reference Hua, Inesi, Nomura and Toyoshima2002; Montigny et al. Reference Montigny, Jaxel, Shainskaya, Vinh, Labas, Moller, Karlish and Le Maire2004), has also been implicated in nucleotide binding, via a water coordinated Mg2+ binding site invoked during phosphorylation (Sørensen et al. Reference Sørensen, Møller and Nissen2004b). As a result of these interactions, the γ-phosphate is located rather close to the N-domain, but by the bending of the whole N-domain towards the P-domain it is also capable of interacting with the phosphorylatable Asp 351 residue in the Ca2+ bound E1 form via direct coordination of both to a Mg2+ ion further coordinated by Asp 703 and the carbonyl of Thr 353. In fact, the N- and the P-domains can be considered to be glued together or ‘cross-linked’ as a result of the ATP molecule interacting intimately with both domains (see the following section 2.2).
2.2 The phosphorylation domain
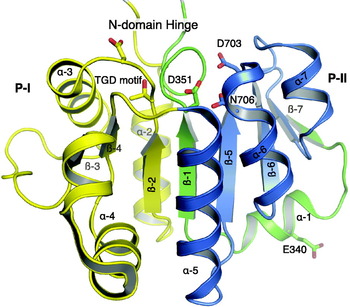
The phosphorylation (P) domain is composed of two different, but closely interacting parts of the Ca2+-ATPase polypeptide chain: An N-terminal and central part, comprising residues 330–357, a continuation of the cytosolar extension of the fourth membrane segment (S4) that is wrapped up in polypeptide from a more C-terminal part, comprised by residues 605–738. As shown in Fig. 5, with the Ca2+-ATPase molecule placed en face as in Fig. 3, the N-terminal peptide (green part) starts at the bottom of the P-domain, runs forward to the front of the domain to make a 90° bend followed by a short α-helical stretch around Glu-340 (P-α1). Then the chain submerges into the domain to form a central β-strand of the P-domain ending with the phosphorylation motif (349CSDKTGTLT357). The larger C-terminal part of the P-domain (sequence 605–738) is formed by polypeptide that follows after the interposed N-domain (sequence 361–600), which is linked to the P-domain with two short hinges (358TNQ and 601DPPR). The C-terminal part of the P-domain surrounds the phosphorylation motif as two hemispherical α, β-structured Rossman folds (comprising residues 605–679 and 680–738), which we shall refer to as subdomains P-I (yellow) and P-II (blue), respectively. Among these, P-I has the more irregular α3β3 Rossman fold, starting with a helical segment that stretches forward from the hinge region with the N-domain, followed by a short loop and a β-strand (residues 620–624), which ends at the 625TGD motif that forms an integral part of the phosphorylation site. The 601–624 residues are highly conserved, and together with the 601DPPR motif of the hinge region probably important for the proper coordination of events in the N- and P-domains during the ATP phosphorylation process. As another important feature, the P-β2 strand 620–624 is engaged in close contact with the P-β1 strand of the phosphorylation motif (residues 347–351), which on the contralateral side is engaged in similar contacts with the P-β5 strand of P-II. This three-stranded β-pleated structure is probably important for stabilization of the central P domain structure that at the upper end contains the phosphorylation site that is located in a cavity between a number of important residues for the phosphorylation reaction, as shown in Fig. 5 and discussed below.
The phosphorylation domain with the central β-stranded core, formed by the N-terminal 330–357 P-αβ peptide shown in cartoon (green) with the phosphorylatable Asp 351 at the top of the domain, shown in sticks, and the two C-terminal P-I (605–679) and P-II (680–738) subdomains, also shown in cartoon and colored in yellow and blue, respectively, together with some of the residues important for phosphorylation (the 625TGD motif, Asp 703, and Asn 706 shown in sticks). The representation is based on the 1T5S structure.

In P-II, the polypeptide forms a regular Rossman fold, neatly arranged side by side as three consecutive αβ parallel running folds. This part of the ATPase contains the long and extremely well-conserved signature motif of P-type ATPases, starting with 699AM(V)TGDVN and ending with GIAMG721. Like the phosphorylation motif, this sequence is diagnostic of P-type ATPases and, as part of a central core (Section 2.5), vitally important for energy transduction; it contains two aspartic acid residues (Asp 703 and Asp 707) of which the former is coordinated with Mg2+ during the phosphorylation process. P-II also contains the catalytically active Lys 684, which in conjunction with Mg2+ is required to abstract negative charge during the phosphorylation process (see below).
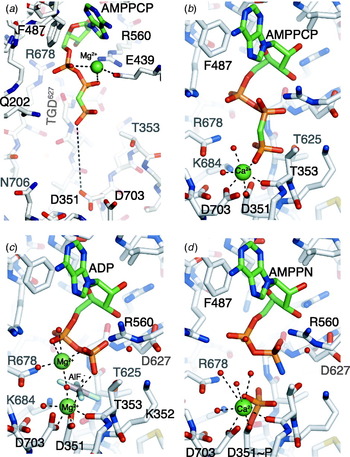
Compelling evidence has been presented to include P-type ATPases as a member of the HAD (haloacid dehalogenase) superfamily (Aravind et al. Reference Aravind, Galperin and Koonin1998; Stokes & Green, Reference Stokes and Green2000). In addition to the structurally well-characterized archaetype member, Pseudomonas L-2 haloacid dehalogenase, from which the family derives its name, this group of proteins includes a number of prokaryotic and watersoluble phosphatases and phosphotransferases (Collet et al. Reference Collet, Gerin, Rider, Veiga-Da-cunha and Van Schaftingen1997; Koonin & Tatusov, Reference Koonin and Tatusov1994). The family also includes a group of bacterial chemotaxic protein regulators like CheY (Bellsolell et al. Reference Bellsolell, Prieto, Serrano and Coll1994; Stock et al. Reference Stock, Martinez-Hackert, Rasmussen, West, Stock, Ringe and Petsko1993). Most of these proteins (although not the haloacid-dehalogenase that has given the family its name) are characterized by the formation of covalently bonded aspartylphosphate intermediates during the reaction cycle. With respect to the catalytic mechanism, despite an overall low degree of homology, sequence comparisons have suggested that the active site in all cases is constituted by conserved residues originating from three different parts of the polypeptide chain (Aravind et al. Reference Aravind, Galperin and Koonin1998; Ridder & Dijkstra, Reference Ridder and Dijkstra1999), and these assignments are supported by the available 3D structures of CheY (Bellsolell et al. Reference Bellsolell, Prieto, Serrano and Coll1994; Stock et al. Reference Stock, Martinez-Hackert, Rasmussen, West, Stock, Ringe and Petsko1993) and phosphoserine phosphatase (Peeraer et al. Reference Peeraer, Rabijns, Verboven, Collet, Van Schaftingen and De Ranter2003; Wang et al. Reference Wang, Kim, Jancarik, Yokota and Kim2001). These common features include: in Domain I, a phosphorylation motif like the ATP phosphorylatable aspartate residue (Asp 351 in Ca2+-ATPase); in Domain II, a catalytically active serine or threonine residue (represented by the threonine residue in the 625TGD motif in P-I of Ca2+-ATPase and other P-type ATPases); and in Domain III, a lysine residue (Lys 684 in P-II and homologous lysine residues in other P-type ATPases) together with two aspartate residues in the C-terminal half of P-II, at least one of which is implicated in the binding of Mg2+ and represented by Asp 703 in Ca2+-ATPase (Ridder & Dijkstra, Reference Ridder and Dijkstra1999; Stock et al. Reference Stock, Martinez-Hackert, Rasmussen, West, Stock, Ringe and Petsko1993). The reaction leading to the formation of the aspartylphosphorylated intermediate involves a nucleophilic association mechanism between the γ-phosphate of ATP and the susceptible aspartate residue, a reaction that is assisted by the above-mentioned conserved residues in Domains II and III and by Mg2+ (Ridder & Dijkstra, Reference Ridder and Dijkstra1999). With respect to Ca2+-ATPase, the phosphorylation reaction can be described by the following steps: (1) Docking of the γ-phosphate from the ATP bound in the E2 conformation into the cavity forming the phosphorylation site between P-I and P-II. This reaction is dependent on a concomitant change in the conformation of ATPase to E1 caused by the binding of Ca2+ to the membrane domain and withdrawal of the A-domain from its interaction with the phosphorylation site (Section 3.1). (2) Interaction of the γ-phosphate with Asp 351, forming first a phosphorylation transition state intermediate and then a covalent bond with carboxylate Asp 351 concomitant with cleavage of the β, γ phosphate bond of ATP. For these crucial reactions, four crystal structures are available: (i) E2:AMPPCP, with stabilization by thapsigargin (Jensen et al. Reference Jensen, Sorensen, Olesen, Moller and Nissen2006); (ii) Ca2E1:AMPPCP, representing the nucleotide bound state prior to phosphorylation activated by Ca2+ binding at the transport sites (Picard et al. Reference Picard, Toyoshima and Champeil2006; Sørensen et al. Reference Sørensen, Møller and Nissen2004b; Toyoshima & Mizutani, Reference Toyoshima and Mizutani2004); (iii) the Ca2E1–ADP–AlF4− structure, representing the phosphorylated transition state (Sørensen et al. Reference Sørensen, Møller and Nissen2004b) and (iv) the structure of Ca2E1–P:AMPPN, representative of the genuine [Ca2]E1~P phosphoenzyme with bound ADP (Olesen et al. Reference Olesen, Picard, Winther, Gyrup, Morth, Oxvig, Møller and Nissen2007). Figure 6 shows the details of the phosphorylation reaction as they can be described on the basis of these structures. In Fig. 6 a, AMPPCP, as an analog of ATP, loosely interacts with the periphery of the P-domain, corresponding to the TGD motif and Arg 678. In Fig. 6b the negatively charged γ-phosphate residue, after the Ca2+-induced change in conformational state from E2 to E1, has moved close to the carboxylate group of Asp 351, stabilized by electrostatic and hydrogen bond interactions with the side chains of Lys 684 and Thr 625. Furthermore, divalent cation mediates contact between the carboxylate group of Asp 351 and γ-phosphate; but note that in the crystal structure it is Ca2+ which replaces the physiologically relevant Mg2+, due to the high Ca2+ concentration used in crystallization of E1 forms (Picard et al. Reference Picard, Jensen, Sorensen, Champeil, Moller and Nissen2007). The divalent metal ion is octahedrally coordinated by further ligation with the carbonyl backbone of Thr 353, the carboxylate group of Asp 703, and a water molecule. All these interactions are retained in the Ca2E1–ADP–AlF4− structure (Fig. 6c), where the central Al3+, surrounded by the planar arranged F- groups functions as a mimick of phosphoryl transfer in the transition state, as evidenced by the fact that it is linearly and equidistantly (~2 Å) interposed between the β-phosphate of ADP and the carboxyl group of Asp 351. Thus, the structure can be taken to represent an intermediate stage in the transfer of γ-phosphate from ATP to the accepting Asp 351 carboxylate group, according to an SN-2 associative nucleophilic reaction mechanism (Sørensen et al. Reference Sørensen, Møller and Nissen2004b). The structure reveals how the opposing electrostatic interactions between the negatively charged nucleotide and Asp 351 carboxylate are partially overcome by an abstraction of negative charge by the closely positioned Lys 684 residue, and by divalent cation (in which structure Mg2+ replaces Ca2+) that coordinates with both the Asp 351 carboxylate and the γ-phosphate group. This structure of the environment for the transfer of the covalent phosphate bond from nucleotide to Asp 351 is in good agreement with deductions previously drawn from studies involving mutation of residues critical for the ATP phosphorylation reaction (Andersen, Reference Andersen1995a; Clausen et al. Reference Clausen, Mcintosh, Woolley and Andersen2001; McIntosh et al. Reference Mcintosh, Clausen, Woolley, Maclennan, Vilsen and Andersen2004). Additionally, Lys 352, while not directly involved will support a favorable electrostatic environment for the phosphorylation reaction. It has also been suggested that Lys 352, by inducing a single helix at the end of the phosphorylation motif (353TGTLT) exposes the main chain carbonyl Thr 353 for ligation with Mg2+ (Jørgensen et al. Reference Jørgensen, Hakansson and Karlish2003).
Changes in the phosphorylation P-site and nucleotide-binding N-site during phosphorylation with ATP. (a) E2:ATP represented by the E2:AMPPCP structure (pdb 2C88); (b) Ca2E1:ATP represented by the Ca2E1:AMPPCP structure with Ca2+ replacing the physiologically bound Mg2+; (c) Phosphorylation transition state, [Ca2]E1-P-ADP, represented by the [Ca2]E1-AlF4−-ADP structure, (pdb 1T5T); (d) [Ca2]E1~P:ADP, represented by the [Ca2]E1~P:AMPPN structure (pdb 3BA6) with Ca2+ replacing the physiologically relevant Mg2+. ATPase residues are shown in white sticks with N and O atoms colored blue and red, respectively. AMPPCP, ADP and AMPPN are shown in sticks colored as in Fig. 3. Water molecules are shown in red spacefilling and Mg2+ and Ca2+ in green spacefilling.

Other unique features of the transition state are that in this state the side chains of Thr 353 and Thr 625 stabilize the β- and γ-phosphates as they arrange ATP for phosphorylation of Asp 351. Furthermore, an additional Mg2+ cation is found in the [Ca2]E1–AlF4−-ADP structure, bound to the α, β-phosphate of ADP, Arg 678 and Asp 627 of the TGD motif. It can be noted that in the [Hn]E2:AMPPCP form a Mg2+ ion also interacts with the α, β-phosphate of the bound trinucleotide, although with different residues on the ATPase due to movements of the cytosolic domains associated with the E2→Ca2E1 transition (see the previous section on the N-domain). The role of the second bound divalent cation, which during phosphorylation is only associated with the transition state, will further aid to lower the activation energy required for the transfer of the phosphate from ATP to Asp 351 the ADP leaving group. Finally, Fig. 6d shows the structure of the fully phosphorylated Ca2+-ATPase, obtained by the use of the slowly hydrolyzed nucleotide analog, AMPPNP which stabilized the Ca2+-ATPase in the Ca2E1~P:AMPPN nucleotide bound form (Olesen et al. Reference Olesen, Picard, Winther, Gyrup, Morth, Oxvig, Møller and Nissen2007). In this structure, the formation of a covalent phosphoaspartyl bond was documented by mass spectrometry of a proteolytic fragment. The difference Fourier maps were consistent with a further shift in the electron density of the γ-phosphate towards the Asp 351 side chain, compared with the aluminium fluoride mimic of the transition state. Otherwise there were only slight changes in the topology of the phosphorylation site, except for the disappearance of the second bound Mg2+, and a slight removal of Arg 560, with the bound dinucleotide (AMPPN), relieved from the interaction with Arg 678.
Of further interest for the understanding of the phosphorylation reaction we have found in studies of the D351A mutant (which does not hydrolyze ATP) that ATP is bound with the same characteristic bend of the triphosphate moiety as AMPPCP (Marchand et al. Reference Marchand, Lund Winther, Holm, Olesen, Montigny, Arnou, Champeil, Clausen, Vilsen, Andersen, Nissen, Jaxel, Moller and Le Maire2008). The presence of a carbon atom bridging the β- and γ-phosphate in AMPPCP thus does not affect the conformation of bound ATP. The binding region was indistinguishable from that of the wild-type, except for the replacement of Asp 351 with alanine. Furthermore, in agreement with previous studies (McIntosh et al. Reference Mcintosh, Woolley, Maclennan, Vilsen and Andersen1999; Pedersen et al. Reference Pedersen, Rasmussen and Jorgensen1996), we confirmed that the mutant binds ATP with a considerably higher affinity than the wild type, consistent with the disappearance in the mutant of opposing negative electrostatic interactions imparted by the negatively charged nucleotide phosphate and phosphorylation site in the wild-type ATPase (Marchand et al. Reference Marchand, Lund Winther, Holm, Olesen, Montigny, Arnou, Champeil, Clausen, Vilsen, Andersen, Nissen, Jaxel, Moller and Le Maire2008).
Despite the pronounced similarities in the overall structure of ATPase with bound nucleotide (Fig. 6b) and the transition state (Fig. 6c) there are distinct differences in the biochemical properties of these complexes in the native membraneous states: while the [Ca2]E1-AlF4−-ADP form stably occludes Ca2+, this is not the case for ATPase with bound AMPPCP which also, in contrast to the [Ca2]E1-AlF4−-ADP form, is susceptible to proteolytic degradation and sulfhydryl modification (Sørensen et al. Reference Sørensen, Møller and Nissen2004b) and to reaction with surface-bound antibodies. Thus, while the ATPase with bound MgAMPPCP appears to be present in the native membranes in a dynamically fluctuating state, this is not the case for the [Ca2]E1-AlF4− MgADP intermediate. As we have noted previously, global immobilization of the whole ATPase molecule is probably a necessary requirement to maintain the stringent requirements for exact positioning of the bonds in these transition state complexes (Sørensen et al. Reference Sørensen, Møller and Nissen2004b). However, it has been pointed out that at least part of these differences may be related to the differences in the properties of Ca2+-ATPase, arising from the high concentration of Ca2+ used for crystallization (Picard et al. Reference Picard, Toyoshima and Champeil2005) that result in the binding of Ca2+ instead of Mg2+ at the phosphorylation site (Picard et al. Reference Picard, Jensen, Sorensen, Champeil, Moller and Nissen2007). Nevertheless, the Ca2+-occlusion of ATPase imparted by complexation with ADP-AlF4− (Sørensen et al. Reference Sørensen, Møller and Nissen2004b; Troullier et al. Reference Troullier, Girardet and Dupont1992) or CrATP (Coan et al. Reference Coan, Ji and Amaral1994; Vilsen & Andersen, Reference Vilsen and Andersen1992) clearly single out these intermediates as stable structures where Ca2+ is not in communication with the solutions on either the cytosolic or the luminal side of the membrane.
2.3 The A domain
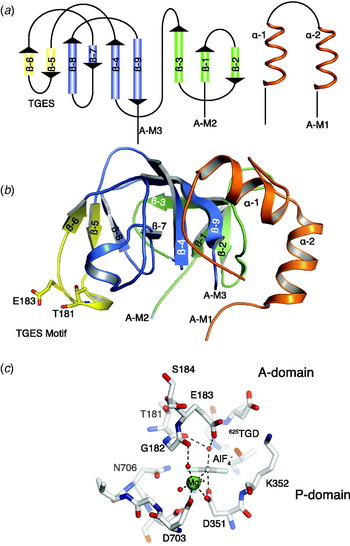
The N-terminal A- or actuator domain has been described as having a jelly-roll appearance, made up of a central part (comprising amino acid residues 122–232) and capped by the N-terminal 1–37 residues (Inesi et al. Reference Inesi, Ma, Lewis and Xu2004; Toyoshima et al. Reference Toyoshima, Nakasako, Nomura and Ogawa2000). The intervening part of the sequence (residues 38–121) forms the M1/M2 spans and their cytosolic A-M1 and A-M2 extensions. In the older literature, the A-domain is often referred to as the β- or translocation domain, due to a high predicted content of β-structure (Green & Stokes, Reference Green and Stokes1992; MacLennan et al. Reference Maclennan, Brandl, Korczak and Green1985) and suspected essential role in translocation, mainly based on proteolytic evidence (Imamura & Kawakita, Reference Imamura and Kawakita1989; le Maire et al. Reference Le Maire, Lund, Viel, Champeil and Møller1990; Møller et al. Reference Møller, Lenoir, Marchand, Montigny, Le Maire, Toyoshima, Juul and Champeil2002). As we shall see, all these designations aptly describe the structure and function of the domain. Nine, mostly antiparallel small- and medium-length β-stretches are distributed evenly over the whole central part of the domain, joined by loops and with an almost complete absence of helical structure. Conversely, the N-terminal cap (the existence of which was unknown before it was revealed by the X-ray structures) contains two helices, joined by loops, – and no β structure (Fig. 7a).
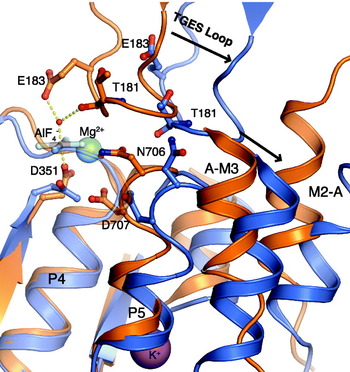
The A-domain. (a) Schematic representation showing the 9 β-strands, formed by residues 122–232 of the central part, capped by the 1–35 N-terminal residues (colored in red) with 2 helical segments. The central part is composed of an outer subdomain (green colored), and an inner (blue colored) well-conserved subdomain, with an appendage (yellow colored), carrying the catalytically important 181TGES loop. (b) The three dimensional structure of the A-domain, shown in cartoon in the E2-P transition state (pdb code 3B9R) (c) close-up view of the interaction of the TGES loop with the phosphorylation site with AlF4− mimicking the phosphate (pdb code 3B9R), coordinated by Mg2+ and a water molecule activated for SN-2 base catalysis by coordination with Glu 183 and Thr 181.

Probably, the predominant β-structure configuration combines an overall sturdy and stable structure of the A domain with local flexibility imparted by the loops and sparse helical regions for interactions of functional importance. A close inspection of the 3D structure (Fig. 7b) indicates a bipartite constitution of the domain in an inner and outer subdomain along different lines than suggested by the primary and secondary structure. The inner part starts with a 160PAD turn motif and ends at Ile 232 at a well-characterized V8 proteolytic cleavage site (le Maire et al. Reference Le Maire, Lund, Viel, Champeil and Møller1990) while the outer part is made up of residues 122–159 in addition to the N-terminal cap. The division between the outer and inner subdomains is demarcated by the last β-strand of the domain (219ALGIVAT), which like a string around a parcel slings around and demarcates the border between the outer and the inner subdomains. The inner subdomain contains the 181TGES motif essential for hydrolysis of E2P and other residues important for modulatory regulation of the dephosphorylation reaction (Section 4.2). The outer subdomain is connected with the M1 and M2 membrane pairs via the A-M1 and A-M2 linkers which, as discussed in Section 3.2, together with the C-terminal A-M3 linker are of crucial importance for the organization and open/closed state of the two intramembraneous Ca2+/H+ binding sites towards the lumen or the cytosol.
A characteristic feature of the Ca2E1 structure seems to be that the A-domain in this state only weakly interacts with the P-domain. This is unlike the situation in any nucleotide bound or phosphorylated states where the A-domain interacts with the P- and N-domain in ways that are critically important for ATP phosphorylation and dephosphorylation as well as for ion translocation. Changes in the interactions between the cytosolic domains of these forms are dependent on rotatory movements that the A domain perform during the functional cycle along the periphery of the P-domain in directions parallel and normal to the membrane. Thus, in the transition from E2 to the E1 states the A-domain rotates counterclockwise away from the phosphorylation site (Toyoshima & Nomura, Reference Toyoshima and Nomura2002) where it blocks for ATP phosphorylation of the P-domain (Jensen et al. Reference Jensen, Sorensen, Olesen, Moller and Nissen2006). The details of these processes are most appropriately postponed until section 3 for a description of the structural changes that the ATPase as a whole undergoes in relation to Ca2+ translocation and proton exchange. Instead, we consider here the involvement of the A-domain in the dephosphorylation of the ATPase in the E2P state. This occurs via an appendage (knob) on the inner subdomain of the A-domain that carries the catalytically active 181TGES motif which interacts with the phosphorylated Asp 351 residue during E2P dephosphorylation. The motif is present as a loop on top of the appendage, stabilized by two short antiparallel β-sheets (A-β5 (174–176) and A-β6 (187–188)). The details of the dephosphorylation reaction have been studied with the aid of two structures, one in which AlF4− has been complexed with ATPase in the E2 state, as a mimick of the E2P transition state (Olesen et al. Reference Olesen, Sørensen, Nielsen, Møller and Nissen2004), and another one with the ATPase complexed with MgF42−, as a mimick of the E2⋅Pi product state with non-covalent bound phosphate (Toyoshima et al. Reference Toyoshima, Nomura and Tsuda2004). As can be seen from Fig. 7c with the E2P transition state analog the TGES motif of the A-domain has moved in close apposition to the phosphorylation site. Here, the Glu 183 residue of the motif with the aid of a bridging water molecule interacts with the AlF4− group. The bridging water molecule is in position for an in-line attack by an associative SN-2 mechanism where Glu 183 acts as a general base catalyst by an abstraction of proton from the bound water molecule. This role of Glu 183 in hydrolytic dephosphorylation of E2P was confirmed by site-directed mutagenesis (Clausen et al. Reference Clausen, Vilsen, Mcintosh, Einholm and Andersen2004). Additional mutagenesis studies have also supported the decisive role of the other residues of the motif, in particular those of Thr 181 and Gly 182, in supporting the dephosphorylation reaction (Anthonisen et al. Reference Anthonisen, Clausen and Andersen2006).
In the concomitantly published studies with MgF42− as a mimick of the E2-Pi product state, the central Mg2+ ion was also found to interact with Asp 351 and Glu 183 in a similar way as AlF4− (Toyoshima et al. Reference Toyoshima, Nomura and Tsuda2004). In both cases, thapsigargin was present as a stabilizing ligand, but subsequent E2 structures of E2-AlF4− (Olesen et al. Reference Olesen, Picard, Winther, Gyrup, Morth, Oxvig, Møller and Nissen2007) and E2⋅MgF42− (Toyoshima et al. Reference Toyoshima, Norimatsu, Iwasawa, Tsuda and Ogawa2007) without thapsigargin indicates that this ligand is bound without any appreciable effect on the ATPase crystal structure.
2.4 The membraneous domain
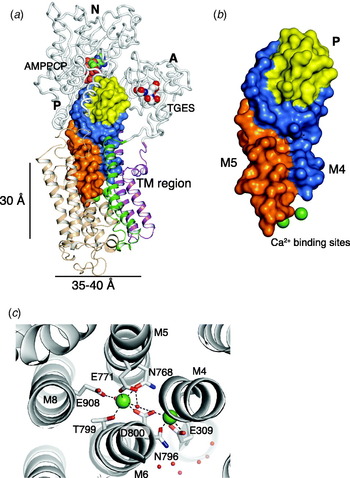
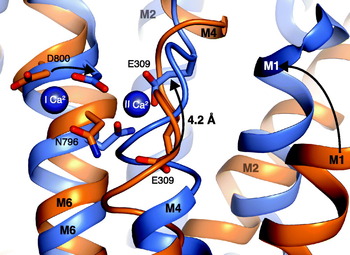
The lipid-embedded membrane domain consists of ten helical transmembrane segments (M1–M10) that together form an ellipsoidal cylindrical structure, with cross-sectional diameters ranging from about 35–40 Å and with a height of around 25–30 Å, corresponding to the distance between the cytosolic and intraluminal lipid interphases, as estimated from the location of weak electron density attributable to the phospholipid head groups, and of the tryptophan- and arginine residues clustering at the phospholipid/water interphase. The transmembrane helices can be subdivided into three subdomains: of which two are N-terminal, formed by the M1/M2 and M3/M4 transmembrane pairs, respectively, whereas the third one, M5–M10, is C-terminal and forms a closely knitted and intertwined helical bundle (Fig. 8a). In the E1 conformation, Ca2+ is bound to the ATPase at two binding sites located between the centrally located M4, M5, M6 and M8 transmembrane segments (Obara et al. Reference Obara, Miyashita, Xu, Toyoshima, Sugita, Inesi and Toyoshima2005; Toyoshima et al. Reference Toyoshima, Nakasako, Nomura and Ogawa2000). Ca2+ binding occurs by coordination with carboxylic amino acid side chains and main chain carbonyl groups (Fig. 8c), in a similar way as in watersoluble Ca2+-binding proteins such as calmodulin, troponin C and parvalbumin. At site I, Ca2+ is heptacoordinated with the carboxylic groups of Glu 771 (M5), Asp 800 (M6) and Glu-908 (M8), and with main chain carbonyl groups, located at Asp 768 (M5) and Thr 799 (M6), plus 2 H2O; and at site II with Glu 309 (bidentate coordination) and main chain carbonyl groups at Val 304, Ala 305 and Ile 307 (all located on M4) together with the carboxyl group of Asp 800 carboxyl and main chain carbonyl Asn 796 (both on M6). Here they are placed in two cavities surrounded in a cage-like structure by a network of hydrogen bonds with amino acid residues and some bound water molecules, and cooperating via Asp 800 that is bound to both Ca2+ ions (Obara et al. Reference Obara, Miyashita, Xu, Toyoshima, Sugita, Inesi and Toyoshima2005; Toyoshima et al. Reference Toyoshima, Nakasako, Nomura and Ogawa2000). Overall, the two bound Ca2+ ions, coordinated with four carboxyl groups in their unprotonated state can be considered to form an electroneutral complex inside the membrane environment, before translocation to the other side of the membrane.
The Central Core and the intramembranous Ca2+ binding sites. (a) Overall representation of SERCA in cartoon and ribbon, with the central core ‘domain’ shown in surface representation, with M4 and M5 (the spine) colored in blue and orange, respectively, and the C-terminal part of the phosphorylation domain in yellow. M1–M2 colored purple, M3–M4 green and M6–10 in wheat. The Ca2+ ions are shown in green spacefilling. AMPPCP and the TGES motif are shown in spacefilling. (b) The isolated Central Core-domain as shown in (a) emphasizing the closed structure formed by the three components and clear connection between the cation binding sites and the phosphorylation site. (c) Close-up view of the Ca2+ binding sites between M4, M5, M6 and M8 helices and with key coordinating side chain residues shown in sticks. Water molecules are shown in red spacefilling. Figs 8a–c are based on the [Ca2]E1:AMPPCP structure (pdb code 1T5S).

The close topological relation between the two bound Ca2+, and their interconnection via a common coordinating carboxylate residue (Asp 800) raise intriguing questions concerning cooperativity (Forge et al. Reference Forge, Mintz and Guillain1993; de Foresta et al. Reference De Foresta, Henao and Champeil1994; Inesi et al. Reference Inesi, Kurzmack, Coan and Lewis1980), as well as their sequential binding (Orlowski & Champeil, Reference Orlowski and Champeil1991a), and their release on the other side of the membrane as discussed in section 3.2. For accurate positioning of the liganding residues with respect to the binding of Ca2+ the helical structure of the involved transmembrane segments is unwound, corresponding to the location of the liganding residues around the Glu 309, Glu 771 and Asp 800 residues. In particular, M4 is kinked at a conserved proline residue found in all P-type ATPases (Axelsen & Palmgren, Reference Axelsen and Palmgren1998; Møller et al. Reference Møller, Juul and Le Maire1996). These helical interruptions, so-called Schellman motifs and their dynamic properties were first detected by NMR structural analysis of synthetic transmembrane peptides of M6 (Soulie et al. Reference Soulie, Neumann, Berthomieu, Moller, Le Maire and Forge1999) and M5 (Nielsen et al. Reference Nielsen, Malmendal, Meissner, Moller and Nielsen2003). As a result of the possibilities for bending and rotation of the amino acid chains provided by these motifs they easily adjust the position of ligating groups to optimize Ca2+ binding, a process with profound consequences for the conformational changes and energetic aspects associated with ion translocation across the membrane (sections 3 and 5).
2.5 Central core: the ‘Fifth’ ATPase domain
As the central core (Fig. 8 a, b), we define a confluent peptide mass formed by the interaction of different parts of the Ca2+-ATPase polypeptide chain originating from (i) the cytosolic extension of M4, stretching from the Ca2+ binding site II (Glu 309) to the phosphorylation site (Asp 351). (ii) The cytosolic extension of M5 that as a curved helical ‘spine’ stretches from the Ca2+-binding site I (Glu 770) to the C-terminal end of the P-domain. (iii) The C-terminal part of the P-domain (residues 699–739) with the long (699–721) signature sequence diagnostic of P-type ATPases). The latter part is lodged between the upper parts of (i) and (ii), while the cytosolic extensions of M4 and M5 are closely intertwined during the first part of their course from the two Ca2+-binding sites in the membrane. The central core forms the communication between the cation-binding and phosphorylation sites; it comprises those parts of the ATPases that are most highly conserved, between P-type ATPases in general (Møller et al. Reference Møller, Juul and Le Maire1996). All the Ca2+-ATPase structures available demonstrate that this collection of amino acid residues, regardless of the conformational change they undergo during transport, remain closely together in Van der Waals contact, forming what appears to be a plastic mass that can be molded in various ways during transport. Despite the overlap with especially the P-domain this mass of polypeptide can therefore be considered to have the status of a separate domain, subserving the communication between phosphorylation and the membranous Ca2+-binding sites. When Ca2+ is bound at sites I and II, signals are transmitted to the catalytic site, enabling Asp 351 to become phosphorylated, not only by ATP, but also by a number of other high-energy phosphate compounds such as acetylphosphate and creatine phosphate. When the ATPase has become phosphorylated by ATP, signals transmitted through the central core to the membrane to induce translocation of the intramembranously bound Ca2+ ions. How this occurs is unknown; Scarborough (Reference Scarborough2002) has suggested that of a charge-relay system is involved, mainly operating via the peptide backbones that connect the Ca2+-binding sites and the phosphorylation site. The importance of the central core for ATPase structure and Ca2+ translocation is indicated by the fact that proteolytic cleavage in the region leads to inactivation and reduces the binding affinity for Ca2+ from the μmolar to the millimolar level (Juul et al. Reference Juul, Turc, Durand, Gomez De Gracia, Denoroy, Moller, Champeil and Le Maire1995). But consistent with the role of non-polar, non-directional interactions in holding the region together, even extensive mutations of the cytosolar extensions, linking the Ca2+-binding and phosphorylation sites together, can generally be tolerated without the loss of function (Garnett et al. Reference Garnett, Sumbilla, Belda, Chen and Inesi1996; Sørensen & Andersen, Reference Sørensen and Andersen2000), except for those parts that are located close to the M4 (Vilsen et al. Reference Vilsen, Andersen and Maclennan1991) and M5 (Andersen, Reference Andersen1995b) cytosolar/membrane border and submerged into the membrane phase during Ca2+ translocation. How this occurs is central for the description of the whole transport cycle, but requires a comprehensive view on the whole transport process which is the subject of the next part of the review.
3. Structural aspects of the Ca2+ transport Mechanism
3.1 The Ca2+ and ATP-Induced E2→E1P transition
In the preceding section, we have considered the specific properties of each of the ATPase domains, and we are now ready to discuss how these are assembled to form an ATP-driven Ca2+-pump in exchange with protons. Referring back to the reaction scheme shown in Fig. 1, we start a guided tour around the cycle from the upper left corner of Fig. 1 with the ATPase in the unphosphorylated, but the ATP-bound E2 state. In the first reaction, this form is activated by the binding of 2 Ca2+ ions in a process facilitated by modulatory bound ATP (Scofano et al. Reference Scofano, Vieyra and De Meis1979; Stahl & Jencks, Reference Stahl and Jencks1984; Wakabayashi et al. Reference Wakabayashi, Ogurusu and Shigekawa1986). The details of this reaction were already described in section 2.2 on the basis of the crystal structures of Ca2+-ATPase with bound AMPPCP and by Ca2+-ATPase cocrystallized with AMPPCP and Ca2+. In the E2-AMPPCP structure, the A-domain is rotated towards the phosphorylation site, to interact with both the P- and N-domains (Fig. 9a). For the formation of this A–P–N complex, mutational data combined with structure-based interpretations have suggested a central role of a cluster of hydrophobic amino acid residues, surrounding Tyr 122 at the base of the A-domain (Wang et al. Reference Wang, Yamasaki, Daiho and Suzuki2005; Yamasaki et al. Reference Yamasaki, Wang, Daiho, Danko and Suzuki2008): these residues, in addition to Tyr 122 and Ile 119, which are linked to A-M2, include Ile 232 (linked to A-M3), together with Ile 179, Leu 180, located at the base of the TGES loop, interacting with Val 705 and Val 726 from the P-II-subdomain. There are also interactions between residues located in the C-terminal (188–205) end of the A-domain with the side chains of 579DDSS, Glu 486 and Arg 489 of the N-domain. These A–P–N interactions encircle the 181TGES loop and prevent it from coming into close interaction with the phosphorylation site. They also make the N-domain incline towards the A-domain, movements that are made possible by the bending of both the long cytosolic extension of M5 (the ‘spine’ of the ATPase structure) and the hinge linking the N-domain to the P-domain.
The Ca2+ and ATP induced E2→E1P Transition. (a, d) The E2:AMPPCP state (pdb 2C88); (b, e) the Ca2E–P state (pdb 3BA6); (c, f) the nucleotide free Ca2E1 state (pdb 1SU4). (a–c) Show close-up views of the cytoplasmic domains in cartoon representation with the N, A and P domain colored red, yellow and marine, respectively. The TGES motif is shown as yellow sticks and nucleotide with sticks, colored as in Fig. 3. (d–f) Overall cartoon representation with helices M1, M2, M3–M4 and M5–M6 are shown in surface representation colored orange, magenta, wheat, and green, respectively. Notice how the binding of a nucleotide preserves a tight packing of the cytoplasmic domains and maintains the M1 kink, resulting in an N-terminal ‘window’ for the entrance of Ca2+ to binding site(s) in the E2 state (d) that closes after the Ca2-induced formation of the E1 state (e), but where the Ca2+ binding sites remain accessible in the Ca2E1 conformation, without bound nucleotide (f).

Inside the E2-AMPPCP structure the nucleotide is present, as previously described and shown in Fig. 6a with the adenosyl moiety bound to the N-domain (section 2.1) and with the γ-phosphate interacting with Thr 625 and Gly 626 of the TGD motif of the P-domain, Arg 678 and, via Mg2+, with Glu 439 of the N-domain. At this stage, the γ-phosphate is still far removed (by about 9–10 Å) from the carboxylate group of the phosphorylatable Asp 351, but close to the opening which, as explained in section 2.2, encapsulates this residue between the two hemispheres of the P-domain. The further approach of the γ-group towards Asp 351 requires activation by Ca2+, following the intramembranous binding of the two Ca2+ ions. The considerable stabilization of the ATPase structure gained by accurate positioning of the Ca2+ for coordination with the liganding amino acid residues in M4–M6 and M8 helices not only accounts for the high affinity with which Ca2+ is bound, but also results in rotatory and translatory movements of the adjoining transmembrane helical segments that are transmitted to the cytosolic extensions of M4 and M5 (the central core). As suggested by the mutational data, there are also interactions with the A-M3 linker (Clausen & Andersen, Reference Clausen and Andersen2004) and, possibly, also with the L6–7 cytosolic loop (Zhang et al. Reference Zhang, Lewis, Sumbilla, Inesi and Toyoshima2001). In particular, the changes that occur in the M1–M4 region where Ca2+ is bound at site II, appear to be important: they lead to an upward translational and rotational shift of the region, as revealed by superimposition of the E2-AMPPCP structure with the Ca2E1-AMPPCP structure (Fig. 8). These movements, including a ~20° kink of the M4 helix towards the N-terminal side (Jensen et al. Reference Jensen, Sorensen, Olesen, Moller and Nissen2006), are produced as the result of adjustments required for binding of Ca2+ with a high affinity inside the membrane, and it leads to the dislodgement of the A-domain from its nested accommodation between the P- and N-domains (Fig. 9a). This paves the way for the N-domain with bound nucleotide to approach the P-domain to form in a series of smooth transitions the phosphorylated [Ca2]E1~P intermediate (Fig. 9b) as described in detail in section 2.2.
In the absence of bound nucleotide, Ca2+-activation of E2 leads to the formation of Ca2E1, where the A-domain is also disengaged from its binding interactions near the phosphorylation site (Fig. 9c). This leads to counterclockwise rotation of the A-domain around the P-domain to form an open structure with little interaction between the cytosolic P-, N- and A-domains (Toyoshima et al. Reference Toyoshima, Nakasako, Nomura and Ogawa2000; Toyoshima & Nomura, Reference Toyoshima and Nomura2002). In this structure, the absence of the strains, imposed by the bound nucleotide in the E2-ATP conformation, leaves these domains with more degrees of freedom than in the compact conformation where the N-domain is bound to the P-domain as the result of bending of the helical cytosolic part of M5 (the ‘spine' of the ATPase structure) and the hinge region between the P- and N-domains. While this explains the basis for the open structure of the Ca2E1 conformation, it leaves us with the important question as to the basis for the loosening of the interaction between the cytosolic domains, and especially that of the A-domain, that accompany the binding of Ca2+. The simplest explanation is that the open Ca2E1 form, with minimal domain interaction, represents the less strained and hence more stable form of the protein, in agreement with experimental evidence such as the increased thermostability of Ca2E1 (Lepock et al. Reference Lepock, Rodahl, Zhang, Heynen, Waters and Cheng1990; Merino et al. Reference Merino, Moller and Gutierrez-Merino1994), compared to the E2 state, and resistance against inactivation after detergent solubilization (Lund et al. Reference Lund, Orlowski, De Foresta, Champeil, Le Maire and Moller1989; McIntosh & Ross, Reference Mcintosh and Ross1985). As evidence for the loose attachment of the A- domain to the P-domain we have found that, depending on the crystal forms and crystallization conditions, the exact position of the A-domain in the Ca2E1 structure, relative to that of the P-domain, is variable (PDB entry code 2C9M). As will be apparent from the following section, to form the E2 conformation from Ca2E1 by a clockwise rotation of the A-domain around the P-domain induces strains in the adjoining linkers to the M1–M3 transmembrane segments, the stabilization of which requires the above-mentioned interactions of the A-domain with the P- and N-domains. We may therefore consider the E2 conformation to be in a delicately poised equilibrium state between stabilization and destabilization that is easily disrupted by the transmembrane binding of Ca2+. These aspects are treated more quantitatively in the thermodynamic analysis of the transport cycle given in section 5.
Conformational changes of transmembrane segments M1, M2, M4, and M6 upon Ca2+ binding to nucleotide bound ATPase. Structural alignment of the E2:AMPPCP state (pdb 2C88 shown in orange cartoon) and Ca2E1:AMPPCP (pdb 1T5T shown in marine cartoon) using the N-terminal 750–994 residues. Selected Ca2+ ion ligating residues represented in sticks and the Ca2+ ions represented in blue spacefilling. The movement of sidechains and helices upon Ca2+ binding are indicated with arrows and with approximate distances. Especially, note the 4 Å vertical elevation of the M4 helix with the important Glu 309 residue, that may function as a gating residue.

During the activation of E2-nucleotide with Ca2+, the P-domain as the result of the disrupted interaction with the A-domain, is raised towards a more upright position with respect to the membrane, resulting in a better accommodation with the N-domain, which so to say ‘sits’ on the P-domain. Interestingly, this configuration creates a new binding site for the A-domain in a notch formed between the N-domain and the P-domain in the upper part of the Ca2+-ATPase structure (Fig. 9b). This binding site is located higher up in the ATPase structure (more removed from the membrane) in a position which requires anticlockwise rotations of the A-domain around axes both parallel and perpendicular to the membrane (Sørensen et al. Reference Sørensen, Møller and Nissen2004b; Toyoshima & Mizutani, Reference Toyoshima and Mizutani2004). As a result of these movements of the A-domain, also the amphipathic N-terminal kink of M1 (consisting of amino acid residues 50–60) lying flat on the membrane lipid interphase (Fig. 9d) and the cytosolic extensions of the M3 are pressed against each other (Fig. 9e), narrowing the N-terminal ‘window’ for the putative entrance of Ca2+ that is present between A-M1, A-M2 and A-M3 in the E2 state (Toyoshima & Nomura, Reference Toyoshima and Nomura2002). The situation is quite different in the Ca2E1 structure (Fig. 9f). Here, the N-terminal M1 kink is not present; instead M1 forms a straight helix, running alongside M2 through the membrane. Presumably this leaves enough clearance for entrance of Ca2+ to Glu-309 at site II (Sørensen et al. Reference Sørensen, Møller and Nissen2004b) even though a major part of the slit between the two helices is submerged into the membrane. Consistent with these structural differences binding and dissociation of Ca2+ from the ATPase are readily reversible processes, whereas the Ca2+ is occluded in the phosphorylated as well as in the Ca2E1–AlF4−–ADP transition state.
Assuming an N-terminal ‘window’ of E2-ATP serving as the entrance for the membraneous binding of cytosolic Ca2+ structural relations of the M1-kink become important in relation to the phosphorylation-dependent Ca2+ occlusion. As explained above the N-terminal entrance is narrow or obliterated under these conditions (Fig. 9b). Furthermore, in the Ca2E1–AlF4−–ADP transition state this configuration can be seen to lead to a concaternation of hydrophobic amino residues below the M1 kink that obstructs the interaction between the cytosolic Ca2+ and Glu 309 of the Ca2+-binding PEGL motif at site II (Sørensen et al. Reference Sørensen, Møller and Nissen2004b). On the basis of a detailed mutation study, Leu 65 seems to be of particular importance, possibly by immobilizing Glu 309 and adapt it for ligation of the incoming Ca2+ (Einholm et al. Reference Einholm, Andersen and Vilsen2007). This, and other mutational evidence for occlusion has been fully confirmed by studies on the Ca2+ release from non-crystalline complexes of Ca2+-ATPase with ADP–AlF4−, but not from Ca2+-ATPase membranes with bound Ca2+ and AMPPCP with an almost identical crystal structure (Sørensen et al. Reference Sørensen, Møller and Nissen2004b). However, as previously noted (section 2.2) the non-crystalline preparations differ significantly from each other with respect to their dynamic properties: compared to the complex of ATPase with ADP–AlF4−, the preparation with bound Ca2+ and AMPPCP is more susceptible to proteolytic degradation, is immunoreactive, and reacts readily with cysteine modifying reagents, provided that the high concentrations of Ca2+ used for crystallization are avoided (Picard et al. Reference Picard, Toyoshima and Champeil2005; Sørensen et al. Reference Sørensen, Møller and Nissen2004b). This is probably the result of rapid fluctuations in these non-crystalline preparations with bound nucleotide between a number of subconformations, that open up for the passage for the uptake and release of Ca2+ in the unphosphorylated, but nucleotide bound ATPase.
3.2 The Ca2E1–P to E2P transition
The Ca2E1–P to E2P transition is a step of decisive importance in the Ca2+-transport cycle: during this step, the ATPase is transformed from an ADP-sensitive to an ADP-insensitive phosphorylated intermediate and intramembraneously bound Ca2+ is translocated across the membrane and exposed towards the luminal side. Structural information as to how this occurs was until recently lacking. Before we are engaged in this subject, let us try to briefly summarize the situation as it appeared to us at the end of the year 2004 at the time when we had published our paper on the E2–AlF4−(Tg) structure (Olesen et al. Reference Olesen, Sørensen, Nielsen, Møller and Nissen2004). At that point, the structures of three unphosphorylated intermediates were known (viz. E2 with bound thapsigargin, Ca2E1 and Ca2E1-AMPPCP) along with three representatives of phosphorylated ATPase intermediates (Ca2E1–ADP-AlF4−, E2–AlF4−(Tg) and E2–MgF42−(Tg)). When viewing these structures in profile it was obvious that the three parts of the transmembrane domain, comprising the M1/M2 and M3/M4 pairs together with the M5–M10 complex, were all closely adjoined in their membraneous parts, irrespective of the pronounced differences that characterize their cytosolic parts. Towards the cytosolic side, one could in the E1 structures (Fig. 11) see the binding region for the two Ca2+ ions and their coordination with the side chains of the four ligating acidic amino acid residues (Glu 309, Glu 771, Asp 800 and Glu 908) and with the main chain groups of the other residues critical for coordination of Ca2+. Towards the luminal side, the hydrophilic loop regions connecting the transmembrane sections formed a channel shaped structure bearing striking semblance to the access channel which from electrophysiological experiments had been predicted to be present in Na+, K+-ATPase (Gadsby et al. Reference Gadsby, Rakowski and De Weer1993; Läuger, Reference Läuger1991). The apex of the access channel ended at Glu 785 of the PEAL hairpin that forms the intramembranous connection between M5 and M6 in SERCA. In between there was a region corresponding to roughly one-third of the membrane thickness which consisted of what appeared to be an impenetrable layer of hydrophobic amino acid residues in Van der Waal's contact. Using M5 as a ruler of membrane depth the hydrophobic layer stretches from Glu 785 to Glu 771, the most deeply seated acidic aminoacid residue involved in Ca2+ binding on the cytosolic side. It seemed clear to us that for Ca2+ translocation to occur this barrier had to be broken by the formation of a new structure of the membranous domain. Based on these structures, the requirements for a mimick of a ‘genuine’ E2P intermediate, representative of a state where Ca2+ had been translocated across the membrane were clear. In an important paper, Danko et al. (Reference Danko, Yamasaki, Daiho and Suzuki2004) had shown that the complex of ATPase with BeF3− had the properties expected for an intermediate with intramembraneous binding sites directed towards the luminal space: thus, as is the case when E2P is formed from E2 and inorganic phosphate, the interaction with BeF3 gave rise to an increase in intrinsic (tryptophan) fluorescence and superfluorescence when the reaction was monitored with bound trinitrophenylated AMP, a procedure often used as a convenient spectroscopic procedure to follow E1P/E2P interconversions in kinetic experiments (Andersen et al. Reference Andersen, Jorgensen and Moller1985a; Dupont & Pougeois, Reference Dupont and Pougeois1983; Nakamoto & Inesi, Reference Nakamoto and Inesi1984). Furthermore, in contrast to the complex that the E2-ATPase forms with AlF4−, the complex with BeF3− could be readily reactivated by Ca2+, but in intact SR vesicles that required the aid of ionophore to present Ca2+ to the luminal side of the ATPase. However, the observation of these properties required that they were undertaken in the absence of thapsigargin which, by stabilizing the ATPase in the E2:Pi product state, inhibits stabilization of the covalent bond between Asp 351 and phosphate (Seekoe et al. Reference Seekoe, Peall and Mcintosh2001). So, the task was to prepare crystals of ATPase with BeF3− in the absence of thapsigargin or other stabilizing inhibitors (such as cyclopiazonic acid or BHQ) of the ATPase in the E2 state. Eventually, with proper modifications of the usual crystallization procedures small single crystals were obtained from which the E2 structure of ATPase complexed with BeF3− was obtained (Olesen et al. Reference Olesen, Picard, Winther, Gyrup, Morth, Oxvig, Møller and Nissen2007). Surprisingly, the structure of the E2-BeF3− complex, determined at 2·65 Å resolution, showed that the compact organization of the membranous domain had changed into a trilobed structure (Fig. 12a). This was the result of lateral and rotational movements of the M1/M2 and M3/M4 pairs, relative to that of the M5–M10 complex, which resulted in the formation of an enlarged luminal access channel opening directly into the Ca2+ binding region. The channel was approx 15 Å wide at the base and at the apex it tapered into a width of 4 Å that was lined by three of the residues participating in the ligation of Ca2+ in the E1 structures (Glu 309, Asn 796 and Glu 771). Additional electron density matched an Mg2+ ion (Fig. 12b) interacting with Glu 309 and Glu 90. As shown in Fig. 12b, this change in the configuration of the residues interacting with Ca2+ in the E1 conformations had become possible, mainly because Glu 309, as the result of a translational and rotational movement of M4 in the luminal direction, and of Asn 796 by rotation of M6 in a counterclockwise direction had assumed positions close to Glu 771, while Asp 800, together with Thr 799, by the same movement of M6, had been rotated away from the central and Ca2+-binding positions that they have in the E1 conformations. On the other hand, as can also be seen from Fig. 12b, Glu 771 together with Asn 768 and Glu 908, had retained their original positions within the M5–M10 complex. It seems logical to assume that during the E1P to E2P transition Ca2+ bound at site II would follow Glu 309 and join with Ca2+ at site I that now is bound by Glu 771 and Asn 796. Thus it would appear that this triad of amino acids residues forms a new and luminally oriented Ca2+ binding region, from which Ca2+ can be released after the formation of the trilobed luminal channel. In accordance with this suggestion, the presence of Mg2+ in our structure, which we attribute to the high concentration (50 mM) in the crystallization medium, recalls previous functional results suggesting that high concentrations of Mg2+ can function as a competitive inhibitor of Ca2+ at the transport sites (Bishop & Al-Shawi, Reference Bishop and Al-Shawi1988; Scofano & De Meis, Reference Scofano and De Meis1981).
The massive barrier separating the cation binding sites from the lumen is shown in cartoon (3BA6) with the same color code as in Fig. 2. The compact arrangement of the helices in the transmembrane region between the Ca2+ binding sites and the small luminal access channel ending at Pro 784 and Glu 785 of the L5–6 intramembranous (PEAL) loop and at Tyr 294 of the M4 are shown in spacefilling with blue and red coloring.

Luminal opening of the transmembrane helices in the E2P ground state (a) Overall sideview of the Ca2+-ATPase showing the luminal opening between the M1–2 and M3–4 and M5–10 helices, as represented by the E2P–BeF3− structure (pdb 3B9B), shown in surface transparence and cartoon in the same way as in Fig. 3. (b) Close-up view of the cation binding sites with superpositioning of the E1~P:AMPPNP structure, with bound Ca2+, shown in yellow, on to the E2P (BeF3−) structure, with bound Mg2+, shown in purple. The stable M7–M10 region of [Ca2]E1~P:AMPPN (pdb 3B6A) and of E2P-BeF3− were used as the basis for the superpositioning of the two structures. Changes in the position of the liganding groups when proceeding from the E1 to the E2 state are indicated by arrows. (c) Stereoview showing the wide luminal opening between the N- and C-terminal transmembrane helices in the E2-BeF3− structure, leading to Asn 796 (green) flanked by Glu 309 and Glu 771 at the bottom of the opening.

The events leading to luminal release of Ca2+ correspond to steps 4 and 5 in the Fig. 1 reaction scheme, i.e. the [Ca2]E1~P→E2P transition is considered to take place in two separate steps with the intermediary formation of an occluded [Ca2]E2-P intermediate followed by channel opening. The reason to consider the existence of two separate steps in part stems from mutational data on A-M1 mutants (Daiho et al. Reference Daiho, Yamasaki, Danko and Suzuki2007), but it is also based on the fact that the Glu 309, Asn 796 and Glu 771 triad represents a rather stable configuration that is common to all E2 structures, not only of the E2–BeF3− structure described here, but also of the closed E2 structures, encompassing the E2–P–AlF4− transition state (Olesen et al. Reference Olesen, Picard, Winther, Gyrup, Morth, Oxvig, Møller and Nissen2007), and the E2:Pi product states (Toyoshima et al. Reference Toyoshima, Nomura and Tsuda2004), where occluded protons must be present in lieu of Ca2+ to provide a charge compensation of the intramembraneously buried carboxylate groups. Interestingly, exactly the same residues proposed here to be involved in the luminal binding of Ca2+ with low affinity and released by exchange with protons were pointed out already long ago in mutational studies as potential H+ binding residues for Ca2+/H+ exchange in Ca2+-ATPase (Andersen, Reference Andersen1995a) and for Na+/K+ exchange by homologous residues in Na+, K+-ATPase (Vilsen & Andersen, Reference Vilsen and Andersen1998).
In a study by Toyoshima et al. bearing on the same issues (Toyoshima et al. Reference Toyoshima, Norimatsu, Iwasawa, Tsuda and Ogawa2007) three E2 structures were presented and compared. These were: E2-AlF4− (Tg), solved at 2·4 Å resolution; E2–BeF3 (Tg), solved at 2·4 Å resolution, and E2–BeF3, prepared without bound inhibitor as in our study, and solved at 3·8 Å resolution. There were only modest differences between the three structures; they were all, including E2–BeF3−, present in compact E2 forms with clockwise rotations of the A-domain. Compared to the Ca2E1–ADP–AlF4− structure the rotation had, as previously noted for E2–MgF42− (Tg) as a representative of the E2:Pi product complex of dephosphorylation (Toyoshima et al. Reference Toyoshima, Nomura and Tsuda2004), led to a 5–6 Å insertion of M4 and a slight withdrawal of the luminal half of M4 from the tight contact that it has with M6 in the Ca2E1–ADP–AlF4− structure. This had previously led to the suggestion that under proper conditions this configuration would have the potential to serve as the passageway for Ca2+ during the E1P to E2P transition (Toyoshima et al. Reference Toyoshima, Nomura and Tsuda2004). Comparing the three new structures, it was noted that the distance between M4 and M6 had been slightly widened in the E2–BeF3− structure without bound thapsigargin to such as extent that it could be suggested to serve as a narrow channel for passage of Ca2+ and release to the luminal space.
We are thus confronted with two different models of Ca2+ translocation. On the basis of our E2–BeF3− structure the E1P to E2P transitions is accompanied by a wide opening of the luminal half of the membrane, while this is not evident from the study of Toyoshima et al. (Reference Toyoshima, Norimatsu, Iwasawa, Tsuda and Ogawa2007). Which one of these proposals is the correct one? The situation calls for a consideration of at least two questions, one of a more immediate concern, and one of a more principle nature. The first question concerns the basis for the difference between the two crystal structures. This is relatively easy to answer: in our structure, the A-domain is rotated 120° with respect to the [Ca2]E1–ADP–AlF4− form, whereas in Toyoshima et al. E2–BeF3−(Tg) was only rotated 90°, less than the 105° required for the E2 AlF4−(Tg) form. As a consequence, the A-domain in our structure, via its linkers with the membrane, will exert a stronger drag on the N-terminal membrane segments, leading to the spreading of the M1/M2 and M3/M4 pairs, while this will not be the case for the structure observed by Toyoshima et al. (Reference Toyoshima, Norimatsu, Iwasawa, Tsuda and Ogawa2007). The second question is based on the fact that most of the structures with which we are concerned here use mimicks or substrate analogs of the physiological substrate to stabilize the membrane protein within the constraints of a crystal lattice in forms that reflect well-defined functional states. We cannot know a priori to what extent this ideal situation is fulfilled. We previously encountered an example where the protein structure of two different intermediary states were virtually identical, viz. that of the Ca2E1:AMPPCP and [Ca2]E1–ADP–AlF4−, although the biochemical evidence pointed to some differences between the two forms. Here, we are in a situation where subtle differences in the crystallization conditions have apparently led to the formation of crystals with different diffraction patterns and hence deducted structures. The situation is unique in the sense that otherwise, as far as we know, there have not been major discrepancies between the data obtained by the two main laboratories involved in the clarification of 3D structures of Ca2+-ATPase, although structural interpretations sometimes have diverged. The way forward is twofold: one calls for continued crystallization studies to pinpoint as accurately as possible the conditions that lead to stabilization of the precarious E2–BeF3− form in a physiologically relevant E2P ground state. In our case, we suspect that the presence of a high (50 mM) Mg2+ concentration, leading to ATPase cocrystallization with a large and hydrated divalent cation like Mg2+, has been instrumental for stabilization of channel opening. Other important effects of a high concentration of Mg2+ have been highlighted by Danko et al. (Reference Danko, Daiho, Yamasaki, Liu and Suzuki2009) so that in the presence of Ca2+ and 15 mM Mg2+ it is possible to prepare ATPase-BeF3− intermediates with biochemical properties, including ADP sensitivity, similar to those of [Ca2]E1–P and [Ca2]E2P. Thus, BeF3− emerges as a versatile and potentially very useful mimick of the different phosphorylated intermediates of Ca2+-ATPase.
Another way to approach the consistency of the X-ray data with physiological structures is to consider them in relation to structural and functional data obtained by other techniques. In the present case, there is much evidence coming from proteolytic cleavage and mutation experiments to indicate the critical involvement of intact A–M linkers for the ATPase in the E1P/E2P/E2 transitions. Particularly interesting are the data obtained with the deletion and insertion mutants of ATPase: thus deletion of one or two residues from the A–M1 linker was found to block the E1P to E2P transitions (Daiho et al. Reference Daiho, Yamasaki, Wang, Danko, Iizuka and Suzuki2003), whereas the insertion of two Gly residues stabilized the formation and inhibited the dephosphorylation of the E2P intermediate (Daiho et al. Reference Daiho, Yamasaki, Danko and Suzuki2007). These results suggest that an appropriate length of the A–M1 linker for the A-domain is essential, not only for reaching the binding site between the N- and the P-domains to exert a sufficient pull on the N-terminal transmembrane segments, but also that an appropriate tightness of the linker is required to direct the TGES loop towards the aspartylphosphorylated residue in the following dephosphorylation reaction. The inhibitory effect of proteolytic cleavage of A–M3 on E2P formation (Møller et al. Reference Møller, Lenoir, Marchand, Montigny, Le Maire, Toyoshima, Juul and Champeil2002) and A–M2 on E2P dephosphorylation (Lenoir et al. Reference Lenoir, Picard, Gauron, Montigny, Le Marechal, Falson, Le Maire, Moller and Champeil2004) as well as the inhibitory effect of insertional mutants of A–M3 on E2P dephosphorylation (Holdensen & Andersen, Reference Holdensen and Andersen2009) also attest to the critical role of these linkers in the Ca2+ translocation and E2P dephosphorylation processes.
3.3 Dephosphorylation and proton countertransport
After delivery of the translocated Ca2+ to the lumen the Ca2+-ATPase pump is reset to the E1 state by a series of reversals leading to E2P dephosphorylation and proton countertransport (reactions 5–6 in Fig. 1). In structural terms, these events can be described as channel closure after the protonation of carboxylate groups to partially compensate for the negative charge resulting from the luminal release of the two transported Ca2+ ions. This leads to a proton-occluded state during which the enzyme becomes dephosphorylated by hydrolytic cleavage as described in section 2.3 after docking of the TGES loop of the A-domain into the phosphorylation site. This docking of the TGES loop is the result of intense interactions between the A- and P-domains, assisted by the A–M2 and A–M3 linkers which form a helical bundle with the three C-terminal helices of the P-domain (Fig. 13). At the base of the bundle, there is a monovalent cation (K+) binding site that stabilizes the bundle and thereby facilitates the E2P dephosphorylation reaction (Sørensen et al. Reference Sørensen, Clausen, Jensen, Vilsen, Moller, Andersen and Nissen2004a). In all the E2P states, the ribosylphosphate moiety of the modulatory bound ATP is displaced from the P-domain to interact with the A-domain (Olesen et al. Reference Olesen, Sørensen, Nielsen, Møller and Nissen2004; Toyoshima et al. Reference Toyoshima, Nomura and Tsuda2004), an association that like the binding of K+ also leads to a modulatory acceleration of the dephosphorylation rate as discussed in detail in section 4.2.
The relaxation of the P and A-domain and their interactions following dephosphorylation. Structural alignment using the 330–350 aminoacid segment on all Cα positions of E2-P(AlF4−):AMPPCP (pdb 3B9R) and E2:AMPPCP (Tg) (pdb 2C88) shown in orange and marine cartoon, respectively. Notice how the TGES loop and P-α5 segment with Asp 707 and Asn 706 ‘disengages’ from the phosphorylation site after dephosphorylation. Key residues shown in stick and ball with oxygens and nitrogens in red and blue, respectively. AlF4− shown in stick and ball with Al in gray and F in cyan. Mg2+ and K+ ions shown as green and magenta spacefillings. The P-α4 helix is shown as transparent cartoon for a better view of the residues interacting with the phosphorylation site.

After E2P hydrolysis the above-mentioned interactions are weakened or disrupted, and the ATPase assumes a more relaxed state, resulting in retraction of the TGES loop from the phosphorylation site (Fig. 13). This leaves enough room for liberation of the bound phosphate from E2:Pi and allows the ribosylphosphate moiety of the modulatory bound nucleotide to switch back from the A-domain to resume the interaction with residues on the periphery of the P-domain as shown in Fig. 6a. It is of note that during these transitions the configuration and position of the Ca2+ binding residues in the M4–6 and M8 transmembrane helices remain unchanged from what they are in the Ca2+ depleted E2P ground state (Fig. 12b). Thus, like the rotation of the A-domain towards the P-domain is a key feature of the E2 state, the particular configuration of the Ca2+ liganding residues in the E2 state is diagnostic of their position in the Ca2+ free and partially protonated E2 form, regardless of the changes in luminal and cytosolic exposure or occlusion associated with these states. The conformation is not changed until after the binding of Ca2+ and formation of the Ca2E1 state by a reversal of the changes occurring during the [Ca2+]-E1~P→E2P transition, i.e. M3/M4 with Glu 309 is rotated counterclockwise and translationally (5–6 Å) elevated, while M6 is rotated in the opposite direction bringing the Ca2+ liganding residues Asp 800, Asn 796 and Thr 799 in position for coordination with Ca2+. At the same time, the A-domain is dislodged from the interaction with the phosphorylation site and moves anticlockwise like M4, to complete the change in conformational state from E2 to E1. As was discussed in section 3.1, a likely Ca2+ entrance port in the E2 conformation leading to Glu 309 is present at the N-terminal end of the ATPase between the M1/M2 and M3 transmembrane segments. According to a widely accepted scheme binding of the Ca2+ ions occurs stepwise through this entrance in a number of steps by which the first admitted ion initially is bound at site II, and from there passes on to binding site I, followed by the admittance of another Ca2+ ion, which then is bound cooperatively at site II (Lee & East, Reference Lee and East2001). After binding of the first Ca2+ the ATPase is still in an E2 state, as evidenced by the fact that this form can be phosphorylated by inorganic phosphate (Andersen, Reference Andersen1995a), while binding of two Ca2+ ions is required to form the E1 conformation capable of performing ATP-dependent phosphorylation. This consecutive binding scheme explains the fact (as can be observed with radiolabeled 45Ca2+) that only half of the Ca2+ bound in a Ca2E1 complex is readily exchangeable when exposed to a high concentration (~1 mM) of unlabeled Ca2+ (Dupont, Reference Dupont1982; Inesi et al. Reference Inesi, Ma, Lewis and Xu2004; Orlowski & Champeil, Reference Orlowski and Champeil1991b).
It remains for us to consider the way the protons are transported through the membrane in relation to different stages of E2P dephosphorylation and conversion to the E1 state. The number of protons countertransported (n) is usually considered to vary in the range of 2–3, depending on the pH and other environmental variables (Levy et al. Reference Levy, Seigneuret, Bluzat and Rigaud1990; Tadini-Buoninsegni et al. Reference Tadini-Buoninsegni, Bartolommei, Moncelli, Guidelli and Inesi2006; Yu et al. Reference Yu, Carroll, Rigaud and Inesi1993, Reference Yu, Hao and Inesi1994). Due to their small size the exact location of protons cannot be pinpointed by X-ray analysis, and considerations on the mechanism by which they pass the membrane (as hydronium ions or via proton chains) must also be held sub judice. However, the protonation of some or all of the carboxylate groups involved in the liganding of Ca2+ probably plays a vital role for the stabilization of the occluded state. Continuum electrostatic calculations performed on the Ca2+-ATPase in the presence of Ca2+ (Hauser & Barth, Reference Hauser and Barth2007) suggest very low apparent pK values (<0) for all the carboxylates liganding Ca2+ in the Ca2E1 state (Glu 309, Glu 771, Asp 800 and Glu 908), suggesting the formation of an electroneutral Ca2E1 binding complex at pH 7; while calculations performed by Sugita et al. (Reference Sugita, Miyashita, Ikeguchi, Kidera and Toyoshima2005) have led to a broader range of pKa values for the different carboxylates, with one of the residues (Glu 908) remaining partially protonated at pH 7–8. Furthermore, theoretical pKa calculations on the acidic amino acid residues of the various E2 structures suggest the protonation of 3–4 of the carboxylate groups in the pH range 8–6, with slight variations as to which of the residues are most likely to be in an unprotonated state (Sugita et al. Reference Sugita, Miyashita, Ikeguchi, Kidera and Toyoshima2005), Asp 800 (Obara et al. Reference Obara, Miyashita, Xu, Toyoshima, Sugita, Inesi and Toyoshima2005) or Glu 908 (Hauser & Barth, Reference Hauser and Barth2007). Direct evidence for protonation of carboxylate groups during E2P formation was provided by FTIR experiments, but not to the extent suggested by the electrostatic calculations, perhaps because of subtle uncertainties caused by the formation of hydrogen bonds between the liganding groups where small deviations from the X-ray tructures would severely affect the calculated results (Andersson et al. Reference Andersson, Hauser, Karjalainen and Barth2008). Another possibility is that the presence of an open and more hydrophilic E2P structure as proposed by us (Olesen et al. Reference Olesen, Picard, Winther, Gyrup, Morth, Oxvig, Møller and Nissen2007) would lead to higher dielectric constants, and hence to lower pK values at the binding sites. However, all calculations agree that Glu 771 has a very high pKa value of 14 or above and so is normally present protonated in the E2 form. Particular interest attaches to Glu 309 at Ca2+ binding site II, which has been suggested to function as a gating residue in Ca2+ uptake (Inesi et al. Reference Inesi, Ma, Lewis and Xu2004; Toyoshima & Nomura, Reference Toyoshima and Nomura2002). In the earliest structures of ATPase in the E2 state, this residue was modeled as having the carboxyl residue directed towards the cytosol (Olesen et al. Reference Olesen, Sørensen, Nielsen, Møller and Nissen2004; Toyoshima & Nomura, Reference Toyoshima and Nomura2002), a superficial position which gives rise to a low estimated pKa values for this residue. However, all subsequent E2 structures attest to Glu 309 as being present with the carboxyl group in an inward directed conformation as in the Ca2+ bound E1 states (Jensen et al. Reference Jensen, Sorensen, Olesen, Moller and Nissen2006; Obara et al. Reference Obara, Miyashita, Xu, Toyoshima, Sugita, Inesi and Toyoshima2005; Olesen et al. Reference Olesen, Picard, Winther, Gyrup, Morth, Oxvig, Møller and Nissen2007; Toyoshima et al. Reference Toyoshima, Norimatsu, Iwasawa, Tsuda and Ogawa2007), resulting in considerable rise in the estimated pKa as the result of being deeply embedded within the low dielectric of the membrane. Since the delivery of Ca2+ to the SR lumen according to the formation of a broad E2P channel (Olesen et al. Reference Olesen, Picard, Winther, Gyrup, Morth, Oxvig, Møller and Nissen2007) leads to the formation of ionized Glu 309 and Glu 771 these residues would be considered as primary targets for protonation by the luminal medium. From there the protons could move on to form an occluded state inside the central binding cavity, filled with water in the absence of Ca2+ (Hauser & Barth, Reference Hauser and Barth2007; Karjalainen et al. Reference Karjalainen, Hauser and Barth2007; Obara et al. Reference Obara, Miyashita, Xu, Toyoshima, Sugita, Inesi and Toyoshima2005). Details of possible proton pathways have been analyzed by Karjalainen et al (Reference Karjalainen, Hauser and Barth2007) based on an analysis of the empty space inside the X-ray structures available for water molecules in the central Ca2+-binding region, with narrow openings towards the lumen (for the closed E2P states) and through the C-terminal end to the cytosol (for Ca2E1–P structures). These openings could possibly serve as a pathway for exit of protons concomitant with Ca2+ uptake by the N-terminal entrance port to minimize charge imbalances that otherwise would arise if the exchange of protons for Ca2+ during the E2→Ca2E1 transition would occur by a sequential mechanism. This proposal recalls earlier suggestions of a possible cytosolic entrance for Ca2+ between the L8–9 and L6–7 loops (Menguy et al. Reference Menguy, Corre, Bouneau, Deschamps, Moller, Champeil, Le Maire and Falson1998). An intriguing background for the proposal was the presence of a triplet of closely located aspartate residues (D-813, D-815 and D-818) in the L6–7 loop appropriate to serve as a prebinding site for Ca2+, for further passage to Asp 800 and site I along M5 and M6, according to both mutational (Falson et al. Reference Falson, Menguy, Corre, Bouneau, De Gracia, Soulie, Centeno, Moller, Champeil and Le Maire1997), NMR (Soulie et al. Reference Soulie, Neumann, Berthomieu, Moller, Le Maire and Forge1999) and kinetic evidence (Peinelt & Apell, Reference Peinelt and Apell2005). Based on the X-ray data that indicate a compact and largely invariant structure of the C-terminal M5–M10 complex, this pathway as a possible entrance for Ca2+ has been questioned. Nevertheless, there is from proteolytic and immunochemical data evidence to suggest especially M6 as an easily accessible region in non-crystalline Ca2+-ATPase preparations: with proteinase K proteolytic cleavage extends into the C-terminal end of M6 (Falson et al. Reference Falson, Menguy, Corre, Bouneau, De Gracia, Soulie, Centeno, Moller, Champeil and Le Maire1997) and with site-directed antibody it is possible to expose the M6 segment, including Asp 800, to immunochemical reaction (Møller, Reference Møller, Falson, Taniguchi and Kaya2000; Møller et al. Reference Møller, Lenoir, Marchand, Montigny, Le Maire, Toyoshima, Juul and Champeil2002). In support of a C-terminal exit path for protons, or perhaps even an entrance for Ca2+, a re-analysis indicates that a C-terminal waterfilled channel can be delineated on the basis of a new E2-AlF4− structure (M. Bublitz, C. Olesen, H. Poulsen, J. P. Morth, J. V. Møller and P. Nissen, unpublished observations).
3.4 Resume of the reaction cycle
Figure 14 schematically recapitulates salient features of the reaction cycle as they emerge from piecing our structures together. In the dephosphorylated HnE2:ATP state (upper left corner) the cytosolic P-, A- and N- domain closely interact. The triphosphate moiety of the N-domain-bound ATP interacts with the outer part of the P-domain, whereas the glutamate residue of the TGES dephosphorylation motif is withdrawn from the phosphorylation site. Thus, the ATPase is in what may be termed a resting state, not subject to phosphorylation by ATP, and with the catalytically active TGES loop of domain A withdrawn from interaction with Asp 351 in the phosphorylation site. In the next step, cytosolic Ca2+ is bound in exchange with H+; the ensuing coordination with the Ca2+-binding residues in M4, M5, M6 and M8 leads to the rotational and translational changes in the position of especially the N-terminal transmembrane helices whereby M3 and M4 with Glu 309 at Ca2+-binding site II like a piston is moved 6 Å in the cytosolic direction. As a further consequence of these changes, the A-domain is dislodged from its nested accommodation between the N- and P-domains and finds a new binding site by anticlockwise and upward rotation around the N-domain. This permits the bound ATP to closely approach Asp 351, leading to the formation of the [Ca2]E1~P state, where the bound Ca2+ ions become occluded as a result of closure of the cytosolic entrance. In the following step, where the P- and N-domain interactions are loosened because of the transfer of the γ-phosphate to Asp 351, the conformation switches back to the E2 state, accompanied by an exchange of the bound ADP by ATP. During this transition, the close coordination of the two Ca2+ ions with the intramembranous residues is lost and the A-domain rotates back to the P-domain. In a sweeping motion, powered by the phosphorylated P-domain, the A domain at the end of this transition exerts sufficient traction on the A-M1, A-M2 and A-M3 linkers to open a luminal channel. This leads to the release of both Ca2+ ions from the E2 low-affinity luminal binding site (constituted by Glu 309, Asn 796 and Glu 771), in exchange with n (2–3) protons to partially compensate for the presence of excess negative electrostatic charge at the binding site. This is followed by closure of the luminal channel and occlusion of the bound protons. In the last step, the ATPase is dephosphorylated by the TGES loop, leading to the reformation of HnE2:ATP.
Schematic representation of the reaction cycle. For further explanation, see text. Reproduced with slight changes from Fig. 6 of Olesen et al. (Reference Olesen, Picard, Winther, Gyrup, Morth, Oxvig, Møller and Nissen2007).
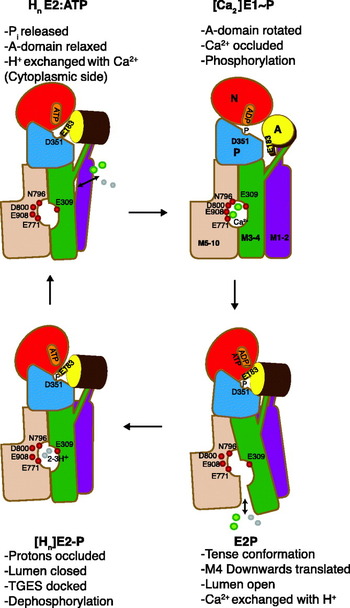
4. Regulatory aspects of Ca2+ transport
The SERCA 1a Ca2+-ATPase, the sarcoplasmic reticulum Ca2+ pump with which we are concerned here, is usually considered to be constructed as a ‘stop-and-go’ pump that quickly and efficiently removes Ca2+ from the cytosolic fluid around the myofibrils during the relaxation phase of the excitation–contraction cycle. Nevertheless, it is equipped with a number of in-built regulatory mechanisms, and the purpose here is to briefly review these aspects of the ATPase function and to discuss to what extent the structural studies throw light on their mechanistic basis and physiological importance.
4.1 Monovalent cation (K+) activation
It has been known for many years that monovalent cations like K+, Na+, Rb+ and Cs+ activate the turnover rate of SR Ca2+-ATPase, primarily by increasing the rate with which the E2P intermediate is dephosphorylated (Shigekawa & Pearl, Reference Shigekawa and Pearl1976). Thus, in media without monovalent metal ions the steady-state level of ADP-insensitive E2P is increased (Shigekawa & Dougherty, Reference Shigekawa and Dougherty1978). Studies on tight, reconstituted vesicles revealed that the effect of K+ is exerted on the cytosolic side of the ATPase, excluding the possibility that the activating effect could be the result of a Ca2+/K+ exchange process associated with the Ca2+ transport process (Shigekawa & Wakabayashi, Reference Shigekawa and Wakabayashi1985). With this background, it was of considerable interest when we realized that the structures of Ca2+-ATPase gave clear evidence of the presence of a well-defined cytosolic binding site for K+, localized at the base between the two C-terminal helices, P-α6 and P-α7 of the P-domain (Sørensen et al. Reference Sørensen, Clausen, Jensen, Vilsen, Moller, Andersen and Nissen2004a) cf. (Fig. 15a). At this site K+ and its Rb+ congener is ligated to the carbonyl main chain of Ala 711, Lys 712, Ala 714 and the carboxylate group of Glu 732, stabilizing the P-II subdomain (Fig. 13c). The involvement of the site in dephosphorylation is supported by mutational data showing that the mutation of Glu 732 leads to a reduction of the susceptibility to K+ (Sørensen et al. Reference Sørensen, Clausen, Jensen, Vilsen, Moller, Andersen and Nissen2004a). The dephosphorylation rate is about 20 times higher in the presence of K+ and other monovalent cations that are bound with an affinity for the site of a few millimolar cations, somewhat higher for K+ than Na+. Therefore, within the cell, the the ATPase must be assumed to be constitutively activated by K+. Presumably, the activation is mediated by the cation exerting a stabilizing effect on P-α6 and P-α7 helices of the phosphorylation P-II subdomain to allow the TGES loop to enter into the correct position for nucleophilic attack of the phosphorylated Asp 351. A direct effect exerted on the TGES loop is also possible, via the A-M3 linker that in the E2P structure is localized within 5 Å distance from the K+-binding site.
K+ and ATP as modulators of Ca2+-ATPase turnover. (a) Overall representation of SERCA in the E2:AMPPCP state, showing how the modulatory bound nucleotide in this state connects the N, A and P domain. The ATPase is shown in cartoon and transparent surface as in Fig. 3, and AMPPCP in spacefilling. The K+ ion is shown in purple spacefilling. (b) Close-up view of the modulatory ATP binding site with key residues shown in stick and ball. (c) Close-up view of the K+ binding site at the bottom of the P-domain.

For Na+, K+-ATPase a non-transport K+-binding site, localized to the same region, has recently been identified (Schack et al. Reference Schack, Morth, Toustrup-Jensen, Anthonisen, Nissen, Andersen and Vilsen2008). It was found in this study that Na+, K+-ATPase mutants in this region gave rise to dephosphorylation rates with a biphasic dependence of dephosphorylation on the K+ concentration. The detailed analysis of the data suggested that for this ATPase, K+ simultaneously activates dephosphorylation both via stimulation of K+ exchange from the extracellular side, and via an effect by the cytoplasmic binding site. Since the region harboring the K+ site in Ca2+-ATPase and Na+, K+-ATPase is quite well-conserved, similar cation-dependent activations are likely to be characteristic of other P-type ATPase as well.
4.2 ATP modulation of ATPase activity
While a major part of Ca2+-ATPase can become phosphorylated by concentrations of only a few μmolar ATP, higher levels ranging 10–5000 μM increase the rate of ATP hydrolysis by modulatory effects on other reactions than the ATP phosphorylation step. Two or three accelerating phases are usually distinguished (Møller et al. Reference Møller, Lind and Andersen1980), mainly associated with the E1P→E2P transition and E2P dephosphorylation (Champeil et al. Reference Champeil, Le Maire, Andersen, Guillain, Gingold, Lund and Moller1986). In the latter situation, ATP is barred from direct contact with the phosphorylation site in the P-domain, but while still bound to the N-domain, interacts with certain amino acid residues in the A-domain close to the knob where the catalytically active TGES motif is situated (Fig. 15b). This alternative type of ATP binding seems to give rise to the modulation by ATP in a form where it is not complexed with Mg2+ or other divalent cations (Champeil et al. Reference Champeil, Riollet, Orlowski, Guillain, Seebregts and Mcintosh1988). Additionally, the E2→Ca2E1 transition is subject to acceleration by binding of low concentrations of MgATP (Scofano et al. Reference Scofano, Vieyra and De Meis1979; Stahl & Jencks, Reference Stahl and Jencks1984; Wakabayashi et al. Reference Wakabayashi, Ogurusu and Shigekawa1986), but the role of this modulation during normal turnover conditions is not significant, since the major part of the ATPase will be present as the phosphorylated intermediates under these conditions (Champeil et al. Reference Champeil, Le Maire, Andersen, Guillain, Gingold, Lund and Moller1986), but see below for a possible physiological importance of the modulation.
Recent mutagenesis experiments, analyzed in conjunction with the available crystal structures, have provided detailed information regarding ATP modulation of the various steps after phosphorylation by ATP (Clausen et al. Reference Clausen, Mcintosh, Anthonisen, Woolley, Vilsen and Andersen2007, Reference Clausen, Mcintosh, Woolley and Andersen2008). Most of the important residues in the A-, P- and N-domains involved in ATP modulation are indicated in Fig. 13b. In the E2P transition and product states they are situated close to each other and some of them form important links such as Asp 203 and Arg 678 between the A- and P-domains, and Ser 186 and Glu 439 between the A- and N-domains. An intact Arg 174 is essential for the maintenance of both the basal and ATP-modulated E1P→E2P transition (Clausen et al. Reference Clausen, Mcintosh, Woolley and Andersen2008). In the E1P conformation, Arg 174 is widely removed from the phosphorylation site, but interestingly from the E2-BeF3 structure we can deduce that Arg 174 will be in a perfect position for interaction with modulatory bound nucleotide, and hence with the potential to stabilize the E2P ground state. Arg 678 is of great importance for ATP binding and for modulation, accelerating both the basal and ATP-modulated Ca2E1P→E2P transition rate (Clausen et al. Reference Clausen, Mcintosh, Anthonisen, Woolley, Vilsen and Andersen2007). But at the same time, it seems to antagonize the effect of Arg 174 by stabilizing the ADP sensitive E1~P intermediate. Furthermore, the replacement of Ser 186 or Glu 439 by Ala, which presumably leads to a disruption of the Glu 439/Ser 186 link, abolishes nucleotide modulation and is accompanied by a strong (constitutive) activation of E2P hydrolysis. Mutation of Arg 174 to Glu 174 also strongly increases the E2P dephosphorylation rate, but in this case with retention of ATP modulation (i.e. the effect of this mutation on E2P hydrolysis is the opposite to that observed for the E1P→E2P transition). Furthermore, mutation of Lys 205 resulted in the constitutive activation of E2P dephosphorylation, with an inhibitory effect on ATP modulation, while the replacement of Ile 188 by Ala resulted in low E2P dephosphorylation rates without ATP modulation. Thus, the modulatory effect of ATP on ATPase turnover is very complex, being tightly controlled by the interactions of domain A with ATP and with the other cytosolic domains during the E2P dephosphorylation reactions. In agreement with the previous findings (Champeil et al. Reference Champeil, Riollet, Orlowski, Guillain, Seebregts and Mcintosh1988; Wakabayashi et al. Reference Wakabayashi, Ogurusu and Shigekawa1986), the modulatory effects on E2P dephosphorylation required the absence of Mg2+, which could suggest that interactions with Lys 205, located close to the γ-phosphate of bound ATP in the E2-MgF4− structure, like the Glu 439/Ser 186 and Arg 678 and Asp 203 interactions, stabilizes the E2P transition state and thereby regulates the dephosphorylation rate, after the initial interactions with Arg 174 to form the E2P ground state. Mechanistically, Arg 174 may be important by facilitating the binding of modulatory ATP to the alternative binding site on the A-domain, and thereby guide the movement of the A-domain towards the P-domain. Remarkably, Arg 678 was the only residue that appeared to regulate the E2 to Ca2E1 transition by stabilizing the E1 conformation, as evidenced by an accelerating effect of mutations to this residue on the E2 to Ca2E1 transition.
In conclusion, from the effect of ATP bound in a non-phosphorylating fashion, the ATPase bears all the hallmarks of being equipped with regulatory mechanisms, including molecular brakes in the structure that only can be relieved by the binding of high concentrations of ATP to unleash the full potential of the ATPase for ATP hydrolysis. However, as was the case for activation by monovalent cations, we are confronted with the question what the physiological function of such a regulation could be, because at the ATP concentrations present in muscle cells (~5–8 mM) the ATPase, when presented with Ca2+, will work at close to maximal levels. Even during strenuous exercise or in diseases such as those associated with malignant hyperthermia, where during the attacks the muscle cells are flooded with Ca2+, the ATP level is unlikely to drop to an extent that would significantly spare energy output and heat production by reducing the Ca2+-ATPase activity. However, ATP binding to the reaction intermediates may fulfil other roles. Thus, a rapid activation of the E2→Ca2E1 reaction by ATP could be important for the ATPase to respond quickly to the rise of cytosolic Ca2+ concentration during the relaxation phase of the excitation–contraction cycle. Furthermore, the modulatory-bound ATP will compete and displace bound ADP from the Ca2E1–P-ADP intermediate, preventing reversal of the ATP phosphorylation, something that might be important when the level of ADP rises during high muscle activity. Additionally, bound ATP can be envisaged to stabilize the various Ca2+-ATPase intermediates and, by preventing diverting side reactions from occurring, keep the protein on the track to efficiently couple Ca2+ transport and ATP hydrolysis. Finally, ligand stabilization may protect the ATPase from the daily wear and tear associated with its Ca2+ transport function. That this could be a significant factor may be judged from the fact that even in the best preparations of sarcoplasmic reticulum a maximum of two-third of the Ca2+-ATPase content is functional, the remainder being present in an inactive and aggregated state as evidenced by the measurements of phosphorylation capacity and HPLC analysis of detergent solubilized ATPase (le Maire et al. Reference Le Maire, Arnou, Olesen, Georgin, Ebel and Møller2008).
4.3 Product inhibition by accumulated Ca2+
As the result of the ATP-driven Ca2+ transport, very high Ca2+ gradients develop across the sarcoplasmic reticulum membrane. In the usual vesicular preparations of ‘light’ sarcoplasmic reticulum that are derived from the longitudinal part of the sarcoplasmic reticulum of skeletal muscles, the maximal levels of uptake can approach about 150–200 nmol/mg protein. This level of uptake can be estimated to reflect an intraluminal concentration of at least 40 mM Ca2+, which at a medium concentration of 1 μM Ca2+ would correspond to a concentration gradient of 40 000:1. But to obtain such high levels of accumulation presupposes optimal ambient conditions, in particular a neutral or slightly acid pH to provide a sufficient proton concentration (activity) for the H+ exchange process. Various phases can be distinguished during the uptake to maximal levels of Ca2+ accumulation by sarcoplasmic reticulum vesicles as illustrated in Fig. 16 which shows the effect of intravesicular accumulated Ca2+ on ATPase activity and ATP induced Ca2+/Ca2+ exchange. To begin with, inward Ca2+ transport is not opposed by any significant efflux up to a level of 50 nmol Ca2+/mg. But then as can be shown with the aid of radiolabeled 45Ca2+, by further Ca2+ accumulation a Ca2+–Ca2+ exchange mechanism is activated which at the level of maximal accumulation balances inward transport. The same maxium accumulation is achieved over a wide range of ATP concentrations and temperature, indicative of tight coupling of Ca2+ influx and –efflux (Gerdes & Møller, Reference Gerdes and Møller1983). As another important feature, Ca2+–Ca2+ exchange is preceded by a dramatic (10–20 fold) fall in ATPase activity as can be seen from Fig. 16. The fact that Ca2+–Ca2+ exchange during uptake occurs at a later stage than inhibition of ATPase activity means that the latter process cannot be attributed to a reversal of Ca2+ transport with reformation of ATP through the phosphorylated [Ca2]E1~P:ADP intermediate. Instead, it must be the result of a separate inhibitory mechanism, caused by the binding of Ca2+ to other residues inside the lumen than those involved in Ca2+ translocation. Probably, the inhibition is linked to the large number of acidic amino acid residues resident on the luminal side of the Ca2+-ATPase, but so far it has not been possible in Ca2+-ATPase crystals to identify additional Ca2-binding sites other than those involved in translocation, even by crystallization in media with 100 mM Ca2+ (unpublished observations). In contrast to the effect of monovalent cations and high concentrations of ATP on ATPase activity it is easíer to envision the physiological role for Ca2+ dependent inhibition: this probably is a means to protect the sarcoplasmic reticulum against osmotic stress and the decreased coupling ratios, resulting from Ca2+/Ca2+ exchange, that is associated with high loads of accumulated Ca2+. In agreement with the physiological importance of this mechanism, the uptake of Ca2+ in muscle cells appears to be limited to 35–45 nmol/mg (Endo, Reference Endo1977).
Ca2+-ATPase inhibition, Ca2+ efflux, and Ca2+ outflow as a function of the vesicular Ca2+ content. Ca2+ uptake was started by the addition of various concentrations of ATP to SR vesicles preincubated with 0·1 mM Ca2+, 10 mM Mg2+ at pH 6·8 and followed until maximal uptake was attained which was found to level off within 5 min at 150 nmol Ca2+/mg protein, regardless of differences in ATP concentration and ATPase activity (not shown in the figure). The hatched bars show the variations in the inhibition of Ca2+-ATPase activity obtained during uptake with the different concentrations of ATP, while the curves with symbols show the efflux of Ca2+ at 187 μM ATP, •; 47 μM ATP, ○; 0·94 μM ATP, ▪; and the outflow of Ca2+ after cessation of ATPase activity by the addition of 10 mM EGTA, ▴ or exhaustion of ATP supply, □. The figure shows that above a certain level (50 nmol Ca2+/mg protein) the ATPase activates an ATP dependent Ca2+ efflux mechanism under conditions when the ATPase activity has already been severely inhibited by the intracellular accumulation of Ca2+. This, and the constant level of maximal accumulation, is evidence of a Ca2+/Ca2+ exchange mechanism leading to equilibration of outflow and inflow of Ca2+ by active transport at the level of maximal uptake. (For further information on the data behind this composite figure, see Gerdes & Møller, Reference Gerdes and Møller1983.)

Concerning the nature of the Ca2+/Ca2+ exchange mechanism, it should first be noted that this phenomenon does not reflect a passive leak of accumulated Ca2+, rather it is due to a reversal of the translocation mechanism either through the E2P/Ca2E1~P intermediates (Feher & Briggs, Reference Feher and Briggs1983; Takakuwa & Kanazawa, Reference Takakuwa and Kanazawa1982) or of Ca2+ substituting for H+ through the E2P/E2 pathway (Gerdes & Møller, Reference Gerdes and Møller1983). In support of the former view, intravesicular Ca2+ accumulation leads to an increase in ADP sensitive [Ca2]E1~P intermediate (Inesi & de Meis, Reference Inesi and De Meis1989; Marchand et al. Reference Marchand, Lund Winther, Holm, Olesen, Montigny, Arnou, Champeil, Clausen, Vilsen, Andersen, Nissen, Jaxel, Moller and Le Maire2008; Punzengruber et al. Reference Punzengruber, Prager, Kolassa, Winkler and Suko1978), whereas experimental support linking Ca2+ exchange to E2P phosphorylation from Pi is lacking. But linking Ca2+ exchange to the reversible back and forward E2P/E1P transitions also poses a paradox: this is because it is found that Ca2+/Ca2+ exchange continues unabated when ADP is continuously removed from the medium with the aid of an ATP regenerating system (Gerdes & Møller, Reference Gerdes and Møller1983). As a consequence, depending on the magnitude of the Ca2+/Ca2+ exchange, Ca2+ transport must either be released by deocclusion from the Ca2E1–P intermediate or this intermediate can become hydrolyzed without the reformation of ATP. In accordance with the latter possibility recent studies suggest that overloading of SR vesicles with Ca2+ leads to uncoupling (‘slippage’), as a result of hydrolysis of the Ca2E1~P intermediate, accompanied by heat development instead of the reformation of ATP (Barata & de Meis, Reference Barata and De Meis2002; de Meis et al. Reference De Meis, Arruda and Carvalho2005). Uncoupling of Ca2+ transport without ATP reformation has also been reported to be stimulated by sarcolipin (Mall et al. Reference Mall, Broadbridge, Harrison, Gore, Lee and East2006) and capsaicin (Mahmmoud, Reference Mahmmoud2008), while anionic lipids (Dalton et al. Reference Dalton, Pilot, Mall, East and Lee1999) and curcumin (Sumbilla et al. Reference Sumbilla, Lewis, Hammerschmidt and Inesi2002) have been reported to increase Ca2+/ATP coupling ratios. With respect to the cytosolic release of Ca2+ bound to phosphorylated ATPase IR spectroscopic evidence suggests that the [Ca2]-E1–P when stabilized by a high concentration of Ca2+ in the absence of bound nucleotide may assume an open conformation, similar to that of the Ca2E1 conformation (Liu & Barth, Reference Liu and Barth2004). Perhaps as a consequence, the idea of a completely occluded Ca2E1~P intermediate should be abandoned, considering occlusion to be mainly restricted to the Ca2E1–P:ADP and the transition state of the ATP phosphorylation reaction intermediate as mimicked by the CrATP (Coan et al. Reference Coan, Ji and Amaral1994; Vilsen & Andersen, Reference Vilsen and Andersen1992) and ADP-AlF4− (Sørensen et al. Reference Sørensen, Møller and Nissen2004b; Troullier et al. Reference Troullier, Girardet and Dupont1992) ATPase complexes.
4.4 Role of the lipid phase
In the sarcoplasmic reticulum of skeletal muscle the Ca2+-ATPase is embedded in about 80–90 moles of phospholipid per mole protein, present together with minor amounts of neutral lipid and cholesterol (Tada et al. Reference Tada, Yamamoto and Tonomura1978). Phosphatidylcholine is the major component, constituting approximately two-third of the phospholipids present in the sarcoplasmic reticulum membrane together with smaller amounts of phosphatidylethanolamine, phosphatidylserine, phosphatidylinositol and sphingomyelin. To explore the role of lipid for Ca2+-ATPase function, it is important that after detergent solubilisation, e.g. by cholate, and reconstitution by addition of exogenous lipid it is possible to exchange the normal lipid environment in the detergent solubilized state with other phospholipids almost at will, and over a wide range of lipid to protein concentration ratios (Warren et al. Reference Warren, Toon, Birdsall, Lee and Metcalfe1974). Such studies have demonstrated the importance of lipid fluidity for the retention of high levels of activity, e.g. dioleoylphosphocholine (DOPC) rather than the saturated phospholipids, e.g. dipalmoyl phosphatidylcholine (DPPC) is optimal for activity, whereas the nature of the head groups present in other classes of phospholipids species such as phosphatidylserine or –ethanolamine only plays a minor role (Lee, Reference Lee2003). Bilayer thickness is another important parameter: optimal conditions are provided by C16–C20 hydrocarbon lengths (Johannsson et al. Reference Johannsson, Keightley, Smith, Richards, Hesketh and Metcalfe1981). As shown in Fig. 17, taken from (Starling et al. Reference Starling, East and Lee1993), although phosphatidylcholine with both shorter (C12 and C14) and longer (C24) chain lengths are able to fully phosphorylate Ca2+-ATPase, Ca2+ is only bound at one site. Furthermore, both phosphorylation and dephosphorylation rates are severely reduced under these conditions. However, normal activities of di-C12- or di-C14-phosphatidylcholine-reconstituted membranes can be restored by the addition of decane (Johannsson et al. Reference Johannsson, Keightley, Smith, Richards, Hesketh and Metcalfe1981; Lee, Reference Lee1998) or sterols such as androstenol (Michelangeli et al. Reference Michelangeli, Grimes, East and Lee1991) to increase bilayer thickness to about 25–30 Å.
Effect of phosphatidylcholine fatty acyl chain length on the functional properties of Ca2+-ATPase. The ATPase was reconstituted with phosphatidylcholines containing mono-unsaturated fatty acyl chains of the given length, all being in the liquid crystalline phase at 25°C, the temperature of the experiment. The curve shows the ATPase activity as a function of chain length. The shaded bars show the maximal level of phosphorylation by ATP in the presence of 1 mM Ca2+, and the open bars show the level of Ca2+ bound (in nmoles/mg protein) (reproduced from Starling et al. Reference Starling, East and Lee1993).
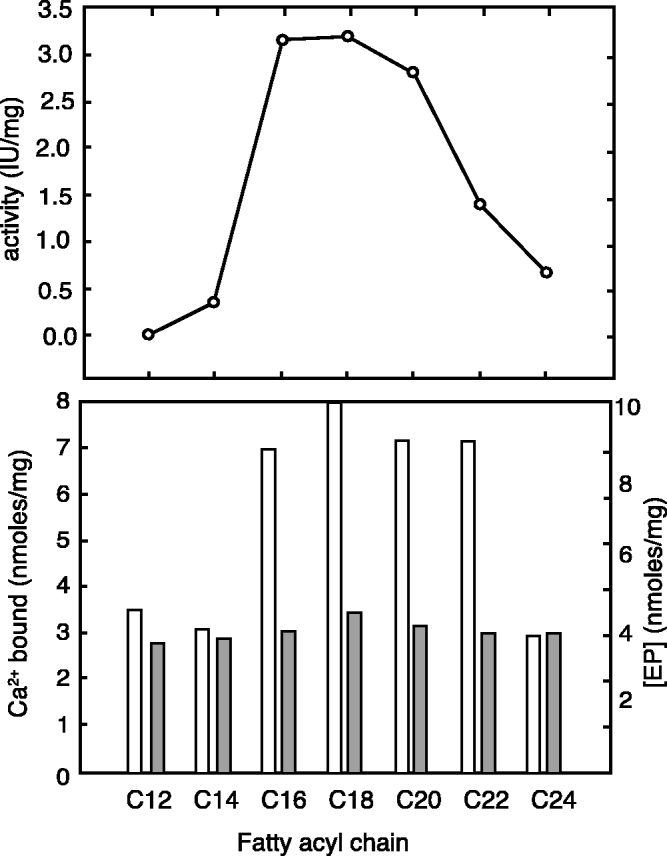
Concerning the organization of lipid in the sarcoplasmic reticulum, it is considered likely that a bilayer of relatively immobilized lipid like a ring (a so-called annulus) surrounds the Ca2+-ATPase. This idea was originally proposed by Warren et al. (Reference Warren, Houslay, Metcalfe and Birdsall1975) as a way to explain that in preparations reconstituted with mixtures of cholesterol and phospholipid a minimum amount of phospholipid, corresponding to about 30 mol/mol Ca2+-ATPase like a ring (an annulus) surrounds the membrane-embedded part of the Ca2+-ATPase and is required to protect the protein against a reversible inactivation caused by the exposure of Ca2+-ATPase to the more rigid steroid skeleton of cholesterol (Hesketh et al. Reference Hesketh, Smith, Houslay, Mcgill, Birdsall, Metcalfe and Warren1976). Evidence for an immobilized lipid component has been obtained in particular by the electron spin resonance (ESR) spectroscopy of nitroxide labeled fatty acid or phospholipid, incorporated as probes into the membranes (Lee, Reference Lee2003). In this context, it is important to realize that the term ‘immobilization’ is a relative concept and not synonymous with fixed binding sites. While it is reasonable that lipid at a protein boundary should experience restricted mobility, there will still be the possibility for some mobility and exchange between the annular and adjoining bilayer lipid. These aspects have been studied in detail not only by ESR- (Marsh & Horvath, Reference Marsh and Horvath1998), but also by NMR spectroscopy with deuterium or 31P labeled phospholipids (Rice et al. Reference Rice, Meadows, Scheinman, Goni, Gomez-Fernandez, Moscarello, Chapman and Oldfield1979; Seelig et al. Reference Seelig, Tamm, Hymel and Fleischer1981). To be able to detect the immobilized component spectroscopically, it is necessary that the exchange between two lipid environments occurs at a rate slower than the spectroscopic time scale for the measurements; otherwise, the recording of the immobilized and mobile signals from the probe will merge. ESR techniques, with a rotational correlation time scale of 10−7–10−8 s, fulfils the requirements for differentiating between the mobility of environments of lipid interacting with membrane proteins versus the motion in the surrounding bilayer, while this evidently has not been the case in NMR experiments with deuterium- or 31P-labeled phospholipid probes with longer correlation times that only will reveal the presence of firmly bound probe (Rice et al. Reference Rice, Meadows, Scheinman, Goni, Gomez-Fernandez, Moscarello, Chapman and Oldfield1979; Seelig et al. Reference Seelig, Tamm, Hymel and Fleischer1981). This is probably a main reason why the latter technique, in contrast to ESR spectroscopy with nitroxide fatty acid or phospholipid probes (Marsh & Horvath, Reference Marsh and Horvath1998; Marsh & Pali, Reference Marsh and Pali2004) has failed to give evidence for any appreciable heterogeneity of the phospholipid phase in reconstituted Ca2+-ATPase membranes and other membrane proteins. It was estimated from the NMR data that maximally about 5–10 moles phospholipid could be considered to be bound by the ATPase (Seelig et al. Reference Seelig, Tamm, Hymel and Fleischer1981). However, an important outcome of the NMR experiments has been the realization that Ca2+-ATPase induces disorder of phospholipid of a static nature, an effect which can be readily understood on the basis of phospholipid interacting with an uneven and rugged protein surface.
From another point of view, the functional importance of a phospholipid layer surrounding the protein is supported by the fact that the ATPase activity can be preserved after partial delipidation of sarcoplasmic reticulum to about 30 moles of phospholipid/mol ATPase either by treatment with lipases or the detergent extraction (Møller et al. Reference Møller, Andersen and Le Maire1982). There are from such experiments no evidence for preferential binding of any of the major phospholipid classes with different head groups to the annulus remaining on the partially delipidated Ca2+-ATPase (le Maire et al. Reference Le Maire, Jorgensen, Roigaard-Petersen and Møller1976). This has been confirmed by the measurements of the ability of different phospholipids to displace nitroxide – labeled or brominated phospholipid previously incorporated into the annulus (East & Lee, Reference East and Lee1982; London & Feigenson, Reference London and Feigenson1981). From such experiments, it has been concluded that there is no appreciable difference between the phospholipid composition of the annulus and the bilayer, neither with respect to head group specificity nor hydrocarbon length (Lee, Reference Lee2003).
The picture that emerges from these findings is that of an annulus surrounding the periphery of the ATPase as an irregular and disorderly arranged bilayer similar to what has been detected in the structure of an eukaryotic voltage dependent K+ channel protein crystallized with a lipid/detergent mixture (Long et al. Reference Long, Tao, Campbell and Mackinnon2007). The lipid in the annulus is rotationally restricted, but in constant exchange with the surrounding lipid bilayer with rate constants that probably on the average are only about one order of magnitude slower than the translational diffusion of phospholipid in the lipid bilayer (Lee, Reference Lee2003; Marsh & Horvath, Reference Marsh and Horvath1998). In effect, the annular lipid could be considered to fulfil an equivalent role as solvent for the ATPase in the lipid phase as the shell of water molecules interacting with the dissolving medium at the periphery of water-soluble proteins.
It should be noted that, however attractive, there are still some unresolved questions concerning the picture of the annulus provided above. Recent estimates of the boundary lipid suggest the presence of only 18 (Villamil Giraldo et al. Reference Villamil Giraldo, Castello, Gonzalez Flecha, Moeller, Delfino and Rossi2006) or 24 (Marsh & Pali, Reference Marsh and Pali2004) moles of phospholipid/mol ATPase, somewhat lower than originally considered and barely sufficient to provide a complete annulus around monomeric ATPase, unless assisted by other lipid species present in the membrane. Furthermore, as an alternative or supplementary possibility, immobilization could reflect protein–protein interactions in the densely populated environment of the sarcoplasmic reticulum membrane that might lead to the trapping of lipid by the formation of protein–lipid–protein interactions as in cytochrome c oxidase (Shinzawa-Itoh et al. Reference Shinzawa-Itoh, Aoyama, Muramoto, Terada, Kurauchi, Tadehara, Yamasaki, Sugimura, Kurono, Tsujimoto, Mizushima, Yamashita, Tsukihara and Yoshikawa2007), while from studies on the detergent solubilized Ca2+-ATPase there is no convincing evidence that SERCA 1a is capable of forming stable dimers or other well-defined oligomeric species (Andersen et al. Reference Andersen, Vilsen, Nielsen and Moller1986; le Maire et al. Reference Le Maire, Champeil and Møller2000). We have found that high protein concentrations (Andersen et al. Reference Andersen, Vilsen, Nielsen and Moller1986) or the addition of phospholipid to detergent solubilized Ca2+-ATPase increases oligomerization (le Maire et al. Reference Le Maire, Champeil and Møller2000) and provide an immobile environment for a fatty acid spin label covalently attached to the protein (Andersen et al. Reference Andersen, Fellmann, Moller and Devaux1981). While these data fail to give any evidence for the formation of well-defined oligomers, it is entirely possible that clusters of Ca2+-ATPase monomers glued together by phospholipid might form the basis for reported complex kinetic features of Ca2+-ATPase activity in the sarcoplasmic reticulum membrane with evidence for phase-dependent cooperative interactions among individual Ca2+-ATPase molecules (Mahaney et al. Reference Mahaney, Thomas and Froehlich2004; Mahaney et al. Reference Mahaney, Albers, Waggoner, Kutchai and Froehlich2005).
In addition to annular or similarly bound lipid at the protein/lipid interphase, evidence has accumulated that Ca2+-ATPase, like membrane proteins in general, have well-defined sites for specific binding of lipids and other hydrophobic compounds at what has been termed non-annular sites (Lee, Reference Lee2003). Typically, these binding sites are located in cavities between the transmembrane helices. For Ca2+-ATPase a prime example is the binding site for thapsigargin, a plant sesquiterpene lactone (Mikkelsen et al. Reference Mikkelsen, Thastrup and Christensen1988; Rasmussen et al. Reference Rasmussen, Christensen and Patkar1982) and specific inhibitor of SERCA (Thastrup et al. Reference Thastrup, Cullen, Drobak, Hanley and Dawson1990). This compound is bound in a cavity, formed between the third, fifth and seventh transmembrane helix, exposed towards the protein–lipid interphase (Toyoshima & Nomura, Reference Toyoshima and Nomura2002). Binding takes place with very high affinity to the E2 conformation of Ca2+-ATPase, preventing the conformational changes in the transmembrane domain required for binding and activation of the enzyme activity by Ca2+ (Sagara & Inesi, Reference Sagara and Inesi1991; Sagara et al. Reference Sagara, Fernandez-Belda, De Meis and Inesi1992). A comparison of structures, representative of the Ca2+-ATPase in the E2P transition state, obtained in the absence or presence of bound thapsigargin, show that the inhibitor is bound inside the pocket with few adaptive changes in the protein structure (Olesen et al. Reference Olesen, Picard, Winther, Gyrup, Morth, Oxvig, Møller and Nissen2007). This complementarity no doubt accounts for the high (subnanomolar) affinity with which the compound is bound. In the absence of thapsigargin, the cavity will be a candidate for the binding of other hydrophobic membrane components that in addition to phospholipids could include polycyclic compounds, such as cholesterol and steroids, although so far this has not been verified by X-ray diffraction. With respect to cholesterol from spectroscopic investigations by ESR (Silvius et al. Reference Silvius, Mcmillen, Saley, Jost and Griffith1984) and fluorescence (Ding et al. Reference Ding, Starling, East and Lee1994) spectroscopic evidence in support of binding of cholesterol at the protein interphase has been reported, but a conclusive analysis of such data in terms of the specific protein-binding site(s) is difficult to perform, due to the extensive uptake of the steroid by the lipid phase that indirectly will affect protein function by changes in lipid properties in the bulk phase such as an increased order of acyl chains (Li et al. Reference Li, Ge, Ciani, Kuriakose, Westover, Dura, Covey, Freed, Maxfield, Lytton and Tabas2004) and thickness of the lipid membrane.
In addition to thapsigargin, there are from the crystal structures evidence for binding of phospholipid at two sites, both located in a groove among M2, M4 and M6 (Obara et al. Reference Obara, Miyashita, Xu, Toyoshima, Sugita, Inesi and Toyoshima2005; Picard et al. Reference Picard, Toyoshima and Champeil2006); of these the most deeply bound phospholipid, which has been modeled as phosphatidylethanolamine, is close to the Ca2+-binding site II (Obara et al. Reference Obara, Miyashita, Xu, Toyoshima, Sugita, Inesi and Toyoshima2005). On the basis of the theoretical docking the groove in which the two phospholipids have been detected in the crystal structures, has also been proposed as a likely binding site for sarcolipin (Asahi et al. Reference Asahi, Sugita, Kurzydlowski, De Leon, Tada, Toyoshima and Maclennan2003; Picard et al. Reference Picard, Jensen, Sorensen, Champeil, Moller and Nissen2007) and phospholamban (Toyoshima et al. Reference Toyoshima, Asahi, Sugita, Khanna, Tsuda and Maclennan2003). Sarcolipin and phospholamban are two Ca2+ transport inhibitory polypeptides, belonging to the same gene family (Odermatt et al. Reference Odermatt, Taschner, Scherer, Beatty, Khanna, Cornblath, Chaudhry, Yee, Schrank, Karpati, Breuning, Knoers and Maclennan1997). Sarcolipin, with a total of 31 amino acid residues, consists of one transmembrane helix that is flanked by short hydrophilic sequences on both the N- and C-terminal sides. This polypeptide, formerly referred to as proteolipid (Maclennan, Reference Maclennan, Yip, Iles and Seeman1972), is found in the sarcoplasmic reticulum of skeletal muscle in about equimolar quantities together with SERCA 1a. Phospholamban is a 52 amino acid polypeptide, containing an N-terminal, cytosolically exposed- and a C-terminal transmembrane helix, joined by an intervening flexible linker. Phospholamban is expressed mainly together with SERCA 2a and is an important regulator of cardiac muscle function (MacLennan et al. Reference Maclennan, Asahi and Tupling2003; Tada et al. Reference Tada, Yamamoto and Tonomura1978). Being subject to hormonal regulation, the peptide can be phosphorylated by PKA and calmodulin II kinase, which unlocks the binding to SERCA and leads to an increased Ca2+-ATPase activity (MacLennan & Kranias, Reference Maclennan and Kranias2003). It is present in both a monomeric, active form that is in reversible equilibrium with an assumed inactive pentamer, but see (Karim et al. Reference Karim, Marquardt, Stamm, Barany and Thomas2000; Vorherr et al. Reference Vorherr, Wrzosek, Chiesi and Carafoli1993), which suggest that the pentamer may be of functional importance as well. Furthermore, Stokes et al. (Reference Stokes, Pomfret, Rice, Glaves and Young2006) in 2D membrane crystals of Ca2+-ATPase have obtained evidence for the interaction of Ca2+-ATPase with oligomeric phospholamban, despite that their preparation had been mutated to favor the monomeric form. Although not present in the skeletal muscle, phospholamban also interacts with SERCA 1a (Vorherr et al. Reference Vorherr, Wrzosek, Chiesi and Carafoli1993). Both sarcolipin (Odermatt et al. Reference Odermatt, Becker, Khanna, Kurzydlowski, Leisner, Pette and Maclennan1998; Tupling et al. Reference Tupling, Asahi and Maclennan2002) and phospholamban (Sasaki et al. Reference Sasaki, Inui, Kimura, Kuzuya and Tada1992; Vorherr et al. Reference Vorherr, Wrzosek, Chiesi and Carafoli1993) have been found to moderately decrease the apparent Ca2+ affinity and V max of Ca2+-ATPase. When added together, they form a so-called ‘superinhibitory’ complex (Asahi et al. Reference Asahi, Kurzydlowski, Tada and Maclennan2002, Reference Asahi, Sugita, Kurzydlowski, De Leon, Tada, Toyoshima and Maclennan2003) with modulatory effects on Ca2+-ATPase turnover of a magnitude comparable to the deactivation of the plasma membrane Ca2+-ATPase, seen in the absence of calmodulin. There is mutational (Toyofuku et al. Reference Toyofuku, Curotto Kurzydlowski, Narayanan and Maclennan1994a, Reference Toyofuku, Kurzydlowski, Tada and Maclennan1994b, Reference Toyofuku, Kurzydlowski, Tada and Maclennan1994c) and NMR (Hughes et al. Reference Hughes, Clayton, Kitmitto, Esmann and Middleton2007; Metcalfe et al. Reference Metcalfe, Zamoon, Thomas and Veglia2004) evidence, supported by computational modeling (Toyoshima et al. Reference Toyoshima, Asahi, Sugita, Khanna, Tsuda and Maclennan2003), that the peptides share a common binding site among M2, M4 and M6, and via their N-termini interact with the cytosolic domains (James et al. Reference James, Inui, Tada, Chiesi and Carafoli1989). It will obviously be of great interest to provide more definitive documentation for these ideas by the X-ray diffraction; but so far it has not been possible to detect these lipophilic peptides in the crystal ATPase structures. The fundamental problem may be that because of a relatively low affinity (Mall et al. Reference Mall, Broadbridge, Harrison, Gore, Lee and East2006) they are removed from the binding sites during crystallization and merge with the background of mixed lipid/C12E8 bilayer, surrounding the ATPase protein (Sørensen et al. Reference Sørensen, Olesen, Jensen, Møller and Nissen2006).
In addition to sarcolipin, phospholamban and thapsigargin many amphipathic or lipophilic compounds can be expected to regulate the function of Ca2+-ATPase via the lipid phase. Most of what is known on this topic so far comes from studies with non-ionic detergents like C12E8 (Andersen et al. Reference Andersen, Le Maire, Kragh-Hansen, Champeil and Moller1983; Champeil et al. Reference Champeil, Le Maire, Andersen, Guillain, Gingold, Lund and Moller1986), DDM (de Foresta et al. Reference De Foresta, Henao and Champeil1992) and with Triton X-100 (McIntosh & Ross, Reference Mcintosh and Ross1988) which when added to membranes in low non-solubilizing concentrations affect the ATPase function in characteristic ways. These amphipathic compounds partition between the medium and lipid bilayers, including the annulus, where they successfully compete with phospholipid (de Foresta et al. Reference De Foresta, Legros, Plusquellec, Le Maire and Champeil1996), but a few detergent molecules are specifically bound to the ATPase at non-annular sites, affecting enzyme kinetics in ways that in many respects are the same as after detergent solubilization and delipidation (such as a decrease in V max, an activating effect on the E2 to Ca2E1 transitions, and a decreased cooperative interaction between the two Ca2+-binding sites). The reduction in enzyme activity occurs despite that according to ESR measurements with fatty acid nitroxides the fluidity of the lipid bilayer is strongly increased as a result of the detergent incorporation (Andersen et al. Reference Andersen, Le Maire, Kragh-Hansen, Champeil and Moller1983). The findings with detergents demonstrate the probable existence of non-annular binding sites on the Ca2+-ATPases that functions as a target for amphipathic compounds and which could be important in the regulation of rate controlling steps in the transport cycle.
5. Energetic aspects and pump mechanism
5.1 Thermodynamic cycle
In the previous sections we considered the structural basis of the various partial reactions of the Ca2+-ATPase and their regulation and now turn on to finally discuss in some detail the energetic aspects of coupling ATPase activity with Ca2+ pumping and Ca2+ accumulation. This is a subject which has previously been addressed by a number of authors, among which the following can be mentioned: Tanford (Reference Tanford1981), Hasselbach & Oetliker (Reference Hasselbach and Oetliker1983) and Pickart & Jencks (Reference Pickart and Jencks1984). In addition, a trenchant review has been given by Tanford (Reference Tanford1984) on the perspectives and limitations of thermodynamic analysis in the study of the energetics of membrane transport. We present here an updated account on the background of recent structural and other relevant data. As the starting point, we use the data reported by Pickart & Jencks (Reference Pickart and Jencks1984) which are unique in the sense that they provide a consistent data set of equilibrium constants for the different partial reactions under conditions which bear resemblance to the physiological situation (pH ~7, Mg2+ ~5 mM and ~100 mM K+). Figure 18 shows an energy diagram to illustrate changes in Gibbs free energy associated with the individual steps of the transport cycle as calculated from these and other estimates of the equilibrium constants of the partial reactions. In accordance with Fig. 1, we consider that all the intermediates have bound nucleotide, and we use E2:ATP, rather than Ca2E1 as the starting point of the cycle, with the implicit assumption that bound nucleotide only affects the kinetics, not the equilibrium constants for the partial reactions. The experimental evidence for this assumption exists for the E2(:ATP)→Ca2E1(:ATP) binding transition (Lacapere & Guillain, Reference Lacapere and Guillain1993) and for the ATP phosphorylation processes which are found to lead to the same equilibrium accumulation of Ca2+ across the membrane over a wide range of ATP concentrations (Gerdes & Møller, Reference Gerdes and Møller1983). The calculations mainly are based on equilibrium constants obtained at a temperature of 25°C, for which measurements are generally available, and it is assumed that they would not differ much from those which apply at a body temperature of 37°C.
Gibbs energy diagram to show the changes in free energy estimated for the individual steps of the Ca2+-ATPase transport cycle with nucleotide bound intermediates shown in Fig. 1. For further explanation, see text.

We first estimate the changes in Gibbs free energy for Ca2+ associated with the E2:ATP→Ca2E1:ATP transition. Adopting the K eq value for the corresponding E2→Ca2E1 binding transition at pH 7 given by Pickart & Jencks (Reference Pickart and Jencks1984) (K eq=1·6×1011 M−2), and confirmed by us in the absence and presence of modulatory bound nucleotide (Jensen et al. Reference Jensen, Sorensen, Olesen, Moller and Nissen2006; Møller et al. Reference Møller, Lenoir, Marchand, Montigny, Le Maire, Toyoshima, Juul and Champeil2002) a value of −63 kJ/mol is obtained by the use of the Gibbs relationship (ΔG 0′=−RT ln K eq) for the change in the chemical potential of Ca2+ associated with this transition. According to Pickart and Jencks the following step, the phosphorylation reaction, with transfer of γ-phosphate from the Ca2E1:ATP intermediate to Asp 351, results in the formation of an almost isoenergetic [Ca2]E1~P:ADP intermediate (K eq=0·5). Thus, there is only a difference between the energy level of the phosphorylated [Ca2]E1~P:ATP intermediate and that of the Ca2E1:ATP of about 2 kJ/mol, consistent with the very similar structure of the two intermediates (section 2.2).
To proceed with the analysis, we next move backwards through the cycle to calculate from the cytoplasmic E2 intermediate with bound ATP, the energy changes associated with the phosphorylation of ATPase by inorganic phosphate, from the following partial reactions: E2+Pi→E2:P→E2P. In leaky ATPase preparation the protein was found by (Pickart & Jencks, Reference Pickart and Jencks1984) to become phosphorylated by Pi at pH 7 and 5 mM Mg2+ with a −ΔG 0′ of around +9 kJ/mol. Similar results for phosphorylation by Pi have been obtained by other authors under closely similar conditions (Punzengruber et al. Reference Punzengruber, Prager, Kolassa, Winkler and Suko1978; Seekoe et al. Reference Seekoe, Peall and Mcintosh2001). The paper by Punzengruber has the additional interest that it gives detailed data on the effect of a Ca2+ gradient across the SR membrane on the EP formation from Pi. It is well established that while cytosolic Ca2+ prohibits phosphorylation by Pi, the opposite effect is exerted by a high intraluminal concentration of Ca2+ (de Meis, Reference De Meis and Bittar1981) presumably as the result of the formation of a Ca2+ bound phosphorylated intermediate. The experiments of Punzengruber et al. were performed after a passive equilibrium loading of intact SR vesicles with 20 mM Ca2+, followed by transfer to an EGTA containing medium with the same composition as used for the measurement of E2P in leaky preparations. From the increased phosphorylation obtained in the presence of the Ca2+ gradient, an equilibrium constant of approximately 10–15 for the E2P→[Ca2]E2P transition can be obtained at pH 7 and 5 mM Mg2+. This corresponds to a −ΔG 0′ change of 6–9 kJ/mole, which in the energy diagram has been added to that of E2P, taking 20 mM free Ca2+ as a fair estimate of the equilibrium concentration of free Ca2+ present inside the vesicles during the ATP-supported uptake of Ca2+ at pH 7 and 5 mM Mg2+. Consonant with the reaction cycle shown in Fig. 1, we propose that the transition represents a reversal of reaction 4 that results in the formation of an occluded [Ca2]E2P intermediate with properties as described by (Daiho et al. Reference Daiho, Yamasaki, Danko and Suzuki2007) for an A-M1 elongation mutant where Ca2+ is bound in an occluded state on the inner side of the membrane in lieu of protons. This intermediate would play a central role, both by being able via reaction 4 to open towards the lumen to release the bound Ca2+ and by reversal of reaction 3 to form the ADP sensitive [Ca2]E1–P intermediate in the presence of a luminal Ca2+ gradient. Interestingly, for Na+, K+-ATPase there is also kinetic evidence for a ‘third’ phosphorylated intermediate ([Na3]E2P] that is subject to both ADP-sensitive and K+ sensitive dephosphorylation (Nørby et al. Reference Nørby, Klodos and Christiansen1983; Yoda & Yoda, Reference Yoda and Yoda1987).
To complete the thermodynamic diagram, we finally need to provide an estimate of −ΔG 0′ for the E2→E1 transition, with bound ATP. It is difficult to obtain an unambiguous value for the transition, because it is inextricably linked to subsequent or simultaneously occurring reactions with Ca2+ to form the Ca2E1 intermediate, e.g. by the following scheme E2↔E1+Ca↔CaE1+Ca↔Ca2E. Using NBD ((4-nitro-2-oxa-1,3-diazole) covalently attached to Ca2+-ATPase as a suitable probe to specifically monitor E2/E1 conformations by Wakabayashi & Shigekawa (Reference Wakabayashi and Shigekawa1990), in the absence of modulatory nucleotide, arrived at a low (0·3 s−1) rate-limiting value for the E2→E1 transition at pH 6·5 and 11°C, and a much higher value (20 s−1) for the reverse reaction. From these kinetic values, we obtain a value of K eq of 0·016 for the E2⇔E1 transition, leading to −ΔG 0′ of 8 kJ/mole, a value which in Fig. 18 has been used to give an indication of the work needed to implement the protein structural changes related to the E2→E1 isomerization reaction. However, we note that with respect to the reactions in the presence of modulatory nucleotide there was in these experiments some unresolved problems: although ATP according to the kinetic analysis (as expected) increased the E2→ E1 transition rate, there was at the same time a considerable reduction in the rate constant of the reverse reaction, leading to an appreciable increase in the E1/E2 equilibrium ratio, compared to that obtained in the absence of nucleotide. This does not seem to be in harmony with both equilibrium binding data and the results from another kinetic study which suggests that on- and off-rates of Ca2+-binding are accelerated to the same extent by the presence of modulatory-bound ATP (Lacapere & Guillain, Reference Lacapere and Guillain1993). Therefore, a clear segregation between conformational change and Ca2+-binding implied by the above scheme may not be possible. However, the data serve to illustrate that the energetic cost of the conformational change to bring the transmembrane helices in correct position for the coordination of Ca2+ is much smaller than the gain in energy, resulting from the coordination of the two-bound Ca2+.
5.2 The translocation mechanism
Having completed the thermodynamic diagram, we are now in a position to evaluate the conclusions to be drawn from it in terms of the energetic coupling between the chemical energy liberated by the hydrolysis of ATP and the transport of Ca2+. We first note that the transfer of 2 moles of Ca2+ across the membrane as estimated from the difference in chemical potential between [Ca2]E1~P:ATP and [Hn]E2:ATP is around 50 kJ/mole, an energy requirement that must be paid by the chemical energy imparted on the ATPase by phosphorylation with ATP. This corresponds fairly well to the chemical energy that can be derived from the hydrolysis of ATP to ADP that would indicate an ability of the SERCA 1a to accumulate Ca2+ inside the sarcoplasmic reticulum with an efficiency of close to 100%, corresponding to a Ca2+ concentration about 25 000 times higher than that in the cytosol (uncorrected for calcium-binding proteins like calsequestrin and the probable presence of a small, but opposed membrane potential). This is a high value, but not inconsistent with what has previously been estimated from Ca2+ uptake in isolated SR vesicles (Hasselbach & Oetliker, Reference Hasselbach and Oetliker1983; Tanford, Reference Tanford1981). However, admittedly a number of assumptions have gone into the calculations, and in agreement with evidence for heat development accompanying the Ca2+ transport process (Barata & de Meis, Reference Barata and De Meis2002; de Meis et al. Reference De Meis, Arruda and Carvalho2005), it is only fair to conclude that the pump transports Ca2+ with a high, but probably not with 100% efficiency. How can this efficiency be accounted for in mechanistic terms? According to the thermodynamic diagram there is only a slight change in energy associated with phosphorylation of ATPase by ATP which means that, as a result of the coordination with selected amino acid residues in the cytosolic domains ATP forms with Asp 351 an unstable aspartylphosphate of similar high energy as that of the β, γ phosphate bond in ATP. This unstable intermediate, protected against hydrolysis inside the phosphorylation site, can then be considered to cause a reversal of the changes imposed by the preceding binding of Ca2+ with the result that the ATPase is pushed back to an E2 state with Ca2+ still occluded from which the cation is released by exposure towards the luminal space. Mechanistically, the large number of ATPase structures now available provides a fairly detailed picture of what happens during these transitions: during the first stages, the phosphorylated intermediate by deeper insertion of the M3/M4 helices and other changes in the disposition of the transmembrane helices press the configuration of the Ca2+-coordinating residues back towards those pertaining to the E2 state. The E2 state favors interaction with protons (or hydronium ions), but since Ca2+ in the Ca2E1–P state is already present in an occluded state inside the membrane, [Ca2]E2P with a similar structure as [Hn]E2P will be formed. In this structure (the details of which are unknown at present), the occluded Ca2+ ions are deeper inserted in the membrane than in the E1 state so that they can be exposed towards the luminal space by the subsequent formation of a broad aqueous luminal funnel. The opening of the luminal membrane is the consequence of concomitantly occurring changes in the interactions between the cytosolic domains as a result of which the A-domain is brought close to the phosphorylation site and tensions are exerted on the N-terminal transmembrane segments to open the luminal channel (Olesen et al. Reference Olesen, Picard, Winther, Gyrup, Morth, Oxvig, Møller and Nissen2007). The charge imbalance caused by the release of bound Ca2+ is compensated for by the binding of protons, the closed membrane structure is reformed, and the enzyme is dephosphorylated by interaction with the TGES loop of the A domain.
This in short recapitulates essential events of the Ca2+ translocation process as described in detail in the previous sections. These truly have the properties expected for a pump mechanism, that can be analogized to that of hydrodynamic pumps like the heart where the atriae by a valve system supply blood into an occluded chamber (the ventricle) from which it is later expelled by mechanical force into the arterial system through another valve system. While alternating access is a common feature of all transporters, there probably are variations as to how this is achieved. In energy-requiring pumps like the ABC transporters substrates seem to be pushed through the membrane by peristaltic mechanisms such as subunit twisting (Dawson & Locher, Reference Dawson and Locher2006) and rigid body rotations (Khare et al. Reference Khare, Oldham, Orelle, Davidson and Chen2009), whereas rotary movements seem to govern proton flow through the γ-subunit of FoF1-ATPase (Junge et al. Reference Junge, Sielaff and Engelbrecht2009). In contrast to this, the active transport of Ca2+ by SERCA 1a according to our model (Olesen et al. Reference Olesen, Picard, Winther, Gyrup, Morth, Oxvig, Møller and Nissen2007) involves the release of Ca2+ to the SR lumen by a large-scale opening of the luminal part of the membrane domain.
5.3 Future directions
We have now come to an end with our review about the structure and function of the sarcoplasmic reticulum Ca2+-ATPase as it stands anno 2010. Astounding progress has been made during the past decade in procuring detailed X-ray structures of Ca2+-ATPase corresponding to different functional states. These provide an almost complete structural description of the transport cycle which has led to important insights and also confirmed many previous thoughts on the way active transport of Ca2+ is coupled to ATP hydrolysis. Nevertheless, there is still much work to be done to complete the picture. Many of the X-ray structures obtained have been stabilized by artificial substrates such as metalfluorides and by specific inhibitors. To validate the structures as truthful representatives of the physiological intermediates it will be useful, as an alternative, to examine Ca2+-ATPase mutants stabilized in similar states with physiological substrates. The combined approach of structural and mutational studies will also continue to be fruitfull in the investigation of the partial reactions. With regard to the structural studies, we think that in the future it would be important to change the outlook from a descriptional level towards a more rational and fundamental understanding of the forces by which chemical energy is converted into conformational changes and active transport. To watch, in animated versions, the intricate movements that the various parts of the protein make during transport is like watching the operation of a complicated machine, without having the requisite knowledge of how it is working. For Ca2+-ATPase, the presence of two centers, one for ATP hydrolysis and the other for Ca2+ binding that are separated by an intervening stalk region, can be rationalized as a design that permits the cytosolic domains to change their interactions as the basis for the existence of the protein in two different E1 and E2 conformational states. But questions still abound. What, for example, accounts for the disruption of the intimate interactions between the P- and A-domain that accompany the relatively modest changes in the intramembranous domain following binding of Ca2+ during the E2→E1 transition? And what are the driving forces behind the processes, which after phosphorylation of the ATPase by ATP lead to the luminal opening with release of Ca2+ to the luminal side? These events are critically dependent on transmission of energy through the central core and adjoining A–M linkers, and they are triggered by so far unknown effects of phosphorylation in the P-domain. A solution to these questions is difficult. In addition to conformational changes, other kinds of energy transfer, e.g. via electrostatic- and dipole-effects may also be involved as suggested by Scarborough (Scarborough, Reference Scarborough2002). Energy transfer questions will probably have to be studied by new experimental approaches such as NMR with suitable probes in combination with theoretical analysis, to enable an understanding of the folding patterns during the reaction cycle, as revealed by the repository of known X-ray structures.
Other incompletely solved questions relate to the way Ca2+ ions and protons enter and leave the transmembrane domain. This issue is often discussed in terms of gates that in contrast to channel proteins open and close in a concerted way to regulate the direction of the transmembrane flux (see e.g. (Accardi & Miller, Reference Accardi and Miller2004; Gadsby, Reference Gadsby2009; Takeuchi et al. Reference Takeuchi, Reyes, Artigas and Gadsby2008)). For Ca2+-ATPase flipping of Glu 309 between an inner and outer position at an N-terminal entrance has been considered to act as a gate for the cytosolic entrance of Ca2+ during the E2 to E1 transition (Toyoshima & Nomura, Reference Toyoshima and Nomura2002), but available data increasingly point to the existence of a C-terminal entrance as well. Whether this entrance is involved in cytosolar Ca2+/H+ exchange (Section 3.3) or possibly even binding of a Ca2+ ion (Menguy et al. Reference Menguy, Corre, Bouneau, Deschamps, Moller, Champeil, Le Maire and Falson1998; Peinelt & Apell, Reference Peinelt and Apell2005) remains to be established. The release of Ca2+ from the [Ca2]E2P state to the lumen, according to our model (Olesen et al. Reference Olesen, Picard, Winther, Gyrup, Morth, Oxvig, Møller and Nissen2007) involves rather large conformational changes to open the luminal part of the transmembrane domain, i.e. it is a more involved process than can be described in terms of gating by one or a few amino acid residues. The driving forces behind such a luminal opening mechanism also need to be studied in greater detail.
The present review has focused on the mechanism by which the sarcoplasmic reticulum Ca2+-ATPase, as a membrane bound monomeric protein, singlehandedly transports Ca2+ and regulates Ca2+ accumulation, only assisted in this regard by a few peptides (phospholamban, sarcolipin). In future experiments, it will become important to broaden the scope to consider the mechanisms by which SERCA, together with Ca2+ channel proteins in a cellular context, regulate the Ca2+ metabolism in other tissues than the skeletal muscle. Heterologous expression systems offer the most obvious approach to expand the structural investigation to other isoforms of SERCA than 1a, and to study, if possible by cocrystallization, how they interact with Ca2+-binding proteins and other cellular components. Finally, the role of SERCA as a target for pharmacological inhibition merits attention, as has been demonstrated with the aid of analogs of thapsigargin with longchain side chains that specifically combine with SERCA (Søhoel et al. Reference Søhoel, Jensen, Moller, Nissen, Denmeade, Isaacs, Olsen and Christensen2006) and after their uptake kill prostate cancer cells by Ca2+-dependent apoptosis (Denmeade & Isaacs, Reference Denmeade and Isaacs2005; Denmeade et al. Reference Denmeade, Jakobsen, Janssen, Khan, Garrett, Lilja, Christensen and Isaacs2003).
6. Acknowledgements
We are grateful to Marc le Maire, Philippe Champeil, Jens Peter Andersen and Thomas Lykke-Møller Sørensen for valuable discussions over the last decade. Furthermore, we would like to extend our gratitude to Uwe Muller at the EMBL-DESY synchrotron for the initial beamtime and later on the MX-group at the European Synchrotron Radiation Facility (ESRF).